sobie : proceedings of annual meetings 2014 · 1 sobie : proceedings of annual meetings 2014 ......
TRANSCRIPT

SOBIE 2014
1
SOBIE : PROCEEDINGS OF ANNUAL MEETINGS 2014 Compiled and Edited by:
Dr. Vivek Bhargava
Alcorn State University
Editorial Assistant:
Akshay Swaraj
Alcorn State University
SOBIE 2014
2
Proceedings of the Society of Business, Industry and
Economics (SOBIE) Annual Meetings
April 14 – 17, 2015
Destin, Florida
PAPERS
How Institutional Investors Influence CEO Succession and Compensation…………………….. 4
Container Ship Routing: Panama Canal vs. U.S. Land Bridge…………………………………..10
An Exploratory Investigation of Explanations for the Relative Effectiveness of Employee
Recruitment Methods…………………………………………………………………………….17
A Study of Small Business Information Security in Rural America…………………………....28
Evaluating Results of a Small Business Security Survey………………………………………..34
Improved Writing Skills: The ‘NEW NORMAL’ for Accounting Students…………………….45
The Impact of Work-Life Balance on Entrepreneurial Sustainability…………………………...67
Improving Shewhart Control Chart Performance Using Two-Stage Sampling………………...109
Occupational Trends in Mass Communication in the Southern U.S…………………… 117
Probability Distributions: A Comparison for Risk Management Purposes…………………….139
Optimal Tariff and Environmental Tax under Mixed Oligopoly……………………………….152
The Effect of Problem-Based, Experiential Learning on Undergraduate Business Students…..159
Exploring the Mechanisms and Processes of Authentic Leaders: A Multi-level Qualitative
Examination of Leaders and Followers………………………………………………………...167
Decision Support Systems……………………………………………………………………...218
Service Economics – A Brief Look at a New Subject………………………………………….225
ABET Accreditation of IS and IT Programs In 2013…………………………………………..241
SOBIE 2014
3
In-Memory Databases & Complex Event Processing: The Rise of Real-Time Computing with
Predictive Analytics…………………………………………………………………………….250
Does a Pitchers’ Height and Weight Impact Performance: Evidence from
Recent Major League Baseball Data…………………………………………………………....260
Using the Cloud to Teach ERP………………………………………………………………....277
Factors Affecting Availablity Of Comprehensive Care For The Elderly within A State……..288
The Influence of Cultural Intelligence Intercultural Business Negotiation…………………....294
Rankings, Spreads, and Winning BCS College Football Games……………………………....332
Fraud and the Bankrupting of the Social Security Disability Trust Fund……………………..337
The CFO’S Role in the North American Division……………………………………………..352
Study Abroad: Who goes, who stays and why ………………………………………………..364
ABSTRACTS
An Interview-Based Approach to Assess Readiness for IFRS…………………………………380
A Gold Price Anomaly………………………………………………………………………….381
Corporate Lobbying – The Tradeoff Between Payback, Accountability/Responsibility and
Democracy ……………………………………………………………………………………..382
Experiential Learning in a Liberal Arts Business Program…………………………………….383
Comparing the Tax Effects of the Indirect Foreign Tax Credit and the Dividends Received
Deduction……………………………………………………………………………………….385
Student Satisfaction, Commitment, and perceptions of learning in online, hybrid vs. web-
enhanced course delivery: a measurement invariance model…………………………………..386
Improving Student Financial Behaviors using Financial Literacy Training and Coaching…….387
Strategic Perspectives on Social Media Driven Entrepreneurship……………………………..388
SOBIE 2014
4
How Institutional Investors Influence CEO Succession and
Compensation
Kevin Banning
Auburn University Montgomery
Abstract
There is ample evidence of companies dismissing their chief executive officers (CEOs) when
financial performance falters. The link to post-succession compensation for CEOs is less well
understood. This study examines how CEO succession and compensation differ as function of
external ownership. In a sample of 140 publicly-traded firms, we found that compensation systems
for new CEOs differed as a function of institutional ownership, with total executive compensation
higher and compensation risk lower in firms with lower levels of institutional ownership.
Introduction
Previous research has identified several causes of CEO turnover, such as mergers and acquisitions (Walsh,
1988), but poor firm financial performance is the most common reason (Furtado & Karan, 1990). The
consequences of CEO succession, although less conclusive, are also generally well researched. CEO
succession is associated with shifts in corporate strategy (Westphal & Fredrickson, 2001) and company
financial performance (Ballinger & Marcel, 2010; He, Sommer, & Xie, 2011). There is evidence also that
succession shifts the CEO’s compensation structure to favor more incentive-pay (Blackwell, Dudney, &
Farrell, 2007). However, other authors have found the reverse (Banning, 2013) or no differences (Karaevli,
2007), and these inconsistent results have thus far not been adequately reconciled. The presence of
institutional owners, who might serve as effective monitors of new CEOs, could explain the mixed empirical
results concerning the compensation consequences of executive succession.
New CEOs who fail to deliver strong or improved financial performance are vulnerable throughout
their first few years on the job (Ocasio, 1994), and it would be rational for them to maximize their base and
contingent compensation, regardless of the circumstances of the succession. Because executives who serve
on the firm’s own board are known to contest the new CEO, new chief executives also have strong incentives
to maximize compensation if post-succession financial performance is unimproved or the CEO is dismissed
for any other reason. Consequently a new CEO has both the incentive, because of contests among board
members, and the opportunity, thanks to a brief “honeymoon period” associated with succession (Shen,
2003), to arrange an attractive compensation contract during the transition.
There is some utility in exploring how the compensation structure differs after succession as a way to
understand how the new CEO could strengthen his or her position. For example, when there are some equity

SOBIE 2014
5
holders, such as institutional owners who control large enough blocks of stock to influence management, it
seems likely that the compensation contract will be more favorable to the shareholders. The greater oversight
by institutional owners could result in lower levels of CEO control as might be seen in more effective
compensation contracting and incentive alignment and potentially stronger firm performance.
Agency Theory in Organizations
When viewed through an agency framework, shareholders of public companies contract with managers to act
on their behalf, and thus delegate to managers the ability to utilize company resources. Because both the
shareholders and managers are thought to be rational, the owners must devise ways to effectively supervise
the actions of managers. This supervision typically occurs through the contract which specifies how
managers will be monitored or share risks with owners, and effectively aligning owners’ incentives for
success with managers pay, with tools like performance-contingent compensation. When well constructed
and executed, monitoring and incentive alignment support strategic choices which benefit both shareholders
and managers.
One solution to the agency problem in organizations is monitoring by individual owners. Individual
owners often own too small a position or are otherwise unable or unwilling to carefully monitor managers of
companies in which they have ownership (Milgrom & Roberts, 1992). Some researchers (e.g., Schwab &
Thomas, 1998) have observed that institutional owners pay more attention to managerial decisions in the
firm because the decisions and consequent company performance are critical to their financial holdings.
Consequently when those institutional owners act in ways likely to be beneficial to shareholders, markets
react positively (Hadani, Goranova, & Kahn, 2011).
While it is clear that there are positive, stock-market effects associated with activism by
institutional investors, this activism has produced less consistently positive results with respect to a firm’s
financial performance, but the finding that performance improvements are associated with investor
activism is more common than not (Hadani et al., 2011). With the generally positive performance effects
associated with institutional ownership, there may be other consequences of these owners on outcomes
favored by shareholders, and one such outcome is CEO compensation.
SOBIE 2014
6
Creating Incentive Alignment
Agency theory suggests that a new CEO will attempt to negotiate both more total pay and a smaller
performance-contingent component of pay than the predecessor CEO, and these conditions are more likely to
be granted in the absence of institutional owners. Previous research suggests CEO pay for incumbent CEOs
will be lower overall and favor performance-contingent forms of pay when the proportion of institutional
investors is higher (David, Kochhar & Levitas, 1998). Similarly previous research suggests that new CEOs
receive compensation packages favoring incentive pay instead of guaranteed forms of compensation
(Blackwell et al., 2007), but whether the presence of institutional ownership affects the compensation
structure has yet to be tested with the compensation of new CEOs.
There are impediments to proper management control in modern corporations, as well as reduced
incentives for monitoring by singular, individual owners, and consequently a new CEO could negotiate a
compensation contract with more total pay and less risk. The greater levels of total compensation and their
smaller proportions of performance-contingent pay are negotiated with the board upon succession. This kind
of contract, highly favorable to the incoming CEO, is possible because of the relative weakness of managerial
oversight in firms with no strong institutional investors. Any weakness in managerial oversight might be
exploited at the time of succession, and the new CEO may achieve an attractive compensation package.
H1: The level of post-succession CEO compensation will be greater in firms with lower institutional
holdings.
H2: The level of post-succession CEO compensation risk will be smaller in firms with lower
institutional holdings.
Method
The COMPUSTAT database provided the financial data and succession events were identified in the Wall
Street Journal. Initially there were 159 publicly-traded firms experiencing a single succession event during
the event period from 2006 to 2010. At five years, the succession-event window was short enough to attribute
effects to the new CEO and not to exogenous events, yet long enough to capture enough succession events
for statistical purposes. No firms experiencing multiple succession events during the five years, or firms with
a CEO succession in the four years immediately preceding the window, or in the year following the window
were included. Including companies with multiple successions, with the associated negations of the
compensation contracts, would have unnecessarily muddled the analysis and hypothesis tests. Ultimately
there were 140 firms across the five years with fully usable data. Using a fixed-effects specification, where a
dummy variable represents the year of the succession event to test the hypotheses, permitted robust testing
but was simple to operationalize.

SOBIE 2014
7
Dependent Variables
The first dependant variable, total CEO compensation, was determined from proxy statements for the year
following appointment. Total CEO compensation was comprised of all forms of pay reported in the proxy
statement, including the Securities and Exchange Commission (SEC) estimate of the present value of
stock options received (David et al., 1998). Despite the difficulty in estimating the present value of stock
options, the nearly ubiquitous use of stock options as a large part of the total CEO compensation package
justifies their inclusion. The second dependent variable is a measure of compensation risk that is
computed as the proportion of total pay that is performance contingent (Westphal & Zajac, 1997).
Both dependent variables are adjusted for mean values of their corresponding four-digit SIC
industry for the first full year following the succession event. The is the observed value minus the
industry mean. In a conceptual sense, correcting the observed-value of each firm’s total compensation and
compensation risk with the mean of the relevant industry creates a value of each dependent variable that
controls for any industry-effect. Thus in the case of Total CEO Compensation, positive differences
indicate that the CEO for that firm received more than the industry average total pay, and negative
differences indicate that the firm’s CEO received total pay less than the relevant industry average. The
computation for compensation risk and for firm performance works in the same way. This method permits
controlling for industry effects in the regression without the corresponding loss of degrees of freedom
(Hoskisson, Johnson, & Moesel, 1994).
Independent and Control Variables
This research addresses the question of whether a sufficiently powerful institutional owner affects the
negotiated agency contract for a new CEO. The agency contract, including the compensation component,
would be expected to differ in firms where the CEO exercised more control relative to the board of
directors, which represents owners. Researchers seem to agree that effective oversight of managers is
associated with several important consequences, but there is less consensus as to how to operationalize
the influence of institutional owners. This paper uses an institutional ownership measure after Hadani et
al. (2011), which takes the percentage of outstanding shares held by the single largest institutional owner.
The measure has gained currency based on earlier findings suggesting that only the largest institutional
owner would likely possess any information advantage (Schnatterly, Shaw, & Jennings, 2008).
The influence exercised by institutional owners is only one possible reason that compensation
contracts for CEOs might differ among firms. There are other firm-specific variables that might affect the
contract, such as the size of the company, whether the new CEO came from within the firm, and the
conditions under which the previous CEO exited the position. These five influences are treated as control
variables. Firm size is operationalized as the natural log of annual revenues reported for the first full year
of the successor CEO’s tenure. The second of the five control variables, new CEO’s origin, was
determined by the last employer prior to becoming the CEO at the focal firm (Karaevli, 2007). If that

SOBIE 2014
8
position was held anywhere other than the focal firm or its subsidiaries, successor origin was one. If the
successor CEO was promoted from within the firm or any of its subsidiaries, successor origin was zero.
Among the last three control variables is disposition of the predecessor CEO. In assessing the
predecessor’s disposition in text sources, such as the company proxy statement and the Wall Street
Journal, if these were clear the predecessor had voluntarily retired, died, or had voluntarily taken another
position, or if it was unclear despite multiple sources, this variable was coded as zero. Only if it was clear
that the predecessor was forced to resign, retire, or was dismissed, this variable was coded as one. The
fourth control variable was company performance preceding the succession event and was measured as
the firm minus industry average of the company’s return on investment in the last full year preceding the
succession event. The last control consisted of a four dummy variables for years two through five of the
five-year pool. The data cover a five-year span so the specification used the control variable to capture
any unique variance for a particular year in the regression specification.
Analysis
The hypotheses were tested in three pooled regression analyses. The first specification regressed total
CEO compensation on the independent and control variables, while the second specification regressed
compensation risk, which is the ratio of performance-contingent pay to total pay earned in the first full
year after succession, on the same set of independent and control variables. The third specification
regressed post-succession firm performance on the independent and control variables.
Results
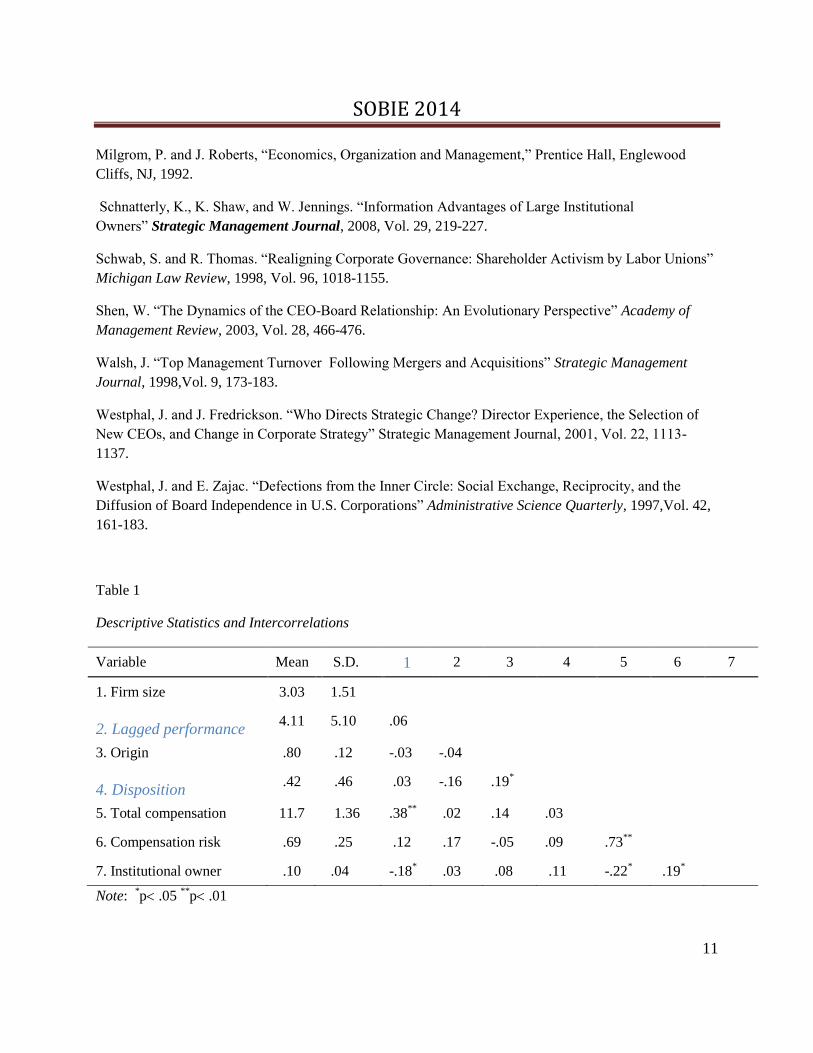
Descriptive statistics and intercorrelations for the study variables appear in Table 1.
The regression results for total CEO compensation appear in Table 2. Only standardized regression
coefficients are reported in the tables for the sake of comparability. Hypothesis 1, which predicted that the
level of total CEO pay would be higher in firms with lower levels of institutional ownership, was
supported. Higher levels of CEO compensation were also associated with pre-succession firm
performance. The regression results for compensation risk also appear in Table 2. Hypothesis 2, which
predicted that the level of CEO compensation risk would be lower in firms with lower levels of
institutional ownership, was supported. When the predecessor CEO was forced out, pay risk was also
higher.
Discussion
This research suggests that the influence of institutional owners matters to the nature and consequences of
the compensation contract that is negotiated with new CEOs. It appears that new CEOs who face
relatively weaker institutional-investor oversight are able to negotiate more favorable compensation
contracts, in terms of both size and risk. Though there are potentially many circumstance which would
permit a new CEO to strike a more favorable compensation contract, a lack of institutional ownership
appears to matter a great deal. It is important for new CEOs to negotiate an attractive compensation

SOBIE 2014
9
package, because in their early years as chief executive they are subject to competition from colleagues
on the board of directors (Ocasio, 1994).
Other than the influence of an institutional owner and the predecessor’s involuntary dismissal,
compensation contracts did not seem to vary based on the circumstances surrounding the succession
events. In terms of company financial performance, only influence of an institutional owner and successor
CEOs from outside the firm were significant influences.
The Effects of Institutional Ownership
The ways in which new CEOs negotiate their compensation contracts appears to differ based on the
firm’s institutional ownership. CEOs in firms with lower levels of institutional-owner influence were able
to achieve less compensation risk than new CEOs in firms with higher levels of influence exercised by
institutional owners. These differences in compensation and risk-sharing may account in part for the
finding that firms lacking significant institutional ownership do not perform as well as those featuring
more institutional ownership, a result consistent with other work that shows that greater institutional
ownership is associated with better financial performance (Hadani et al., 2011).
The compensation contract, and in particular the arrangements with respect to how contingent
pay is earned, is the primary means shareholders have to align managers’ interests with their own. CEOs
in firms with less significant institutional ownership appear to receive higher pay and less compensation
risk in their negotiated contracts, while successor CEOs in firms with significant institutional ownership
experience higher compensation risk. These results suggest managers in firms with low levels of
institutional have more influence over the structure and magnitude of their pay.
Though no direct effects were tested, it may be that the negotiated agency contract impacts the
firm’s financial performance. In firms with less institutional ownership, where the new CEO may have
more influence relative to the board of directors, financial performance is lower than in firms with
significant institutional ownership. The overall results suggest that the relatively greater influence of the
new CEO under low levels of institutional ownership, as reflected in the terms of the compensation
contract negotiated at succession, is one possible reason for the positive association of institutional
ownership and financial performance.
Negotiated Compensation Terms
Though institutional owners appear to influence the compensation terms of the agency-contract negotiated
with the board of and the incoming CEO, such that when institutional ownership is small the successor
CEO captures a more favorable compensation contract, at least one other factor during succession seems
to impact the compensation-package negotiation as well. The disposition of the previous CEO seems to
have some effect on the compensation arrangements. New CEOs who followed one who was dismissed
received proportionally more pay which was performance contingent, shifting more of the firm's future
performance risk to the new CEO. Compensation terms shifting pay risk to the new CEO represent a

SOBIE 2014
10
reasonable response by firms that have dismissed their previous chief executive, because increased pay-
risk signals the board’s demand for better future performance.
Ultimately, the compensation contract terms seem to depend on the interplay between an
incoming CEO, institutional owners, and the board of directors. The directors appear to be able
to create terms more favorable for shareholders when institutional owners have more influence
on the firm. When managers exercise more control, however, the evidence suggests that
shareholder interests may be traded for managerial compensation. Firm performance following
succession may thus depend more on who controls the contracting process than on characteristics
of the incoming CEO.
References Ballinger, G. and J. Marcel. “The use of an Interim CEO During Succession Episodes and Firm
Performance” Strategic Management Journal , 2010, Vol. 31, 262-283.
Banning, K. “Shareholder Wealth Effects of CEO Turnover” American Journal of Industrial and
Business Management, 2013, Vol. 3, 583-588.
Blackwell, D., D. Dudney and K. Farrell. “Changes In CEO Compensation Structure and the Impact on
Firm Performance Following CEO Turnover” Review of Quantitative Finance & Accounting, 2007, Vol.
29, 315-338.
David, P., R. Kochhar and E. Levitas. “The Effect of Institutional Investors on the Level and Mix of CEO
Compensation” Academy Of Management Journal, 1998,Vol. 41, 200-208.
Furtado, P. and V. Karan. “Causes, Consequences, and Shareholder Wealth Effects of Management
Turnover: A Review of the Empirical Evidence” Financial Management, 1990, Vol. 19, 60-75.
Hadani, M, M. Goranova and R. Kahn. “Institutional Investors, Shareholder Activism, And Earnings
Management” Journal Of Business Research, 2011, Vol. 64,1352-1360.
He, E., D. Sommer and X. Xie. “The Impact of CEO Turnover on Property-Liability Insurer
Performance” Journal of Risk and Insurance, 2011, Vol. 78, 583-608.
Hoskisson, R., Johnson, R. and D. Moesel. “Corporate Divestiture Intensity
in Restructuring Firms: Effects of Governance, Strategy, and Performance” Academy of Management
Journal, 1994, Vol. 37, 1207-1251.
Ocasio, W. “Political Dynamics and the Circulation of Power: CEO Succession in U.S. Industrial
Corporations” Administrative Science Quarterly, 1994, Vol. 39, 285-312.
Karaevli, A. “Performance Consequences of New CEO ‘Outsiderness’: Moderating Effects of Pre- and
Post-Succession Contexts” Strategic Management Journal, 2007, Vol. 28, 681-706.
SOBIE 2014
11
Milgrom, P. and J. Roberts, “Economics, Organization and Management,” Prentice Hall, Englewood
Cliffs, NJ, 1992.
Schnatterly, K., K. Shaw, and W. Jennings. “Information Advantages of Large Institutional
Owners” Strategic Management Journal, 2008, Vol. 29, 219-227.
Schwab, S. and R. Thomas. “Realigning Corporate Governance: Shareholder Activism by Labor Unions”
Michigan Law Review, 1998, Vol. 96, 1018-1155.
Shen, W. “The Dynamics of the CEO-Board Relationship: An Evolutionary Perspective” Academy of
Management Review, 2003, Vol. 28, 466-476.
Walsh, J. “Top Management Turnover Following Mergers and Acquisitions” Strategic Management
Journal, 1998,Vol. 9, 173-183.
Westphal, J. and J. Fredrickson. “Who Directs Strategic Change? Director Experience, the Selection of
New CEOs, and Change in Corporate Strategy” Strategic Management Journal, 2001, Vol. 22, 1113-
1137.
Westphal, J. and E. Zajac. “Defections from the Inner Circle: Social Exchange, Reciprocity, and the
Diffusion of Board Independence in U.S. Corporations” Administrative Science Quarterly, 1997,Vol. 42,
161-183.
Table 1
Descriptive Statistics and Intercorrelations
Variable Mean S.D. 1 2 3 4 5 6 7
1. Firm size 3.03 1.51
2. Lagged performance 4.11 5.10 .06
3. Origin .80 .12 -.03 -.04
4. Disposition .42 .46 .03 -.16 .19
*
5. Total compensation 11.7 1.36 .38**
.02 .14 .03
6. Compensation risk .69 .25 .12 .17 -.05 .09 .73**
7. Institutional owner .10 .04 -.18* .03 .08 .11 -.22
* .19
*
Note: *p .05
**p .01

SOBIE 2014
9
Table 2
Regression Results
Total compensation Compensation risk
β Β
Firm size .389**
.351 -.131 .047
Lagged performance .162
* .278 .068 .202
Origin -.006 .054 .029 .001
Disposition -.050 .125 .156
* .023
Institutional owner -.194* .069 .207
* .182

SOBIE 2014
10
Container Ship Routing: Panama Canal vs. U.S. Land Bridge
Robert F. Cope III, Southeastern Louisiana University
Rachelle F. Cope, Southeastern Louisiana University
John M. Woosley, Southeastern Louisiana University
Abstract
In our work, we investigate choices for container ship transportation from the eastern Pacific to
the western Atlantic based solely on time. Choices include traveling through the Panama Canal or using
the U.S. as a land bridge (via truck and rail car). A breakeven methodology, given vessel size, is
employed to discriminate between paths. Interested parties of our work might include those investigating
multi-modal integration opportunities, those seeking transportation efficiencies in water, truck and rail,
and students as a case assignment in Transportation and Logistics courses.
Introduction
A new era in container shipping is coming. The Panama Canal Authority is about to complete a
third lane to the water-way that will double its capacity and allow access to the largest cargo-carrying
vessels. However, the impact that the canal will have on global trade patterns remains to be seen. Roughly
65% of the goods sailing through the canal go to or from U.S. ports, and those ports and American rail-
yards that compete with the canal will fight to retain as much business as possible (Lynch, 2009). Cargo
from Asia, for example, can reach U.S. markets either through the canal or by docking at a west coast port
and riding rail lines to inland or east coast destinations.
The issues of container transportation traffic and timely route choice are ones that increase in
complexity, as opportunities for trade expand and supply chain activities evolve internationally. Today’s
container traffic moves mostly from the Far East to the U.S., Europe and other western ports. Two routes
of choice have evolved over time. One is through the Panama Canal, and the other uses the United States
as a land bridge where container ships dock on the west coast, unload, then travel by truck and/or rail car
to the east coast and are loaded onto other container ships headed across the Atlantic.
Time is the variable of most importance in our work, as time is the common denominator to both
distance and cost in this industry. “Estimated Time of Arrival (ETA)” is the cry of many ship captains and

SOBIE 2014
11
others in the industry, making time of arrival, dock time, and time of departure very important parameters
in the shipping industry.
Our work begins with an explanation of how the U.S. is used as a land bridge. We then discuss
how poor port productivity and congestion create dead time for vessels that end up waiting in a queue for
service. We then give careful consideration to the impact of the Jones Act in restricting U.S. maritime
commerce. Next, we discuss how canal expansion in Panama stands ready to alleviate port productivity
and congestion problems by moving cargo to other areas for dispersion. Finally, we move to the
development of our modeling methodology for determining best choice routing – through the Panama
Canal or the U.S. land bridge.
The U.S. Land Bridge and West Coast Port Traffic
European bound cargo from Asia has several options for reaching its destination. One would be to
go west over many treacherous mountain ranges and several seas. Customs stops are required by many
countries along the route, making the trip quite long and segmented. Another route would be to go east
across the Pacific Ocean, cross the U.S. by rail or highway, then cross the Atlantic Ocean to reach
Europe. This path takes the freight through only one country, requiring only one customs checkpoint. It is
obvious that the second option may be longer in miles, but stands to be shorter in time, prompting those in
the global transportation industry to refer to it as a “land bridge” across the U.S. When time is the
important factor, the U.S. “land bridge” is the option many use. However, there is one bottleneck along
the way – the U.S.’s west coast ports.
The Ports of Los Angeles and Long Beach are the first and second busiest container ports in the
U.S, respectively. The Port of Los Angeles is located just north of the Port of Long Beach on the
California coastline. Together, the two ports are known as the San Pedro Bay Ports. These two ports
handle more than 40% of the nation’s total containerized cargo import traffic and 24% of the nation’s
total exports (Port of Long Beach, 2007). Combined, the San Pedro ports moved 1.16 million containers
in January 2012, up from 1.14 million a year earlier (White, 2012).
In turn, the large amount of cargo traffic has led to a rise in congestion at the two bustling ports.
Such deep draft ports experience delays as space for increasing volumes of import and export cargo is
limited by environmental and community concern factors. Congestion also occurs when vessels arrive at
the same time rather than dispersed throughout the week (U.S. Department of Transportation, 2009). The
time lost as a result of this bottleneck can be 3 to 6 days depending on the season (Conway Consulting,
2008). Even when ports can berth and unload ships quickly, the increasing size of container ships is
moving congestion from ports to access roads, rail and highways (U.S. Department of Transportation,

SOBIE 2014
12
2009). Such delays and congestion at the Long Beach and Los Angeles ports have shippers and receivers
looking for more reliable, efficient options for transportation.
The Jones Act
The Merchant Marine Act of 1920, commonly referred to as the Jones Act, is a U.S Federal
statute that regulates maritime commerce in U.S. waters and between U.S. ports (Brackins, 2009). Two
parts of the Jones Act are of specific importance. The first part heavily supports American built, owned,
and staffed ships. This was accomplished by restricting shipping and passenger trade within the U.S. to
American-owned or American-flagged ships, and specifying that at least 75% of a ship's crew must
comprise American citizens. In the second part of the Jones Act, the use of foreign parts and labor in ship
construction and repair was also greatly restricted. This section of the Jones Act was created to produce a
strong, well staffed merchant marine that could be responsible for efficiently serving the U.S. (Smith,
2010).
It is important to realize that at the time the Jones Act was enacted, a strong, resilient merchant
fleet was crucial for a country’s success and commerce. Today, the effects of the Jones Act have been felt
widely in the shipping industry as foreign cargo vessels are not allowed to travel port-to-port in the U.S. –
they must drop off and pick up only. In comparison to other nations that lack such cabotage restrictions,
there has been a noticeable decline in the U.S. shipping fleet, losing out to the competition of other
nations using alternate routes (Brackins, 2009).
The Panama Canal
The Panama Canal opened in 1914 and instantly revolutionized water transportation. For ships steaming
between California and the east coast of the U.S., the canal turned a 15,000 mile journey around Cape
Horn into a relatively swift 6,000 mile jaunt (Lynch, 2009). The current expansion includes dredging the
existing channel to the depths needed for the largest cargo vessels. Table 1 contrasts the lock dimensions
of the original canal lanes and the new lane.
Table 1
Panama Canal Lock Comparisons (Panama Canal Authority, 2006)
Dimensions Current Locks Panamax New Locks New Panamax
Length 320.04 m (1,050 ft) 294.13 m (965 ft) 427 m (1,400 ft) 366 m (1,200 ft)
Width 33.53 m (110 ft) 32.31 m (106 ft) 55 m (180.5 ft) 49 m (160.7 ft)

SOBIE 2014
13
Draft 12.56 m (41.2 ft) 12.04 m (39.5 ft) 18.3 m (60 ft) 15.2 m (49.9 ft)
TEUs 5,000 12,000
The centerpiece of the expansion is the pair of massive new locks at the Pacific and Atlantic canal
entrances. Today, the largest ships that can use the canal are the Panamax class, capable of carrying about
5,000 standard shipping containers. They squeeze through the waterway’s 110-foot-wode locks with just
2 feet to spare on either side (Lynch, 2009). Wider, deeper and longer than the existing portals, the new
locks will handle a class of bigger ships known as New Panamax vessels, the world’s largest cargo
carriers, which can haul more than twice as many containers.
Methodology for Route Choice
The methodology for route choice compares the sum of expected times and deviations from an
import point to an export point on each side of the U.S. land bridge against the sum of expected times and
variances using the Panama Canal. It is straightforward, but based on several assumptions:
1. Cost is not an issue. Any costs that arise will be passed on to the customer.
2. Import and export container ports work around the clock for loading,
unloading, sorting, and preparing for additional container transportation.
3. There is adequate rail and highway infrastructure support, and an ample
supply of trucks and rail cars to ferry containers across the U.S.
4. Containers vessels of similar size are waiting at east coast ports to complete
the journey.
Our expected time functions and three step methodology follows.
Calculation of Expected Travel Time across U.S. Land Bridge (µlb)
µlb = (ti + tr + tt + te) + σlb (Eq. 1)
SOBIE 2014
14
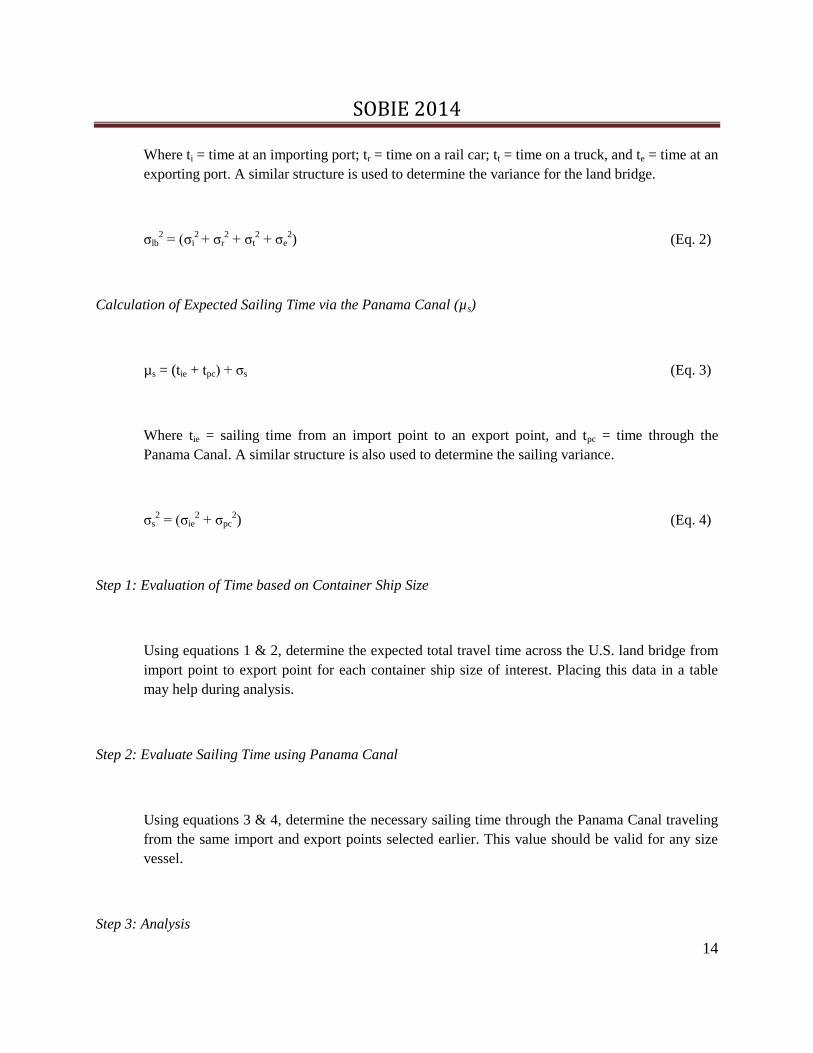
Where ti = time at an importing port; tr = time on a rail car; tt = time on a truck, and te = time at an
exporting port. A similar structure is used to determine the variance for the land bridge.
σlb2 = (σi
2 + σr
2 + σt
2 + σe
2) (Eq. 2)
Calculation of Expected Sailing Time via the Panama Canal (µs)
µs = (tie + tpc) + σs (Eq. 3)
Where tie = sailing time from an import point to an export point, and tpc = time through the
Panama Canal. A similar structure is also used to determine the sailing variance.
σs2 = (σie
2 + σpc
2) (Eq. 4)
Step 1: Evaluation of Time based on Container Ship Size
Using equations 1 & 2, determine the expected total travel time across the U.S. land bridge from
import point to export point for each container ship size of interest. Placing this data in a table
may help during analysis.
Step 2: Evaluate Sailing Time using Panama Canal
Using equations 3 & 4, determine the necessary sailing time through the Panama Canal traveling
from the same import and export points selected earlier. This value should be valid for any size
vessel.
Step 3: Analysis
SOBIE 2014
15
Inspect the container ship-land bridge travel times for a “breakeven” point created by the travel
time through the Panama Canal. Linearly interpret the “breakeven” vessel size. Assign smaller
ships to the U.S. land bridge and larger ships to the Panama Canal route. Total travel time should
be minimized for a given size vessel.
Conclusions and Further Study
After reviewing the Panama Canal’s exciting expansion news, we find that the U.S. transportation
industry is poised for a revolution in container cargo movement in the near future. We studied the choice
between traveling the U.S. land bridge or the Panama Canal using only one west coast and one east coast port
– abiding by Jones Act restrictions. However, other maritime and Canadian opportunities may exist in the
future creating a network of routes from which to choose.
Through the methodology presented here, we have been able to discriminate between route choices
for container vessels based solely on ship size and time. In future research, we plan to explore more of the
economic effects on commerce associated with shifts to and from the land bridge and the canal. The objective
is to transfer a “perfect” shipment from point A to point B as cheaply, quickly and consistently as possible
(Bowersox, et al., 2010). However, in the long run we expect that delivery speed (time) will still be the
variable of interest in the shipping industry.
References
Bowersox, D., D. Closs, and M. Cooper. Supply Chain Logistics Management, 3rd
edition, McGraw-Hill
Irwin: Boston, Massachusetts, 2010.
Brackins, D. “The negative effects of the Jones Act on the economy of Hawaii.” 2009, retrieved July 25,
2010, from http://www.hawaiiliberty chronicles.com/?p=2237.
Conway Consulting. “Cargo Case Study - Port San Antonio.” 2008, retrieved November 22, 2011, from
http://www.portsanantonio.us/StoreImages/collateral/lazarocardenas-pg1-2.pdf.
Lynch, D. “For Panama Canal, a new era of trade is coming.” USA Today, 1A & 6A, August 6, 2009.
SOBIE 2014
16
Panama Canal Authority (Canal De Panama’). Master Plan 2005-2025 Report. 2006, retrieved September
15, 2011, from http://www.pancanal.com/eng/indx.html.
Port of Long Beach. “Ports impact on economy growing.” 2007, retrieved November 10, 2011, from
http://www.polb.com/news/displaynews.asp?NewsID=137.
Smith, S. “What is the Jones Act?” WiseGeek. 2010, retrieved July 13, 2010 from
http://www.wisegeek.com/what-is-the-jones-act.htm.
U.S. Department of Transportation. Freight Management and Operations. 2009, retrieved October 20,
2011 from http://ops.fhwa.dot.gov/freight/freight_analysis/freight_story/congestion.htm.
White, R. “L.A., Long Beach ports complex posts best January since recession.” 2012, retrieved January
30, 2012, from http://www.latimes.com/business/la-fi-ports-20120216,0,2446476.story.

SOBIE 2014
17
An Exploratory Investigation of Explanations for the Relative
Effectiveness of Employee Recruitment Methods
Mel Schnake
Valdosta State University
Abstract
Employee recruitment has become increasingly important to managers in recent years as some
occupations face severe shortages and others experience surpluses. Both types of human
resource gaps place more pressure on recruitment to provide the right numbers of employees
with the required knowledge and skill sets. This increased importance to practioners has led
researchers to pay more attention to it as well (Billsberry, 2007; Breaugh, Macan & Grambow,
2008).
Previous research suggests that informal recruiting methods (e.g., employee referrals, walk ins)
are more effective than more formal recruiting methods. Two explanations have been offered for
the relative effectiveness of recruiting methods. The “realistic information hypothesis” suggests
that employees recruited via the more effective methods may have acquired a greater quantity of
information, more accurate information, and/or more realistic information (Breaugh, 1981;
Zottoli & Wanous, 2000). According to the “individual difference hypothesis” (Saks, 2005),
different recruiting methods may attract different types of applicants (Schwab, 1982). There is
some empirical support for both hypotheses.
Blau (1990) suggested that employees hired via different recruiting methods may be treated
differently after hire. Barber (1998) reported that she could find no empirical tests of this
hypothesis. Research on the post-hire treatment hypothesis is clearly needed. The purpose of
this study is to provide an initial test of the “differential management treatment hypothesis.”
SOBIE 2014
18
Background
Employee recruitment has become increasingly important to managers in recent years as some
occupations face severe shortages and others experience surpluses. Both types of human
resource gaps place more pressure on recruitment to provide the right numbers of employees
with the required knowledge and skill sets. This increased importance to practioners has led
researchers to pay more attention to it as well (Billsberry, 2007; Breaugh, Macan & Grambow,
2008).
Research on employee recruitment has focused on recruiting methods or sources, recruiter
effects and realistic job previews (Rynes, Bretz & Gerhart, 1991; Barber, 1998). These factors
influence different phases of the recruitment process. Barber (1998) has identified three phases
of recruitment: generating applicants, maintaining applicant status, and influencing job choice.
Different recruiting activities influence different phases of recruitment. For example, choice of
recruiting methods (i.e., job fairs, newspaper advertisements) influence the numbers and types of
applicants. Tracking and communicating with applicants influence maintaining applicant status.
Within the generating applicants phase of recruitment, one of the most important decisions is
choice of recruiting method. Research shows that Bureau of National Affairs study (1988) found
that the most commonly used recruitment methods are newspaper advertisements, employee
referrals, direct applications, and recruiting at schools (Bureau of National Affairs study (1988;
Kalleberg, Knoke, Marsden & Spaeth, 1996; Vecchio, 1995). Several studies have found the
relative effectiveness of different recruiting methods to vary across several outcome measures
including turnover, absenteeism, job performance, and work attitudes. Ullman (1966) found that
employees recruited via informal recruitment sources had lower turnover than employees
recruited via formal sources ( newspaper ads, employment agencies). Gannon (1971) found that
rehires, walk ins, and employee referrals had lower turnover than employees recruited via other
methods. Decker and Cornelius (1979) also found employee referrals to be associated with
lower turnover than newspaper ads and employment agencies. Breaugh (1981) found job
performance to be higher for employees hired via advertisements in professional journals and
conventions than for employees hired through college placement and newspaper ads.
SOBIE 2014
19
Absenteeism was higher for employees hired via newspaper ads. Employees hired through
college placement had more negative work attitudes than employees hired via other sources.
Taylor and Schmidt (1983) examined the relative effectiveness of several recruiting methods and
found that rehires had lower turnover and absenteeism than employees recruited via other
methods (referrals, newspaper ads, radio ads, television ads, walk ins, and public employment
agency). Breaugh and Mann (1984), in a survey of social workers, found that direct applicants
(walk ins) had high job performance and lower voluntary turnover than employees recruited via
other sources (newspaper ads and employee referrals). In a study of bank tellers, Blau (1990)
also found walk ins to have higher performance than employees recruited through other sources
(newspaper ads, employee referrals and employment agencies). Williams, Labig and Stone
(1993) found no recruiting method effects on turnover and job performance in a study of nurses.
These studies suggest that informal recruiting methods (e.g., employee referrals, walk ins) are
more effective than more formal recruiting methods. Two explanations have been offered for the
relative effectiveness of recruiting methods. The “realistic information hypothesis” suggests that
employees recruited via the more effective methods may have acquired a greater quantity of
information, more accurate information, and/or more realistic information (Breaugh, 1981;
Zottoli & Wanous, 2000). For example, employee referrals may provide applicants with a more
accurate and realistic picture of the job and the employer. According to the “individual
difference hypothesis” (Saks, 2005), different recruiting methods may attract different types of
applicants (Schwab, 1982). There is some empirical support for both hypotheses. For example,
Kirnan, Farley and Geisinger (1989) sound that employees recruited via informal sources
(employee referrals) were of higher quality than those recruited via formal sources. Williams,
Labig and Stone (1993) concluded that informal recruitment sources reached applicants with
more job experience and education which resulted in higher job performance.
Breaugh and Mann (1984) conducted a competitive test of these two hypotheses. They
examined relationships between recruitment method and performance and turnover. They found
that direct applicants performed better and and had lower turnover than applicants recruited via
other methods (newspaper advertisement, employee referrals). They also measured individual
differences including demographics, applicant quality and perceived easy of movement. They
also measured employees’ perceptions of how realistic their information about the job and
company was at the time of hire. They found that direct applicants reported more realistic
information than applicants recruited via newspaper advertisements or employee referrals. In a
study of bank tellers, Blau (1990) found that direct applicants had higher performance than
applicants recruited via newspaper ads, employment agencies, and employee referrals.

SOBIE 2014
20
Supporting the individual difference hypothesis, he found that direct applicants had higher ability
scores than applicants recruited from other sources. Williams, Labig and Stone (1993) found no
differences in turnover and job performance by recruitment sources (employee referral, previous
rotation/internship, rehires, campus visits, newspaper advertisements and direct applications).
They did, however, find that new hires difference in experience by recruiting source providing
some support for the individual differences hypothesis. They also found that new hires differed
in terms of pre-hire information, providing some support for the realistic information hypothesis.
Werbel and Landau (1996) examined relationships between recruitment sources (newspaper
advertisements, self-initiated contact, corporate recruiters, employee referrals, and college
placement) and turnover and performance. They found that college placement office hires
tended to perform better than employees hired via newspaper advertisements. No other
differences in performance or turnover were detected. Comparing new hires’ job expectations
with opinions of current employees (a test of the realistic information hypothesis) showed that
employee referrals had less realistic expectations than did direct applicants or agency hires.
Griffeth, Hom, Fink, and Cohen (1997) used structural equation modeling to conduct a
competitive test of the two hypotheses. Using a more complete measure of realistic information
(expectations, role clarity and coping skills) they found that recruitment source was related to
both individual differences and realistic information. However, only realism was associated to
post-hire outcomes. They also found that recruitment methods had direct impact on post-hire
outcomes beyond the effects of realism, suggesting that the two hypothesis do not explain all the
variance in post-hire outcomes.
Additional hypotheses which have been suggested but have not received much research attention
include the motivational differences hypothesis and the labor market mobility hypothesis. The
motivational differences hypothesis suggests that different recruiting sources may produce
applicants with differences in motivation to apply. For, example, it is very easy to apply through
an employer’s web page which results in many applicants who may not be highly motivated to
apply or to seek employment with a specific organization. Other methods, such as direct
applications may require greater effort on the part of the applicant suggesting a higher level of
motivation to apply for a job with a particular employer. Decker and Cornelius (1979) suggested
that employees hired via different recruiting methods may have different perceptions about their
ability to find alternate employment. Some recruiting methods may expose applicants to more
employment opportunities, leading these applicants to believe they can more easily find another
job which, in turn, leads to higher turnover. Finally, Blau (1990) suggested that employees hired
via different recruiting methods may be treated differently after hire. Barber (1998) reported that
she could find no empirical tests of this hypothesis. Research on the post-hire treatment
hypothesis is clearly needed.
SOBIE 2014
21
Two theories explain differential treatment of employees by leaders. The Pygmalion Effect or
Self-fulfilling Prophecy suggests that leaders develop expectations of employees which then
affect how the leader reacts to those employees (Eden, 1991). When leaders have high(low)
performance expectations of employees they somehow convey those expectations to employees
via subtle behaviors, such as spending more time with them, giving them more challenging
assignments, and providing more feedback. Employees then work up (or down) to these
expectations so that the leader’s expectations are fulfilled. The Leader-Member Exchange
Theory of Leadership suggests that leaders classify employees into “in-groups” or “out-groups.”
In-group members receive more of the leader’s time and attention, better task assignments, and
more information.
The Leader-Member Exchange (LMX) model of leadership developed out of the Vertical Dyad
Linkage Model of Leadership and suggests that leaders classify followers into either an “in-
group” or an “out-group” (Dansereau, Graen & Hagen, 1975; Dinesch & Liden, 1986; Graen,
Novak & Sommerkamp, 1982; Vecchio & Gobdel, 1984). Leaders tend to distinguish between
in-group and out-group members very early in their relationship, and often on the basis of very
little information (Phillips & Bedeian, 1994). This classification would therefore typically take
place soon after the recruitment and selection of the employee. If the leader had beliefs or biases
about the effectiveness of various recruitment sources, this could influence the leader’s
classification of the employee as well as the leader’s expectations of the employee. LMX
Theory suggests that leaders interact differently with members of the two groups. In-group
members receive more time, information, and attention from the leader, greater resources, and
more mentoring and support than do out-group members (Scandura & Schriesheim, 1994).
Research has shown that in-group members have higher job performance, engage more in
organizational citizenship behaviors, express higher levels of job satisfaction and are less likely
to turnover compared to out-group members (Iles, Nahrgang & Morgeson, 2007 ; Chen, Lam &
Zhong, 2007).
Method
A questionnaire was administered to 165 employees of a small manufacturing plant in the
Southeastern United States. The average length of service of these employees, who worked in

SOBIE 2014
22
production and maintenance jobs, was 11 years. Their average age is 31 and 47% are female.
Sixty-seven employees returned useable questionnaires for a response rate of 41%.
The questionnaire initially asked employees to indicate which recruiting method was used to
recruit them into their job. Company management indicated that they used walk-ins/direct
application, employee referral, a company job site web page, job posting, and general internet
job sites (e.g., Monster.com) so these recruiting methods were listed on the questionnaire.
Short two to three item subscales were created to measure various aspects of differential
treatment by supervisors based on Pygmalion Effect and Leader-Member Exchange Theories.
Help from Supervisor was measured with three items: My supervisor checked on me regularly,
My supervisor frequently asked if he/she could help me, and My supervisor made sure I had
what I needed to get my job done. Coefficient Alpha reliability for this subscale was .78.
Supervisor Performance Expectations was measured with two items: My supervisor expects me
to perform well, and My supervisor made it clear he/she expects me to be a high performer
(Coefficient Alpha = .77). Supervisor Praise/Recognition was measured with two items: My
supervisor recognizes me for my good work, and My supervisor praises good job performance
(Coefficient Alpha = .82. Feedback from Supervisor was measure with two items: I received a
great deal of feedback on my performance from my supervisor, and My supervisor lets me know
how well I am performing (Coefficient Alpha = .80). Clear and Difficult Goals was measured
with two items: I have clear and specific work goals, and My work goals are quite difficult to
accomplish (Coefficient Alpha = .66). Autonomy was measured with three items: I am free to
do my job the way I think best, I have ample opportunity for independent thought and action, and
I am able to make a lot of decisions on my own (Coefficient Alpha = .89). Intent to Turnover
was included as an outcome variable to assess whether any of the recruiting methods produced
applicants who were less likely to leave their jobs. Three items assessed Intend to Turnover: I
will actively look for another job in the next year, I often think about quitting, and I will
probably look for a new job next year (Coefficient Alpha = .87).
Results
Analysis of variance was used to test for differences on Intent to Turnover by recruiting method.
A significant main effect (F = 9.45, p = .00) was observed for Intent to Turnover. Employees
recruited via Walk-ins/Direct Application and Employee Referrals reported a significantly
SOBIE 2014
23
(Scheffe Post Hoc Test = .05) lower intent to turnover than employees hired via other recruiting
methods.
Analysis of variance was used to test the Differential Treatment Hypothesis. Significant
differences were observed for Supervisor Praise Recognition (F = 2.60, p = .05), and Supervisor
Help (F = 5.09, p = .001) which are consistent with the Leader-Member Exchange theory. A
significant difference was also observed for Supervisor Expectations (F = 16.77, p = .00) which
is consistent with a Pygmalion Effect explanation. Supervisor Feedback approached significance
(F = 2.28, p = .07). There were no significant differences for Autonomy or Goal
Difficult/Specificity.
Scheffe Post Hoc tests (p = .05) were used to more fully explore the significant differences by
recruiting method. The Scheffe test did not detect any significant difference between recruiting
methods for Supervisor Praise/Recognition. Employees recruited via employee referrals
reported significantly higher levels of supervisor help than employees recruited via an internet
job search (e.g., Monster.com). Other recruiting methods were not significantly different from
employee referral in terms of Supervisor Help. Employees recruited via employee referral and
walk-in/direct application reported significantly higher Supervisor Expectations than employees
recruited via other methods.
Discussion
This exploratory study provides some support for the Differential Treatment Hypothesis for
explaining the relative effectiveness of different recruiting methods. At a small manufacturing
company, employee referrals and walk-ins/direct application produced employees who reported
lower levels of Intent to Turnover. This is consistent with previous research on the relative
effectiveness of recruiting methods. Informal recruiting methods, primarily employee referrals
and walk-ins/direct applications, have consistently been found to be more effective than other
recruiting methods in terms of intentional to turnover, turnover, absenteeism, job performance,
and employee attitudes. Research to date has examined primarily two explanations for the
differential effectiveness of recruiting methods: the Realistic Information Hypothesis and the
Individual Difference Hypothesis. The current study provides some initial support for a third
explanation, the Differential Treatment Hypothesis.

SOBIE 2014
24
Consistent with the Pygmalion Effect Theory, employees recruited via employee referral and
walk-in/direct application reported higher Supervisor Expectations of performance than
employees who were recruited via other methods. Consistent with the Leader-Member
Exchange Theory, employees recruited via employee referrals reported higher levels of Help
from Supervisor than employees recruited via other methods.
This differential treatment by supervisors may stem from the corporate culture. If a company has
had more success with applicants from a particular recruiting method in the past, a common
belief may develop concerning the relative effectiveness of that recruiting source. That belief
that a particular recruiting method produces better employees may then translate into supervisor
behavior resulting in different expectations and/or classification into an “in-group.” Leader-
Member Exchange Theory research has produced evidence that employees classified to an in-
group receive preferential treatment by their supervisor.
One limitation of the current study is the relatively small sample size. The sample may not have
been large enough to detect some differences (e.g., Supervisor Feedback). A second limitation is
the relatively short subscales employed in the questionnaire. More complete measures may be
able to detect additional differences between recruiting methods.
The current study does provide some initial evidence for the Differential Treatment Hypothesis.
Future research on explanations for the differential effectiveness of recruiting methods should
include this hypothesis along with the Individual Difference Hypothesis and the Realistic
Information Hypothesis.
References
Barber, A.E. (1998) Recruiting employees: Individual and organizational perspectives.
Thousand Oaks, CA: Sage Publications.

SOBIE 2014
25
Billsberry, J. (2007) Experiencing recruitment and selection. Hoboken, NJ: John Wiley & Sons.
Blau, G. (1990) Exploring the mediating mechanisms affecting the relationship of recruitment
source to employee performance. Journal of Vocational Behavior, 37: 303-320.
Breaugh, J.A. (1981) Relationships between recruiting sources and employee performance,
absenteeism, and work attitudes. Academy of Management Journal, 24: 142-147.
Breaugh, J.A., T.H. Macan & D.M. Grambow (2008) Employee recruitment: Current knowledge
and directions for future research. In G.P. Hodgkinson & J.K. Ford (Ed.s) International Review
of Industrial and Organizational Psychology, vol. 23, pp. 45-82, New York: John Wiley &
Sons.
Breaugh, J.H. & R.B. Mann (1984) Recruiting source effects: A test of two alternative
explanations. Journal of Occupational Psychology, 57: 261-267.
Bureau of National Affairs, (1988) Recruiting and selection processes. Personnel Policies
Forum, Survey Number 146 (May), Washington, DC.
Chen, Z., Lam, W., & Zhong, J. (2007). Leader-member exchange and member
performance: A new look at individual-level negative feedback-seeking behavior
and team-level empowerment culture. Journal of Applied Psychology, 92(1), 202- 212.
Dansereau, F., Graen, G. & Haga, W. (1975) A vertical dyad linkage approach to leadership
within formal organizations. Organizational Behavior and Human Performance, 13, 46-78.
Dienesch, R. & Liden, R. (1986) Leader-member exchange model of leadership: A critique and
further development. Academy of Management Journal, 11, 618-634.

SOBIE 2014
26
Eden, D. (1992) Leadership and expectations: Pygmalion effects and other self-fulfilling
prophecies in organizations. Leadership Quarterly, 3(4), 271-305.
Graen, G., Novak, M. & Sommerkamp, P. (1982) The effects of leader-member exchange and
job design on productivity and job satisfaction: Testing a dual attachment model.
Organizational Behavior and Human Performance, 30, 109-131.
Griffeth, R.W., P.W. Hom, L.S. Fink, & D.J. Cohen (1997) Comparative tests of multivariate
models of recruiting source effects. Journal of Management, 23: 19-36.
Ilies, R., Nahrgang, J. D., & Morgeson, F. P. (2007). Leader-member exchange and
citizenship behaviors: A meta-analysis. Journal of Applied Psychology, 92(1), 269-277.
Kalleberg, A.L., D. Knoke, P.V. Marsden & J.L. Spaeth (1996) Organizations in America.
Thousand Oaks, CA: Sage Publications.
Kirnan, J.P., J.A. Farley & K.F. Geisinger (1989) The relationship between recruiting source,
applicant quality, and hire performance: An analysis by sex, ethnicity, and age. Personnel
Psychology, 42: 293-308.
Phillips, A.S. & Bedeian, A.G. (1994) Leader-follower exchange quality: The role of personal
and interpersonal attributes. Academy of Management Journal, 37, 990-1001.
Rynes, S.L., R.D. Bretz & B. Gerhart (1991) The importance of recruitment in job choice: A
different way of looking. Personnel Psychology, 44: 487-521.
Saks, A.M. (2005) The impracticality of recruitment research. In A. Evers, N. Anderson and O.
Voskuijl (eds.) Handbook of personnel selection, Pp. 47-72, Malden, MA: Blackwell.

SOBIE 2014
27
Scandura, T.A. & Schriesheim, C.A. (1994) Leader-member exchange and supervisor career
mentoring as complementary constructs in leadership research. Academy of Management
Journal, 37 1588-1602.
Schwab, D.P. (1982) Recruiting and organizational participation. In K. Rowland and G. Ferris
(Eds.) Personnel Management, 103-128: Boston: Allyn & Bacon.
Taylor, M.S. & D.W. Schmidt (1983) A process-oriented investigation of recruitment source
effectiveness. Personnel Psychology, 36: 343-354.
Vecchio, R.P. (1995) The impact of referral sources on employee attitudes: Evidence from a
national sample. Journal of Management, 21: 953-965.
Werbel, J.D. & J. Landau (1996) The effectiveness of different recruitment sources: A
mediating variable analysis. Journal of Applied Social Psychology, 26: 1337-1350.
Williams, C.R., C.E. Labig, & T.H. Stone ((1993) Recruitment sources and post hire outcomes
for job applicants and new hires: A test of two hypotheses. Journal of Applied Psychology, 42:
163-172.
Zitoli, M.A. & J.P. Wanous (2000) Recruitment source research: Current status and future
directions: Human Resource Management Review. 10: 353-383.
SOBIE 2014
28
A Study of Small Business Information Security in Rural America
Donald A. Heier, Dakota State University
Guy W. Garrett, Gulf Coast State College
Abstract
This paper discusses a proposed research methodology in determining the information security
posture of small businesses and the constraints that may limit their information security practices. A
qualitative case study methodology is proposed that includes a quantitative survey and selection criteria
for the study’s participants.
Introduction
Concern for small business security in the increasingly technology dependent business
environment is widespread, and this concern is reflected in research by the technology industry and
various research communities (Mellado & Rosado, 2012). The work in this field primarily falls into two
categories. The first defines best practices in information security geared to protecting the small business’
assets. The second category generally looks for ways to measure the security practices that exist in small
business and focus attention towards the weaknesses and vulnerabilities (Morgan, 2005). There are small
business security surveys completed on an annual basis that paint a very poor picture of small business
security practices, and these survey results are often the cause for sensational headlines (Kavilanz, 2012).
Occasionally these surveys will attempt to suggest remedies that usually note the need for increased
staffing or funding – these remedies don’t fit well with small information technology budgets (Willcocks,
1992).
In the United States, the Small Business Administration (2012) will, on average, define a small
business as having less than 500 employees. These businesses, however, represent over 95% of all
businesses and employ over half of non-governmental employees (U.S. Small Business Administration,
2012). Small businesses have increasingly become targets for hackers and cyber criminals as larger
businesses with more resources have become more secure (Kissel, 2009). The National Cyber Security
Alliance reported that in 2012 that 31% of security attacks were on small businesses, an increase from
18% in 2011 (National Cyber Security Alliance, 2012). Small businesses typically have their entire
technology infrastructure supported by a single employee or small department that is not well informed of
security standards (Park et al., 2008).
One of the frequently reported security surveys for small business is the National Cyber Security
Alliance (NCSA) / Symantec - National Small Business Study (2012). The most recent survey in 2012
consisted of 86 questions with a sample size of 1,015 small businesses, with 250 employees or less
(National Cyber Security Alliance, 2012).
This research methodology seeks to investigate small business security practices by a descriptive
case study. To better understand the security practices of these businesses, this study incorporates the use
SOBIE 2014
29
of the National Institute of Standards document titled “Small Business Information Security: The
Fundamentals” (NISTIR 7621). This document is an interagency report that describes research of a
technical nature with the intent of providing guidance to small businesses in their security actions
(National Institute of Standards and Technology, 2013). Small businesses are not required to follow any
of the guidelines, but are strongly encouraged to in order to meet a basic level of information security
(Kissel, 2009). NISTIR 7621 describes 10 absolutely necessary security actions that a small business
should utilize.
The research questions for the study are:
1) What level of security do small businesses implement when measured against the
suggested practices of the NISTIR 7621 guidelines?
2) How do small businesses perceive they could improve their security practices in
regards to NISTIR 7621?
Literature Review
A literature review was conducted to better understand the current situation and research in
regards to small businesses information security in the United States. As noted in the introduction, small
businesses are increasingly becoming targets for hackers and cyber criminals. (Kissel, 2009). In
performing this search care was taken to keep the focus on small businesses with an eye towards their
unique security concerns as well as their security practices.
The search began with various Internet searches as well as Google Scholar and then moved on
towards the ProQuest and ACM libraries. The Internet search was a bit overwhelming, but by focusing
on more current research and articles that better matched the research goals the search was narrowed
considerably. The papers and articles selected for further review needed to either have a strong focus of
assessing the current state of the small business security situation or suggest concise and effective
strategies for improving small businesses security. The search also tended to follow more of a business
mindset that focused on the resource limitations and concerns of a business and less on the technical
details of information systems since the study focuses on business limitations and not limitations in
technology..
As the search evolved, it was generally found that the articles in the scholarly journals focused
on the management aspects of security such as business resources and security strategies. Industry
documents, however, were ripe with data on current small business security surveys and often suggested
best practices to improve security. It seemed sensible to separate the literature review into three themes:
security surveys, best practices, and security strategy and management.
Research Methodology
This study of small business security will be based on case study research. Benbasat (1987) notes
three reasons supporting case study research in information systems. Firstly, we can study these
information systems in natural settings and then generate theories. Secondly, the researcher can seek
answers to questions of how and why regarding information systems processes. Thirdly, he suggests a

SOBIE 2014
30
case is appropriate when few studies are available as the field of study is rapidly changing. Gable (1994)
notes that case studies are not always completely qualitative and may include a quantitative survey and
encourages IS researchers to combine methods as “far as is feasible”. In this particular study, it is hoped
that the initial survey will serve to develop an understanding of the case’s security situation and likely
lead to more in depth answers to the interview questions.
Components of research design as suggested by Yin (2003) will be utilized in this design. These
components are:
1) A study’s question
2) Its propositions, if any
3) Its units of analysis
4) The logic linking the data to the propositions
5) The criteria for interpreting the findings
A study’s question. Yin (2003) suggests to clarify the study questions for the appropriate
how and why questions. For this study, with our survey forming the basis for understanding the
business security implementation and answering the first research question, the interview
questions are noted as follows:
1) What resources do you feel would be needed to meet all the ‘absolutely necessary’
security actions?
2) What type of training or guidance would you like to see to help your company better
understand computer security concepts?
3) Do you feel that there are specific limitations that effect incorporating security
practices in your business?
Its propositions, if any. Yin (2003) suggest that propositions direct attention to items that need to
be examined further and states that forming propositions will help the research move in the right
direction.
Its units of analysis. Yin (2003) indicates that the unit of analysis is related to the way the initial
research questions were defined. In this study, the research may select a certain geographic area and
specific types of business that will be points of analysis with the unit of analysis representing the
collection of these cases.
The logic linking the data to the propositions. The propositions have been developed in a
previous step. The interview questions will be measured against the survey questions to determine
whether the propositions have been met for each small business. The propositions do suggest that in
general, small businesses will fall short of meeting the NISTIR 7621 security actions.
The criteria for interpreting the findings. For the survey questions, an overall rating indicating
the level to which the small business meets the absolutely necessary security actions outlined in NISTIR
7621 will be calculated. This calculation will help to interpret the responses from the interview questions.
SOBIE 2014
31
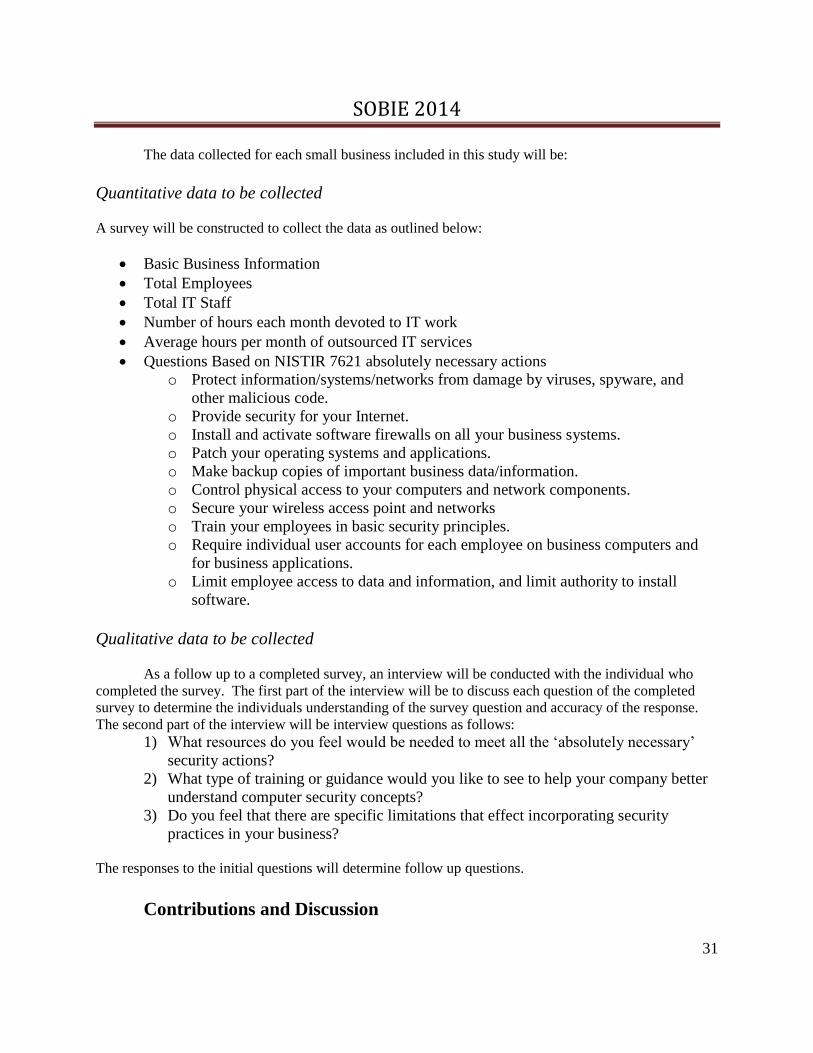
The data collected for each small business included in this study will be:
Quantitative data to be collected
A survey will be constructed to collect the data as outlined below:
Basic Business Information
Total Employees
Total IT Staff
Number of hours each month devoted to IT work
Average hours per month of outsourced IT services
Questions Based on NISTIR 7621 absolutely necessary actions
o Protect information/systems/networks from damage by viruses, spyware, and
other malicious code.
o Provide security for your Internet.
o Install and activate software firewalls on all your business systems.
o Patch your operating systems and applications.
o Make backup copies of important business data/information.
o Control physical access to your computers and network components.
o Secure your wireless access point and networks
o Train your employees in basic security principles.
o Require individual user accounts for each employee on business computers and
for business applications.
o Limit employee access to data and information, and limit authority to install
software.
Qualitative data to be collected
As a follow up to a completed survey, an interview will be conducted with the individual who
completed the survey. The first part of the interview will be to discuss each question of the completed
survey to determine the individuals understanding of the survey question and accuracy of the response.
The second part of the interview will be interview questions as follows:
1) What resources do you feel would be needed to meet all the ‘absolutely necessary’
security actions?
2) What type of training or guidance would you like to see to help your company better
understand computer security concepts?
3) Do you feel that there are specific limitations that effect incorporating security
practices in your business?
The responses to the initial questions will determine follow up questions.
Contributions and Discussion

SOBIE 2014
32
One can envision numerous contributions from this research. Results from the survey should
provide some insight into the validity of and usefulness of the NISTIR 7621 as a measurement tool for
small business security. Insights learned could be used to modify or suggest changes to the absolutely
necessary actions that are suggested. The survey results will also be valuable to develop theories based
on the relationships that may exist between question items and could form the basis for theoretical models
of small business security practices. The repeated survey during the interview will reduce limitations of
the standalone survey and produce more accurate responses.
The qualitative data will be very beneficial in understanding how the small businesses view these
security practices and how they might envision their options for improving their security practices.
Results from the second interview questions will be helpful in developing methods and strategies that can
be shared with small businesses to improve their technical knowledge and application of security
concepts. The third interview question will give an indication of the limitations that small business feel
limit their security implementation.
Future Research Plan
Future research may involve contributing to the development of practical small business security
standards that may improve upon or extend beyond the absolutely necessary standards. This study can
also serve as a baseline for developing security training and awareness programs geared towards
businesses with limited staffing and financial resources. It is expected that future research from the
findings of this case study will follow some of the generalizations suggested by Walsham (1995). These
generalizations consist of development of concepts, generation of theory, drawing of specific
implications, and contribution of rich insight.
References
Benbasat, I., Goldstein, D. K., & Mead, M. (1987). The Case Research Strategy in Studies of Information
Systems. MIS Quarterly, 11(3), 369-369.
Gable, G. G. (1994). Integrating case study and survey research methods: An example in information
systems. European Journal of Information Systems, 3(2), 112-112.
Internet Security Alliance. (2004). Commonsense Guide to Cyber Security for Small Businesses.
Retrieved November, 2012, from http://www.uschamber.com/reports/commonsense-guide-cyber-
security-small-businesses
Kavilanz, P. (2012). Cybercrime's Easiest Prey: Small Business. Retrieved from CNN Money website:
http://money.cnn.com/2013/04/22/smallbusiness/small-business-cybercrime/index.html
Kissel, R. (2009). Small business information security [electronic resource] : the fundamentals (draft) /
Richard Kissel. Gaithersburg, MD :: U.S. Dept. of Commerce, National Institute of Standards and
Technology.
Mellado, D., & Rosado, D. (2012). An Overview of Current Information Systems Security Challenges
and Innovations. Journal of Universal Computer Science, 18(12), 1598-1607.
Morgan, R. (2005). Information Security for Small Businesses.
http://www.infosecwriters.com/text_resources/pdf/Information_Security_for_Small_Businesses.p
df
National Cyber Security Alliance. (2012). 2012 NCSA / Symantec National Small Business Study.
Retrieved February, 2013, from http://www.staysafeonline.org/stay-safe-online/resources/

SOBIE 2014
33
National Institute of Standards and Technology. (2013). NIST Interagency Reports. 2013(March).
http://csrc.nist.gov/publications/PubsNISTIRs.html
NIST Computer Security Division. (2012). Small Business Corner. Retrieved November, 2012, from
http://csrc.nist.gov/groups/SMA/sbc/index.html
Park, J.-Y., Robles, J., Hong, C.-H., Kim, T.-h., & Yeo, S.-S. (2008). IT Security Strategies for SME’s.
International Journal of Software Engineering and Its Applications (IJSEIA), 2(3), 91-98.
The Hartford. (2012). Small Business Owners - Despite Being Increasingly Targeted - Believe Data
Breach Unlikely. Retrieved from The Hartford website: http://newsroom.thehartford.com/News-
Releases/Small-Business-Owners-mdash-Despite-Being-Increasingly-Targeted-mdash-Believe-
Data-Breach-Unlikely-50c.aspx
U.S. Small Business Administration. (2012). Small Business Size Standards. Retrieved March, 2013,
from http://www.sba.gov/content/small-business-size-standards
Walsham, G. (1995). Interpretive case studies in IS research: nature and method. European Journal of
information systems, 4, 74-81.
Willcocks, L. (1992). Evaluating Information Technology investments: research findings and reappraisal.
Information Systems Journal, 2(4), 243-268. doi: 10.1111/j.1365-2575.1992.tb00081.x
Yin, R. K. (2003). Case study research : design and methods (3rd ed.). Thousand Oaks, Calif.: Sage
Publications.
Evaluating Results of a Small Business Security Survey

SOBIE 2014
34
Donald A. Heier, Dakota State University
Guy W. Garrett, Gulf Coast State College
Abstract
This paper provides a summary of small business responses to a survey based on the
National Institute of Standards and Technology document “Small Business Information Security:
The Fundamentals” (NISTIR 7621). The NIST document served as the guide for determining
what information security practices small businesses should be utilizing. Participants completed
a survey based on the ten absolutely necessary security actions recommended by NISTIR 7621
followed by a discussion of their responses in an interview format. Results on the level of
implementation of security practices as well as the participants concerns regarding the practices
are reported.
Introduction to the Problem
Concern for small business security in the increasingly technology dependent business
environment is widespread, and this concern is reflected in research conducted by the technology
industry and various research communities (Mellado & Rosado, 2012). In the United States, the
Small Business Administration (2012) will, on average, define a small business as having less
than 500 employees. These businesses, however, represent over 95% of all businesses and
employ over half of non-governmental employees (U.S. Small Business Administration, 2012).
Small businesses have increasingly become targets for hackers and cyber criminals as larger
businesses with more resources have become more secure (Kissel, 2009). The National Cyber
Security Alliance reported that in 2012 that 31% of security attacks were on small businesses, an
increase from 18% in 2011 ( 2012). Small businesses typically have their entire technology
infrastructure supported by a single employee or small department that is not well informed of
security standards (Park, Robles, Hong, Kim, & Yeo, 2008).
Purpose of the Study
This purpose of this study was to investigate small business security practices using the a
descriptive case study method. The subjects were independent insurance agencies located in
seven rural North Dakota counties. Independent insurance agencies are companies that sell a
variety of insurance products including areas of health, life, disability, property and long term
care(Independent Insurance Agents and Brokers of America, 2012). In the United States there
are approximately 37,500 independent agencies (Independent Insurance Agents and Brokers of
America, 2012). These enterprises process and store significant amounts of personal data related
to their customers. They also fulfill the definition of a small business and operate in relatively

SOBIE 2014
35
rural locations. It can be assumed that their customers expect data security in the same way they
would treat a larger organization. By determining how these businesses apply the 10 NIST
practices, should provide better understanding of how small firms address basic security needs
for their information systems.
The geographic area of this study includes the contiguous counties of Dickey, Lamoure,
Logan, McIntosh, Ransom, Sargent and Emmons in South Central North Dakota. These counties
represent a land area of approximately 7,576 square miles which is about 11% of the state of
North Dakota. Additional criteria for case selection is that the independent agencies selected
shall be responsible for managing their computer systems and not fall under the management of a
related business such as a bank or credit union that may manage their computer systems for
them.
To better understand the security practices of these businesses, this study incorporated the
use of the National Institute of Standards document titled “Small Business Information Security:
The Fundamentals” (NISTIR 7621). This document is an interagency report that describes
research of a technical nature with the intent of providing guidance to small businesses in their
security actions (National Institute of Standards and Technology, 2013). Small businesses are
not required to follow any of the guidelines, but are strongly encouraged to in order to meet a
basic level of information security (Kissel, 2009). NISTIR 7621 describes 10 necessary security
actions that a small business should utilize.
Research Questions
The research questions were:
1) What level of security do small businesses implement when measured against the
suggested practices of the NISTIR 7621 guidelines?
2) How do small businesses perceive they could improve their security practices in
regards to NISTIR 7621?
Research Methodology
This analysis of small business security was based on case study research. Benbasat
(1987) notes three reasons supporting case study research in information systems. First, we can
study these information systems in natural settings and then generate theories. Second, the
researcher can seek answers to questions of how and why regarding information systems
processes. Third, he suggests a case is appropriate when few studies are available as the field of
study is rapidly changing. Gable (1994) notes that case studies are not always completely
qualitative and may include a quantitative survey and encourages IS researchers to combine
methods as “far as is feasible”. In this particular study, it was hoped that the initial survey would
serve to develop an understanding of the case’s security situation and likely lead to more in depth
answers to the interview questions. The data collected for each small business included in this
study was:

SOBIE 2014
36
Quantitative data collected
A survey was constructed to collect the data as outlined below:
Business Name
Contact Name and Position
Phone Number
Location of Business (Zip Code)
Total Employees
Total IT Staff
Number of hours each month devoted to IT work
Average hours per month of outsourced IT services
Questions based on NISTIR 7621 absolutely necessary actions:
o Protect information/systems/networks from damage by viruses, spyware, and
other malicious code.
o Provide security for your Internet.
o Install and activate software firewalls on all your business systems.
o Patch your operating systems and applications.
o Make backup copies of important business data/information.
o Control physical access to your computers and network components.
o Secure your wireless access point and networks
o Train your employees in basic security principles.
o Require individual user accounts for each employee on business computers and
for business applications.
o Limit employee access to data and information, and limit authority to install
software.
Qualitative data collected
As a follow up to a completed survey, an interview was conducted with the individual
who completed the survey. The first part of the interview discussed each question of the
completed survey to determine the individuals understanding of the survey question with a goal
to produce an accurate response and a successful survey (Fowler, 1990). Differences in the
results from the two surveys can provide a measure of the consistency and understanding of the
survey instrument (Fowler, 1995). Since the interview based survey often involved a more
thorough discussion of the security practices and discussion with the participant on their level of
implementation, it should present a more accurate assessment (Collins, 2001). The second part
of the interview involved interview questions focused on the second research question.

SOBIE 2014
37
Results and Findings
In the selected seven county areas, nineteen small businesses participated in the study
which represents a 100% participation rate of independent insurance agencies in these counties.
Table 1 below shows an overview of the 19 participants in regards to the total number of
employees, full time IT staff, approximate number of hours per month devoted to IT work and
the approximate number of hours per month of hired outside IT support. Due to the small size of
these businesses, none of them were able to support a full time IT staff person and spent a very
modest amount of time per month on IT related work.
Table 1: Participant Overview
Participant
#
Number of
Employees
Full Time
IT Staff
Hours IT
Work per
Month
Hours
Outside IT
Service per
Month
1 7 0 10 3
2 2 0 5 3
3 3 0 5 0
4 1 0 2 1
5 3 0 2 0
6 3 0 5 0
7 1 0 5 0
8 2 0 10 5
9 1 0 5 1
10 3 0 5 3
11 4 0 2 1
12 1 0 2 0
13 3 0 8 2
14 2 0 4 0
15 2 0 1 1
16 3 0 1 1
17 2 0 0 0
18 3 0 4 3
19 2 0 2 2
Average 2.53 0.00 4.11 1.37
The participants varied from a business size of just one insurance agent to maximum size
of 7 employees with an average size of approximately 2.5 employees per business. The
demographic data shows that the employees in the small business who’s primary role is to sell
various lines of insurance have also taken on the full responsibility of maintaining a certain level of
information security for the business.

SOBIE 2014
38
Results and Findings: Security Practices Survey
After introducing the research project to them, each participant in the study was asked to
complete a survey. The first part of the survey was designed to obtain some basic information
about the business. The second part of the survey was designed to measure the level of
implementation of ten security practices noted as “absolutely necessary” in NISTIR 7621.
After the participant completed the survey, the ten security practices were revisited in an
interview format as an attempt to verify the accuracy of the responses.
For each of the ten security practices, the participant was presented with a description of
the security practice and then asked to rate the level of implementation in their business. Table 2
describes the response choices and the description of those choices.
Table 2: Definition of Survey Response Options
Survey Response Choice Description
Fully Implemented
If your business completely implements a
security practice as described, select Fully
Implemented.
Mostly Implemented If your business implements at least 50% of the
practice, select Mostly Implemented.
Partly Implemented
If your business implements some of the
practice, but less than 50%, select Partly
Implemented.
Not Implemented If the practice is not implemented at your
business, select Not Implemented.
Not Sure
If you are uncertain about how your business
implements a security practice, feel free to
select ' Not Sure' as your answer.
Table 3 provides a high level overview of interview phase and the responses to the ten
security practices and the percentage of the nineteen participants selecting that response.

SOBIE 2014
39
Table 3: Overview of Interview Based Survey Responses
Fully
Implemented
Mostly
Implemented
Partly
Implemented
Not
Implemented Not Sure
Practice 1: Anti-
Virus 74% 26% 0% 0% 0%
Practice 2: Hardware
Firewall 11% 74% 16% 0% 0%
Practice 3: Software
Firewall 21% 58% 16% 5% 0%
Practice 4: Patches
and Updates 5% 63% 26% 0% 5%
Practice 5:Backups 16% 26% 58% 0% 0%
Practice 6: Physical
Access Controls 37% 42% 11% 11% 0%
Practice 7: Wireless
Security 47% 16% 21% 11% 5%
Practice 8: Security
Training 5% 21% 47% 26% 0%
Practice 9: Password
Policy 26% 21% 42% 11% 0%
Practice 10: Limited
Access 0% 42% 32% 26% 0%
Average 24% 39% 27% 9% 1%
The overall averages are also presented for the interview portion of the survey as represented in
Figure 1.

SOBIE 2014
40
Figure 1: Average Survey Question Responses
The first goal of this study was to explore the security practices of various cases.
Research question 1 set out to determine a level of implementation when measured against the
practices as outline in NISTIR 7621. The interview survey results as displayed in table 3
indicate that on average small businesses in this study are falling short of the requirements. On
average only 24% have fully implemented a typical security practice as specified.
As one looks across all the practices and the respondent’s level of ‘fully implemented’,
the highest level of compliance was with the following practices:
Practice 1: Anti-Virus
Practice 2: Wireless Security
Practice 6: Physical access controls
The lowest level of compliance was with the following practices:
Practice 10: Limited Access
Practice 8: Security Training
Practice 4: Patches and updates
Results and Findings: Participant Interviews
Question 1 of the interview asked the participants to identify what resources they felt
would be needed to meet all the ‘absolutely necessary’ security actions. Table 4 below provides
an overview of common themes that were coded and a count of responses.
24%
39%
27%
9%
1%
Survey Average
Fully Implemented
Mostly Implemented
Partly Implemented
Not Implemented
Not Sure
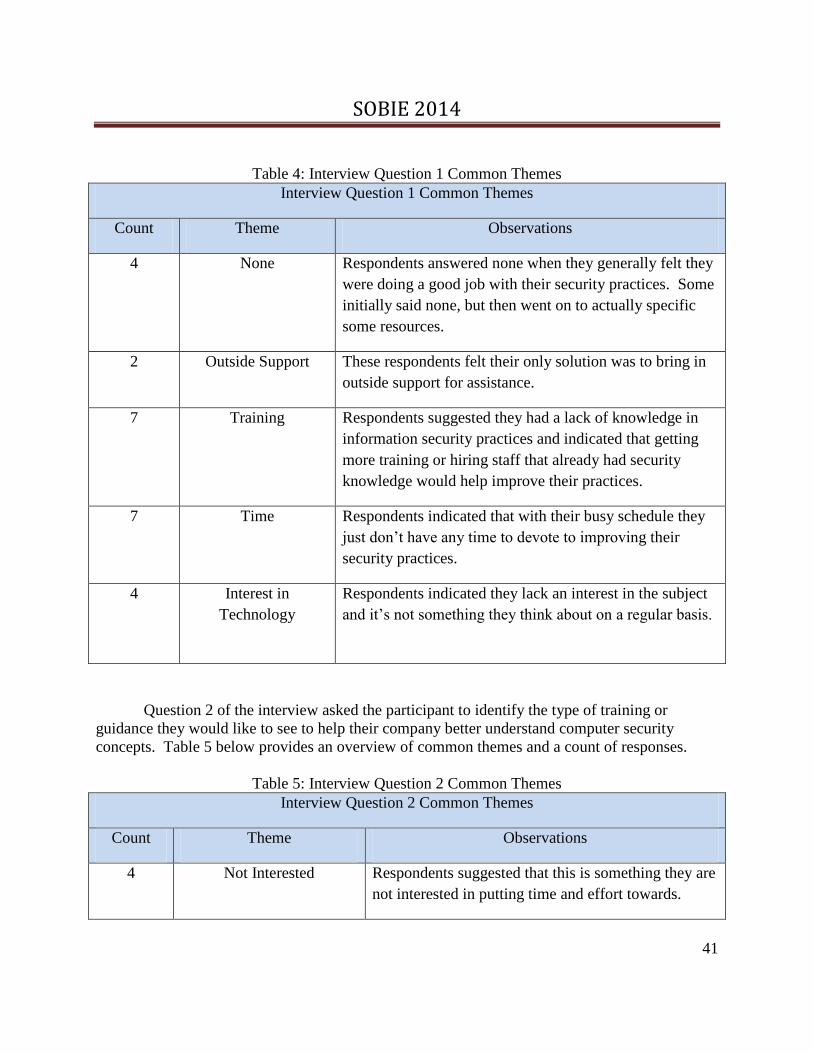
SOBIE 2014
41
Table 4: Interview Question 1 Common Themes
Interview Question 1 Common Themes
Count Theme Observations
4 None Respondents answered none when they generally felt they
were doing a good job with their security practices. Some
initially said none, but then went on to actually specific
some resources.
2 Outside Support These respondents felt their only solution was to bring in
outside support for assistance.
7 Training Respondents suggested they had a lack of knowledge in
information security practices and indicated that getting
more training or hiring staff that already had security
knowledge would help improve their practices.
7 Time Respondents indicated that with their busy schedule they
just don’t have any time to devote to improving their
security practices.
4 Interest in
Technology
Respondents indicated they lack an interest in the subject
and it’s not something they think about on a regular basis.
Question 2 of the interview asked the participant to identify the type of training or
guidance they would like to see to help their company better understand computer security
concepts. Table 5 below provides an overview of common themes and a count of responses.
Table 5: Interview Question 2 Common Themes
Interview Question 2 Common Themes
Count Theme Observations
4 Not Interested Respondents suggested that this is something they are
not interested in putting time and effort towards.
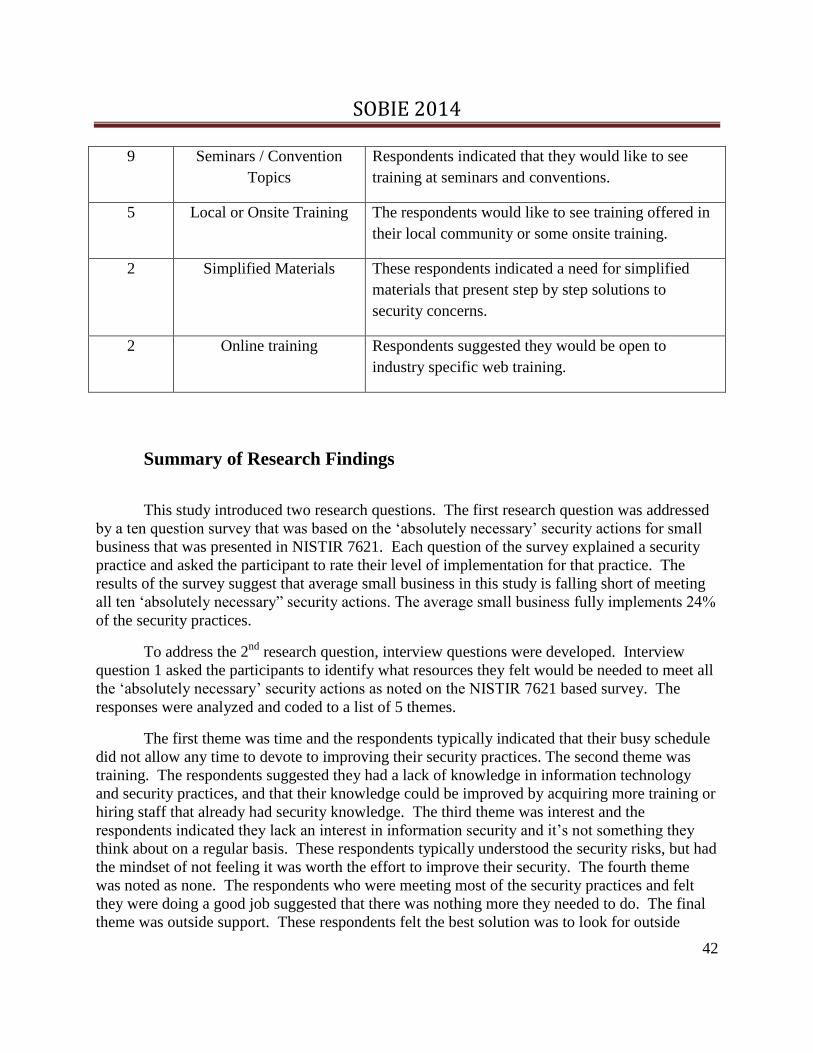
SOBIE 2014
42
9 Seminars / Convention
Topics
Respondents indicated that they would like to see
training at seminars and conventions.
5 Local or Onsite Training The respondents would like to see training offered in
their local community or some onsite training.
2 Simplified Materials These respondents indicated a need for simplified
materials that present step by step solutions to
security concerns.
2 Online training Respondents suggested they would be open to
industry specific web training.
Summary of Research Findings
This study introduced two research questions. The first research question was addressed
by a ten question survey that was based on the ‘absolutely necessary’ security actions for small
business that was presented in NISTIR 7621. Each question of the survey explained a security
practice and asked the participant to rate their level of implementation for that practice. The
results of the survey suggest that average small business in this study is falling short of meeting
all ten ‘absolutely necessary” security actions. The average small business fully implements 24%
of the security practices.
To address the 2nd
research question, interview questions were developed. Interview
question 1 asked the participants to identify what resources they felt would be needed to meet all
the ‘absolutely necessary’ security actions as noted on the NISTIR 7621 based survey. The
responses were analyzed and coded to a list of 5 themes.
The first theme was time and the respondents typically indicated that their busy schedule
did not allow any time to devote to improving their security practices. The second theme was
training. The respondents suggested they had a lack of knowledge in information technology
and security practices, and that their knowledge could be improved by acquiring more training or
hiring staff that already had security knowledge. The third theme was interest and the
respondents indicated they lack an interest in information security and it’s not something they
think about on a regular basis. These respondents typically understood the security risks, but had
the mindset of not feeling it was worth the effort to improve their security. The fourth theme
was noted as none. The respondents who were meeting most of the security practices and felt
they were doing a good job suggested that there was nothing more they needed to do. The final
theme was outside support. These respondents felt the best solution was to look for outside

SOBIE 2014
43
assistance. Based on the themes presented, it does appear the respondents do have some ideas
of what it might take for their business to improve their security practices.
Question 2 of the interview asked the participant to identify the type of training or
guidance they would like to see to help their company better understand computer security
concepts. Nine respondents suggested seminars, five suggested local training, 2 suggested the
need for simplified training materials, two recommended online training, and 4 were not
interested in further training.
Recommendations for Future Research
The findings from this study are significant in that they provide good insight into the state
of small business information security practices for the selected independent insurance agencies
in rural North Dakota. This study also introduces a measurement tool based on the NISTIR 7621
guidelines for small business. There are however areas for future investigation and research.
Two key areas are identified:
1) To complement this study, the analysis could expand into other business types, geographic
areas, and seek out businesses that have either a larger number of employees or more variation in
the number of employees. This would provide a wider understanding of small business security
where the insight gained could be more applicable to other business scenarios.
2) Investigate more fully the NISTIR 7621 guidelines and whether the practices and guidelines
suggested represent a truly accurate assessment of the necessary security actions for small
businesses. Perhaps recommendations and modifications could be investigated that could
improve the NISTIR 7621document.
References
Benbasat, I., Goldstein, D. K., & Mead, M. (1987). The Case Research Strategy in Studies of
Information Systems. MIS Quarterly, 11(3), 369-369. Clancy, H. (2011). 5 reasons
cybersecurity matters to small businesses. Retrieved April 1, 2013, from
http://www.zdnet.com/blog/small-business-matters/5-reasons-cybersecurity-matters-to-
small-businesses/1008
Collins, D. (2003). Pretesting survey instruments: An overview of cognitive methods. Quality of
Life Research, 12(3), 229-238. doi: 10.1023/A:1023254226592
Fowler, F., & Mangione, T. (1990). Standardized Survey Interviewing: Minimizing Interviewer
Related Error Social Research Methods Series: 18. Newbury Park: Sage.
Gable, G. G. (1994). Integrating case study and survey research methods: An example in
information systems. European Journal of Information Systems, 3(2), 112-112.
Independent Insurance Agents and Brokers of America. (2012). Agency Universe Study.
Retrieved June 2013, from
http://www.independentagent.com/Resources/Research/AgencyUniverseStudy/agency-
universe.aspx

SOBIE 2014
44
Kissel, R. (2009). Small business information security [electronic resource] : the fundamentals
(draft) / Richard Kissel. Gaithersburg, MD :: U.S. Dept. of Commerce, National Institute
of Standards and Technology.
Mellado, D., & Rosado, D. (2012). An Overview of Current Information Systems Security
Challenges and Innovations. Journal of Universal Computer Science, 18(12), 1598-1607.
National Institute of Standards and Technology. (2013). NIST Interagency Reports.
2013(March). http://csrc.nist.gov/publications/PubsNISTIRs.html
NCSA. 2012. "National Security Alliance Small Business Study 2012” (available online at
http://www.staysafeonline.org; accessed on November 12, 2013).
NIST Computer Security Division. (2012). Small Business Corner. Retrieved November, 2012,
from http://csrc.nist.gov/groups/SMA/sbc/index.html
Park, J.-Y., Robles, J., Hong, C.-H., Kim, T.-h., & Yeo, S.-S. (2008). IT Security Strategies for
SME’s. International Journal of Software Engineering and Its Applications (IJSEIA),
2(3), 91-98.
U.S. Small Business Administration. (2012). Small Business Size Standards. Retrieved March,
2013, from http://www.sba.gov/content/small-business-size-standards
US Census Bureau. (2010). State & County QuickFacts. Retrieved from
http://quickfacts.census.gov/qfd/maps/north_dakota_map.html.
Willcocks, L. (1992). Evaluating Information Technology investments: research findings and
reappraisal. Information Systems Journal, 2(4), 243-268. doi: 10.1111/j.1365-
2575.1992.tb00081.x

SOBIE 2014
45
IMPROVED WRITING SKILLS: THE ‘NEW NORMAL’
FOR ACCOUNTING STUDENTS
Elizabeth A. Hewey
University of West Florida
ABSTRACT
What do university students think of their writing skills? The short answer is that they think they
are good writers. The long answer addresses why students think that they are good writers when so much
scholarly research proves otherwise. “Improved writing skills: the ‘New Normal’ for Accounting
Students,” based on the findings of secondary research sources and primary analysis in the University of
West Florida Writing for Business: Theory & Practice class explores this alarming antithesis with special
emphasis on the accountancy profession. The in-depth research first establishes significant need for
improved writing skills in business overall, and in accounting specifically, with definitive recognition of
the issues from accounting firms to the United States Security and Exchange Commission (SEC).
The paper then reviews student communication skills from a historical and national perspective,
linking pioneers in the accounting industry. This study includes teaching ideas and techniques that have
been used successfully to improve students’ reading comprehension, critical thinking, and oral and
written communication skills. Moving from general to specific, the examination of students’ writing skills
presents what is being accomplished in the university’s business writing class and writing labs. The
conclusion of this paper is that stakeholders need to champion a collective paradigm shift to improve
student cognitive and writing skills with emphasis on the financial governance field of accountancy.
INTRODUCTION: ENSURING GROWTH
In her descriptions of the complementary roles between writing and critical thinking skills, Palen
claims that, “If the accountant’s practice is to grow, so must his (and her) ideas” (as cited in Flesher,
Previts, and Sharp, 2009, p. 6). This report is designed to examine the value of writing skills in corporate
and business governance with particular emphasis on the accountancy profession. Overall, the research
writing further investigates and discovers recommended teaching practices for improving writing skills.
Specifically, the study seeks answers to the following student-related questions:
Is there a need for students to improve writing skills for a career in accountancy?

SOBIE 2014
46
How do accounting professionals historically link writing skills with cognitive abilities?
What do students think about the value of writing?
How do students rate their own individual writing skills? Is there a correlation between a
student’s ratings and student’s performance on writing skills?
Do stakeholders, other than teachers, criticize students’ writing skills?
Does any class or program help students to improve their writing skills?
What are proven teaching practices developed to improve students’ cognitive skills? Stakeholders and students alike, both retrospectively and prospectively, have a vested interest in
economies. For this single-minded purpose, all should view the impetus of weakening writing skills as a
deflationary economic catalyst, and they should act collectively to shift the paradigm.
DISCUSSION: ESTABLISH NEED FOR WRITING SKILLS
Bruzzese (2014), a nationally-syndicated millennial business columnist, writes that “Many
businesses today have expressed frustration with younger workers. Owners claim that younger workers
lack the proper business skills and other professional abilities that will make them good employees”
(para.1-2). Bruzzese (2014) provides an optimistic guidepost explaining that “research on workers born
after 1980, known as millennial or Generation Y, shows that they greatly desire career development,
guidance from mentors and opportunities to expand their skills” (para. 9). A central issue in improving
Generation Y’s business skills appears to be learning location: home, school, church, university,
workplace, society, or a combination thereof.
Writing for Accounting Clients: ‘Survival Tactic’
Connecting generations of business professionals in her scholarly writing for The CPA Journal,
Kranacher (2007) analogizes how writing is a survival tactic that can transcend time demonstrated by a
well-known master of prose. Quoting George Bernard Shaw, “The problem with communication . . .,” she
states,
"... is the illusion that it has been accomplished." The emphasis is my own, and George Bernard
Shaw didn't have the accounting profession specifically in mind when he wrote these words, but
he might as well have. Employers say their major concern with today's accounting graduates is
their level of professional literacy--or more to the point, their lack of adequate communication
skills: reading, writing, listening, and speaking.
SOBIE 2014
47
Increased professional visibility combined with the public's heightened expectations of CPAs
makes these traits essential for survival in the current business environment. But many of the profession's
fundamentals as now taught leave little room for much-needed communication or critical thinking on
the CPA's part. (p. 80)
Historically, the accounting profession has an image of primarily being mathematics-driven, a
preconception that has caused students with so-called “left brain” communications skills to avoid the
field, “but in reality, today's accountant needs to have equal parts financial, legal, investigative, and
teaching skills” (Kranacher, 2007, p. 80). It is true that accountants need to keep abreast of technical
knowledge; however, many are their clients’ trusted advisors when it comes to a myriad of financial
decisions. Accountants are called on to research, translate, and communicate complex, multi-tiered
concepts that are designed as an economic catalyst to strategically position their clients’ resources for
growth and ensure the assets’ future viability.
Fortunately, teaching is a potent legacy of accountancy. Many corporations, small businesses,
governments, and nonprofit organizations rely on the detailed accounting explanations provided and the
critical thinking imparted to a wide variety of stakeholders for effective decision-making; however,
“Enron, WorldCom, and other audit failures serve as prime examples of how incomprehensible
communication can allow a company's problems to be hidden in plain sight” (Kranacher, 2007, p. 80).
The Certified Public Accountant (CPA) summarizes her thoughts with “we are good at 'rithmetic, but we
have miles to go when it comes to reading and writing. Our mandate as a profession is to learn how to
communicate in a cogent, coherent, and comprehensive manner” (Kranacher, 2007, p. 80).
Business research demonstrates that employers have long complained about employees’ oral and
written communication skills. One study, conducted in 1997, “found that employers of recent MBA
graduates of such prestigious programs as the University of Chicago, the University of Pennsylvania's
Wharton School, Harvard Business School and Columbia Business School would grade at least 70
percent of such graduates a ‘C’ or ‘D’ [overall]" (Reinstein, Weirich, & Nellermoe, Managerial Auditing
Journal, 1999, para. 3). When top graduates receive disappointing marks, the negative impact disillusions
the professional and financial community.
The SEC further considers writing skills such a critical component of accounting and financial
standards that it enacted rule #33-7380 to denounce “dense writing styles, legal jargon, and repetitive
disclosure” (Reinstein et al., 1999, para. 5). Referred to as Plain English Writing, the rule specifies six
fundamental principles for clear investment writing: “(1) active voice; (2) short sentences; (3) everyday
language; (4) tabular presentation of complex material; (5) no legal jargon; and (6) no multiple negatives”
(as cited in Reinstein et al., 1999, para. 6).
SOBIE 2014
48
The SEC continues to receive objections, in particular from senior investors, to “arcane, complex,
and incomprehensible language” (Reinstein et al., 1999, para. 8). Consequently, the country’s leading
regulatory agency worries that the growing trend of fewer investors reading individual corporate
prospectuses disguises underlying inflammations destined to periodically fester into epidemic proportions
and doom the country into a continuous history of bubble-bursting economic cycles. Business leaders,
employers, CPAs, and government agencies have long agreed that proficient writing skills are a
fundamental catalyst for economic development; however, the more immediate question is what do
students think of their writing skills?
Perceptions: Why Students Think They are Good Writers.
Simkin, Crews, and Groves (2012) indicate in “Student perceptions of their writing skills: Myth
and reality” that many reasons exist why students often do not possess college-level writing skills: “This
study investigates two of them: (1) students do not believe that good writing skills will be important to
them in their careers, and (2) students perceive that they are already good writers (when in fact they are
not)” (p. 81). According to Simkin et al. (2012), poor writing skills have been a chronic weakness of
college students for 50 years. In addition, the authors list The Dumbest Generation among recent writings
that provide “further evidence of the writing deficiencies of college level students” (as cited in Simkin et
al., 2012, p. 82). Hence, they specify that not only has there been little improvement in comparative
studies over several decades but also that the low writing scores have stabilized in the past 30 years,
making the malady a chronic condition immune to rudimentary measures. Since a higher proportion of
students enter post-secondary institutions today, a higher proportion of college and university students are
poor writers perpetuating a disturbing deviant norm (Simkin et al., 2012).
As in most shared stakeholder conditions, responsibility for this antithesis is alluring and multi-
faceted. The perennial pointer of blame for the plight is placed on parents, education, workplace,
technology, society, and cultural and literary anemia depending on the perspective of the director and the
audience. Student misconceptions can also offer a host of camouflaged explanations: “Wallace (2004)
noted, for example, that the many errors in student résumés and cover letters reflect the attitude that good
writing skills are not important in those jobs not directly requiring them” (as cited in Simkin et al., 2012,
p. 83). In fact, a 2005 study of 1,100 students “supports the likelihood that students do not value good
writing skills. . . apathy, grade inflation, and absenteeism all appear to contribute to a growing loss of
student accountability and perhaps writing skills are among the casualties” (as cited in Simkin et al.,
2012, p. 84).

SOBIE 2014
49
Research Study: 119 Business Majors Evaluate Writing Skills.
Simkin et al. (2012) gathered information from students in five separate, junior-level classes at a
15,000-student western university with 140 students completing the survey. Overall, the objective of the
study was to discover how the students valued their writing skills and abilities. Survey questions asked
students how important they thought their writing abilities would be in the future. Student responses
refuted the first hypothesis presented by Simkin et al. (2012) that students do not value good writing
skills: “105 students thought that their writing ability was likely to be very important to their careers, 35
thought it was going to be somewhat important, and no one thought it was going to be unimportant" (p.
85).
Interestingly, another outcome of the attitudinal questions was that 97%, or 136 students, felt that
“their writing abilities were likely to affect the way others perceived their intelligence, knowledge, or
other capabilities” (Simkin et al., 2012, p. 85). Now this outcome brings some peer pressure into the
equation that has not been discussed previously. One consequential concept is that the members of the Y
Generation appear closely associated with peers who can leverage behavioral changes; according to the
former finding, peers already judge writing ability and assign status, thereby introducing a recognized
value for peer-reviewed writing.
In the Simkin et al. (2012) survey, final questions asked students how they rated their individual
writing ability with response selections provided: excellent, competent, good, or poor. The authors were
not surprised when 135, or 96%, of the respondents rated themselves as average or above, “and only 5
students—less than 4% of our sample—rated themselves as ‘poor’ writers. Clearly, few of the students in
our sample agreed with the general view that students lack good writing skills—at least when rating
themselves” (Simkin et al., 2012, p. 85).
Another question asked was whether any university classes “had helped them improve their
writing abilities” (Simkin et al., 2012, p. 86). Since most of the students were enrolled in a business
writing class, the affirmative answer of 85%, or 119 students, provides promising prospects for the future.
The next meaningful question, for this research paper’s purposes, asked the students about criticism of
their writing skills by parties other than their teachers. A full 45% of the students indicated that only their
teachers had ever criticized their writing, a key finding when investigating explanations as to why
students believe they are good writers in the face of all the research that states otherwise (Simkin et al.,
2012) .The students were then given a grammar test to correlate the link between the students’ self-ratings
and actual results.

SOBIE 2014
50
Simkin et al. (2012) “stated simply, no statistical evidence to support the claim for a relationship
between the student ratings of their writing abilities and the scores on their grammar tests was found” (p.
87). The grammar test was followed up with a vocabulary test with the same results: “no relationship
between the student self-ratings of their writing abilities and the scores on an independent test of such
abilities. This finding supports the claim that most students are unaware of the deficiencies in their
writing skills” (Simkin et al., 2012, p. 88). The findings culminate in a paradigm shift that students do
value writing and do not know that they are poor writers leading to a level of awareness that can be
addressed individually and collectively. Finally, the students were given a writing assignment and the
results demonstrated “an 8% chance of a relationship between ‘writing ability’ and ‘self-rating.’ This
finding again supports the claim that most students are unaware of the deficiencies in their writing skills”
(Simkin et al., 2012, p. 89). The disparity between in-class tests and home writing assignments could
point to increased collaboration or the idea that a few students can construct sentences.
Overall, findings conclude “that students are unaware of their own writing deficiencies, and their
perceptions of their writing abilities were inflated” (Simkin et al., 2012, p. 91). This assumption sounds
like a reasonable area where all of the stakeholders who are committed to improving student writing skills
can find common ground. Identifying a common source can provide a group consensus pathway for
improvement where the individual parties involved collectively participate to address the issue rather than
carry the heavy burden of responsibility.
Definitive Tone: CPAs Do Have To Write.
Chiurri and Varaksina (2006), two accounting students at the University of Massachusetts, place
a definitive tone on their article “End of the Myth: CPAs Do Have to Write,” by interviewing CPAs
Michael Devlin of Grant Thornton and Paul Ferreira of Ercolini & Co. The CPAs describe the primary
written documents with which most CPA firms are involved:
Financial statements and other special reports, which include a firm's opinions;
E-mail correspondence with clients and firm personnel;
Work paper review comments for follow-up by managers and staff; and
Various forms for tax authorities and clients. (Chiurri and Varaksina, 2006, p. 10)
Chiurri and Varaksina (2006) reiterate the “Plain English” rules of the SEC:
1. Active voice. According to experts such as Elizabeth Danziger, “verbs in the active voice
leave a stronger impression on the reader and remove possible ambiguities” (as cited in

SOBIE 2014
51
Chiurri and Varaksina, p. 10). The SEC notes that the subject performing the action in
active voice follows how we process information; whereas, “in passive voice, the action
is performed by somebody or something that may be a disguised outside party”
(Reinstein at al., 1999, p. 487). Strunk and White (1935/1979) declare in, The Elements
of Style: “The habitual use of the active voice makes for forcible writing. This is true not
only in narrative concerned principally with action but in writing of any kind” (p.18).
2. Short sentences that do not require the reader to do “extra work to find the real meaning”
and “a maximum of 18 words per sentence” (Chiurri and Varaksina, 2006, p. 10). Strunk
and White (1935/1979) add: “Vigorous writing is concise. A sentence should contain no
unnecessary words, a paragraph no unnecessary sentences, for the same reason that a
drawing should contain no unnecessary lines and a machine no unnecessary parts” (p.23).
William Strunk, a professor at Cornell University now deceased, is reputed for omitting
needless words, and his “little book” on writing rules is a testament to his succinct beliefs.
3. Everyday language. Reinstein et al. (1999) state that “Clearer communications result when
writers and readers use definite and concrete words. Similarly, providing examples helps
make complex information more understandable” (p. 487). Strunk and White (1935/1979)
illustrate “If those who have studied the art of writing are in accord on any one point, it is
on this: the surest way to arouse and hold the attention of the reader is by being specific,
definite, and concrete” (p.21).
4. Tabular presentation of complex material. White space and organization allows readers to
break down the information quickly without getting lost in the presentation of numbers. It
is important that readers are able to follow the logic of the numerical order marked since
many look for the natural flow to reasonable conclusions.
5. No legal jargon. Accountants want clients to understand the meaning of financial and
investment information, not to be confused by the meaning of the language. Clients are
often wary of legalese until a path is cleared to reasonableness.
6. No multiple negatives. Multiple negatives can create misunderstandings with clients.
Avoiding the use of negatives clarifies the writing and states the action that the client
needs to do positively: “We will send your money within one business day if you include
your tax identification number in your withdrawal request" (Reinstein et al., 1999, p. 486).
CPAs Ferreira and Devlin offer an important overriding suggestion for accounting students
striving to become better writers: “read on a daily basis, including not only professional
literature, but also editorials; do proper research; and plan, edit, and proofread” (Chiurri &
Varaksina, 2006, p. 11). Accounting students can hone their critical thinking and debate skills
by dissecting editorials because of the varied political, economic, and financial views presented.
In summary, the authors concur that “the role of accountants has gone far beyond number-
crunching. Accountants must be effective writers and communicators . . . using precise, clear language to
make documents easy to comprehend, avoiding possible misunderstandings, embarrassment, or even
litigation” (Chiurri & Varaksina, 2006, p. 11). As clearly demonstrated, there is a definite need for
improved writing skills to provide the impetus necessary for accounting student’s personal and

SOBIE 2014
52
professional growth. Today, crunching away on numbers quietly in a hidden cubicle with little client
contact is the role of a computer, not an accountant.
STUDENT WRITING SKILLS FROM A NATIONAL PERSPECTIVE
Flesher et al. (2009) portray Palen as the national heroine of accountancy: “Female accountants
were few in the early years of the profession, but there were pioneering women CPAs, and Jennie May
Palen was one of them” (p.6). CPA Palen was celebrated for her writing skills in crafting speeches and
audit reports while publishing numerous collections. Her total published works are not known because
she also worked as a ghostwriter. She commented on the common practice of her day: "It is a strange
feeling to see every word, every comma that you have written appear under someone else's name" (as
cited in Flesher et al., 2009, p.6).
Historically, her advanced thoughts continue to breathe through her legacy contribution to J.K.
Lasser’s Standard Handbook for Accountants published in 1956. Palen stressed the important relationship
between accounting and writing for effective communications with words: “Caution demands
precision—in thinking, in accumulation of data, in grammatical construction, and in the use of words. . .
Clarity requires not only that a statement can be understood but that it cannot reasonably be mistaken” (as
cited in Flesher et al., 2009, p. 6).
Nationally: Compliance and Complexity Drives Demand.
Firch, Campbell, Filling, and Lindsay (2011), American Journal of Business Education,
nationally illustrate that “today’s financial reporting environment is heavily oriented toward compliance
issues. Evaluating and documenting compliance involves text preparation and review rather than
computation” (p. 15). The authors further discuss the extensive documentation and research that is
required to “demonstrate compliance with complicated rules and guidelines which are promulgated in
written form. Whether these rules and guidelines are available in paper volumes or via computerized
databases, students are expected to research, understand, and write in this environment” (Firch et al.,
2011, p.16). Growing demands in the marketplace have necessitated an emphasis on improving
accounting students’ writing abilities.
Accompanying the idea of improving writing skills is the need for the measuring of outcomes.
The authors suggest an assessment with an internal and external approach. The internal approach depends

SOBIE 2014
53
upon progress measurements in the writing skills course, advancement to the Masters level program, and
CPA exam results. External measurements are more difficult to quantify; therefore, the authors
recommend active area professional input. Both internal and external assessments, as defined by Firch et
al. (2011), are continuously tracked in the University of West Florida College of Business to serve the
needs of the professional community.
In a letter to the editor of The CPA Journal, Thompson (2010) writes “Clear, concise
exposition of facts, methods, and conclusions is an ever-more-vital part of any CPA's skill set,”
(p. 15). Thompson describes the long history of writing being evaluated in the CPA exam with his
experience in 1974. He further reflects that in the 1990s, when the CPA exam converted to computerized
tests, there was discussion about removing written-response questions with an immediate outcry from
practitioners, including his own, that resulted in the retention of the written-response questions
(Thompson, 2010). He concludes his letter with a personal insight: “In a world where spin professionals
seem bent on distorting any fact to fit their purpose, the plain truth of a clear train of thought from data
and analysis through conclusion and explanation is the best means of persuading users of the value of our
work” (Thompson, 2010, p.15).
Research Study: Accounting Majors’ Perceptions of Future Career Skills
Parham, Noland, and Kelly (2012) outline their findings in “Accounting majors’ perceptions of
future career skills: An exploratory analysis,” American Journal of Business Education. The study sample
consisted of 205 students enrolled in Georgia Southern University:
Forty-six percent of the students in the sample were accounting majors. Seven percent of the
respondents were finance or economics majors, four percent were information technology and
information systems majors, and 15 percent were management, marketing, or logistics majors. (Parham
et al., 2012, p.29)
The College of Business Administration at the university is accredited by the Association to Advance
collegiate Schools of Business (AACSB) International.
This study presents the top nine skills that students “deem to be important for their future careers.
Many of the skills accounting majors ranked as important for their future were not surprising” (Parham et
al., 2012, p.29). What is a credible outcome is further verification of the Simkin et al. (2012) study on

SOBIE 2014
54
“Student perceptions of their writing skills: Myth and reality” cited previously. The Accounting majors in
this study also identified the importance of written and oral communication as well as giving high marks
to the additional soft skill selections of “professional demeanor, motivation, decision making,
interpersonal skills, analytical and critical thinking, leadership, and teamwork” (Parham et al., 2012,
p.29).
TEACHING TACTICS FOR IMPROVING WRITING SKILLS
Reinstein and Trebby (1997) write that CPAs need to “elevate their critical thinking to grasp the
meaning of increasingly complex concepts and principles, to judge and apply these concepts and
principles to specific issues, and then to communicate the results effectively to others” (p. 105). The
authors’ teaching objective is to correlate the intimacy between thinking skills and effective writing by
assigning brief position papers. They emphasize brevity because “a paper should not seek to incorporate
all that a writer knows about the subject; rather, the writer should focus on material that is relevant and
specific to the readers’ needs” (Reinstein & Trebby, 1997, p. 106). In class, a classmate surmises that
only one written page is necessary because time constraints take priority. My response is that the above
exercises can aid students in developing a one-page presentation effectively required to present the
principle in a coherent and cohesive manner. Clients and the firm’s partners may want to only see a brief
presentation; however, they also expect assurance that the discovery process is thorough and complete.
Etter and Ross (2013) stress improving reading skills as a tactical pathway to improving writing
skills: “Many college students are poor readers who are unfamiliar with a significant number of the
issues, concepts, procedures, and technology used in the accounting profession” (p.595). They suggest
that exposure to professional articles gives students the practice and experience in analysis and
argumentation that professional accountants use. As an active learning exercise, they assign written article
summaries from a reading list of professional journals and magazines that allow students to stay abreast
of recent accounting developments while building comprehensive and critical thinking skills (Etter &
Ross, 2013).
In addition, Irving (2011) drives the reading road into research by using a “pedagogical approach
which fosters active learning” (p. 287). In his classes, students read and discuss excerpts from
professional journals in relationship to accounting topics which are crafted to increase database research,
critical thinking, and communication skills. Then students work in small teams, enhancing student
learning through collaboration and development of cooperative learning skills, to support or disprove
selected hypotheses with written research from supplementary materials. Irving indicates that “results
from a survey created to assess this research experience reveal that 94 percent of respondents indicated
SOBIE 2014
55
this project substantially improved their level of knowledge, skills, and abilities related to accounting” (p.
287).
In the University of West Florida (UWF) business writing class, a librarian presents professional
journal databases with navigational instructions. Oftentimes, students are in awe of the breadth of the
peer-reviewed scholarly journals available. This experiential learning allows students to build perspective
in their reading acumen by exposing them to multi-layered disciplines investigating common topics.
Working in small groups encourages students to gain communication skills as well as fortify writing
deficiencies. Relinquishing control is generally as difficult for many students as it is for many
professionals.
Educators and students are fast realizing the benefits of building cognitive skills through small
team work. Glenn, Goldwaithe, and Connors (2008), in The St. Martin’s Guide to Teaching Writing, task
groups with even more responsibility, indicating that their “primary use lies in providing advice about
revising and practice in editing” (p. 66). Authors also suggest using peer review from the standpoint of
two student readers for each written piece. Multiple viewpoints allow student writers to experience varied
perspectives; in addition, the student evaluators frequently find support for their comments within the
group. As a follow-up, evaluators are encouraged to provide written responses that can be clipped to the
written draft because they become more concrete tools for rewrite than discussion alone (Glenn et al.,
2008).
The St. Martin’s Guide to Teaching Writing provides standards and specific questions for students
and educators to evaluate groups as well; whereas, many groups are evaluated at the end of project period,
Glenn et al. (2008) suggest that “after one or two sessions of students working in their writing groups on
their own, try asking for a brief, written evaluation of the group’s effectiveness” (p.69). Another tried and
true tactic that the teaching dispatch offers is designed to encourage a more meaningful and structured
peer-review experience; the authors provide a handy desktop guide with detailed student instructions for
reviewing writing (Glenn et al., 2008).
(Please see Appendix: Figure I. The St. Martin’s Guide to Teaching Writing, Glenn, Goldwaithe, and
Connors. Copyright 2008 by Bedford/St. Martins. Used with permission of the publisher.)
Micciche (2004), Making a case for rhetorical grammar, elevates the discussion of persuasive
writing further by presenting grammar as a rhetorical tool: “The study of rhetorical grammar can

SOBIE 2014
56
demonstrate to students that language does purposeful, consequential work in the world—work that can
be learned and applied” (p.716). She links teaching grammar as central to teaching thinking because
developing sentences requires a conceptual ability to envision relationships between ideas which require
identification with and reflection about the reader.
Pronoun use, active or passive verb constructions, and sentence patterns represent relations
between writers and the world that envelops them. Word choice is an expression of the way that we
position ourselves to others. How we put our ideas into words is a dynamic process with continuous
contractions and expansions; therefore, rhetorical grammar instruction is foundational to articulating ideas
(Micciche, 2004). She deftly illustrates “how a well-coordinated sentence can keep your reader
breathlessly moving with you, how techniques that create rhythm and emphasis heighten the feeling being
conveyed, and how subordination expresses relationships among ideas” (Micciche, 2004, p. 721).
Her teaching tactic is the book, where students copy passages from their favorite medium and
follow each entry with a paragraph of analysis on grammar technique. Objectively, Micciche wants
students to learn the strategic association between what is being said and how it is being said.
Subjectively, she wants students to document and reflect on grammar at work in theirs and others’ writing
(Micciche, 2004). Micciche’s twenty-two page essay is a composition of the symphonic and sensuous
melodies of grammar where students can be inspired, like the Sistine Chapel, by an illustration of what is
possible with grammar, not just what is probable.
Elbow (1975), another favorite writing author, takes an entirely different tact in his book,
Writing without Teachers, by declaring: “Freewriting may seem crazy but actually it makes
simple sense” (p.4). It is a concept of non-editing: “Make some words, whatever they are, and reel in as
hard as you can. Afterwards you can throw away lousy beginnings and make new ones. This is the
quickest way to get into good writing” (p. 6). Elbow (1975) pursues ten-minute writing sessions as his
contribution to classroom exchange. He encourages students to freewrite about the topic of their choice.
He surmises that students will produce much more poor writing than good, but the rare good pieces will
be their best writing. Elbow adds that freewriting is very productive when trying to find subjects to write
about: “Afterward look to see what words or passages seem important—attracted energy or strength. Here
is your cue what to write” (p. 9).
English teachers who teach writing often recommend Elbow (1975) because the practices add so
much variety to the classroom experience. The variation is especially evident with numbers-oriented

SOBIE 2014
57
students because their lack of writing experience poses a high hurdle. To give students the opportunity to
freely express their innermost thoughts without structural constraints is a new experience that many
scholars find uncomfortable; in the end, the dedicated learners deftly conquer the unknown, calm the
inner turbulence, and move ahead to attack the next dilemma because they know that confronting
regulatory codes, solving client problems, and making sense of the unexplainable is all part of the daily
routine in the accounting profession.
IMPROVING WRITING SKILLS IN BUSINESS WRITING STUDIES
Matherly and Burney (2009), Using Peer-Reviewed Writing in the Accounting Curriculum: A
Teaching Note, write that faculties recognize the need to improve the quality of
their business writing; “at the same time, we often struggle to find sufficient time to cover course content.
. . In this teaching note, we describe a writing framework that is a manageable tool for integrating writing
activities into courses” (p.393). The framework incorporates peer review (a typical accounting task) and
repetition that prior research suggests lead to writing improvements. Added benefits are engaging students
in critical thinking activities and exposing them to more grammar content through handouts. Using a
sample of 155 students, findings support that the framework improves students’ written communication
(Matherly & Burney, 2009).
The Matherly and Burney (2009) framework requires students to complete three rounds of
assignments, “each of which involves four activities: (1) a first-round draft of the assignment, (2) an out-
of-class, blind peer review, (3) an in-class, blind peer review and (4) a revised version of the writing
assignment” (p.394). This integration of writing as a component of the curriculum studies is beneficial to
students because they are writing about subjects in their field. In many of the University of West Florida
Accounting classes, writing elements are routinely integrated in the form of position papers, ethics
stances, tax defenses, and financial statement research segments. Many of these activities are
subsequently turned into small group presentations.
Matherly and Burney (2009) distribute “Minimum Writing Rules” and describe the peer-review
process and the grading used for evaluation. The rules review many common mistakes made by business
writers and provides grammar guidelines including the following sampling:
1. ALWAYS RUN SPELL/GRAMMAR CHECK.
SOBIE 2014
13
2. ‘‘It’’ refers to a thing, while ‘‘they’’ refers to humans. A company is a ‘‘thing,’’ so do
not use the pronoun ‘‘they’’ when referring to a company—the proper pronoun is ‘‘it.’’
3. ‘‘Its’’ is possessive, while ‘‘it’s’’ means ‘‘it is.’’
4. ‘‘This’’ should not be used as a noun. Instead, use ‘‘this’’ as an adjective or adverb
(i.e., improper use would be—‘‘this leads to confusion’’—‘‘this’’ what?).
5. A singular antecedent (manager) requires a singular pronoun (such as he or she).
(Matherly & Burney, 2009, p. 400)
UWF Business Writing
The UWF College of Business is accredited by AACSB International and “fewer than 4.7% of
business schools worldwide have earned this education standard” (UWF College of Business, 2014, para.
6). In addition, according to the National Association of State Board of Accountancy (NASBA), the UWF
Department of Accounting and Finance is “ranked No. 5 in the U.S. for first-time pass rates by small
accounting programs on the CPA exam” (as cited in UWF Online Newsroom, 2013, para. 1). To ensure
high written communication standards, business majors must complete a semester-long business writing
theory and practice class in addition to achieving ongoing writing proficiencies in major core classes.
In UWF’s Writing for Business: Theory & Practice class, grammar review, small group activities,
research writing, and various types of business documents accompanied by oral and written presentations
provide foundational curriculum supported by instructional lectures. The class operates in a computer lab
with the latest in “smart” technology available to students. Timed tests include grammar sections and
business letters and memos written in class. This educational experience is a Gordon Rule course
requiring that students write a minimum of 6,000 words. Many students accomplish that requirement
within the required research paper.
In Real Good Grammar Too: A Handbook for Students and Professionals, Hixon (1997) provides
grammar guideposts with “Your Turn” exercises. Hixon’s extensive supplementary materials are used in
the following areas: Diction, Quotation Technique, Pronoun Case, Pronoun Reference and Antecedent
Agreement, Semicolons and Colons, Subject-Verb agreement, Verb Forms and Tenses, Hyphenation,
Capitalization, Commas, Possessives/Apostrophes, Adjectives and Adverbs, Dangling and Misplaced
Modifiers, Parallelism, Faulty Comparisons, and Sentence Errors. (Please see Appendix: Figure II. for
Diction/Usage sample, ‘Your Turn’ Test, and Answer Key. Reprinted with permission by M. Hixon.)
The UWF Writing for Business: Theory & Practice class trains students to produce appropriate
business messages including electronic messages and digital media, memorandums versus emails,
business proposals and business reports, positive messages, persuasive messages, and negative messages.

SOBIE 2014
58
As potential managers, it is paramount that students learn what vehicles can communicate messages
effectively. Helen Soter, UWF Writing for Business: Theory & Practice instructor, stresses proficient
patterns designed to portray the business in a consistently professional manner. Further, this instructor is
intent on preparing students for studies and careers with accelerated expectations because professional
writing is a way of life in business.
The business writing class features a semester-long assignment with instruction on how to
properly develop, write, and execute formal research. Choosing from two topics, the class project is
broken into four components: scholarly sources and an early draft of the formal report, workshop
involving peer-review of formal report, paper-reading done in the writing lab, and final written
presentation of the formal report. This is followed by a separate oral presentation of the project. While
working on this project, students are simultaneously instructed on such important topics as plagiarism and
APA format. The initiative provides a foundational cornerstone that is fundamental to the success of
students in future studies and business careers.
UWF Writing Lab
An important tool in the student’s writing arsenal is the Writing Lab where Ms. Hixon specially
trains teams of grammarians and complements them with a state-of-the-art writing website. The UWF
Writing Lab supports all majors and provides students with a professional resource that equals the
nationally reputed bellwether Purdue Owl. The Writing Lab offers a comprehensive diagnostic test used
in business writing to identify skill proficiencies and weekly sessions crafted to refresh student writing
skills in identified areas. Another important service offered by the Writing Lab is paper review which is
mandatory for business writing research.
UWF College of Business Writing Lab
The UWF College of Business Writing Lab is a satellite of the Writing Lab located in the new
College of Business Education Center. Staffed by specially-trained students, the COB Writing Lab works
exclusively with Business majors reviewing papers on topics from complex financial principles to policy
strategies. The specialized resource is invaluable to Writing for Business: Theory & Practice students in
their quest to prepare formal research projects.
Conclusions and Recommendations

SOBIE 2014
59
Excellent writing skills in business are no longer an art of the few, but a mandate for the many. In
our interdependent micro and macro global economy, competitive forces are intense. This scenario
requires enhanced actions not only from the best and the brightest, but also from the average and the
solid. Accounting students preparing to manage financial concerns at home and in international waters
should listen to the advice of so many CPAs in practice and understand that writing ability is equated to
critical thinking which is paramount to business growth. Heightened norms in writing, analysis, and
cognitive skills are vital to accounting students today because the activity of crunching numbers in a
distant cubicle has been replaced by a computer. The accountancy professional is meeting clients,
auditing books, researching options, leading team collaborations, teaching complex principles,
deciphering government regulations, filing returns, and crafting financial blueprints that ensure clients,
communities, businesses, countries, and firms a viable financial future.
On the basis of these findings, the need does exist to improve writing skills in business generally
and accounting specifically because they are linked with cognitive abilities required for leadership in a
highly competitive global environment. Technology is a tool developed by thinking professionals to
devise new economic navigational charts for expanding markets.
Teachers, as expected, are on the cutting edge of improving student writing skills because they understand
the work that needs to be accomplished. What stakeholders, including students, need is an attitudinal
shift of priorities because many believe that they are good writers when all of the scholarly research and
the test scores prove that they are not.
If a picture is worth a thousand words, then an illustration is worth 10,000 words. A business
writing classmate in Helen Soter’s office redoing a writing assignment exclaimed, “But you don’t
understand, I was accepted at Florida State and the University of Florida. I am a smart kid. I had no idea
that this class would be so hard.” Helen Soter smiled knowingly and replied, “Yes, we do have high
standards at UWF, and you did do so much better on your revised assignment. Keep up the good work.”
The conclusion of this paper is that stakeholders need to champion a collective paradigm shift to
improve student cognitive and writing skills with emphasis on the financial governance field of
accountancy. Parents, educators, churches, firms, technology agents, societal groups, cultural segments,
and literary forces need to focus on improving students’ writing skills because there is a direct correlation
between writing and critical thinking skills and as CPA Palen so eloquently stated, “If the accountant’s
practice is to grow, so must his (or her) ideas” (as cited in Flesher et al., 2009, p.6).
REFERENCES
Bruzzese, A. (2014, Jan 12). “Digital natives need ‘soft skills’ to secure a job.”

SOBIE 2014
60
Pensacola News Journal, p. 3F.
Chiurri, M., & Varaksina, A. (2006). “End of the myth: CPAs do have to write.” CPA Journal, 76(5), 10-
11.
Elbow, P. (1975). Writing without teachers. New York, NY: Oxford University Press.
Etter, E. & Ross, B. (2013). “The use of article summaries in accounting courses: Improving students'
reading comprehension, learning, thinking, and communication skills.” American Journal of Business
Education (Online), 6(6), 595.
Firch, T., Campbell, A., Filling, S., & Lindsay, D. (2011). “An accounting writing proficiency survey.”
American Journal of Business Education, 4(4), 15-23.
Flesher, D., Previts, G., & Sharp, A. (2009). “Jennie May Palen, accountant and poet, 1891-
1990: The writing dimension of accounting.” The CPA Journal, 79(12), 6+.
Glenn, C., Goldwaithe, M., & Connors, R. (2008). The St. Martin’s Guide to Teaching Writing. Boston,
MA: Bedford/St. Martin’s.
Hixon, M. (1997). Real Good Grammar Too: A Handbook for Students and Professionals.
Pensacola, Florida: University of West Florida.
Irving, J. H. (2011). “Integrating research into an undergraduate accounting course.” Issues in Accounting
Education, 26(2), 287-303.
Kranacher, M. (2007). “'The problem with communication ...'” The CPA Journal, 77(7), 80.
Matherly, M. & Burney, L. (2009). “Using peer-reviewed writing in the accounting curriculum: A
teaching note.” Issues in Accounting Education, 24(3), 393-413.

SOBIE 2014
61
Micciche, L. (2004). “Making a case for rhetorical grammar.” College Composition and Communication,
55(4), 716-737.
Parham, A., Noland, T. & Kelly, J. (2012). “Accounting majors' perceptions of future career skills: An
exploratory analysis.” American Journal of Business Education (Online), 5(1), 29.
Reinstein, A., & Trebby, J. (1997). “How accounting educators can help improve their students' writing
skills.” Journal of Education for Business, 73(2), 105-113.
Reinstein, A., Weirich, T., & Nellermoe, D. (1999). “Implications of US Securities and Exchange
Commission rule #33-7380 in the improvement of accounting students' writing skills.” Managerial
Auditing Journal, 14(9), 479-486.
Simkin, M., Crews, J., & Groves, M. (2012). “Student perceptions of their writing skills: Myth and
reality.” Journal of Business and Management, 18(1), 81-95.
Strunk, W., & White, E.B. (1935/1979). The Elements of Style. New York, N.Y. MacMillan.
Thompson, T. (2010). “Writing and the CPA exam.” The CPA Journal, 80(2), 15.
UWF College of Business. (2014). In UWF’s online website. Retrieved from http://uwf.edu/cob/
UWF Online Newsroom. (2013). UWF top ranked in nation. Retrieved from UWF online http://news
.uwf.edu/index.php/2013/03/university-west-florida-top-ranked-nation-florida-cpa
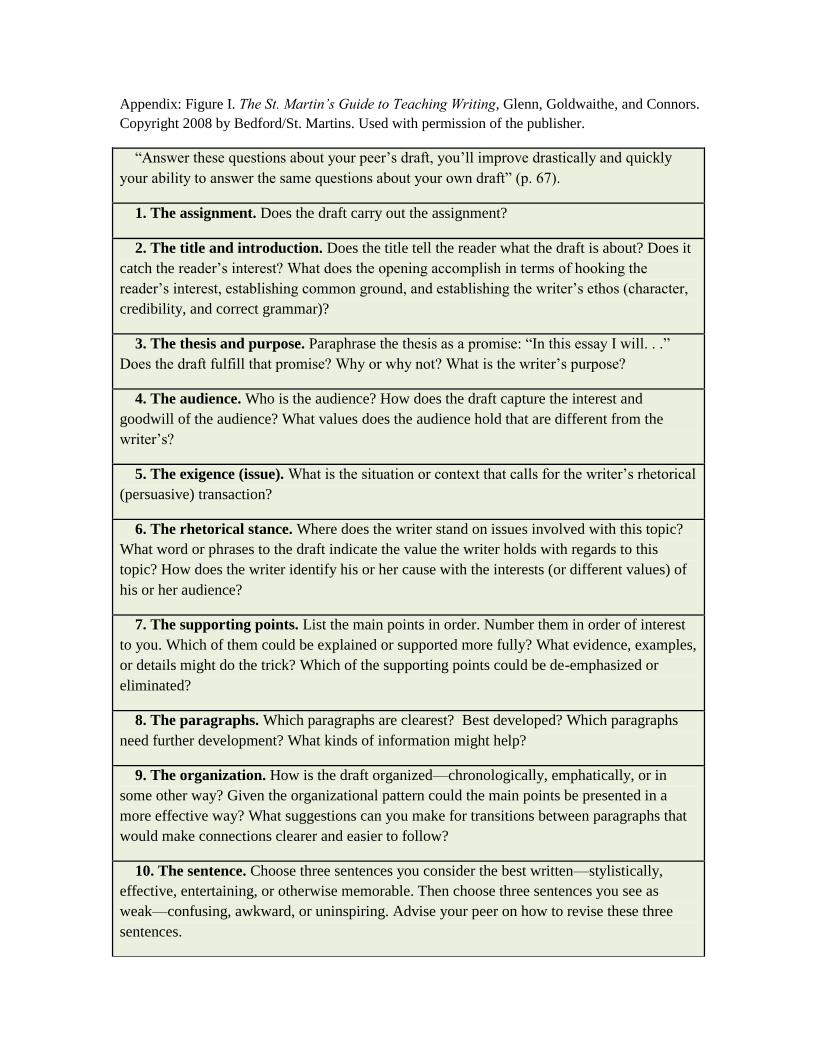
Appendix: Figure I. The St. Martin’s Guide to Teaching Writing, Glenn, Goldwaithe, and Connors.
Copyright 2008 by Bedford/St. Martins. Used with permission of the publisher.
“Answer these questions about your peer’s draft, you’ll improve drastically and quickly
your ability to answer the same questions about your own draft” (p. 67).
1. The assignment. Does the draft carry out the assignment?
2. The title and introduction. Does the title tell the reader what the draft is about? Does it
catch the reader’s interest? What does the opening accomplish in terms of hooking the
reader’s interest, establishing common ground, and establishing the writer’s ethos (character,
credibility, and correct grammar)?
3. The thesis and purpose. Paraphrase the thesis as a promise: “In this essay I will. . .”
Does the draft fulfill that promise? Why or why not? What is the writer’s purpose?
4. The audience. Who is the audience? How does the draft capture the interest and
goodwill of the audience? What values does the audience hold that are different from the
writer’s?
5. The exigence (issue). What is the situation or context that calls for the writer’s rhetorical
(persuasive) transaction?
6. The rhetorical stance. Where does the writer stand on issues involved with this topic?
What word or phrases to the draft indicate the value the writer holds with regards to this
topic? How does the writer identify his or her cause with the interests (or different values) of
his or her audience?
7. The supporting points. List the main points in order. Number them in order of interest
to you. Which of them could be explained or supported more fully? What evidence, examples,
or details might do the trick? Which of the supporting points could be de-emphasized or
eliminated?
8. The paragraphs. Which paragraphs are clearest? Best developed? Which paragraphs
need further development? What kinds of information might help?
9. The organization. How is the draft organized—chronologically, emphatically, or in
some other way? Given the organizational pattern could the main points be presented in a
more effective way? What suggestions can you make for transitions between paragraphs that
would make connections clearer and easier to follow?
10. The sentence. Choose three sentences you consider the best written—stylistically,
effective, entertaining, or otherwise memorable. Then choose three sentences you see as
weak—confusing, awkward, or uninspiring. Advise your peer on how to revise these three
sentences.

SOBIE 2014
63
11. The words. Circle the words that are particularly effective; underline those that are
weak, vague, or unclear. Do any words need to be defined or replaced? Are there any
potentially offensive words in the draft?
12. The tone. What dominant impression does the draft create—serious, humorous, satiric,
persuasive, argumentative, or objective? Is the tone appropriate to the topic and audience? Is
it consistent? Mark specific places where the writer’s voice came through most clearly. Ask
the writer if this is the intended tone—and if he or she finds your comments surprising?
13. The conclusion. Does the draft conclude in a memorable way? Does it end abruptly?
Trail off? Restate the introduction? If you like the conclusion, give two reasons why.
14. Final thoughts. What are the main strengths of this draft? Weaknesses? What
surprised you—and why? What do you want to know more about? What is the writer’s single
most important comment or point? (P.68)

SOBIE 2014
64
Appendix: Figure II. Diction/Usage sample, ‘Your Turn’ Test, and Answer Key (Hixon,
1997, p.71,83-84). Reprinted with permission by M. Hixon.

SOBIE 2014
65
Real Good Grammar Too: Diction/Usage Test and Key (Hixon, 1997, p. 83-84).

SOBIE 2014
66
Real Good Grammar Too: Diction/Usage Test and Key continued (Hixon, 1997, p. 84)
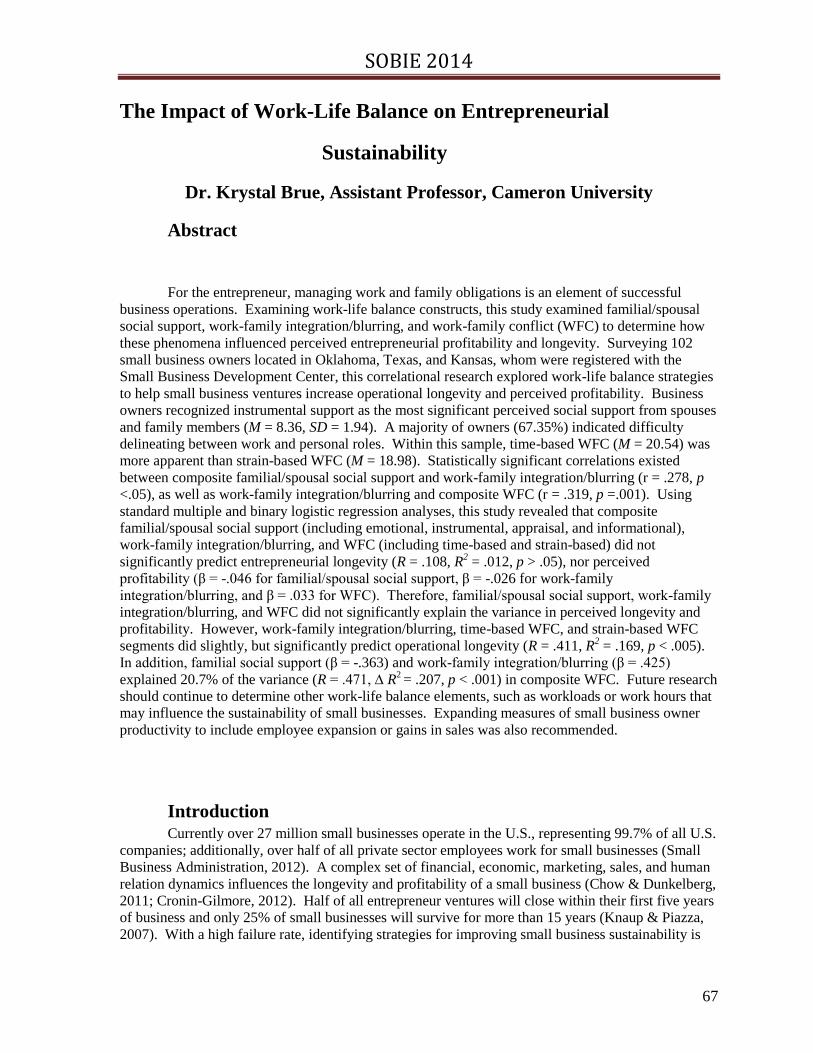
SOBIE 2014
67
The Impact of Work-Life Balance on Entrepreneurial
Sustainability
Dr. Krystal Brue, Assistant Professor, Cameron University
Abstract
For the entrepreneur, managing work and family obligations is an element of successful
business operations. Examining work-life balance constructs, this study examined familial/spousal
social support, work-family integration/blurring, and work-family conflict (WFC) to determine how
these phenomena influenced perceived entrepreneurial profitability and longevity. Surveying 102
small business owners located in Oklahoma, Texas, and Kansas, whom were registered with the
Small Business Development Center, this correlational research explored work-life balance strategies
to help small business ventures increase operational longevity and perceived profitability. Business
owners recognized instrumental support as the most significant perceived social support from spouses
and family members (M = 8.36, SD = 1.94). A majority of owners (67.35%) indicated difficulty
delineating between work and personal roles. Within this sample, time-based WFC (M = 20.54) was
more apparent than strain-based WFC (M = 18.98). Statistically significant correlations existed
between composite familial/spousal social support and work-family integration/blurring (r = .278, p
<.05), as well as work-family integration/blurring and composite WFC (r = .319, p =.001). Using
standard multiple and binary logistic regression analyses, this study revealed that composite
familial/spousal social support (including emotional, instrumental, appraisal, and informational),
work-family integration/blurring, and WFC (including time-based and strain-based) did not
significantly predict entrepreneurial longevity (R = .108, R2 = .012, p > .05), nor perceived
profitability (β = -.046 for familial/spousal social support, β = -.026 for work-family
integration/blurring, and β = .033 for WFC). Therefore, familial/spousal social support, work-family
integration/blurring, and WFC did not significantly explain the variance in perceived longevity and
profitability. However, work-family integration/blurring, time-based WFC, and strain-based WFC
segments did slightly, but significantly predict operational longevity (R = .411, R2 = .169, p < .005).
In addition, familial social support (β = -.363) and work-family integration/blurring (β = .425)
explained 20.7% of the variance (R = .471, ∆ R2 = .207, p < .001) in composite WFC. Future research
should continue to determine other work-life balance elements, such as workloads or work hours that
may influence the sustainability of small businesses. Expanding measures of small business owner
productivity to include employee expansion or gains in sales was also recommended.
Introduction Currently over 27 million small businesses operate in the U.S., representing 99.7% of all U.S.
companies; additionally, over half of all private sector employees work for small businesses (Small
Business Administration, 2012). A complex set of financial, economic, marketing, sales, and human
relation dynamics influences the longevity and profitability of a small business (Chow & Dunkelberg,
2011; Cronin-Gilmore, 2012). Half of all entrepreneur ventures will close within their first five years
of business and only 25% of small businesses will survive for more than 15 years (Knaup & Piazza,
2007). With a high failure rate, identifying strategies for improving small business sustainability is

SOBIE 2014
68
essential.
Distinctly evident in small business ventures is the impact of work and family obligations on
the success of a business (Werbel & Danes, 2010). Increasing the overlap between work and family
domains has resulted in a spectrum of outcomes ranging from failing to manage competing work-
family demands to mutually benefiting role participation within each domain (Michel & Clark, 2009;
Michel, Mitchelson, Pichler, & Cullen, 2010; Winkel & Clayton, 2010). Poorly managed work-
family conflict (WFC) has led to a decreased sense of work-life balance, increased perceptions of
time pressure, a decline in work satisfaction and success, as well as an amplification of the cognitive
dissonance between the demands of family and work (Hilbrecht, Shaw, Johnson, & Andrey, 2008).
Work and non-work domains have increasingly overlapped as employees progressively feel the
effects of conflict between personal lives, family, and work (Lazar, Osoian, & Ratiu, 2010).
The purpose of this correlational study was to explore perceived familial/spousal social
support, work-family integration/blurring, and WFC to discover their statistical predictive
relationships with small business perceived profitability and longevity. The objective was to clarify
the familial/spousal social support, work-family integration/blurring, and WFC as perceived by the
small business owner and examine the relationship between these constructs and perceived
profitability and longevity. Three established scales were used to determine participants’ perceptions
regarding work-life balance constructs of social support, work-family integration/blurring, and WFC.
Examining sources of familial/spousal social support used in reducing WFC, Parasuraman,
Greenhaus, and Granrose’s (1992) social support scale was used to assess the emotional,
instrumental, appraisal, and informational types of support provided by family members and spouses,
which may affect the respondent at work. The Work-Family Integration-Blurring scale developed by
Desrochers, Hilton, and Larwood (2005) was used to examine the integration of work and family
roles. Carlson, Kacmar, and Williams’ (2000) WFC scale was used to assess time-based and strain-
based conflict and its effect on the homeostasis between home and work.
Theoretical Framework
Broadly focused on the daily management that occurs between work and non-work activities,
work-life balance encompasses both the harmony and interference that occurs between paid work and
non-work activities (Chang, McDonald, & Burton, 2010). Work-life interference, also called work-
life conflict or WFC, is comprised of two distinct yet linked concepts: work interfering with family
and family interfering with work (Chang et al., 2010; Moreno-Jiménez et al., 2009). WFC has been
identified as the antecedent to work-life imbalance as well as other organizational employee wellness
issues such as stress, professional burnout, poor organizational citizenship behaviors, turnover, and
absenteeism (Al-Qutop & Harrim, 2011; Chang et al., 2010; Maertz & Boyar, 2011; Steinmetz, Frese,
& Schmidt, 2008; ten Brummelhus & van der Lippe, 2010). In order to promote improved quality of
life, minimize job dissatisfaction, work fatigue, and absenteeism, as well as expand work performance
and organizational commitment, Human Resource (HR) managers have initiated work-life policies
giving employees improved scheduling flexibility, child and adult care services, and peer/supervisor
emotional support (Breaugh & Frye, 2008; ten Brummelhuis & van der Lippe, 2010). While these
HR initiatives have proven their value in mid to large organizations (Quick, Henley, & Quick, 2004),
small businesses are limited in their financial resources available to assist in managing work-life
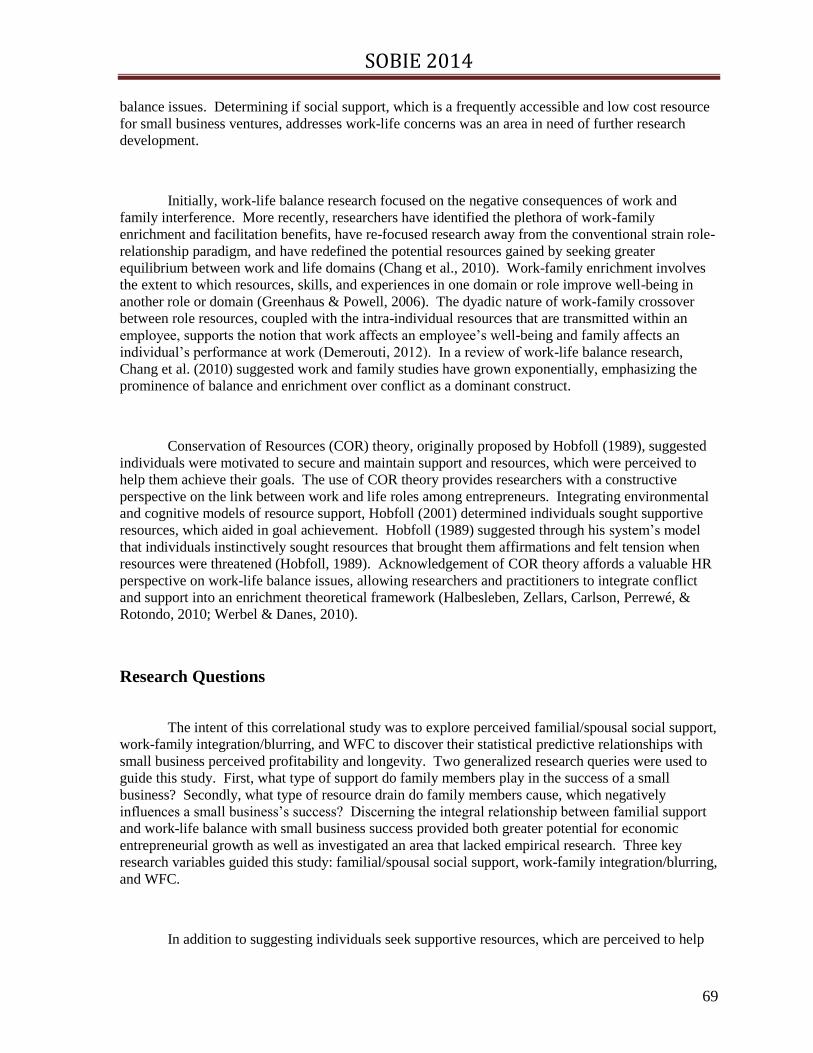
SOBIE 2014
69
balance issues. Determining if social support, which is a frequently accessible and low cost resource
for small business ventures, addresses work-life concerns was an area in need of further research
development.
Initially, work-life balance research focused on the negative consequences of work and
family interference. More recently, researchers have identified the plethora of work-family
enrichment and facilitation benefits, have re-focused research away from the conventional strain role-
relationship paradigm, and have redefined the potential resources gained by seeking greater
equilibrium between work and life domains (Chang et al., 2010). Work-family enrichment involves
the extent to which resources, skills, and experiences in one domain or role improve well-being in
another role or domain (Greenhaus & Powell, 2006). The dyadic nature of work-family crossover
between role resources, coupled with the intra-individual resources that are transmitted within an
employee, supports the notion that work affects an employee’s well-being and family affects an
individual’s performance at work (Demerouti, 2012). In a review of work-life balance research,
Chang et al. (2010) suggested work and family studies have grown exponentially, emphasizing the
prominence of balance and enrichment over conflict as a dominant construct.
Conservation of Resources (COR) theory, originally proposed by Hobfoll (1989), suggested
individuals were motivated to secure and maintain support and resources, which were perceived to
help them achieve their goals. The use of COR theory provides researchers with a constructive
perspective on the link between work and life roles among entrepreneurs. Integrating environmental
and cognitive models of resource support, Hobfoll (2001) determined individuals sought supportive
resources, which aided in goal achievement. Hobfoll (1989) suggested through his system’s model
that individuals instinctively sought resources that brought them affirmations and felt tension when
resources were threatened (Hobfoll, 1989). Acknowledgement of COR theory affords a valuable HR
perspective on work-life balance issues, allowing researchers and practitioners to integrate conflict
and support into an enrichment theoretical framework (Halbesleben, Zellars, Carlson, Perrewé, &
Rotondo, 2010; Werbel & Danes, 2010).
Research Questions
The intent of this correlational study was to explore perceived familial/spousal social support,
work-family integration/blurring, and WFC to discover their statistical predictive relationships with
small business perceived profitability and longevity. Two generalized research queries were used to
guide this study. First, what type of support do family members play in the success of a small
business? Secondly, what type of resource drain do family members cause, which negatively
influences a small business’s success? Discerning the integral relationship between familial support
and work-life balance with small business success provided both greater potential for economic
entrepreneurial growth as well as investigated an area that lacked empirical research. Three key
research variables guided this study: familial/spousal social support, work-family integration/blurring,
and WFC.
In addition to suggesting individuals seek supportive resources, which are perceived to help
SOBIE 2014
70
them achieve their goals, COR theorists proposed the potential loss of resources or support triggered
individuals to engage in behaviors designed to avoid further loss (Hobfoll, 2001). Spouses and
family members of small business owners have provided needed supporting resources to aid in the
business’s survival as well as needed instrumental and emotional support essential in reducing
emotional exhaustion depletion (Halbesleben et al., 2010). Realizing that spousal and familial
support played a critical role in work and family satisfaction (Halbesleben et al., 2010), this study
examined if spousal and familial support moderated the work-related strain of owning a small
business.
The stress that small business owners feel combining work and family domains is significant
(Leaptrott, 2009; Werbel & Danes, 2010). Familial/spousal social support, which eases this stress,
can take several forms. Emotional support (empathy, care, concern, and trust), instrumental support
(time, money, resources, responsibility, and energy), appraisal support (assessment, consideration,
approval, and opinion), and informational support (advice, insights, and suggestions) are essential in
reducing WFC and increasing work-life balance (van Daalen et al., 2006). The concepts of
emotional, instrumental, appraisal, and informational supports have not been investigated within a
small business context. Understanding how these support tactics help or hinder a small business’s
success will help further perpetuate elemental economic growth.
Considering small business sustainability, familial/spousal social support, work-family
integration/blurring, and WFC, the following research questions guided this study.
Q1. What is the predictive relationship of familial/spousal social support, work-family
integration/blurring, and WFC on small business longevity?
Q2. What is the predictive relationship of familial/spousal social support, work-family
integration/blurring, and WFC on small business owner’s perceived profitability?
Hypotheses
When considering the predictive relationship between emotional, instrumental, appraisal, and
informational types of familial/spousal social support, work-family integration/blurring, and time-
based and strain-based WFC, on a small business’s longevity (Q1), the following hypotheses apply.
H10. Participant perceived familial/spousal social support, work-family integration/blurring,
and WFC does not statistically significantly explain the variance in participant perceived
small business longevity.
H1a. Participant perceived familial/spousal social support, work-family integration/blurring,
and WFC does statistically significantly explain the variance in participant perceived small
business longevity.
SOBIE 2014
71
When considering the predictive relationship between emotional, instrumental, appraisal, and
informational types of familial/spousal social support, work-family integration/blurring, and time-
based and strain based WFC, on small business owners’ perceived profitability (Q2), the following
hypotheses apply.
H20. Participant perceived familial/spousal social support, work-family integration/blurring,
and WFC does not statistically significantly explain the variance in participant perceived
small business profitability.
H2a. Participant perceived familial/spousal social support, work-family integration/blurring,
and WFC does statistically significantly explain the variance in participant perceived small
business profitability.
Work-Family Conflict
A conflict framework can be seen in much of the initial work-life balance research;
Greenhaus and Beutell (1985) initially suggested that WFC occurred when obligations, pressures,
actions, and behaviors of one role impeded responsibility fulfillment in another role. Greenhaus and
Beutell's definition identified three distinct forms associated with failing to balance work and family
obligations: time-based conflict, strain-based conflict, and behavior-based conflict. With each of
these conflict dimensions, compliance in one domain yielded compliance difficulties in another
domain (Odle-Dusseau, Britt, & Greene-Shortridege, 2012).
Time-based conflict resulted from the inability to complete obligations and requirements of a
role due to the time devoted to other domains (Greenhaus & Beutell, 1985; van Daalen et al., 2006).
Time-based conflict also resulted because an individual could not occupy two roles simultaneously
and ensued when an individual was physically present in one domain but mentally preoccupied with
the other (Greenhaus & Beutell, 1985). Strain-based conflict resulted when the role in one domain
spilled over and affected interactions within the other domain (Greenhaus & Beutell, 1985). This
type of role strain made it difficult to fulfill requirements or function effectively in the other role. In
this strain-based situation, frequently the harmful negative effects of work were manifested in the
home environment as employees displaced their work stress on family members (Quick et al., 2004).
Finally, behavioral-strain conflict occurred when actions such as leadership, management, or
interpersonal styles that were accepted and even rewarded in one domain became incompatible with
behaviors desired in the other domain. Behaviors, which were developed to produce improved
satisfaction in one role, were negatively perceived when implemented in another domain. This
behavioral-based conflict occurred when individuals failed to recognize the need to adjust attitudes,
actions, and behaviors between home and work (Greenhaus & Beutell, 1985).
In addition to considering the form of WFC, researchers have also considered the direction
the conflict was perceived. Potentially WFC could result from individuals’ work domains interfering
with their home and family responsibilities; termed work interference with family (WIF), this type of
conflict occurred when work pressures negatively encroached upon home life (Chang et al., 2010;
SOBIE 2014
72
Mitchelson, 2009). Family interference with work (FIW) resulted when family responsibilities
affected individuals work roles (Chang et al., 2010; Mitchelson, 2009). Considering both the
direction and form of WFC, six WFC components have emerged including: time-based WIF, time-
based FIW, strain-based WIF, strain-based FIW, behavior-based WIF, and behavior-based FIW
(Mitchelson, 2009).
Within previous research, WFC also termed work-life conflict encompassed the discord felt
when employment or family demands such as time and strain interfered with performing family-
related or work-related tasks (Moreno-Jiménez et al., 2009). While WFC was often referred to as the
overarching concept involving the struggles between home and work, some researchers differentiated
between types of conflict noting work-to-family conflict, also identified as WFC, referred to the
dissonance felt when work commitments impeded family time and family-to-work conflict (FWC)
expressly addressed when family demands impeded work roles (Moreno-Jiménez et al., 2009). For
this study, the overarching WFC concept influencing work outcomes was the focus.
Work-life Balance
The process of managing work and family obligations is considered an imperative labor force
and societal issue (Carlson, Kacmar, & Williams, 2009). Greenhaus and Beutell (1985) initially
suggested the attainment of work-life balance requires energy, time, and commitment distribution
across work and non-work domains. Later, Clark (2000) defined work-life balance as the
minimization of role conflict as well as the successful performance and effective functioning between
home and work. Hilbrecht et al. (2008) added that work-life balance discussions should examine the
consuming nature of work including the quantity of work hours, the intensity of the work schedule,
and the control of work obligations. Hilbrecht et al. (2008) concluded that work-life discourse
resulted in the abandonment of critical relationships and obligations as well as the harmful increase of
physical, mental, and emotional quality of life issues.
Gregory and Milner (2009) described work-life balance as the cultural and innate bond
between work and non-work time and space; an equilibrium between these two roles increased the
flexibility and independence of an individual balancing their interest, time, and physical presence in
both work and home domains. Grzywacz and Carlson (2007) added to this concept by suggesting that
work-life balance involved the achievement of domain related expectations that became mutual and
managed between an individual’s work and family roles. Carlson et al. (2009) inferred from these
definitions that work-life balance did not suggest that an individual exceled in both the family and
work domains. Effective work-life balance occurred when individuals maintained mutually agreed
upon requirements in each role, met essential domain responsibilities within each role, and released
perfectionistic needs, which demanded high levels of success or effectiveness in both or either role
(Carlson et al., 2009).
Small Business Dynamics
Small businesses and entrepreneurial ventures significantly sustain the U.S. economy.

SOBIE 2014
73
Neumark, Wall, & Zhang (2011) concluded that small firms create more employment opportunities
when compared to mid and large size business establishments. According to the Small Business
Administration (2012), U.S. small businesses have produced 65% or 9.8 million of the net new
employment opportunities in the past 17 years and employ half of U.S. workers. Zachary and Mishra
(2010) acknowledged that entrepreneurial and small business research was needed to understand the
comprehensively unique and vital role that these ventures play in the economy. Even though
distinctions can be made between entrepreneurs and small business owners, these distinctions were
outside the scope of this research.
In order for a small business to remain competitive, performance improvements are crucial
(Latham, 2008). Similar to other high strain occupations, entrepreneurs must deal with the challenges
of balancing work and life responsibilities. New entrepreneurs must make several strategic and
critical decisions during the development of their business; in addition, they must balance the
concurrent roles of work and life while managing the conflicting demands of time, energy, and
resources needed for promoting family satisfaction and business success (Leaptrott, 2009). Small
business ventures account for 50% of all private sector net employment increase (Headd & Kirchhoff,
2009).
New business ventures (NBV) provide essential economic growth to the economy; however,
NBV must manage the competing commitments between what profits the business and what is
valuable to the family (Werbel & Danes, 2010). Work-life conflict among entrepreneurs significantly
affected the longevity, survival, and success of small businesses (Headd & Kirchhoff, 2009; Williams
& Jones, 2010). Small business owners who learned to balance the conflicting demands of time and
cognitive resources between their families and their businesses performed more effectively in both
roles (Leaptrott, 2009).
Conservation of Resources Theory
When considering work-life balance concerns among entrepreneurs, COR theory provided a
valuable systems perspective on the connection between work and life domains. Initially developed
by Hobfoll (1989), this theory provided a new perspective on stress management by integrating
environmental and cognitive models of stress; Hobfoll (1989; 2001) suggested goal-seeking
individuals pursued positive reinforcements and strove to obtain and maintain supportive resources in
their goal achievement. Additionally, COR theorists suggested impending resource forfeiture
increased stress and frequently prompted individuals to act in such a way to avoid further loss
(Hobfoll, 2001). This psychological model drew upon two perspectives: primarily, people
instinctively sought resources that brought them pleasure and positive reinforcement, and moreover,
the threat of resource loss, the net loss of resources, or the lack of resource gain lead to increased
stress (Hobfoll, 1989). Hobfoll (2001) through COR predicted increase stress when individuals
experienced resource deficiencies. Consequently, resource acquisition was of critical importance
when individuals depleted their resource assets (Hobfoll, 2001). Resource depletion and resource
support had a predictive nature in stress management considering the biological, cognitive, and social
stress responses (Hobfoll, 1989).
SOBIE 2014
74
With a desire to obtain, preserve, and develop cherished resources (Halbesleben, 2010;
Hobfoll, 1989, 2001; Seiger & Wiese, 2009), individuals frequently devoted efforts to safeguard
against resource loss and sought opportunities to promote resource attainment (Hobfoll, 2001). All
individuals are affected by the scarcity paradigm meaning the availability of personal energy,
stamina, and resources operate under limited confines (Schneider, Macey, Barbera, & Martin, 2009).
Furthermore, individuals who expended a substantial amount of drive, effort, energy, and resources at
work were left with a limited or depleted supply of resources or energy at home while individuals
who were supported at home possessed greater resources and stamina to perform better at work
(Halbesleben, Harvey, & Bolino, 2009).
Posited from a scarcity of resources as well as COR theory, Odle-Dusseau et al. (2012)
suggested perceived stressors forecasted increased strain while familial and spousal support resources
indirectly predicted improved organizational outcomes and reduced WFC. Conversely, Greenhaus
and Powell’s (2006) Work-Family Enrichment theory submitted that work and family roles directly
influenced organizational outcomes, however, not through reduced WFC as suggested by Odle-
Dusseau et al. (2012) but amplified perceptions of work-family enrichment. Despite these varied
perceptual lenses, a linkage exists between organizational and family resources and subsequent
employment success (Odle-Dusseau et al., 2012). Odle-Dusseau et al.’s research indicated that
organizational support, such as a supportive supervisor, was a more significant predictor of improved
organizational outcomes rather than family supportive organizational perceptions. In addition, Odle-
Dusseau et al.’s research revealed that within a small business dynamic, spouses and family members
were often the sole supportive resource available to the owner. Irrespective of the dynamic or the
support type, COR provided an established model of the impact of family resources on employee
success and offered an operational framework as to how entrepreneurs manage work-life stress,
bolster support, and prevent resource loss.
Within the COR theory, social support and social-capital resources offered key components
to working individuals aimed at reducing role stressors and buffering the relationship between family
and work (Greenhaus & Powell, 2006; Michel et al., 2010). Social support frequently acted as a
moderator by directly influencing WFC (Seiger & Wiese, 2009). In new business ventures, spousal
support acted as social support often providing the entrepreneur emotional support, financial support,
and frequently unpaid work support (Werbel & Danes, 2010). Conversely, spousal demands, family
constraints, and the inability to manage work and family responsibilities acted as a resource drain on
the small business owner (Werbel & Danes, 2010).
Research Methods and Design
The intent of this derivation study was to utilize established survey instruments to gather data
on a small business owner population. Self-reporting surveys allowed the researcher to seek
information regarding work-life balance constructs and analyze the nature of the relationship between
familial/spousal social support, work-family integration/blurring, and WFC with a small business’s
longevity and perceived profitability. Utilizing COR theory (Hobfoll, 1989) as a foundational
theoretical framework as well as a social support scale (Parasuraman et al., 1992), the Work-Family
Integration-Blurring scale (Desrochers et al., 2005), and the Multidimensional Measure of Work-
Family Conflict scale (Carlson et al., 2000), this correlational and predictive research study compared
SOBIE 2014
75
survey results with perceived profitability and business longevity.
Initially, descriptive statistics including frequency distributions, central tendency measures,
measures of variation, and standard deviations were computed on data collected. Correlational
analyses were conducted to assess associations between explanatory and predictive variables. A
standard multiple regression analysis was used to determine the predictive value familial/spousal
social support (including emotional, instrumental, appraisal, and informational support), work-family
blurring, and time-based and strain-based WFC has on business longevity. These same predictor
variables were also used in a binary logistic multiple regression analysis to determine if they have an
effect on owners’ perceived profitability. These statistical analyses provided the target information
needed to address the research questions and hypotheses.
For this research, 1,897 small business owners who were registered with the Oklahoma Small
Business Development Center (SBDC) were identified as potential respondents in the study. Using
the SBDC client list to provide a relevant sample allowed for a concentrated population of potential
respondents who were inclined to not only participate in the survey, but also wanted to improve their
own business sustainability. However, use of this sample may have skewed the results as the SBDC
client population was inclined to seek multiple means, including work and education, to ensure and
promote their business sustainability.
Participants were electronically directed to the Survey Monkey website to complete the
survey. The first three questions of the assessment were designed to establish the respondent’s
participant criteria. Demographic information that was captured included marital status, children
status, longevity of business, and perceived profitability. Location of the business (at a state level),
number of employees, as well as industry type was also captured in order to provide the SBDC with
follow-up data. Ownership of a small business, being married, and having children were
requirements for participation in this study.
To ensure and safeguard external validity, a cross-sectional representative variety of small
business owners in various industries were surveyed. Stevens (1996) recommended for behavioral
science research, a ratio of 15 participants for each predictive value is needed. Using Stevens’ (1996)
formula for the study, 105 participants would be optimal. With over 1800 surveys dispersed
throughout SBDCs, a participant rate of 6% was necessary to achieve an adequate sample size and to
ensure the statistical significance of responses. Using the SBDC’s constant contact system, 1,897
business owners received an email invitation to participate in this research study, and 124 individuals
completed the survey, indicating a 6.5% participation rate.

SOBIE 2014
76
Operational Variables
Longevity of business
With the longevity of a small business comes the expectation of economic growth, job
creation, wealth creation, and economy development (Williams & Jones, 2010). Longevity was
captured by simply asking respondents to specify how many years their business had been open,
indicating to participants to round to the closest year. Within this survey, longevity denoted how long
the business has been operational at the time of survey participation. While longevity of operation is
a continuous ratio variable, this researcher measured longevity as a discrete variable, limiting length
of operation strictly to years only. Responses could range from zero on up. The ratio data were used
in a standard multiple regression analysis where all predictive factors were entered into the model
simultaneously (Pallant, 2010). This analysis was used to determine the effect of independent
predictive factors including familial/spousal social support (including emotional, instrumental,
appraisal, and information support), work-family integration/blurring, and WFC (including time-
based and strain-based conflict) on the criterion factor of longevity.
Profitability
A variety of criteria is often used to evaluate a small business’s success. Wealth acquisition,
financial performance, personal/professional recognition, personal satisfaction, and societal impact
have been factors used to evaluate business success (Gorgievski, Ascalon, & Stephen, 2011).
Because profitability varies greatly among different businesses, industry classification, and longevity
of operation, perceived profitability was captured using a discrete categorical response of either “yes”
the owner considers the business profitable or “no” the owner does not consider the business
profitable. Although this forced respondents to select one of two binary possible outcomes, responses
were used as a criterion variable in a binary logistic regression analysis to determine familial/spousal
social support, work-family integration/blurring, and time/strain based WFC predicted profitability.
The use of categorical or nominal data in multiple regression analyses is the subject of some
debate, as this type of statistical analysis generally requires interval/ratio type data. The use of quasi-
interval scale data is an acceptable practice in business and psychological research (Engel, Bell,
Meier, Martin, & Rumpel, 2011; Hasting & Finegan, 2011). The use of multivariate statistics,
including binary logistic regressions, with ordinal and nominal data allows researchers to maintain the
power and flexibility gained by using these methods while not violating the minor biases these tests
involve (Winship & Mare, 1984). Carifio and Perla (2007) concluded that the use of non-interval and
non-ratio data are appropriate and acceptable when analyzing results at a less than interval scale level
using parametric analysis such as multiple regressions. Carifio and Perla (2007) also indicated that
findings from these types of analyses could be effectively interpreted.
Social support

SOBIE 2014
77
Social support was measured with a scale developed by Parasuraman et al. (1992); this scale
focused on the four categories of support initially conceptualized by House (1981) including
emotional, instrumental, appraisal, and informational. Social support of the owner’s family and
spouse was measured with two corresponding questions. For this research, scores were considered
continuous interval variables; scores from individual questions ranged from 1 to 5 and composite
family and spouse social support ranged from 4 to 20. Combined familial/spousal social support
scores, which ranged from 8 to 40, were used in a standard multiple regression analyses with the
business’s longevity status and a binary logistic regression analysis with business owner perceived
profitability.
Work-family integration-blurring
The Work-Family Integration-Blurring Scale of Desrochers et al. (2005) was utilized to
evaluate the integration of work and family roles. This four-question assessment allowed participants
to compare the separation or integration of work and family domains. Responses from a 5-point
Likert scale were combined to form a composite score, reverse coding the final question due to its
transposed wording. For this research, scores were considered continuous interval variables; scores
from individual questions ranged from 1 to 5 and composite scores ranged from 4 to 20. This
composite score was used as a predictor variable in multiple regression analyses with business
longevity and a binary logistic regression analysis with perceived profitability.
Work-family conflict
Carlson et al.’s (2000) WFC survey assessed time-based, strain-based, and behavioral-based
conflict. For this research, time-based and strain-based responses were compared with a business
owner's perceived profitability and business longevity. Nine time-based family interference with
work questions and nine strain-based family interference with work questions were included in this
research. For this research, scores were considered continuous interval variables; scores from
individual questions ranged from 1 to 5 and composite time-based and strain-based WFC scores
ranged from 9 to 45. Combined time-based and strain-based conflict scores WFC scores were used as
a predictor variable in a standard multiple regression analyses with the business’ longevity status and
a binary logistic regression analysis with business owner perceived profitability.
Data Collection, Processing, and Analysis
The research timeline for the study began with an initial joint email correspondence via the
SBDC’s constant contact system sent to prospective participants from this researcher and the
Oklahoma Director of the SBDC. Interested participants were guided to a Survey Monkey website
where respondents were initially provided a cover letter describing the research as well as the
informed consent document. A second constant contact email was sent two weeks after the first email

SOBIE 2014
78
to offer the survey again to any business owner who had not responded initially. After four weeks,
contact was made with the Oklahoma Director of the SBDC indicating that a sufficient sample was
achieved and confirmation was given when the findings were analyzed, an analysis would be
provided to the SBDC.
Upon data collection completion, descriptive statistics were used to compute frequencies,
means, and standard deviations for research variables. Testing assumptions including normality and
collinearity was also assessed prior to inferential analyses. Appropriate correlational analyses were
conducted initially to ensure that variables were related. Inferential statistics were conducted in order
to test hypotheses and answer research questions. To test the null hypotheses, multivariate statistical
analyses were conducted. The use of a standard multiple regression analysis allowed this researcher
to address Question1 and Hypotheses 1 by comparing the metric dependent variable longevity in
order to see if this criterion variable was predicted by familial/spousal social support, work-family
integration/blurring, and WFC (Pallant, 2010; Zikmund, Babin, Carr, & Griffin, 2010).
The use of a binary logistic regression analysis allowed this researcher to address Question 2
and Hypotheses 2 by comparing the dependent variable, perceived profitability in order to see if this
criterion variable could be predicted by familial/spousal social support types, work-family
integration/blurring, and time-based and stain-based WFC (Pallant, 2010; Zikmund et al., 2010). The
use of a binary logistic (binominal) regression was an effective technique because criterion responses
were one of two possible outcomes and were being compared to several explanatory variables
(Pallant, 2010).
Results
One hundred and twenty-four individuals opened and voluntarily began participating in the
survey. Four respondents partially completed questions, answering only the demographic and
outcome variable questions; therefore, these participants’ responses were removed from the data. Of
the 120 who completed the survey, 116 participants reported that they were the owner or founder of
the small business, 106 participants reported that they were married, and 105 reported that they had a
child or children. Of the 120 who completed the survey, 18 failed to meet all three participation
criteria and were removed from the data analysis. One hundred and two respondents remained within
the analyzed cases. With N = 102, the Stevens’ (1996) recommended level of 105 was closely
approximated.
Respondents indicated that the size of their small businesses ranged from 0 to 85 employees,
with M = 7.37, SD = 13.86. Forty-eight of the 102 businesses reported having between one and three
employees and 10 business owners indicated that they had zero employees. Only three businesses
reported having more than 50 employees, employing between 65 and 85 employees. One hundred
and one of the 102 participants reported business headquarters located within Oklahoma, Texas, and
Kansas. All industry classifications were represented with the largest classifications reported in the
“other” category (22 businesses) and retail sales (14 businesses). Table 1 provides a description of all
business industry classifications.

SOBIE 2014
79
Table 3
Business industry classification frequency distribution
Industry Classification Frequency Percent
Agriculture, Food, and Natural Resources 10 9.8
Architecture and Construction 6 5.9
Arts, Audio/Visual Technology, and Communications 5 4.9
Business 2 2.0
Education and Training 5 4.9
Facilities and Maintenance 2 2.0
Finance 3 2.9
Government and Public Administration 1 1.0
Health Care and Science 8 7.8
Information Technology 4 3.9
Manufacturing 9 8.8
Retail Sales 14 13.7
Science, Technology, Engineering, and Mathematics 3 2.9
Service Industry 7 6.9
Transportation, Distribution, and Logistics 1 1.0
Other 22 21.6
Total 102 100.0
Descriptive statistics of all outcome and composite predictor variables are provided within
the sections below. Table 2 also provides information regarding means, SD, skewness, and kurtosis
for each of the operational variables except for perceived profitability. Because perceived
profitability was captured as nominal data, percentages of responses are discussed in the profitability
subheading. Skewness and kurtosis results indicated only work-family integration/blurring results
were normally distributed. Composite social support and WFC results were moderately distributed
and were left unchanged for statistical analysis. Longevity was transformed to reduce extreme
skewness and kurtosis. To test normality further, Kolmogorov-Smirnova and Shapiro-Wilk
assessments were conducted. Results indicated that significance tests were all less than .05,
confirming all outcome and predictor variables were slightly to extremely non-normally distributed.
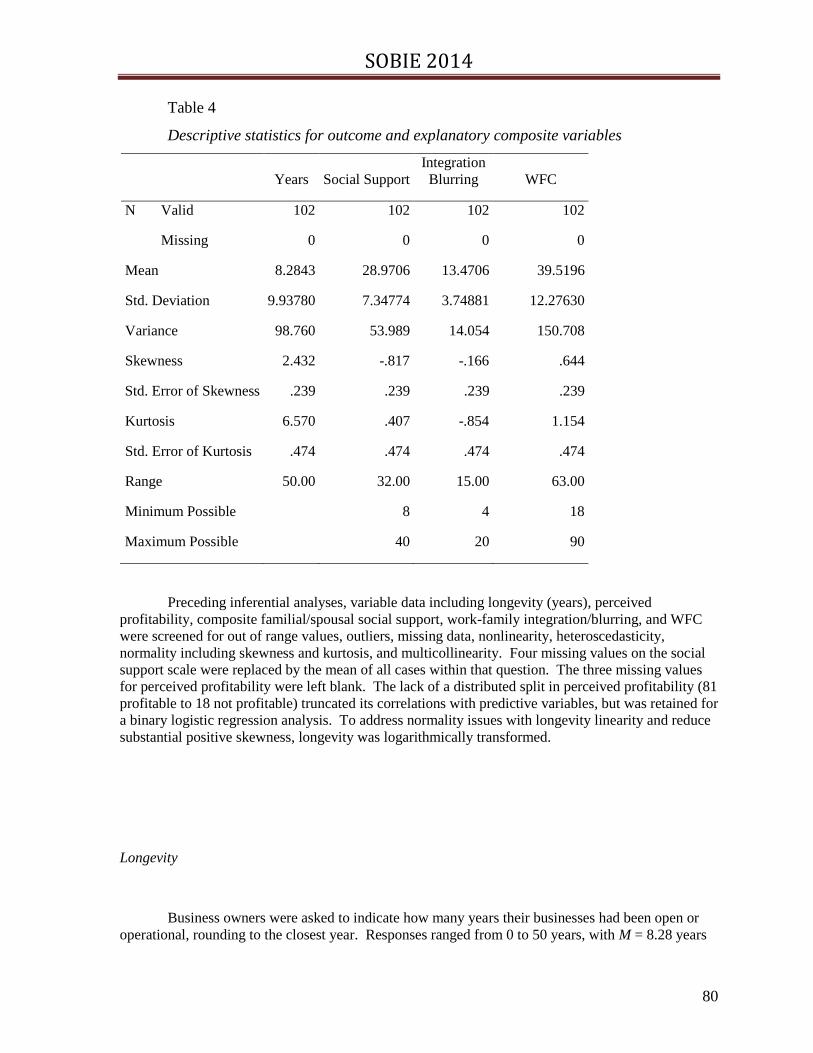
SOBIE 2014
80
Table 4
Descriptive statistics for outcome and explanatory composite variables
Years Social Support
Integration
Blurring WFC
N Valid 102 102 102 102
Missing 0 0 0 0
Mean 8.2843 28.9706 13.4706 39.5196
Std. Deviation 9.93780 7.34774 3.74881 12.27630
Variance 98.760 53.989 14.054 150.708
Skewness 2.432 -.817 -.166 .644
Std. Error of Skewness .239 .239 .239 .239
Kurtosis 6.570 .407 -.854 1.154
Std. Error of Kurtosis .474 .474 .474 .474
Range 50.00 32.00 15.00 63.00
Minimum Possible 8 4 18
Maximum Possible 40 20 90
Preceding inferential analyses, variable data including longevity (years), perceived
profitability, composite familial/spousal social support, work-family integration/blurring, and WFC
were screened for out of range values, outliers, missing data, nonlinearity, heteroscedasticity,
normality including skewness and kurtosis, and multicollinearity. Four missing values on the social
support scale were replaced by the mean of all cases within that question. The three missing values
for perceived profitability were left blank. The lack of a distributed split in perceived profitability (81
profitable to 18 not profitable) truncated its correlations with predictive variables, but was retained for
a binary logistic regression analysis. To address normality issues with longevity linearity and reduce
substantial positive skewness, longevity was logarithmically transformed.
Longevity
Business owners were asked to indicate how many years their businesses had been open or
operational, rounding to the closest year. Responses ranged from 0 to 50 years, with M = 8.28 years

SOBIE 2014
81
and SD = 9.94. Fifty-nine of the 102 respondents indicated their business was 5 years old or less, 19
owners indicated that their business was between 6 and 10 years old, and nine owners indicated their
business had been opened between 11 and 15 years. Seven of the respondents indicated their business
had been opened between 25 to 50 years.
Because longevity data were extremely skewed, square root and log transformations were
conducted to determine which more appropriately improved the linearity and normality of the data.
The logarithmical transformation provided the best solution for a normal distribution. With
transformed longevity data, skewness was transformed from 2.432 to .329 and kurtosis was
transformed from 6.570 to -.295.
Profitability
Business owners were also asked to indicate if they perceived their businesses to be
profitable. Three respondents failed to answer this question, leaving 99 respondents indicating their
perceived profitability. Of the 102 respondents, 81 (79.4%) designated they were profitable, and 18
(17.6%) reported not being profitable, indicating a skewness of 1.675.
Social support
Parasuraman et al.’s (1992) social support scale was used to examine sources of social
support used in reducing WFC. Providing emotional, instrumental, appraisal, and informational
support, this research clustered social support into spousal support, familial support, and total
familial/spousal social support (Parasuraman et al., 1992). Respondents were asked eight questions;
four questions addressed the extent a spouse was willing to listen, was concerned about the business
owner's welfare, provided helpful information, and praised the business owner's accomplishment.
Four questions addressed the same social support criteria but sought information regarding the
family's extent to provide support. Respondents answered using a Likert 5-point scale ranging from
"almost none" to "a great deal."
Scores for spousal and family support could range from 4 to 20. Results from the combined
spousal social support scores indicated M = 15.35 and SD = 4.3 with a skewness of -1.2, indicating a
greater distribution of higher scores and thus greater perceived support. Results from the combined
familial social support scores indicated M = 13.62 and SD = 4.03 with a skewness of -.45. A further
description of the social support indicated that instrumental support was the most perceived support
provided to owners with M = 8.36 and SD = 1.94 and appraisal support was the least provided at M =
6.19 and SD = 2.22. The composite social support mean was 28.97, SD = 7.35, and skewness of -
.817. Table 3 provides descriptive statistics of support sources and types.

SOBIE 2014
82
Table 5
Descriptive statistics for social support sources and types
Spousal
Support
Familial
Support
Emotional
Support
Instrumental
Support
Appraisal
Support
Informational
Support
Mean 15.3529 13.6176 7.5490 8.3627 6.1863 6.9020
Std. Deviation 4.29977 4.03461 2.06636 1.93861 2.22377 2.28430
Variance 18.488 16.278 4.270 3.758 4.945 5.218
Skewness -1.230 -.450 -.981 -1.318 -.195 -.538
Std. Error of
Skewness .239 .239 .239 .239 .239 .239
Kurtosis .873 -.315 .744 1.529 -.532 -.384
Std. Error of
Kurtosis .474 .474 .474 .474 .474 .474
Minimum 4.00 4.00 2.00 2.00 2.00 2.00
Maximum 20.00 20.00 10.00 10.00 10.00 10.00
Work-family integration-blurring
The Work-Family Integration-Blurring Scale of Desrochers et al. (2005) was used to
evaluate the integration of work and family roles. This four-question assessment allowed participants
to compare the separation or integration of work and family domains. Responses from a 5-point
Likert scale were combined to form a composite score, reverse coding the final question due to its
transposed wording. Scores could range from 4 to 20. Results indicated M = 13.47 with a SD = 3.75,
with results only slightly skewed at -.166 (Table 2).
Work-family conflict
Carlson et al.’s (2000) WFC survey was utilized to assess time-based and strain-based
conflict. Time-based conflict results in the inability to complete obligations and requirements of a
role due to the time devoted to other domains and the conflict, which may ensue when an individual
was physically present in one domain but mentally preoccupied with the other (Greenhaus & Beutell,
1985; van Daalen et al., 2006). Strain-based conflict resulted when the role in one domain spilled
over and made it difficult to fulfill requirements or function effectively in the other role (Greenhaus &
Beutell, 1985).

SOBIE 2014
83
Nine time-based family interference with work questions and nine strain-based family
interference with work questions were included in this research. Participants responded using a 5-
point Likert scale ranging from “strongly disagree” to “strongly agree.” Scores from time-based and
strain-based WFC could range from 9 to 45 while total WFC could range from 18 to 90. Results
indicated greater time-based WFC (M = 20.48, SD = 6.21) than strain-based WFC (M = 18.96, SD =
7.00).
In four of the sub-questions (one time-based strain WFC sub-response and three strain-based
WFC sub-responses) blank responses were found. In each of these cases, the missing data were
replaced with the mean for all the cases within the sub-category question. This allowed respondents’
responses to be analyzed without allowing the missing data to alter significantly the response effect or
the usefulness of data. After the missing data were replaced, time-based WFC was calculated with M
= 20.54 and SD = 6.21 and strain-based WFC was calculated with M = 18.98, SD = 6.99. The
composite total mean for WFC was 39.52, SD = 12.28. Table 4 provides additional descriptive
statistics for WFC types.
Table 6
Descriptive statistics for WFC types
Time WFC Strain WFC Total WFC
N Valid 102 102 102
Missing 0 0 0
Mean 20.5392 18.9804 39.5196
Std. Deviation 6.21348 6.94958 12.27630
Variance 38.607 48.297 150.708
Skewness .551 .649 .644
Std. Error of Skewness .239 .239 .239
Kurtosis 1.686 .247 1.154
Std. Error of Kurtosis .474 .474 .474
Range 36.00 30.00 63.00
Assumptions of inferential statistics
Regarding this data, inferential statistical assumptions for a standard multiple and binary
logistical regressions were evaluated. Predictor variables were categorical and the outcome variable
was continuous and unbounded. All of the variables had variances greater than 0 (familial/spousal
social support was 53.99, work-family integration/blurring was 14.05, WFC was 150.71, and
transformed longevity was .147); however, perceived profitability had a variance of only .150. Three
predictor variables were significantly correlated with one another, with r values including -.187, .278,
and .319; however, multicollinearity appeared not to be violated as none of the variables were highly
correlated and no perfect linear relationship occurred between predictor variables (Kerlinger &
Pedhazur, 1973; Tabachnick & Fidell, 2007). Collinearity occurs when explanatory variables are

SOBIE 2014
84
highly correlated and can inflate standard errors of the logistic regression coefficients (Tabachnick &
Fidell, 2007).
Table 5 provides a collinearity diagnostic analysis conducted on longevity, familial/spousal
social support, work-family integration/blurring, and WFC. The collinearity diagnostic analysis
indicated similar eigenvalues, which are likely to indicate that small changes in the measured
variables would likely not change the results; however, there was a significant difference between the
eigenvalue for dimension 1 and dimensions 2 through 4, which may indicate a collinearity problem.
Normality was also evaluated through an examination of histograms with distribution curves. Most
frequency plots had non-normal distributions; longevity was skewed 2.43, transformed longevity was
skewed .329, perceived profitability was skewed 1.68, familial/social support was skewed -.82, work-
family integration/blurring was skewed -.17, and WFC was skewed .64.
Table 7
Collinearity diagnostic
Model Dimension
Eigenvalue
Condition
Index
Variance Proportions
(Constant)
Total
Support
Integration
Blurring
Total
WFC
1
dimension1
1 3.850 1.000 .00 .00 .00 .00
2 .088 6.610 .00 .24 .00 .46
3 .042 9.580 .09 .08 .99 .10
4 .020 13.989 .91 .67 .01 .43
Note. Dependent Variable: Years_log10
Assumptions of the binary logistic regression were also analyzed. Linearity was of concern
with this type of analysis because a categorical outcome violates a linear relationship assumption
(Kerlinger & Pedhazur, 1973). In order to determine if assumptions of linearity of the logit were
violated, significance values were evaluated. As indicated within Table 11 as well as within the
discussion of the second research question, all significance values were greater than .05 indicating
that the assumption of linearity of the logit was met (Field, 2009). Also to guard against
independence of errors and multicollinearity (Field, 2009), scores were captured from different
respondents during one distinct period and predictor values did not highly correlate.
RQ 1: What is the predictive relationship of familial/spousal social
support, work-family integration/blurring, and WFC on small
business longevity?
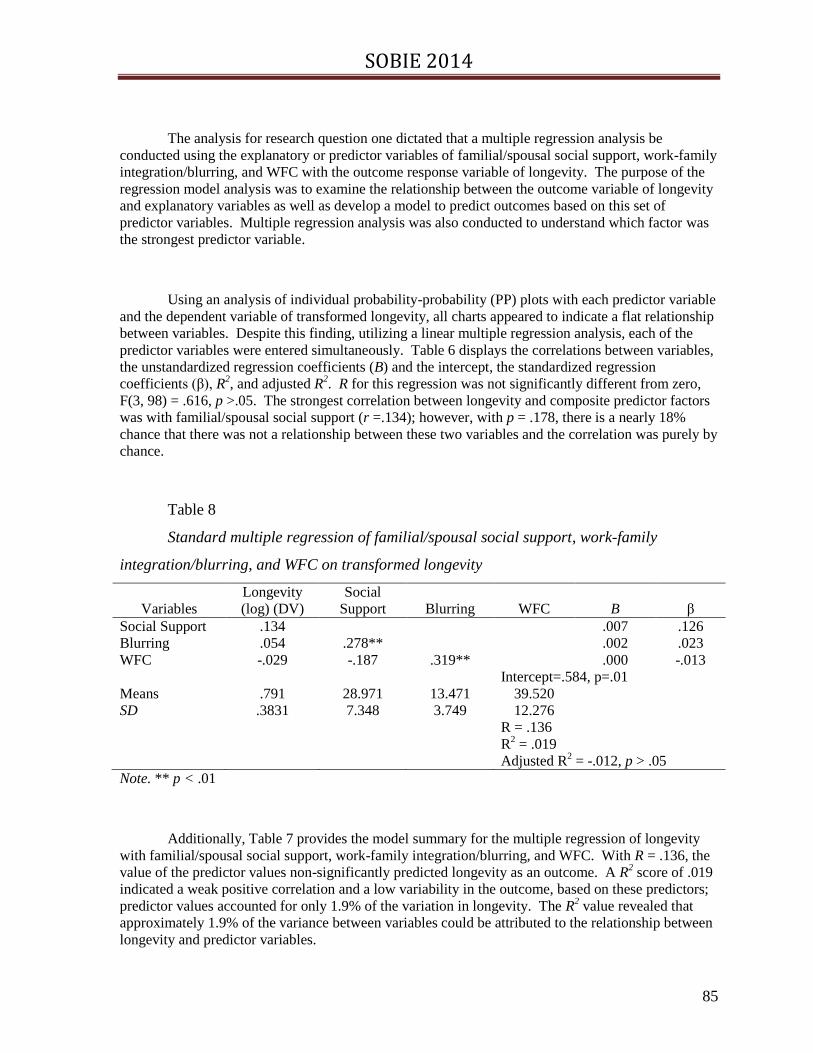
SOBIE 2014
85
The analysis for research question one dictated that a multiple regression analysis be
conducted using the explanatory or predictor variables of familial/spousal social support, work-family
integration/blurring, and WFC with the outcome response variable of longevity. The purpose of the
regression model analysis was to examine the relationship between the outcome variable of longevity
and explanatory variables as well as develop a model to predict outcomes based on this set of
predictor variables. Multiple regression analysis was also conducted to understand which factor was
the strongest predictor variable.
Using an analysis of individual probability-probability (PP) plots with each predictor variable
and the dependent variable of transformed longevity, all charts appeared to indicate a flat relationship
between variables. Despite this finding, utilizing a linear multiple regression analysis, each of the
predictor variables were entered simultaneously. Table 6 displays the correlations between variables,
the unstandardized regression coefficients (B) and the intercept, the standardized regression
coefficients (β), R2, and adjusted R
2. R for this regression was not significantly different from zero,
F(3, 98) = .616, p >.05. The strongest correlation between longevity and composite predictor factors
was with familial/spousal social support (r =.134); however, with p = .178, there is a nearly 18%
chance that there was not a relationship between these two variables and the correlation was purely by
chance.
Table 8
Standard multiple regression of familial/spousal social support, work-family
integration/blurring, and WFC on transformed longevity
Variables
Longevity
(log) (DV)
Social
Support Blurring WFC B β
Social Support .134 .007 .126
Blurring .054 .278** .002 .023
WFC -.029 -.187 .319** .000 -.013
Intercept=.584, p=.01
Means .791 28.971 13.471 39.520
SD .3831 7.348 3.749 12.276
R = .136
R2 = .019
Adjusted R2 = -.012, p > .05
Note. ** p < .01
Additionally, Table 7 provides the model summary for the multiple regression of longevity
with familial/spousal social support, work-family integration/blurring, and WFC. With R = .136, the
value of the predictor values non-significantly predicted longevity as an outcome. A R2 score of .019
indicated a weak positive correlation and a low variability in the outcome, based on these predictors;
predictor values accounted for only 1.9% of the variation in longevity. The R2 value revealed that
approximately 1.9% of the variance between variables could be attributed to the relationship between
longevity and predictor variables.

SOBIE 2014
86
Table 9
Regression model for operation transformed longevity and familial/spousal support,
work-family integration/blurring, and WFC
Model R
R2
Adjusted
R2
Std. Error
of the
Estimate
Change Statistics
Durbin-
Watson
R2
Change
F
Change df1 df2
Sig. F
Change
1 .136 .019 -.012 .38527 .019 .616 3 98 .606 2.157
Note. Predictors: (Constant), Total WFC, Total Support, Integration Blurring. Dependent Variable:
Years Transformed
Partial correlations were also conducted to determine if longevity could be predicted by one
predictor variable, controlling separately for the other two predictor variables. None of the partial
correlations yielded any significant findings. While familial/spousal social support, work-family
integration/blurring, and WFC totals did not adequately predict longevity, distinct sub-survey items
slightly correlated with longevity. Even though this detailed research was not overtly dictated by
proposed research questions, further analysis was conducted to more clearly understand if relational
elements did occur between micro predictive elements and outcome variables. Table 8 details the
questions that indicated the highest correlations. On the work-family integration/blurring survey,
question 3 showed the strongest correlation (r = .202, r2 = .041, p <.05) and asked, “I tend to integrate
my work and family duties at work.” These results revealed a weak positive correlation with a high
significance level and indicated that approximately 4.1% of the variance between question 3 of the
work-family integration/blurring scale and longevity could be attributed to the relationship between
these variables.
Table 10
Highest correlations of survey questions with transformed longevity
Questions Scale Correlation (r) Significance (p)
2. To what extent are your
family/children willing to listen to your
work problems?
Social Support –
family/
emotional
.169 .091
3. To what extent is your spouse
concerned about your welfare?
Social Support –
spouse/
instrumental
.149 .137
3. I tend to integrate my work and
family duties at work.
Work-Family
Blurring/
Integration
.204 .040
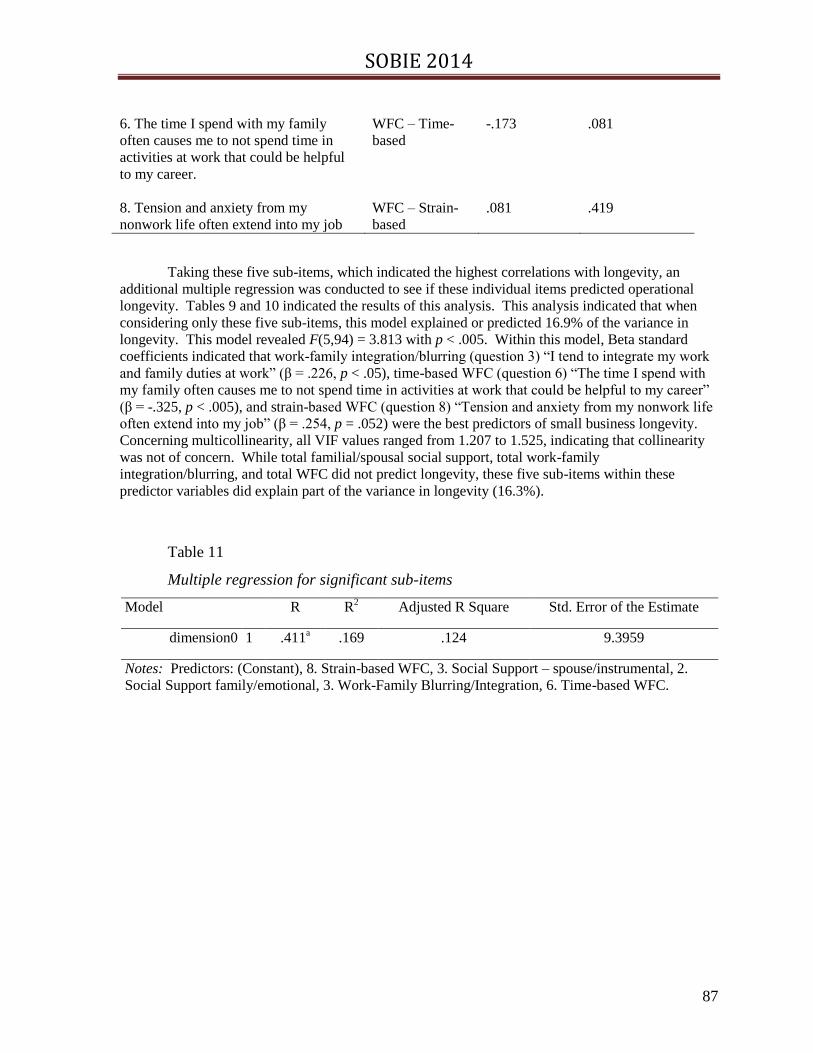
SOBIE 2014
87
6. The time I spend with my family
often causes me to not spend time in
activities at work that could be helpful
to my career.
WFC – Time-
based
-.173 .081
8. Tension and anxiety from my
nonwork life often extend into my job
WFC – Strain-
based
.081 .419
Taking these five sub-items, which indicated the highest correlations with longevity, an
additional multiple regression was conducted to see if these individual items predicted operational
longevity. Tables 9 and 10 indicated the results of this analysis. This analysis indicated that when
considering only these five sub-items, this model explained or predicted 16.9% of the variance in
longevity. This model revealed F(5,94) = 3.813 with p < .005. Within this model, Beta standard
coefficients indicated that work-family integration/blurring (question 3) “I tend to integrate my work
and family duties at work” (β = .226, p < .05), time-based WFC (question 6) “The time I spend with
my family often causes me to not spend time in activities at work that could be helpful to my career”
(β = -.325, p < .005), and strain-based WFC (question 8) “Tension and anxiety from my nonwork life
often extend into my job” (β = .254, p = .052) were the best predictors of small business longevity.
Concerning multicollinearity, all VIF values ranged from 1.207 to 1.525, indicating that collinearity
was not of concern. While total familial/spousal social support, total work-family
integration/blurring, and total WFC did not predict longevity, these five sub-items within these
predictor variables did explain part of the variance in longevity (16.3%).
Table 11
Multiple regression for significant sub-items
Model R R2 Adjusted R Square Std. Error of the Estimate
dimension0 1 .411a .169 .124 9.3959
Notes: Predictors: (Constant), 8. Strain-based WFC, 3. Social Support – spouse/instrumental, 2.
Social Support family/emotional, 3. Work-Family Blurring/Integration, 6. Time-based WFC.

SOBIE 2014
88
Table 12
Multiple regression coefficients
Model
t Sig.
Correlations
Collinearity
Statistics
B
Std.
Error Beta
Zero-
order
Partia
l Part
Toler
ance VIF
1 (Constant)
.367 .199
1.844 .068
Social Support
question 2
.027 .033 .085 .825 .411 .135 .085 .078 .827 1.210
Social Support
question 3
.053 .034 .160 1.554 .124 .161 .158 .146 .829 1.207
Integration/
Blurring question
3
.072 .034 .226 2.130 .036 .215 .215 .200 .785 1.274
Time-based
WFC question 6.
-.145 .045 -.352 -3.227 .002 -.171 -.316 -.303 .745 1.342
Strain-based
WFC question 8
.091 .046 .229 1.971 .052 .098 .199 .185 .656 1.525
Note. Dependent Variable: years_log10
In order to determine if the model could be improved if non-predictive questions were
removed, questions 2 and 3 of the social support scale were eliminated. When the model was
analyzed with only the three best predictors of longevity (integration/blurring – question 3, time-
based WFC – question 6, and strain-based WFC – question 8), R = .35 and adjusted R2 = .094,
F(3,98) = 4.512, p = .005. This indicated that the revised model could account for 9.6% in the
variance of longevity. Within this model, results revealed work-family integration/blurring (question
3) “I tend to integrate my work and family duties at work” the beta standard coefficient, β = .266, p <
.05 and time-based WFC (question 6) “The time I spend with my family often causes me to not spend
time in activities at work that could be helpful to my career” β = -.325, p < .005. Despite these
findings within micro survey elements, H10 was failed to be rejected as composite predictor values
neglected to significantly predict longevity.

SOBIE 2014
89
RQ 2 - What is the predictive relationship of familial/spousal social
support, work-family integration/blurring, and WFC on small
business owner’s perceived profitability?
An analysis of research question two allowed for the use of a binary logistic regression since
the response of perceived profitability was based on only two categorical or dichotomous outcomes.
Participants were asked if they perceived their small business as profitable and could response with
“yes” or “no”. This type of statistical analysis was employed to assess the relationship between
predictor variables and owner perceived profitability. Overall results indicated that familial/spousal
social support, work-family integration/blurring, and time-based and strain-based WFC could not
significantly predict the likelihood of perceived profitability. In this analysis, all predictors were
entered simultaneously into the model. The overall model correctly classified 81.8% of business
owners’ perceived profitability.
Table 11 revealed the B coefficients for familial/spousal social support (-.046), work-family
integration/blurring (-.026), and WFC (.033) with all odds ratios close to 1, indicating virtually no
change in the response variable resulting from each of the explanatory variables. The results
revealed, however without significance, that regarding perceived profitability, the analysis would
yield predicted odds of .955 for total support, .975 for work-family integration/blurring, and 1.033 for
WFC. The Wald chi-square statistic measured the statistical significance of individual regression
coefficients. The Wald statistics confirmed the estimates of the coefficients on the logistic regression
were not significantly different from zero, authenticating that explanatory variables did not contribute
to the prediction of perceived profitability. The results of this analysis revealed that none of the
composite variables chosen as predictor variables had statistically significant effects (p > .05) on
perceived profitability.

SOBIE 2014
90
Table 13
Binary logistic regression for familial/spousal social support, work-family
integration/blurring, and WFC with perceived profitability
B S.E. Wald df Sig. Exp(B)
95% C.I.for EXP(B)
Lower Upper
Step
1a
Total Support -.046 .037 1.553 1 .213 .955 .888 1.027
Integration Blurring -.026 .084 .094 1 .759 .975 .827 1.149
Total WFC .033 .023 2.001 1 .157 1.033 .987 1.082
Constant -1.232 1.457 .715 1 .398 .292
Note. Variable(s) entered on step 1: Total Support, Integration Blurring, Total WFC.
Additional analyses revealed similar findings regarding the strength of the association
between variables. Table 12 displays results of Cox and Snell R2, Nagelkerke R
2, and -2Log
Likelihood assessments. Cox and Snell R2 indicated the maximum likelihood that the variables could
explain the model. Results of the Cox and Snell R2 regarding familial/spousal social support and
WFC explained only 2.7% of this logistic model. Similarly, the model’s strength of association,
Nagelkerke R2 ranges from 0 to 1 and attempts to also explain the variation of the dependent variable
within the model. The Nagelkerke R2 approximates the R
2 in an ordinary least square regression.
Work-family integration/blurring had identical scores for Cox and Snell R2 and Nagelkerke R
2,
indicating 0 or none of the variation in perceived profitability could be explained by
integration/blurring. Results of the Nagelkerke R2 regarding familial/spousal social support and WFC
revealed only 4.4% of this logistic model could be explained based on these predictor variables and
perceived profitability.
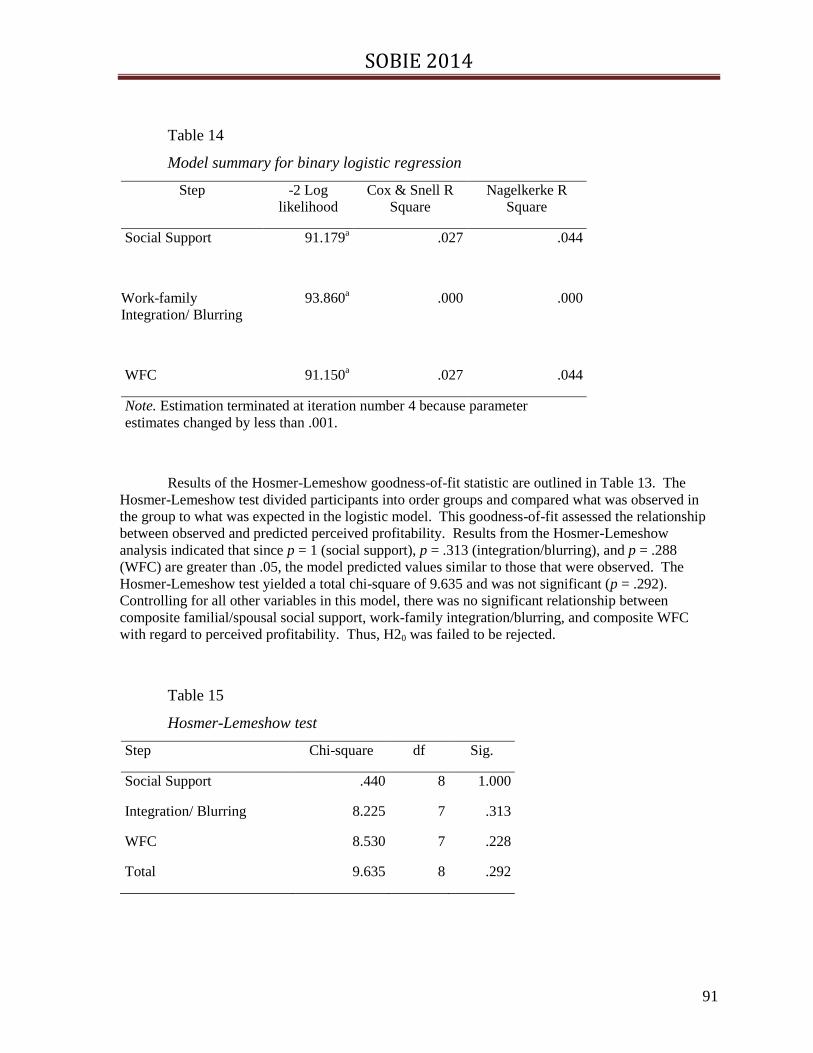
SOBIE 2014
91
Table 14
Model summary for binary logistic regression
Step -2 Log
likelihood
Cox & Snell R
Square
Nagelkerke R
Square
Social Support
91.179a .027 .044
Work-family
Integration/ Blurring
93.860a
.000 .000
WFC 91.150a .027 .044
Note. Estimation terminated at iteration number 4 because parameter
estimates changed by less than .001.
Results of the Hosmer-Lemeshow goodness-of-fit statistic are outlined in Table 13. The
Hosmer-Lemeshow test divided participants into order groups and compared what was observed in
the group to what was expected in the logistic model. This goodness-of-fit assessed the relationship
between observed and predicted perceived profitability. Results from the Hosmer-Lemeshow
analysis indicated that since p = 1 (social support), p = .313 (integration/blurring), and p = .288
(WFC) are greater than .05, the model predicted values similar to those that were observed. The
Hosmer-Lemeshow test yielded a total chi-square of 9.635 and was not significant (p = .292).
Controlling for all other variables in this model, there was no significant relationship between
composite familial/spousal social support, work-family integration/blurring, and composite WFC
with regard to perceived profitability. Thus, H20 was failed to be rejected.
Table 15
Hosmer-Lemeshow test
Step Chi-square df Sig.
Social Support .440 8 1.000
Integration/ Blurring 8.225 7 .313
WFC 8.530 7 .228
Total 9.635 8 .292

SOBIE 2014
92
Supplemental analysis
Several supplemental analyses were also performed. The most significant correlations of this
analysis were between predictor variables of work-family integration/blurring and total
familial/spousal social support (r = .278, p = .005, r2 = .077) and work-family integration/blurring and
total WFC (r = .319, p = .001, r2 = .102). These results revealed a weak positive correlation with a
high significance level and indicated that approximately 7.7% of the variance between work-family
integration/blurring and total familial/spousal social support could be attributed to the relationship.
Additionally, 10.2% of the variance in work-family integration/blurring and total WFC could be
attributed to the relationship.
Examining correlations between micro-elements and outcome variables were conducted to
determine if sub-elements were connected to small business longevity and perceived profitability.
Multiple regression and binary logistic regressions were conducted on micro-elements that exhibited
significant correlations. Additionally, the associations between variables were also analyzed to
determine the relationship between these criterion variables.
Because no significant findings were found between composite explanatory variables and
response variables of business longevity and perceived profitability, this researcher conducted a
multiple regression analysis using WFC as a dependent variable and total familial/spousal social
support (β = -.298) and work-family integration/blurring (β = .402) as predictor variables. Results
revealed an R = .429 and R2 = .184 (∆ R
2 = .168, p < .000). Based on this sample, total
familial/spousal social support and work-family integration/blurring accounted for 18.4% of the
variance in WFC.
Additionally, similar to van Daalen et al.’s (2006) findings, familial and spousal social
support variables did not explain a significant portion of the variability associated with sub-scales of
time-based conflict (∆ R2 = .031, p = .077) and strain-based conflict (∆ R
2 = .037, p = .059).
However, when the model was modified to compare familial social support and work-family
integration/blurring with total (time-based and strain-based) WFC, variables did explain a significant
portion of the variability in WFC. After controlling for other variables, familial social support (β = -
.363) and work-family integration/blurring (β = .425) explained 20.7% of the variance (R = .471, ∆ R2
= .207, p < .001) in total WFC.
While the three explanatory variables in this research model failed to predict the hypothesized
response, an additional binary logistic regression was conducted on individual survey questions for
familial/spousal social support, work-family integration/blurring, as well as time-based and strain-
based WFC to determine if micro-elements within each survey could predict profitability. When
entering sub-questions for each particular explanatory variable, significant findings were not revealed
in any of the predictor variables except for strain-based WFC. The nine strain-based WFC questions
focused on the effects of interfering demands, family stress influencing work performance, and family
obligations influencing work goals. Item 7, which stated “Because I am often stressed from family

SOBIE 2014
93
responsibilities, I have a hard time concentrating on my work” indicated an odds ratio = 19.09, p =
.011, Wald = 6.43. This finding suggested when owners felt their family responsibilities created
tension at work, they were less likely to perceived their business as profitable (Table 14).
Table 16
Binary logistic regression for strain-based WFC with perceived profitability
B S.E. Wald Sig. Exp(B)
1. I’m often too tired at work because of the things I
have to do at home.
.765 .490 2.440 .118 2.150
2. My personal demands are so great that it takes away
from my work.
.174 .708 .060 .806 1.190
3. My family life often interferes with my
responsibilities at work
-.656 .843 .606 .436 .519
4. Due to stress at home, I am often preoccupied with
family matters at work.
-.682 .737 .857 .354 .506
5. The stress from my family life interferes with my
work life.
-.744 .958 .603 .438 .475
6. I feel rushed at work so that I can go home to my
family.
-.804 .519 2.399 .121 .447
7. Because I am often stressed from family
responsibilities, I have a hard time concentrating on
my work.
2.949 1.163 6.433 .011 19.093
8. Tension and anxiety from my nonwork life often
extend into my job.
-1.250 .836 2.238 .135 .286
9. Due to all the pressures at home, sometimes it is hard
for me to do my job well.
1.043 .941 1.230 .267 2.839
Constant -3.054 1.074 8.091 .004 .047
Evaluation of Findings
Within this sample population, the average longevity of a business was slightly over eight
years, confirming that most small businesses are young in their years of operation. Considering
longevity, 58% of this population (59 businesses) had only been operating for five years or less while
6.8% of this population (7 businesses) had been operational 25 years or more. A significant
percentage, 79.4% of the business owners (81 businesses) indicated that their business was profitable.
Discovering a significant percentage of small business owners considering their business to be
profitable was unexpected. Although high yields and solid profit margins are the desire of most small
business owners (Gorgievski et al., 2011), half of all new business ventures are expected to close
within their first five years of operation (Knaup & Piazza, 2007). With a high failure rate, finding a
significant majority of business owners who perceived their business as profitable was unforeseen.

SOBIE 2014
94
Perceived profitability may have been elevated due to the sample of small business owners who
sought services through their local SBDC and because profitability was individually interpreted rather
than measured by a standard criterion.
Regarding total familial/spousal social support, respondents indicated M = 28.96 out of a
possible 40. Spousal support (M = 15.35) was greater than familial support (M = 13.62); instrumental
support (M = 8.36) was the most significant type of support while appraisal support (M = 6.19) was
the least. These findings were expected and consistent with Leaptrott (2009), Werbel and Danes
(2010), and van Daalen et al. (2006) who suggested that small business owners often sought
significant supportive resources from their spouses and family members. Additional findings from
this research revealed an inverse predictive relationship between social support and WFC. These
findings were consistent with COR theorists who suggested an increase of conflict and stress when
individuals experienced support resource deficiencies (Hobfoll, 2001).
Regarding work-family integration/blurring, this population reported M = 13.47 out of a
possible 20. This indicated that most of these business owners integrated and blurred their work and
life responsibilities. Additional results from this research indicated a positive predictive relationship
between work-family integration/blurring and WFC. Results confirmed Halbesleben et al.’s (2010)
and Odle-Dusseau et al.’s (2012) findings and corroborated COR theorists by suggesting role
integration increased WFC but also allowed for easier and repeated resource support and
transmissions between domains. In addition, business owners in this research tended to integrate their
work and family responsibilities at work more than at home. This role integration of work and home
appeared to foster more time-based and strain-based work-family conflict, validating boundary
theory, as well as Matthews, Barnes-Farrell, & Bulger (2010) and Winkel and Clayton (2010), who
proposed that individuals experienced increased WFC when work and family roles are blurred, and
established the strongest boundary in order to protect their most valuable domain.
Also within this research, time-based conflicts were more indicated (M = 20.54) than strain-
based conflicts (M = 18.98). Similar to van Daalen et al. (2006), this research revealed social support
did not solely explain a significant portion of the variability associated with time-based and strain-
based WFC. However, as stated previously, this research did reveal WFC increased when family
support decreased and work-family blurring/integration increased. This may indicate that when
domains are integrated and when owners fail to receive support resources, the chance for amplified
conflict between roles increases.
Findings from this study also indicated that small business longevity (R = .136, R2 = .019, p >
.05) and owner perceived profitability (B = -1.232, p > .05) could not be significantly predicted by
composite familial/spousal social support, work-family integration/blurring, and composite time-
based and strain-based WFC. The lack of a strong predictive relationship between variables was
unexpected because much of the literature (Breaugh & Frye, 2008; Carlson et al., 2009; Mitchelson,
2009; Zhang & Lui, 2011), as well as COR theory (Hobfoll, 2001), JD-R model (Bakker,
Brummelhuis, Prins, & van der Heijden, 2011), and social capital theory (Seiger & Wiese, 2009)
pointed to the connection between work-life balance and productivity. However, further investigation

SOBIE 2014
95
within this research showed that micro work-life balance elements could slightly, yet significantly,
predict longevity.
Results in this research were considered statistically significant if significance levels were
less than .05 in order to justify the importance of familial/spousal social support, work-family
integration/blurring, and WFC as predictive variables to longevity and perceived profitability. While
this research failed to reject H10 and H20, correlations were found between variables and 16.9% of the
variance in longevity was found in sub-questions within the surveys. Findings revealed a medium
correlation effect between work-family integration/blurring and total WFC, as well as work-family
integration/blurring with total familial/spousal social support. Additionally, family obligations,
which resulted in work place stress, did appear to influence profitability perceptions. Because
composite findings did not indicate significant confidence levels yet microelements revealed
significances, future research should seek to understand more clearly the associations between these
variables.
Implications
Results from this study revealed that with a small business population, perceived profitability
and longevity cannot be significantly predicted by familial/spousal social support, work-family
integration/blurring, and WFC; however, connections were present between business sustainability
and work-life balance factors.
Social support
This study presented valuable insights into the benefits of social support within the work
environment. Social support was assessed to determine both the source of support (family members
and spouses) as well as types of support (emotional, instrumental, appraisal, and informational).
Overall, this sample indicated the frequent receipt of supportive resources considering types and
sources. Spouses (M = 15.35) were perceived as providing more support than family members
provide (M = 13.62). Additionally, types of social support ranked in order of their perceived supplied
resource included instrumental (M = 8.36), emotional (M = 7.55), information (M = 6.90), and
appraisal (M = 6.19). Instrumental support involved providing time, money, resources, responsibility,
and energy to the business. Emotional support included the perception of empathy, care, concern, and
trust for the owner and the business. Informational support encompassed advice, insights, and
suggestions for business operation and growth. Finally, appraisal support comprised assessment,
consideration, approval, and opinion. Each of these support types were essential in reducing WFC
and increasing work-life balance (van Daalen et al., 2006). While composite support and individual
support types could not predict longevity or perceived profitability, based on research findings, small
business owners acknowledged time, money, and energy (instrumental resources) provided within
their business by spouse and family members were the most perceived support.

SOBIE 2014
96
Work-family integration/blurring
Within this sample, business owners tended to integrate their work and their personal lives.
Of the respondents, an average of 67.35% indicated they had difficultly delineating between where
their work life ended and their personal life began. As a probable motivational factor in starting a
business, the ability to have more control over work and personal roles and the ability to integrate
work and family responsibilities are a significant characteristic of small business ownership
(Gorgievski et al., 2011). Even though relational sacrifices are commonly found within business
ownership (Kozan, Oksoy, & Ozsoy, 2011), the desire for flexibility in work schedules, control over
workload (Hilbrecht et al., 2008), and integration between work and family roles appears to be typical
characteristics of business owners.
Extending Halbesleben et al.’s (2010) findings that suggested role integration and spousal
instrumental support reduced emotional exhaustion, as well as COR theorists who suggested cross-
domain support and integration improved success in both domains (Odle-Dusseau et al., 2012), the
highly integrated work and family roles of business owners may allow for easier and repeated
resource support and transmissions between domains. When boundaries are permeable, domains can
become blurred. Winkel and Clayton (2010) suggested that when boundaries are permeable,
individuals who have less control over work demand increases often experience increased WFC.
While small business owners have notably greater control over their work environment, they often do
not have the employee resources available that other individuals who work in mid-size or large
businesses. Thus, business owners often appear to juggle multiple tasks and integrate their roles.
Halbesleben et al. (2010) alternatively suggested that role integration and permeable boundaries
facilitated trans-role support and assistance. Within this research, business owners presented as
integrators of work and family roles. This integration of work and family roles indicated a slight
increase in WFC; however, spousal support and familial support may be acting as mitigating
resources reducing the feelings of time-based and strain-based conflict.
WFC
Also within this sample time-based WFC (M = 20.54) was more predominate than strain-
based WFC (M =18.98). While limited findings were revealed between composite predictor variables
and outcome variables of longevity and perceived profitability, further investigation revealed an
inverse predictive relationship between familial/spousal social support and WFC and a positive
predictive relationship between work-family integration/blurring and WFC. This may be the result of
family members and spouses who provide resources, time, energy, encouragement, and information
to business owners, which may diminish or negate any guilty or stressful feelings felt by owners
when work responsibilities take them away from their families. Additionally, when work and family
roles are blurred, the opportunity for increased interference, stress, and tension increases.
Additionally, business owners in this research tended to integrate their work and family
responsibilities at work more than they integrated work and family responsibilities at home. This
blurring of roles in their work environment appears to foster more time-based and strain-based work-
family conflict, and may validated Winkel and Clayton’s (2010) premise that individuals establish the
strongest boundary in order to protect their most valuable domain. Because this research study
focused on time and strain conflict from family members interfering with work, working on family
SOBIE 2014
97
obligations at work was a flexible benefit for business owners but resulted in tension between roles,
negative work productivity, and emotional exhaustion.
Although not directly related to the two established research questions regarding work-family
integration/blurring, findings from this research indicated composite familial/spousal social support
and work-family integration/blurring did predict WFC (18.4%). Similar to previous research (van
Daalen et al., 2006), social support did not solely explain a significant portion of the variability
associated with time-based and strain-based WFC. However, this research did reveal that as family
support decreased and work-family blurring/integration increased, WFC increased. This may indicate
that when domains are blurred and when owners fail to received supportive resources, the chance for
increased conflict between roles increases.
Research question 1: What is the predictive relationship of familial/spousal social support, work-
family integration/blurring, and WFC on small business longevity?
Extensive previous research (Breaugh & Frye, 2008; Carlson et al., 2009; Mitchelson, 2009;
Zhang & Lui, 2011) had established the caustic effect of increased WFC and poor work-life balance
on decreasing work performance and productivity. However, findings from this study did not find an
explanatory or predictor relationship between composite variables of familial/spousal social support,
work-family integration/blurring, and WFC with the response variable of longevity. This may be
explained by the varied and complex factors, which affect the business owners’ ability to sustain and
develop their business as well as the individual nuances held within each of these explanatory
variables. While composite variables could not explain the variance in longevity, individual items
within each survey did predict longevity.
Further investigation revealed that work-family integration/blurring (question 3) “I tend to
integrate my work and family duties at work” and strain-based WFC (question 8) “Tension and
anxiety from my nonwork life often extend into my job” positively predicted small business
longevity. Additionally, time-based WFC (question 6) “The time I spend with my family often
causes me to not spend time in activities at work that could be helpful to my career” inversely
predicted small business longevity. However, these three items predicted only a weak, but significant
relationship with operational longevity (9.6%). In the first two sub-items, the effects of fitting family
responsibilities into a work domain allowed the business owner to capitalize on the flexibility offered
with business ownership and work-load control afforded when an individual had influence over work
demands and schedules. In the time-based WFC item, findings revealed that when the business
owner sacrificed work obligations for family responsibilities, the business, specifically the operational
longevity of the business, was negatively affected.
Research question 2: What is the predictive relationship of familial/spousal social support, work-
family integration/blurring, and WFC on small business owner’s perceived profitability?

SOBIE 2014
98
Overall findings regarding the second research question indicated that composite
familial/spousal social support, work-family integration/blurring, and composite WFC could not
significantly predict the likelihood of perceived profitability. Even a detailed investigation of the
individual items within each survey could not significantly predict small business profitability.
Within this sample, a significant majority, over 79%, of the business owners indicated that they
perceived their business to be profitable. Using small businesses registered within the SBDC may
have distorted this dynamic. Because the goal of the SBDC is to promote business development and
expansion, this population may perceive itself more profitable than small business owners not
receiving benefits or services. Because so many of the business owners already perceive themselves
as profitable, trends could not be established regarding perceived profitability based on other
explanatory variables.
Only small correlations were found between profitability and time-based WFC (question 7),
which asked, “I feel guilty for spending time with my family when I know I should be concentrating
on work” (r = .277, p <.05) and between profitability and strain-based WFC (question 1), which
asked, “I’m often too tired at work because of the things I have to do at home” (r = .283, p = .005).
Both of these questions addressed (a) the stress and tension felt by the business owner when focusing
on family responsibilities, (b) the exhaustion, which can result from balancing work and family
responsibilities, and (c) the effects work-life strain has on work productivity. Although correlations
appeared to indicate only slight associations, faint connections did exist between work-life balance
elements and productivity, measured by small business owner perceived profitability.
Limitations
This study had limitations that may have influenced findings. While the sample size was
adequate, the sample was significantly skewed toward owners who had not been in business long-
term and who perceived their business profitable. This truncated results, making it difficult to
establish trends between longevity and perceived profitability with other explanatory variables.
Because of the non-normality of longevity, longevity data were transposed using the log10 method.
In addition, the concept of perceived profitability also presented limitations within this study.
Profitability is a significant factor to true small business growth, but was difficult to compare across
different industries and different size businesses. Reliance of such a critical factor based on one
question was problematic. The decision to ask one question regarding perceived profitability was
predicated on valuing the limited time available to business owners and the standardization of this
variable across multiple businesses. Having additional survey questions that addressed other aspects
of profitability would have provided a more complete picture of this dynamic. Additional questions
such as “Have your sales increased over the last year,” “Is your business growing,” and “Does your
business provide you with a sustainable wage” could be asked to respondents. This would allow the
scores from multiple profitability questions to be combined, creating a composite profitability
variable.
In addition, the two outcome variables of longevity and perceived profitability used in this
SOBIE 2014
99
research may have inadequately addressed the concept of business owner productivity. Since the
business owner’s responsibilities are diverse and extensive, quantifying their productivity was
problematic. Expanding outcome variables to address other productivity factors may provide a clear
description of the relationship between work-life balance and small business sustainability. In
addition, while spousal/familial support, work-family integration/blurring, and WFC were found to be
substantial factors within an individual’s work-life balance dynamic, there may be other variables that
help better explain work-life balance factors.
Recommendations
This research corroborated the connection felt between work and nonwork roles and
addressed work-life balance issues within a new population, small business ownership. Small
business ownership is a consuming enterprise, requiring extensive sacrifices yet offering flexibility,
individual control, and singular power. Making up the majority of the U.S workforce, small
businesses produce 50% of the private sector gross domestic product (Chow & Dunkelberg, 2011).
Small business owners are recognized for their persistent maintenance of business operations (Geho,
Smith, & Lewis, 2010). Small business ownership can be a demanding endeavor; success demands
knowledge, fortitude, as well as personal, financial, and relational sacrifices (Kozan et al., 2011).
Because small business sustainment is tied to performance, small businesses must seek strategic
measures to improve their competitive advantage (Latham, 2008).
For small business owners to be successful, extensive and varied relational and personal
sacrifices must be made in order to prevent business failure or stagnation (Kozan et al., 2011). Time
lost with spouses and family members, inadequate leisure activities, and increased workload are
common indicators of owner sacrifice and are significant indicators of entrepreneurial growth (Kozan
et al., 2011). Small business owners need to assess adequately their supportive resources including
emotional, instrumental, appraisal, and information support received from spouses and family
members as they initiate and develop their business. While this support may not strongly predict
business longevity or perceived profitability, this social support was evident in all small business
ownership and did abate family interference with work conflict. This dynamic, supported by
Matthews, Bulger, & Barners-Farrell, (2010), was revealed within this research, which indicated an
inverse correlation between support and WFC. Findings from this research confirmed DiRenzo,
Greenhaus, & Weer (2011), Hecht & Boies (2009), and Matthew, Bulger, et al. (2010) research by
suggesting when individuals perceive their family as supportive and encouraging of their work, they
are less likely to suffer with WFC.
Business owners must acknowledge that while workload controls allowed domains to be
integrated, work-family integration can result in cross-domain support as well as fatigue and
increased time-based and strain-based conflict (Breaugh & Frye, 2008). Owners must be aware that
work-life imbalance may decrease work productivity (Powell & Greenhaus, 2010); therefore, sensible
boundaries must be established to ensure continued work and family satisfaction, family wellbeing,
and business sustainability. Owners and entrepreneurs who learn to balance the conflicting demands
between family and business will perform more effectively in both roles (Leaptrott, 2009). Carlson et
al.’s (2009) research concurred by suggesting effective work-life balance develops when an
individual maintains mutually agreed upon role requirements, meets essential domain responsibilities,

SOBIE 2014
100
and releases extreme rigorousness that demands perfection in all domains.
Whether formally discussed as a part of small business coaching or informally considered in
familial or spousal conversations, the establishment of work-life balance boundaries and the impact of
relational sacrifices, which result from small business ownership should be discussed prior to starting
a small business venture and revisited periodically based on changes in work or family dynamics.
While composite familial/spousal social support, work-family integration/blurring, and WFC may not
be primary indicators of small business longevity and perceived profitability, their subtle effects on
the undertones of these outcome variables should not be ignored. Micro-elements within each of the
explanatory variables point to the connections between small business success and the effects of
social support, integration, and WFC. Essential to the business incubation and development process
should be the consideration of work-life balance dynamics. Business owners must be made aware,
whether intentionally or unintentionally, of the boundaries established between domains, the effect of
supportive resources, the benefits and disadvantages of work and family integration, and the
implications of WFC.
Future research
Future research should seek to determine additional measures of productivity to evaluate the
effects of work-life balance such as sales growth or employee expansion. Furthermore, this study
limited WFC by focusing on family interference with work; additional studies should focus on work
interference with family within the small business culture. Exploring the effects of work-life balance
on business owner family wellbeing and satisfaction will provide greater depth of understanding to
the work-life balance process.
Future studies should also examined the effects of working hours on productivity and well-
being. Work hours and workload may present as additional sustainable factors influencing small
business success. Additionally, the role that gender, spousal/family member employment within the
business, and industry classification differences have on work-life balance issues within a small
business population is also a recommended area of future research.
While this research focused on business owners, who extensively perceived their profitability,
additional research should be conducted on a population who do not perceive their businesses as
profitable. Concentrating on small businesses that have failed or are languishing to determine the
function work-life balance issues plays in the business struggle or closure would be an area of needed
investigation. Finally, a qualitative exploration of work-life balance subtleties including the effects of
social support, work-family integration, and WFC would provide further validity to this influence.
SOBIE 2014
101
Conclusions
Previous research suggested that work-life balance dynamics including social support, work-
family blurring, and WFC affected employee productivity (Breaugh & Frye, 2008; Carlson et al.,
2009; Mitchelson, 2009; Zhang & Lui, 2011). Although substantial findings were not revealed within
the research, subtle yet meaningful findings shed light on the impact of work-life balance dynamics
on small business success. Trends in social support, work-family integration/blurring, and WFC
could not significantly predict outcome variables but were evident in all small business ownership.
The establishment of work-life balance boundaries and the impact of relational sacrifices, which
result from small business ownership should be discussed prior to starting a small business venture
and revisited periodically based on changes in work or family dynamics. Additionally, business
owners should acknowledge that work-family integration could result in cross-domain support was
well as increased WFC. Sensible boundaries should be established in order to ensure work and
family satisfaction and business sustainability. Acknowledgment of the interface between work and
family with small business and entrepreneurial ventures was a factor of sustainability and should be
the focus of continued research.

SOBIE 2014
102
References Al-Qutop, M. Y., & Harrim, H. (2011). Quality of worklife human well-being linkage: Integrated
conceptual framework. International Journal of Business and Management, 6(8), 193-205.
doi:10.5539/ijbm.v6n8p193
Bakker, A. B., Brummelhuis, L. L., Prins, J. T., & van der Heijden, F. M. (2011). Applying the job
demands-resources model to the work-home interface: A study among medical residents and
their partners. Journal of Vocational Behavior, 79(1), 170-180. doi:10.1016/j.jvb.2010.12.004
Breaugh, J. A., & Frye, N. K. (2008). Work-family conflict: The importance of family-friendly
employment practices and family-supportive supervisors. Journal of Business Psychology,
22(4), 345-353. doi:10.1007/s10869-008-9081-1
Carifio, J., & Perla, R. J. (2007). Ten common misunderstandings, misconceptions, persistent myths
and urban legends about likert scale and likert response formats and their antidotes. Journal
of Social Science, 3, 106-116. doi:10.3844/jssp.2007.106.116
Carlson, D. S., Grzywacz, J. G., & Zivnuska, S. (2009). Is work-family balance more than conflict
and enrichment? Human Relations, 62(10), 1459-1479. doi:10.1177/0018726709336500
Carlson, D. S., Kacmar, K. M., & Williams, L. J. (2000). Construction and initial validation of a
multidimensional measure of work-family conflict. Journal of Vocational Behavior, 56(2),
249-276. doi:10.1006/jvbe.1999.1713
Chang, A., McDonald, P., & Burton, P. (2010). Methodological choices in work-life balance research
1987-2006: a critical review. The International Journal of Human Resource Management,
21(13), 2381-2413. doi:10.1080/09585192.2010.516592
Chow, M. J., & Dunkelberg, W. C. (2011). The small business sector in recent recoveries. Business
Economics, 46(4), 214-228. doi:10.1057/be.2011.23
Clark, S.C. (2000). Work/family border theory: A new theory of work/family balance. Human
Relations, 53(6), 747-770. doi:10.1177/0018726700536001
SOBIE 2014
103
Cronin-Gilmore, J. (2012). Exploring marketing strategies in small businesses. Journal of Marketing
Development and Competitiveness, 6(1), 96-107. Retrieved from http://www.na-
businesspress.com/jmdcopen.html
Demerouti, E. (2012). The spillover and crossover of resources among partners: The role of work-self
and family-self facilitation. Journal of Occupational Health Psychology, 17(2), 184-195.
doi:10.1037/a0026877
Desrochers, S., Hilton, J. M., & Larwood, L. (2005). Preliminary validation of the work-family
integration-blurring scale. Journal of Family Issues, 26(4), 442-466.
doi:10.1177/0192513X04272438
DiRenzo, M. S., Greenhaus, G. H., Weer, C. H. (2011). Job level, demands, and resources as
antecedents of work–family conflict. Journal of Vocational Behavior, 78(2), 305-314.
doi:10.1016/j.jvb.2010.10.002
Engel, C. J., Bell, R. L., Meier, R. J., Martin, M. J., & Rumpel, J. H. (2011). Young consumers in the
new marketing ecosystem: An analysis of their usage of interactive technologies. Academy of
Marketing Studies Journal, 15(2), 23-44. Retrieved from
http://www.alliedacademies.org/Public/Journals/JournalDetails.aspx?jid=12
Field, A. (2009) Discovering statistics using SPSS (3rd ed.). Thousand Oaks, CA: SAGE Publishing.
Geho, P. R., Smith, S., & Lewis, S. D. (2010). Is Twitter a viable commercial use platform for small
businesses? An empirical study targeting two audiences in the small business community.
The Entrepreneurial Executive, 15, 73-85. Retrieved from
http://www.alliedacademies.org/Public/Journals/JournalDetails.aspx?jid=9
Gorgievski, M. J., Ascalon, M., & Stephan, U. (2011). Small business owners' success criteria, a
values approach to personal differences. Journal of Small Business Management, 49(2), 207-
232. doi:10.1111/j.1540-627X.2011.00322.x
Greenhaus, J. H., & Beutell, N. J. (1985). Sources of conflict between work and family roles.
Academy of Management Review, 10, 76-88. Retrieved from http://www.aomonline.org/
SOBIE 2014
104
Greenhaus, J. H., & Powell, G. N. (2006). When work and family are allies: A theory of work-family
enrichment. Academy of Management Review, 31(1), 72-92. Retrieved from
http://www.aom.pace.edu/amr/
Gregory, A., & Milner, S. (2009). Editorial: Work-life balance: A matter of choice? Gender, Work
and Organization, 16(1), 1-13.
doi:10.1111/j.1468-0432.2008.00429.x
Grzywacz, J., & Carlson, D. (2007). Conceptualizing work-family balance: Implications for practice
and research. Advances In Developing Human Resources, 9(4), 455-471.
doi:10.1177/1523422307305487
Halbesleben, J. B. (2010). Spousal support and coping among married coworkers: Merging the
transaction stress and Conservation of Resources models. International Journal of Stress
Management, 17(4), 384-406. doi:10.1037/a0020500
Halbesleben, J. B., Harvey, J., & Bolino, M. C. (2009). Too engaged? A conservation of resources
view of the relationship between work engagement and work interference with family.
Journal of Applied Psychology, 94(6), 1452-1465. doi:10.1037/a0017595
Halbesleben, J. B., Zellars, K. L., Carlson, D. S., Perrewé, P. L., & Rotondo, D. (2010). The
moderating effect of work-linked couple relationships and work–family integration on the
spouse instrumental support-emotional exhaustion relationship. Journal of Occupational
Health Psychology, 15(4), 371-387.
doi:10.1037/a0020521
Headd, B., & Kirchhoff, B. (2009). The growth, decline and survival of small businesses: An
exploratory study of life cycles. Journal of Small Business Management, 47(4), 531-550.
doi:10.1111/j.1540-627X.2009.00282.x
Hecht, T. D., & Boies, K. (2009). Structure and correlates of spillover from nonwork to work: An
examination of nonwork activities, well-being, and work outcomes. Journal of Occupational
Health Psychology, 14(4), 414-426.
doi:10.1037/a0015981
Hilbrecht, M., Shaw, S., Johnson, L., & Andrey, J. (2008). 'I'm home for the kids': Contradictory
implications for work-life balance of teleworking mothers. Gender, Work and
Organization, 15(5), 454-476. doi:10.1111/j.1468-0432.2008.00413.x

SOBIE 2014
105
Hobfoll, S. E. (1989). Conservation of resources: A new attempt at conceptualizing stress. American
Psychologist, 44(3), 513-524. doi:10.1037/0003-066X.44.3.513
Hobfoll, S. E. (2001). The influence of culture, community, and the nested self in the stress process:
Advancing conservation of resources theory. Applied Psychology: An International Review,
50(3), 337-370. Retrieved from http://onlinelibrary.wiley.com/journal/10.1111/(ISSN)1464-
0597
House, J. S. (1981). Work stress and social support. Reading, MA: Addision-Wesley.
Kerlinger, F. N., & Pedhazur, E. J. (1973). Multiple regression in behavioral research. New York,
NY: Holt, Rinehart, and Winston.
Knaup, A., & C. Piazza, M. (2007). Business employment dynamics data: Survival and longevity, II.
Monthly Labor Review, 130(9), 3-10. Retrieved from
http://www.bls.gov/opub/mlr/welcome.htm
Kozan, M. K., Oksoy, D., & Ozsoy, O. (2011). Owner sacrifice and small business growth. Journal of
World Business. Online publication. doi:10.1016/j.jwb.2011.05.008
Latham, J. R. (2008). Building bridges between researchers and practitioners: A collaborative
approach to research in performance excellence. The Quality Management Journal, 15(1), 8-
26. Retrieved from http://asq.org/pub/qmj/
Lazar, I., Osoian, C., & Ratiu, P. (2010). The role of work-life balance practices in order to improve
organizational performance. European Research Studies, 13(1), 201-213. Retrieved from
http://www.ersj.eu/
Leaptrott, J. (2009). The effect of work - family role conflict on business startup decision-making
processes. Journal of Behavioral Studies in Business, 1, 1-17. Retrieved from
http://www.aabri.com/jbsb.html
Maertz, C. P., & Boyar, S. L. (2011). Work-family conflict, enrichment, and balance under "levels"
and "episodes" approaches. Journal of Management, 37(1), 68-98.
doi:10.1177.0149206310382455

SOBIE 2014
106
Matthews, R. A., Barnes-Farrell, J. L., & Bulger, C. A. (2010). Advancing measurement of work and
family domain boundary characteristics. Journal of Vocational Behavior, 77, 447-460.
doi:10.1016/j.jvb.2010.05.008
Matthews, R. A., Bulger, C. A., & Barnes-Farrell, J. L. (2010). Work social supports, role stressors,
and work-family conflict: The moderating effect of age. Journal of Vocational Behavior, 76,
78-90. doi:10.1016/j.jvb.2009.06.011
Michel, J. S., Mitchelson, J. K., Kotrba, L. M., LeBreton, J. M., & Baltes, B. B. (2009). A
comparative test of work-family conflict models and critical examination of work-family
linkages. Journal of Vocational Behavior, 74, 199-218.
doi:10.1016/j.jvb.2008.12.005
Michel, J. S., Mitchelson, J. K., Pichler, S., & Cullen, K. L. (2010). Clarify relationships among work
and family social support, stressors, and work-family conflict. Journal of Vocational
Behavior, 76(1), 91-104. doi:10.1016/j.jvb.209.05.007
Mitchelson, J. K. (2009). Seeking the perfect balance: Perfectionism and work-family conflict.
Journal of Occupational & Organizational Psychology, 82(2), 349-367.
doi:10.1348/096317908X314874
Moreno-Jiménez, B., Mayo, M., Sanz-Vergel, A., Geurts, S., Rodríguez-Muñoz, A., & Garrosa, E.
(2009). Effects of work–family conflict on employees’ well-being: The moderating role of
recovery strategies. Journal Of Occupational Health Psychology, 14(4), 427-440.
doi:10.1037/a0016739
Neumark, D., Wall, B., & Zhang, J. (2011). Do small businesses create more jobs? New evidence
from the United States from the National Establishment Time Series. Review of Economics &
Statistics, 93(1), 16-29. doi:10.1162/REST_a_00060
Odle-Dusseau, H. N., Britt, T. W., Greene-Shortridge, T. M. (2012). Organizational work-family
resources as predictors of job performance and attitudes: The process of work-family conflict
and enrichment. Journal of Occupational Health Psychology, 17(1), 28-40.
doi:10.1037/a0026428

SOBIE 2014
107
Pallant, J. (2010). SPSS survival manual: A step by step guide to data analysis using SPSS (4th ed.).
Berkshire, England: McGraw Hill.
Parasuraman, S., Greenhaus, J. H., & Granrose, C. S. (1992). Role stressors, social support, and well-
being among two-career couples. Journal of Organizational Behavior, 13(4), 339-339.
Retrieved from http://onlinelibrary.wiley.com/journal/10.1002/(ISSN)1099-1379.
Powell, G. N., & Greenhaus, J. H. (2010). Sex, gender, and decisions at the family → Work interface.
Journal Of Management, 36(4), 1011-1039. doi:10.1177/0149206309350774
Quick, J. D., Henley, A. B., & Quick, J. C. (2004). The balancing act – At work and at home.
Organizational Dynamics, 33(4), 426-438. doi:10.1016/j.orgdyn.2004.09.008
Schneider, B., Macey, W H, Barbera, K M, & Martin, N. (2009). Driving customer satisfaction and
financial success through employee engagement. People & Strategy, 32(2), 22-28. Retrieved
from http://www.hrps.org/
Seiger, C. P., & Wiese, B. S. (2009). Social support from work and family domains as an antecedent
or moderator of work-family conflicts? Journal of Vocational Behavior, 75, 26-37.
doi:10.1016/j.jvb.2009.03.001
Small Business Administration (2012). Retrieved from http://web.sba.gov/
Steinmetz, H., Frese, M., & Schmidt, P. (2008). A longitudinal panel study on antecedents and
outcomes of work-home interference. Journal of Vocational Behavior, 73(2), 231-241.
doi:10.1016/j.jvb.2008.05.002
Stevens, J. (1996). Applied multivariate statistics for the social sciences (3rd ed.). Mahwah, NJ:
Lawrence Erlbaum.
Tabachnick, B. G., & Fidell, L. S. (2007). Using multivariate statistics (5th ed.). Boston, MA:
Pearson Education.
ten Brummelhuis, L. L., & van der Lippe, T. (2010). Effective work-life balance support for various
household structures. Human Resource Management, 49(2), 173-193. doi:10.1002/hrm.20340

SOBIE 2014
108
van Daalen, G., Willemsen, T. M., & Sanders, K. (2006). Reducing work-family conflict through
different sources of social support. (Report). Journal of Vocational Behavior, 69(3), 462-
476. doi:10.1016/j.jvb.2006.07.005
Werbel, J. D., & Danes, S. M. (2010). Work family conflict in new business ventures: The
moderating effects of spousal commitment to the new business venture. Journal of Small
Business Management, 48(3), 421-440. doi:10.1111/j.1540-627X.2010.00301.x
Williams, D., & Jones, O. (2010). Factors associated with longevity of small, family-owned firms.
International Journal of Entrepreneurship, 14, 37-57. Retrieved from
http://www.alliedacademies.org/Public/Journals/JournalDetails.aspx?jid=7
Winkel, D. E., & Clayton, R. W. (2010). Transitioning between work and family roles as a function
of boundary flexibility and role salience. Journal of Vocational Behavior, 76(2), 336-343.
doi:10.1016/j.jvb.2009.10.011
Winship, C., & Mare, R. D. (1984). Regression models with ordinal variables*. American
Sociological Review, 49, 512-525. Retrieved from
http://www.asanet.org/journals/asr/american_sociological_review.cfm?CFID=9100968&CFT
OKEN=33037383
Zachary, R. K., & Mishra, C. S. (2010). Entrepreneurship research today and beyond: Hidden in plain
sight!. Journal of Small Business Management, 48(4), 471-474. doi:10.1111/j.1540-
627X.2010.00304.x
Zhang, J., & Liu, Y. (2011). Antecedents of work-family conflict: Review and prospect. International
Journal of Business and Management, 6(1), 89-103. Retrieved from http://www.ijbmt.com/
Zikmund, W. G., Babin, B. J., Carr, J. C., & Griffin, M. (2010). Business research methods (8th ed.).
Mason, OH: South-Western Cengage Learning.

SOBIE 2014
109
Improving Shewhart Control Chart Performance Using Two-
Stage Sampling
Kenneth W. Linna
Auburn University Montgomery, Montgomery, AL 36124
Abstract
The usual Shewhart control chart efficiently detects relatively large shifts in the mean of a
quality characteristic and has been extensively studied in the literature. Most proposed
alternatives to the Shewhart chart aim to improve either the signal performance at smaller
mean shifts or reduce the sampling effort required to detect a larger shift. The use of two-
stage sampling is considered here, whereby it is shown that both the average total sample size
and the average run length are improved relative to the standard Shewhart control chart.
Introduction
The Shewhart control chart as presented in, e.g., Shewhart (1939) remains as perhaps the
most widely employed and studied tool in statistical process control. In the simplest case, the
Shewhart chart operates as a sequence of presumably independent tests of hypothesis
concerning some parameter of interest. Generally, successive samples are obtained at
intervals and checked against one or more control limits. Typically, in the so-called
standards given case, the basic Shewhart chart for the process mean employs control limits as
follows:
.
In the preceding formula, µ is the assumed known (or desired) process mean, is the
upper percentage point of the standard normal distribution, σ is the assumed known
(desired) process standard deviation, n is the sample size, and α is the desired type I error
rate. The upper and lower values resulting from the preceding are generally referred to as the
upper and lower control limits, or UCL and LCL, respectively.
The chart is said to produce a signal when any plotted sample mean exceeds the control
limits, effectively a rejection of the null hypothesis that the process mean is equal to the in-
control value µ. Many proposed modifications to this basic construction involve varying the
sample size, sampling interval, placement of the control limits, number of control limits, and
application of myriad alternate rejection rules.
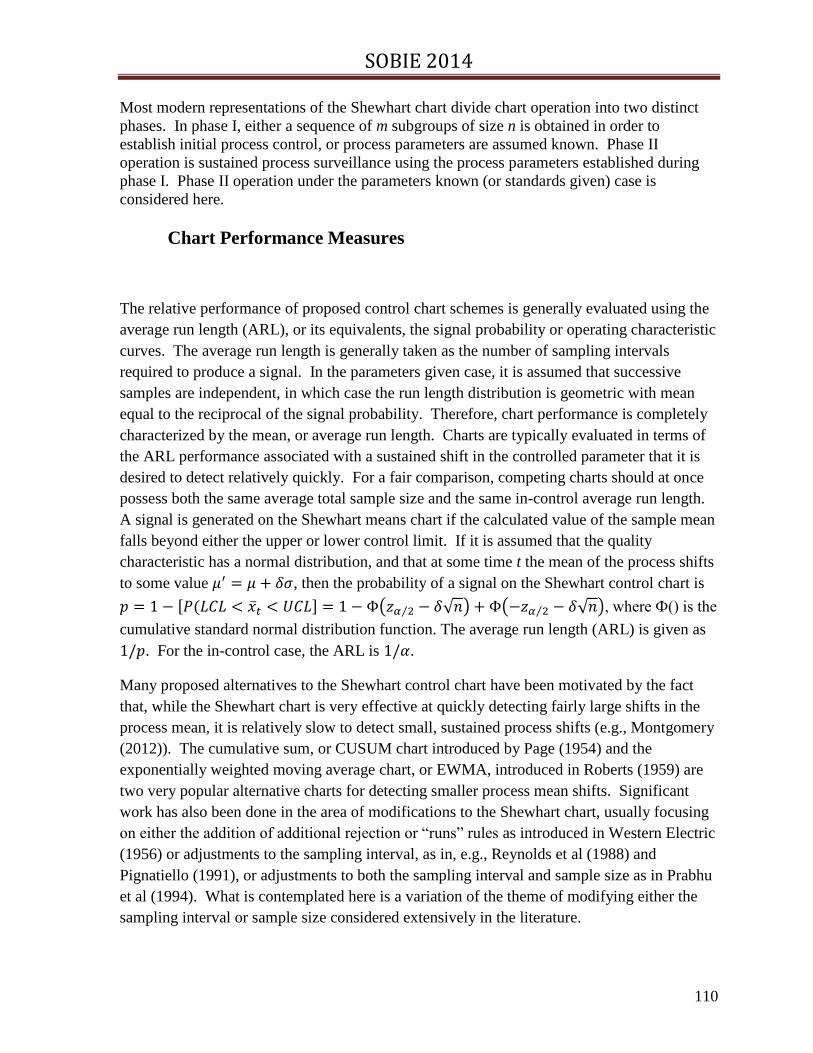
SOBIE 2014
110
Most modern representations of the Shewhart chart divide chart operation into two distinct
phases. In phase I, either a sequence of m subgroups of size n is obtained in order to
establish initial process control, or process parameters are assumed known. Phase II
operation is sustained process surveillance using the process parameters established during
phase I. Phase II operation under the parameters known (or standards given) case is
considered here.
Chart Performance Measures
The relative performance of proposed control chart schemes is generally evaluated using the
average run length (ARL), or its equivalents, the signal probability or operating characteristic
curves. The average run length is generally taken as the number of sampling intervals
required to produce a signal. In the parameters given case, it is assumed that successive
samples are independent, in which case the run length distribution is geometric with mean
equal to the reciprocal of the signal probability. Therefore, chart performance is completely
characterized by the mean, or average run length. Charts are typically evaluated in terms of
the ARL performance associated with a sustained shift in the controlled parameter that it is
desired to detect relatively quickly. For a fair comparison, competing charts should at once
possess both the same average total sample size and the same in-control average run length.
A signal is generated on the Shewhart means chart if the calculated value of the sample mean
falls beyond either the upper or lower control limit. If it is assumed that the quality
characteristic has a normal distribution, and that at some time t the mean of the process shifts
to some value , then the probability of a signal on the Shewhart control chart is
, where Ф() is the
cumulative standard normal distribution function. The average run length (ARL) is given as
. For the in-control case, the ARL is .
Many proposed alternatives to the Shewhart control chart have been motivated by the fact
that, while the Shewhart chart is very effective at quickly detecting fairly large shifts in the
process mean, it is relatively slow to detect small, sustained process shifts (e.g., Montgomery
(2012)). The cumulative sum, or CUSUM chart introduced by Page (1954) and the
exponentially weighted moving average chart, or EWMA, introduced in Roberts (1959) are
two very popular alternative charts for detecting smaller process mean shifts. Significant
work has also been done in the area of modifications to the Shewhart chart, usually focusing
on either the addition of additional rejection or “runs” rules as introduced in Western Electric
(1956) or adjustments to the sampling interval, as in, e.g., Reynolds et al (1988) and
Pignatiello (1991), or adjustments to both the sampling interval and sample size as in Prabhu
et al (1994). What is contemplated here is a variation of the theme of modifying either the
sampling interval or sample size considered extensively in the literature.

SOBIE 2014
111
Two-Stage Sampling Model
It is proposed here that, at each sampling interval, one sample of size n1 be obtained followed
by a contingency-dependent second sample of size n2. The subsequent calculations are based
on the assumption that a second sample may be obtained, if indicated, within a negligible
time interval subsequent to the first sample. Three sets of control limits are used in the
construction of the control chart as follows:
,
,
,
,
,
,
where
The operation of the proposed chart at each sampling interval is as follows:
1) The first sample mean ( ) falls between LCL1 and UCL1, no signal is generated, and
monitoring for the sampling interval is completed.
2) The sample mean ( ) falls outside either LCL1 or UCL1, but between LCL2 and UCL2,
after which a second sample of size n2 is obtained.
3) The sample mean ( ) falls beyond either LCL2 or UCL2, producing a signal.
4) The second sample mean ( ) falls outside either LCL3 or UCL3, producing a signal, or
between LCL3 and UCL3, completing monitoring for the sampling interval.
The probability of a signal on the two-stage control chart is calculated as follows:
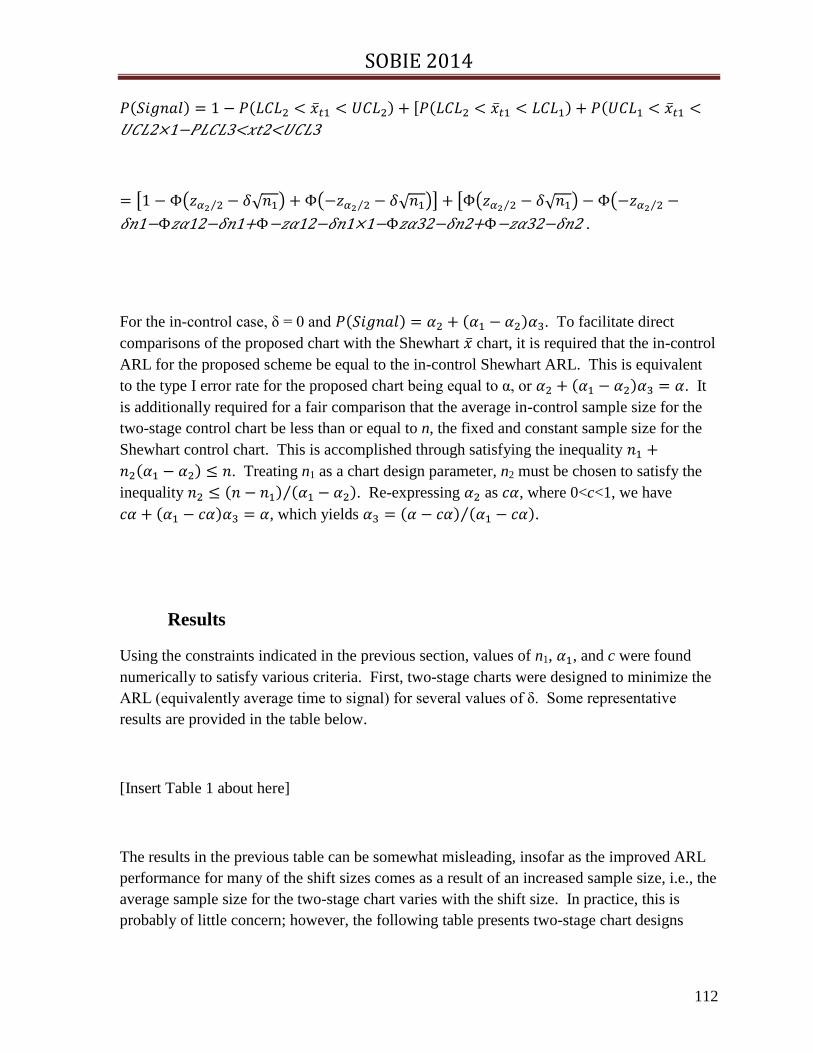
SOBIE 2014
112
2× 3< 2< 3
1 12 1+ 12 1× 32 2+ 32 2 .
For the in-control case, δ = 0 and . To facilitate direct
comparisons of the proposed chart with the Shewhart chart, it is required that the in-control
ARL for the proposed scheme be equal to the in-control Shewhart ARL. This is equivalent
to the type I error rate for the proposed chart being equal to α, or . It
is additionally required for a fair comparison that the average in-control sample size for the
two-stage control chart be less than or equal to n, the fixed and constant sample size for the
Shewhart control chart. This is accomplished through satisfying the inequality
. Treating n1 as a chart design parameter, n2 must be chosen to satisfy the
inequality . Re-expressing as , where 0<c<1, we have
, which yields .
Results
Using the constraints indicated in the previous section, values of n1, , and c were found
numerically to satisfy various criteria. First, two-stage charts were designed to minimize the
ARL (equivalently average time to signal) for several values of δ. Some representative
results are provided in the table below.
[Insert Table 1 about here]
The results in the previous table can be somewhat misleading, insofar as the improved ARL
performance for many of the shift sizes comes as a result of an increased sample size, i.e., the
average sample size for the two-stage chart varies with the shift size. In practice, this is
probably of little concern; however, the following table presents two-stage chart designs

SOBIE 2014
113
compared with the Shewhart chart on the basis of the average number of observations
required to produce a signal at a given shift size.
[Insert Table 2 about here]
Conclusions
With a fairly simple modification, it is possible to dramatically improve upon the basic
Shewhart chart with respect to either average run length or average total sampling effort to
produce a signal, and frequently both at once, for certain specified ranges of process mean
shifts. No comparison is made here, although a cursory investigation indicates that the two-
stage chart is a capable rival for the popular CUSUM and EWMA control charts. Future
investigations should consider direct comparisons between the two-stage procedure discussed
here and other, more established procedures. Analyses of the performance of the two-stage
chart under other conditions such as estimated parameters, non-normality of the quality
characteristic, and measurement error should also be added.
References
Champ, C. W. and W. H. Woodall (1987). “Exact Results for Shewhart Control Charts with
Supplementary Runs Rules,” Technometrics, Vol. 29(4), pp. 393-399.
Montgomery, D.C. (2012). Introduction to Statistical Quality Control, Seventh Edition, John
Wiley & Sons, Inc., New York.
Page, E. S. (1954). “Continuous Inspection Schemes,” Biometrics, Vol. 41(1), pp. 100-115.
Pignatiello, J. J., Jr., and G. C. Runger (1991). “Adaptive Sampling for Process Control,”
Journal of Quality Technology, Vol. 22(3), pp. 135-155.

SOBIE 2014
114
Prabhu, S. S., D. C. Montgomery, and G. C. Runger (1995). “A Design Tool to Evaluate
Average Time to Signal Properties of Adaptive Charts,” Journal of Quality
Technology, Vol. 27(1), pp. 74-76.
Reynolds, M. R., Jr., R. W. Amin, J. C. Arnold, and J. A. Nachlas (1988). “ Charts with
Variable Sampling Intervals,” Technometrics, Vol. 30(2), pp. 181-192.
Roberts, S. W. (1959). “Control Chart Tests Based on Geometric Moving Averages,”
Technometrics, Vol. 42(1), pp. 97-102.
Shewhart, W.A. (1939). Statistical Method from the Viewpoint of Quality Control, Graduate
School of the Department of Agriculture, Washington, D.C. (Republished by Dover
Publications, Inc., Mineola, NY, 1986).
Western Electric (1956). Statistical Quality Control Handbook, Western Electric
Corporation, Indianapolis, IN.
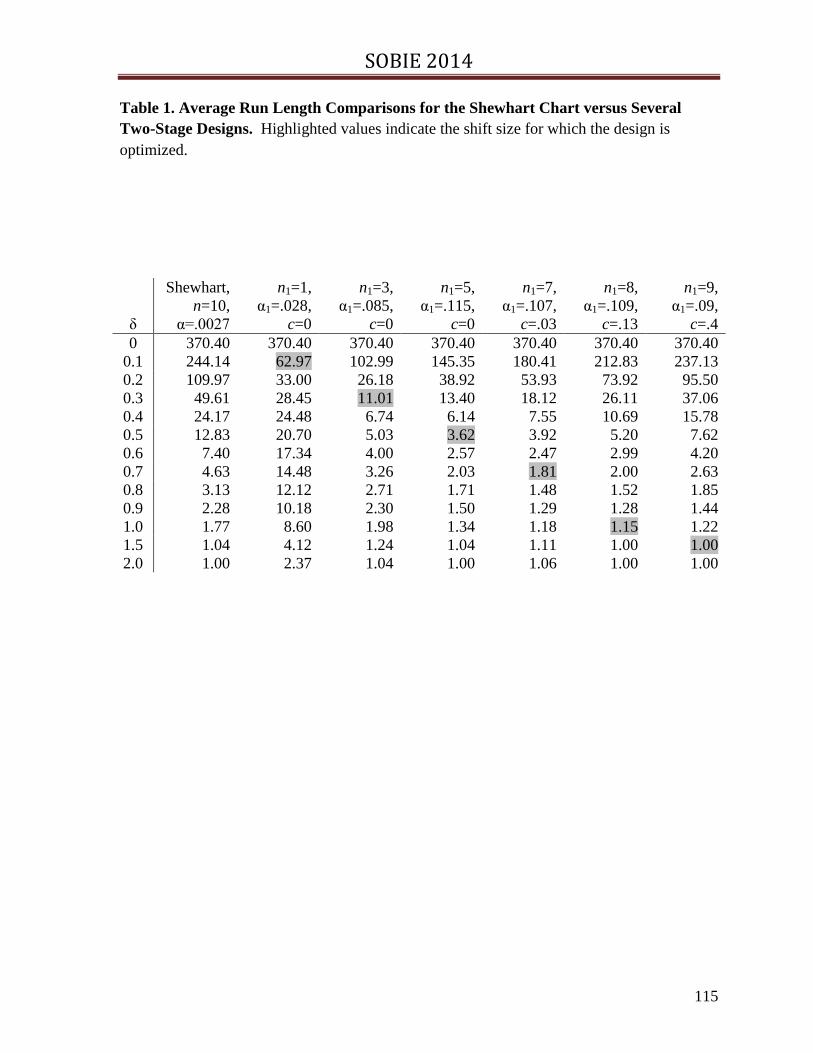
SOBIE 2014
115
Table 1. Average Run Length Comparisons for the Shewhart Chart versus Several
Two-Stage Designs. Highlighted values indicate the shift size for which the design is
optimized.
δ
Shewhart,
n=10,
α=.0027
n1=1,
α1=.028,
c=0
n1=3,
α1=.085,
c=0
n1=5,
α1=.115,
c=0
n1=7,
α1=.107,
c=.03
n1=8,
α1=.109,
c=.13
n1=9,
α1=.09,
c=.4
0 370.40 370.40 370.40 370.40 370.40 370.40 370.40
0.1 244.14 62.97 102.99 145.35 180.41 212.83 237.13
0.2 109.97 33.00 26.18 38.92 53.93 73.92 95.50
0.3 49.61 28.45 11.01 13.40 18.12 26.11 37.06
0.4 24.17 24.48 6.74 6.14 7.55 10.69 15.78
0.5 12.83 20.70 5.03 3.62 3.92 5.20 7.62
0.6 7.40 17.34 4.00 2.57 2.47 2.99 4.20
0.7 4.63 14.48 3.26 2.03 1.81 2.00 2.63
0.8 3.13 12.12 2.71 1.71 1.48 1.52 1.85
0.9 2.28 10.18 2.30 1.50 1.29 1.28 1.44
1.0 1.77 8.60 1.98 1.34 1.18 1.15 1.22
1.5 1.04 4.12 1.24 1.04 1.11 1.00 1.00
2.0 1.00 2.37 1.04 1.00 1.06 1.00 1.00

SOBIE 2014
116
Table 2. Comparisons of Average Total Observations to Signal for the Shewhart Chart
versus Several Two-Stage Designs. Highlighted values indicate the shift size for which the
design is optimized.
δ
Shewhart,
n=10,
α=.0027
n1=1,
α1=.028,
c=0
n1=1,
α1=.117,
c=0
n1=1,
α1=.198,
c=0
n1=1,
α1=.420,
c=0
n1=9,
α1=.096,
c=.67
n1=9,
α1=.164,
c=.82
0 3703.98 3693.63 3663.98 3670.65 3637.31 3682.47 3693.14
0.1 2441.38 644.84 1035.40 1347.32 1880.32 2437.24 2531.71
0.2 1099.67 363.04 281.50 382.31 659.17 1073.77 1198.70
0.3 496.10 349.48 131.64 152.66 263.01 465.03 559.28
0.4 241.71 345.48 93.32 84.15 124.57 219.04 279.14
0.5 128.25 341.70 83.71 60.25 69.55 114.45 150.50
0.6 74.02 338.34 81.63 51.71 45.14 66.30 87.39
0.7 46.34 335.48 80.89 48.94 33.43 42.26 54.39
0.8 31.34 333.12 80.34 48.11 27.60 29.34 36.12
0.9 22.79 331.18 79.86 47.76 24.72 21.92 25.52
1.0 17.72 329.60 79.44 47.51 23.37 17.42 19.12
1.5 10.42 325.12 78.11 46.70 22.30 9.85 9.62
2.0 10.00 323.36 77.50 46.30 22.13 9.02 9.01
SOBIE 2014
117
Occupational Trends in Mass Communication in the Southern
U.S.
Randall Dupont
University of Mobile
Abstract Technology has radically transformed mass communication industries in the past two
decades, changing organizational workflow processes and workforce composition.
Occupational analysis can provide deeper insight into the extent of industry change. This
descriptive study examines employment trends for seven mass communication occupations in
the United States, with particular emphasis on the southern region. Mass communication
occupations studied include radio and television announcers, broadcast news analysts,
reporters and correspondents, public relations specialists, editors, technical writers, and
writers and authors. Trends in the southern U.S. are compared with the rest of the country.
Introduction
Technological innovation has had a profound impact on occupations in the
information age. Perhaps, no better example of this impact exists than in mass
communication industries. Communication technologies have converged to redefine the
industry landscape, changing how information is received and from whom.
Technological evolution has changed organizational workflow processes, resulting in
changes in the occupational composition of the workforce. Khattak, Nasir, and Sultan (2012)
examined the role of information technology in the media industry. Since the information
age began in 1950, technology has changed how information is produced and disseminate.
They examined how the evolution of internet journalism has affected, even eliminated jobs in
the production process of traditional print and broadcast media. The authors concluded
information technology played a tremendous role in transforming the media industry,
particularly print, broadcast, and electronic media.
This technological impact was not unexpected and has been a topic of interest in
journalism for some time. John Pavlik’s (2001) Journalism and New Media examined how
new communication technologies were altering journalism, while Paschal Preston’s (2001)
Reshaping Communications: Technology, Information and Social Change attempted to
assess the impact of the technology on the profession in light of the Kondratieff waves of
capitalism. Writing in 1994, Dizard addressed how the media organizations were adapting to
changes in audience expectations caused by the new technologies. He predicted newspaper
readership would decline as technology use increased (Dick, 1996).

SOBIE 2014
118
The revolutionary aspect of the new technology is its ability to enable what and how
information is received, and from whom. Fifty percent of all adults owned either a
smartphone or tablet in 2012. Sixty-six percent of those owners got their news on their
device and 37% checked it daily. Americans are now able to get their news whenever and
wherever (Mitchell, Rosenstiel, & Houston, 2012). If recent journalism and mass
communication graduates are any indication, the shift from traditional media has been
dramatic. Three out of four graduates reported getting news online in 2012. Printed
newspaper use among graduates dropped from 61% in 2006 to 37% in 2012, while broadcast
use for news dropped from 75% in 2006 to 64% in 2012 (Boyles, 2013).
Universities are feeling the effects of the changing mass communication workforce as
bleak job prospects decreased enrollment and force graduates to extend their education.
Enrollment in journalism and mass communication undergraduate programs declined in 2011
and 2012, the first back-to-back annual declines in 20 years. Master degree enrollment
dropped 2.9% in 2012 and 9.4% the year earlier. Furthermore, the number of undergraduate
journalism and mass communication programs offered by universities declined 1.2% in 2012
and by 2.3% at the master’s level programs that year. Nevertheless, doctoral program
enrollment increased by 4.2% and 4.9% in 2011 and 2012, respectively, with full-time
faculty teaching in those programs increasing 5.9% (Becker, Vlad, Simpson, & Kaplen,
2013).
In a free market economy, organizations restructure to meet the needs of society.
Mass communication industries are no different. Restructuring has led to a remixing of the
occupational composition in the industry, but to what extent have occupations changed?
Sampson and Reardon (2011) recommended examining occupational changes in both
percentage and absolute terms. Their review of the literature found that technology and
globalization were fundamentally reshaping the workplace. Organizations were rapidly
adapting their workforce to the change and that classification schema used for occupations
remains relatively stable for analysis purposes. However, Sampson and Reardon (2011)
believe that technological advances quicken the pace of job changes within a given
occupation. They distinguish between absolute and percentage changes in occupations in
their analysis and argue for use of both. Some of the fastest growing occupations in
percentage terms are relatively small in absolute terms. On the other, hand a small
percentage change in some occupations may produce a substantial change in absolute terms.
Measuring industry occupational change can be done through surveys or examination
of existing labor statistics data. Employment surveys in mass communications are not new,
but have been limited to the job prospects of new entrants in the profession or projections of
job outlook over the next decade. Most notable is the University of Georgia’s Annual
Survey of Journalism & Mass Communication Enrollments. The annual survey provides
insight into the employment prospects of new college graduates. The latest employment
survey found that 65.6% of 2012 college graduates with journalism and mass communication
degrees obtained full-time employment within six to eight months after graduation, higher
than in 2009 when the employment rate reached its lowest point in 24 years at 55.5%.
Although still below the 2007 level of 70.25%, new graduate employment is making a
recovery (Boyles, 2013).

SOBIE 2014
119
Another common type of employment survey focuses on occupational outlook. The
Department of Labor and Bureau of Labor Statistics periodically publishes the Occupational
Outlook Quarterly and maintains the Occupational Outlook Handbook on the Bureau’s
website. The publication is an excellent prospective resource, focusing on 10-year national
employment projections. However, it does not go far enough to help researchers identify
regional occupational trends.
Missing from the literature are regional studies on mass communication, particularly
for the southern region of the U.S. This may be because regional differences are assumed to
be nonexistent, irrelevant, or transitory. However, when Moore (1951) conducted a
regional analysis of mass communications in the southern U.S. in the early 1950s, he found
that “the people of the South do not have, and therefore do not use, the media of mass
communication to the extent they are used by other citizens of the nation” (p. 375). Moore
says Southerners are happy to point out their differences from other regions and he suggests
that the lack of effective media communications in the South is an important factor in
maintaining that difference. He goes on to explain that social well-being is dependent upon
mass communications because without such communications “stereotypes and prejudices
tend to replace accurate and factual information” (p. 375). He concluded the southern U.S.
“differs materially from other regions of so closely knit a society as that of the United States”
(p. 376).
Do differences in mass communications remain in the Southern U.S. compared to the
rest of the country, as Moore suggested? An examination of trends in mass communication-
related occupations in the region can provide insight into that question. This study examines
changes in the industry’s occupational mix as well as trends at the national and southern
regional level. This study is primarily descriptive, but reasons for industry changes are
explored in the discussion.
Scope
This research examines changes in national, regional, and state employment in mass
communication occupations from 1997 through 2012. This descriptive study provides
scholars and educators with a look at the past to better understand the direction and
magnitude of industry employment trends. In addition, it should help educators guide
students toward growing career opportunities or at least help them avoid entering declining
occupations. While the focus of the research is the southern United States, national trends
are developed for comparison purposes.
This study aggregates relevant data on specific mass communication occupations in
an attempt to discover underlying patterns of employment change. Furthermore, the research
uses the most recently available location quotient data to determine significance in
geographical differences in mass communication occupations between the southern U.S. and
rest of the country.
SOBIE 2014
120
Data and Methodology
Data for this analysis were obtained from the U.S. Bureau of Labor Statistics’ (BLS)
Occupational Employment Statistics database. Employment level data were collected for
seven mass communication-related occupations for 1997 through 2012 and occupational
concentration data obtained for the most recent year, 2012. The seven communication
occupations studied fall within Standard Occupational Classification (SOC) Minor Group 27-
3000, Media and Communication Workers. Media and communication workers include
radio and television announcers, reporters and correspondents, public relations specialists,
editors, technical writers, and writers and authors. Table 1 provides examples of job titles for
each occupation. A complete BLS definition of each occupation is found in Appendix A.
[Insert Table 1]
Although the Bureau of Labor Statistics has been publishing the Occupational
Employment Statistics database since 1997, occupational classifications were fluid in the
initial years making trend analysis back to 1997 difficult, except on an aggregate level. For
example, broadcast news analysts were initially a separate classification in 1997 and 1998,
but later combined with reporters and correspondents from 1999-2003. Likewise, editors
were once included with technical writers and authors, but later separated from those
occupations. Not until 2004 did the Standard Occupational Classification for media and
communication workers (SOC Minor Group, 27-3000) adopt its present form. Therefore,
2004 data are used as the starting point for trend analysis in specific occupations. However,
trend analysis on an aggregate level is not affected by reclassifications and where available
these occupational trends are examined back to 1997.
The study examines employment levels and associated changes in mass
communication-related occupations in the southern United States region, making
comparisons with the rest of the country. For purposes of this study, the southern U.S. region
includes the following states represented by the Southern States Communications
Association (SSCA): Alabama, Arkansas, Florida, Georgia, Louisiana, Mississippi, North
Carolina, South Carolina, Tennessee, Texas, and Virginia. While SSCA membership is not
confined to this region, memberships from these states compose the vast majority of the
association (C. Cates, personal communication, September 5, 2013).
Time-series analysis is used to examine trends in national and regional employment
for 1997 through 2012. Comparative analysis is used in examining employment differences
between southern U.S. states (SUS) and the rest of the country (ROC). Cross-sectional
analysis is used in examining state-based occupational concentration and T-test are used to
determine regional difference by occupation.

SOBIE 2014
121
Results
The results of this analysis are divided into the following sections: national, regional,
state, and geographical concentration.
National Employment
This section analyzes national aggregate employment trends in each of the seven
selected occupations of the mass communication field. Figure 1 shows a 15-year trend in
total U.S. mass communication occupations as well as annual percentage changes. From
1997 to 2012 employment in mass communication occupations increased 23% from 381,300
to 470,550. Peak employment was reached in 2008 at 536,540 and has since declined by
12% or 65,990 jobs. However, the rate of decline has slowed in recent years, as indicated by
the dotted line. Annual declines peaked in 2010 at 6%, slowing to only 2% by 2012.
Notable in Figure 1 is the stair-step growth pattern in employment in the first 11 years
of the chart. From 1997-1999, employment grew at an annual rate of 4.9%, and then
plateaued at a .85% growth rate from 2000-2004. Mass communication hiring accelerated
again in late 2004 through 2008, averaging 4.2% a year and peaking just six months after the
start of the recession. However, mass communication occupations have not rebounded
during the recovery. Since its peak in 2008, the annual employment growth rate has been -
3.2%, the first sustained decline in the past 15 years.
[Insert Figure 1]
The table in Appendix B contains employment data at the national level by
occupation for each year since 2004. However to better illustrate the employment changes
reflected in the data, Figure 2 below shows trend percentage using 2004 as the base year. In
other words, an occupation’s employment level for each subsequent year is expressed as a
percentage of its 2004 level. As seen in Figure 2, public relations specialist had the largest
increase, peaking in 2009 at 1.46 times or 146% of its 2004 level. Editors, technical writers,
and writers and authors rose above 2004 levels with writers peaking in 2007 and editors and
technical writers peaking in 2008. Announcers and broadcast news analyst never exceeded
2004 levels, while reporters kept parity until 2006 before falling behind. Interestingly, public
relations specialists were not only the fastest rising group, but the last occupational group to
peak in employment before the recent decline.
[Insert Figure 2]
The composition of occupations within the mass communication field is changing as
well. Table 2 compares occupational composition of the field in 2004 and 2012 at the
national and regional level. At the national level, all occupations declined proportionately,
except public relations specialists which grew by over 6 percent. The same held true at the
SUS regional level, except technical writers grew as well as public relations specialists.
Comparing the latest occupational composition of the region with the national composition,
the southern U.S. had a larger proportion of announcers, broadcast news analysts, public
SOBIE 2014
122
relations specialists, and technical writers than the national composition and a lower
proportion of editors and writers and authors.
[Insert Table 2]
Regional Employment
This section compares aggregate employment trends in the mass communication
occupations in the southern U.S. (SUS) with the rest of the country (ROC). Since national
employment trends are already shown in Figure 1, Figure 3 separates southern regional
employment from the rest of country for the period 1997-2012. Over this 15-year period,
employment in the southern region has grown consistent with the rest of the country. Both
regions peaked in 2008 and have since declined. Employment in the southern region peaked
in 2008 at 133,900, but declined in 2012 to 113,410, representing a loss of 20,490 jobs or
15% from its peak. Mass communication employment in the rest of the country peaked the
same year at 402,640, but then declined to 357,140, a loss of 45,500 jobs or 11%. Data for
Figure 3 are provided in Appendix C.
[Insert Figure 3]
State Employment
Table 3 examines changes in total mass communication occupations among states in
the southern region by comparing employment levels in 2004 and 2012. As of 2012,
employment levels in the mass communication occupations in all southern region states
remained below their peak year. Variances from the peak ranged from 2 percent below in
Louisiana and North Carolina to 31 percent below in Florida. However, eight of the 11
southern region states are up in employment since 2004, with Georgia and Texas up over 21
percent each. Florida remains furthest behind 2004 levels running 25 percent below, while
Arkansas and Tennessee are 11 and 5 percent below, respectively.
Peak years varied as well, with the effects of the recession impacting the region’s
states at different times. Communication occupations peaked in some states as early as 2006
and as late as 2009 in others. Although the recession hit in December 2007, mass
communication employment did not peak in Alabama, South Carolina, and Texas until 2009.
Florida and Tennessee on the other hand peaked in 2006, more than a year before the
recession started.
[Insert Table 3]
Trends in specific occupations at the regional level were generally consistent with
those at the national level. Table 4 breaks down the percentage change in each mass
communication occupation by state during the 2004-12 period. Consistent with the national
trend, reporters and correspondents declined in every state, while radio and television
announcers faced declines in nine of the 11 states. Radio and television announcers declined
the most in Mississippi and Virginia at 43-44%, with reporters experiencing a 47% decline in

SOBIE 2014
123
North Carolina. On the other hand, broadcast news analysts fared well in some states,
bucking the national trend. Alabama and Mississippi both experienced strong gains in the
occupation, 31% and 50% respectively. Public relations specialists saw the most significant
gains of all the occupations. Nine of the 11 regional states reported increases in the hiring of
public relations specialists, with Georgia leading the group with a 127% increase, South
Carolina at 95%, Texas at 79%, and Mississippi at 72%. Nationally, public relations
specialists grew from 166,210 to 201,280 between 2004 and 2012, as shown in Appendix B.
Twenty-seven percent of the 35,090 new public relations specialists, or 9,300 positions, were
created in the southern region. Employment changes for editors, technical writers, and
writers and authors were more mixed within the region. Technical writers performed the best
among the three occupations with Alabama yielding the largest percentage gain at 63%,
followed by a 51% gain in Virginia, 50% in South Carolina, and 48% in North Carolina.
Technical writers gained 1,350 positions nationally between 2004 and 2012, with 90% of the
gains coming from the region.
[Insert Table 4]
Appendix D compares employment level changes by occupation in the southern
region with the rest of the country. While percentage changes in employment for
announcers, PR specialists, and writers and authors in the region were equal to those in the
rest of country, technical writers saw above normal gains and broadcast news analysts and
reporters saw above normal losses. Of the national losses in broadcast news analysts and
reporters, the region accounted for 47 and 45 percent of those losses, respectively.
Geographical Concentration
This section analyzes the geographic concentration of mass communication-related
occupations in 2012 based on location quotient. Location quotient (LQ) measures an area’s
share of employment in an occupation relative to the national share. It is useful for
measuring the concentration of occupations in a particular geographic area. A quotient of 1.0
means employment for an occupation in a particular area is equal to the national average
based on population size. A location quotient of greater than 1.0 means the occupation has a
greater concentration employed in the area than nationally, and a location quotient of less
than 1.0 means that occupation is underrepresented in the area. Therefore, the location
quotient is simply a measure of a given area’s distribution of employment by occupation to a
larger reference area (Bureau of Labor Statistics, 2011).
Table 5 shows the regional difference in occupations by location quotient, while
Appendix F provides a detailed breakdown of each occupation’s location quotient by state.
As shown in Table 5, regional differences remain. All mass communication occupations in
the southern U.S. had a lower mean location quotient than the rest of the country. Five of the
seven occupations were underrepresented in the region, with only radio and television
announcers and broadcast news analyst overrepresented. For all other occupations, the
average location quotient for the region fell below the rest of the country. Significant
regional differences were found among three occupations: reporters and correspondents;
editors; and writers and authors.

SOBIE 2014
124
Appendix F shows were several bright spots for the region. Alabama has a high
concentration of broadcast news analysts, announcers, and technical writers. Arkansas,
Louisiana, Mississippi, and North Carolina have a high concentration in announcers, with the
latter two also high in broadcast news analysts. And Virginia provided the best opportunities
in the field with high concentrations in five of the seven occupations, with technical writers
ranking the highest.
[Insert Table 5]
Discussion and Conclusion
Moore’s (1951) conclusion in the 1950s that mass communications in the southern
U.S. differed from the rest of the country remains partially true today, according to
occupational differences. This study found that the concentration of mass communication
occupations in the southern U.S. remains below the rest of the country for all occupations
and significant deficiencies were found among reporters and correspondents, editors, and
writers and authors.
Occupations in the southern region paralleled the country’s expansion and
recessionary employment cycles. While occupations in the region grew slightly slower from
1997-2008 than the rest of the country, 39.7% versus 40.1%, the region lost employment in
the industry at a faster rate since the peak of the recession, 18.1% compared to 9.3%.
Although the recession is long over, the continued declined in mass communication
employment since 2008 indicates that factors other than economics are involved. The 2008
recession served as a catalyst for change, coinciding with a larger cultural and technological
shift in society. The convergence of mobile technologies with social media changed the
information paradigm of how news is aggregated and distributed. Changes in industry
occupational mix began shortly after the start of social media applications like Facebook in
2004 and Twitter in 2006 and the introduction of the Apple iPhone in 2007. The decline in
reporters and correspondents and concurrent rise in public relation specialists in the last
decade reflects a cultural shift to a mobile information society, making mass communications
increasingly social, real-time, and direct to end user. This technological revolution has
redefined industry occupations, although at a different pace in the southern U.S.
Particular attention should be paid to the extraordinary growth in public relations
specialists. Not only has this been the fastest growing mass communication occupation in
the nation and southern region, but current trends have it accounting for 49% of total
employment in the field by 2016 (see Appendix F). Public relations specialists are the only
occupation in the study to emerge from the 2008 recession with a greater proportion of the
industry’s occupational mix than in 2004, although still below pre-recession levels. In the
southern U.S., public relations specialists are expected to grow at an even faster rate than the
national average, 27% compared to 22%.
SOBIE 2014
125
Two possible explanations for the growth in public relations specialists are the new
information paradigm or an outdated Standard Occupational Classification system.
Advances in mobile and social media technologies have allowed organizations to reached
customers directly, bypassing the traditional media infrastructure. Social media has changed
the role of the public relations specialist from serving less as an intermediary for information
gatekeepers and more as a promoter of images and products. Today, public relations
specialist functions more as a marketer and revenue generator, better justifying their
existence. Therefore the growth of public relations specialists may be a result of social
media’s new role in the occupation.
On the other hand, the statistical growth in public relations specialists may result from
an outdated occupational classification system. Changes to the Media and Communication
Workers Standard Occupational Classification group were last made in 2004, at the dawn of
the social media and technological revolution. Since then, social media and mobile
technology have redefined the industry. For lack of a better classification, social media-
oriented occupations are being lumped with public relations specialists. Some may argue the
two occupations are the same, but a closer examination of job descriptions indicates
otherwise.
Public relations specialists work “through” various intermediary communication
media, which entails interacting with a network reporters, news analysts, and media
organizations to shape the public’s perception. By skipping the intermediary, social media
specialists reach the public directly and quicker. Social media specialists rely less on
interpersonal skills to navigate these intermediaries and more on analytical and technical
abilities to target viewership. Furthermore, social media specialists have more control over
the message and intended audience.
Technically, the public relations specialist occupation’s broad definition, as shown in
Appendix A, allows for inclusion these emerging digital occupations. However, recognizing
the need to keep job descriptions current, in early 2014 the Bureau of Labor began the
multiyear process of revising the Standard Occupational Classification system. The revision
process is expected to be completed by 2017 and implemented by 2018. Although it will be
years before the Standard Occupation Classification for media and communication workers is
revised to reflect the growth in the new digital communication occupations, the evidence
points to a transition in industry occupations that is well underway.
References
Becker, L., Vlad, T., Simpson, H., & K. Kalpen. (2013). 2012 Annual Survey of Journalism
& Mass Communication Graduates. James M. Cox Jr. Center for International Mass
Communication Training and Research, University of Georgia, August 9.
Boyles, J. (2013, August 9). Job market shows some improvement for recent
communications graduates, Journalism.org: Pew Research Center’s Project for Excellence
in Journalism. Retrieved from
SOBIE 2014
126
http://www.journalism.org/analysis_report/job_market_shows_some_
improvement_recent_communications_graduates
Bureau of Labor Statistics. (2011). Using location quotients to analyze occupational data.
Occupational Employment Statistics (OES) Highlights, April. Retrieved April 25, 2013 from
http://www.bls.gov/oes/highlight_location_quotients.pdf
Dick, S. J. (1996). Old Media/New media mass communication in the information age,
special edition. Journalism and Mass Communication Quarterly, 73(4), 1009-1010.
Retrieved from http://search.proquest.com/docview/216923551?accountid=34657
Khattak, A., Nasir, M., & Sultan, K. (2012). The role of information technology in media
industry. International Journal of Business and Social Science, 3(6). Retrieved February 15,
2014 from http://search.proquest.com/docview/924460646?accountid=34657.
Mitchell, A., Ronsenstiel, T, & Houston, L. (2012, October 1). Future of mobile news,
Journalism.org: Pew Research Center’s Project for Excellence in Journalism. Retrieved
from http://www.journalism.org/analysis_report/future_mobile_news
Moore, H. (1951). Mass communications in the South. Social Forces, 29 (4), 365-376.
Retrieved February 15, 2014 from http://www.jstor.org/stable/2572713, DOI:
10.2307/2572713.
Pavlik, J. (2001). Journalism and new media. Columbia University Press.
Preston, P. (2001). Reshaping communications: Information and social change. SAGE
Publications.
United States Department of Labor, Bureau of Labor Statistics. (2013). Occupational
Employment Statistics [Data file]. Retrieved from http://www.bls.gov/oes/

SOBIE 2014
127
Table 1
Examples of Mass Communication Occupations
Occupation Examples
Radio and Television Announcers Radio Disc Jockey, Talk Show Host, Game Show
Host
Broadcast News Analysts News Commentator, News Anchor, Newscaster
Reporters and Correspondents Columnist, Foreign Correspondent, Film Critic
Public Relations Specialists Press Secretary, Publicity Writer, Lobbyist
Editors Copy Editor, Technical Editor, Advertising Editor
Technical Writers Specifications Writer, Documentation Writer,
Medical Writer
Writers and Authors Advertising Copy Writer, Television Writer,
Playwright
Source: Department of Labor, Standard Occupational Classification
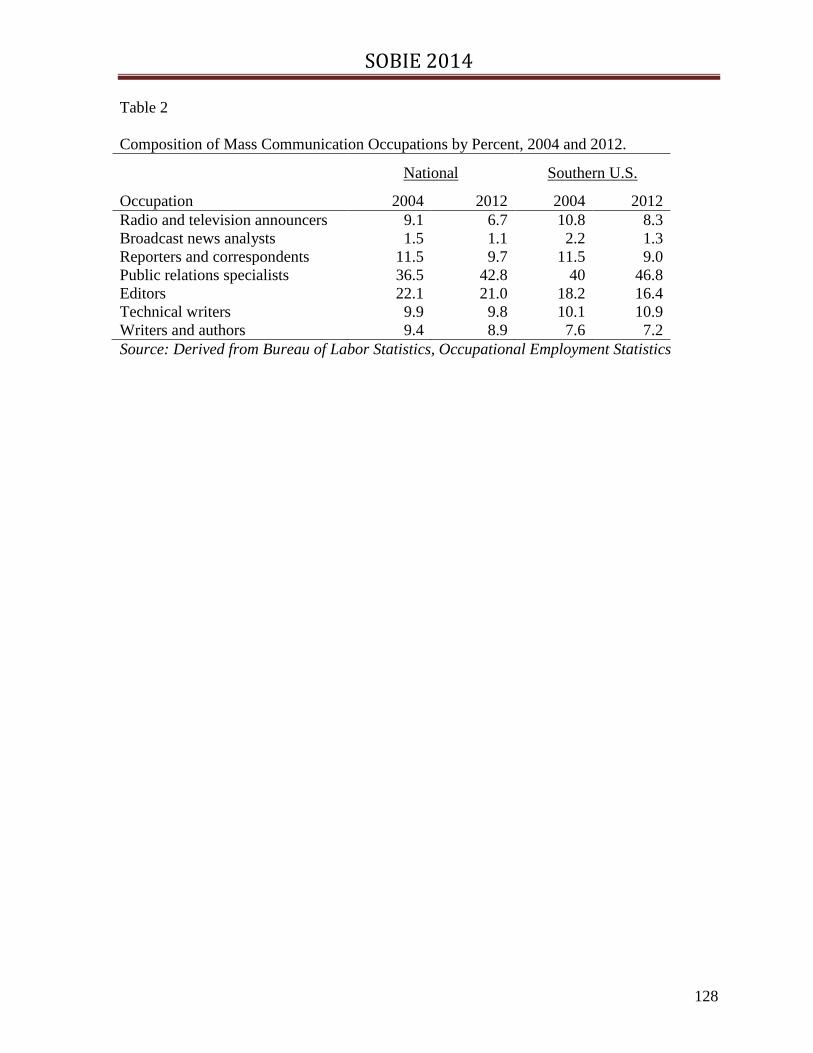
SOBIE 2014
128
Table 2
Composition of Mass Communication Occupations by Percent, 2004 and 2012.
National Southern U.S.
Occupation 2004 2012 2004 2012
Radio and television announcers 9.1 6.7 10.8 8.3
Broadcast news analysts 1.5 1.1 2.2 1.3
Reporters and correspondents 11.5 9.7 11.5 9.0
Public relations specialists 36.5 42.8 40 46.8
Editors 22.1 21.0 18.2 16.4
Technical writers 9.9 9.8 10.1 10.9
Writers and authors 9.4 8.9 7.6 7.2
Source: Derived from Bureau of Labor Statistics, Occupational Employment Statistics

SOBIE 2014
129
Table 3
Total Employment Change by State in Southern Region, 2004-2012.
State 2004 Peak
’04-‘12
Peak
Year 2012
% Change
Since Peak
% Change
’04-‘12
Alabama 4,950 6,740 2009 5,260 -22 6
Arkansas 2,890 3,050 2007 2,460 -16 -11
Florida 28,630 31,340 2006 21,620 -31 -25
Georgia 7,860 12,120 2008 9,540 -21 21
Louisiana 3,630 4,230 2008 4,130 -2 14
Mississippi 2,490 3,380 2007 2,730 -19 8
North Carolina 9,350 10,650 2008 10,420 -2 11
South Carolina 3,630 5,270 2009 3,940 -25 9
Tennessee 6,930 7,080 2006 6,560 -7 -5
Texas 25,120 37,300 2009 30,340 -19 21
Virginia 14,960 17,830 2007 16,410 -8 10
Source: Bureau of Labor Statistics, Occupational Employment Statistics

SOBIE 2014
130
Table 4
Percent Change in Employment by Mass Communication Occupation and State, 2004-2012.
State Announcer Broadcaster Reporter PR Sp Editors Technical Writer
Alabama -18 31 -31 42 -19 63 -28
Arkansas -16 -19 -16 12 -35 23
Florida -10 -32 -2 -36 -21 -18 25
Georgia -23 -58 -9 127 -20 16 -39
Louisiana 20 -14 61 -24 42 -19
Mississippi -44 50 -3 72 -27 0 3
N. Carolina -19 -31 -47 52 15 48 -19
S. Carolina 8 -38 95 -9 50 -47
Tennessee -14 -43 -26 7 1 -7 -4
Texas -32 -21 -19 79 -3 -8 13
Virginia -43 0 -11 12 9 51 1
Source: Derived from Bureau of Labor Statistics, Occupational Employment Statistics

SOBIE 2014
131
Table 5
Mean Location Quotient by Occupation and Geographic Distribution, 2012.
Occupation Southern U.S. Rest of Country P-value
Radio and TV announcers 1.14 1.30 0.297
Broadcast news analysts 1.25 1.51 0.547
Reporters and correspondents 0.78 1.37 0.007
Public relations specialists 0.80 1.16 0.115
Editors 0.58 0.95 0.010
Technical writers 0.78 1.08 0.176
Writers and authors 0.61 1.05 0.016
Source: Derived from Bureau of Labor Statistics, Occupational Employment Statistics
Note: Significant in bold at the 95% confidence level.

SOBIE 2014
132
Figure 1. Total Mass Communication-Related Employment in U.S. and Annual Percent
Change, 1997 and 2012.
Source: Bureau of Labor Statistics
-8%
-6%
-4%
-2%
0%
2%
4%
6%
8%
10%
300
350
400
450
500
550
1997 1998 1999 2000 2001 2002 2003 2004 2005 2006 2007 2008 2009 2010 2011 2012
An
nu
al P
erc
en
t C
han
ge
Emp
loym
en
t
Tho
usa
nd
s
Year
Employment % Change U.S.

SOBIE 2014
133
Figure 2. Ratio of Employment by Occupation Relative to 2004.
Source: Bureau of Labor Statistics

SOBIE 2014
134
Figure 3. Employment in the Southern U.S. (SUS) versus Rest of Country (ROC), 2004-
2012.
Source: Bureau of Labor Statistics
-
50
100
150
200
250
300
350
400
450
Emp
loym
en
t
Tho
usa
nd
s
Southern Region (SUS)
Rest of U.S. (ROC)
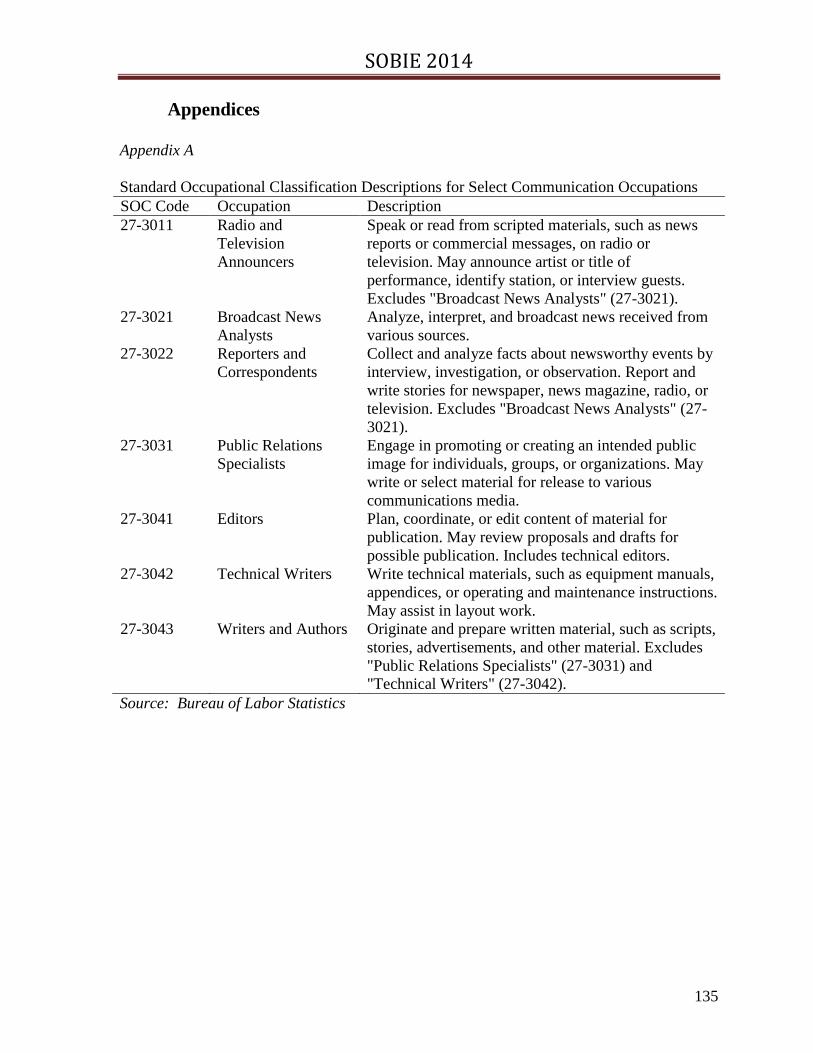
SOBIE 2014
135
Appendices
Appendix A
Standard Occupational Classification Descriptions for Select Communication Occupations
SOC Code Occupation Description
27-3011 Radio and
Television
Announcers
Speak or read from scripted materials, such as news
reports or commercial messages, on radio or
television. May announce artist or title of
performance, identify station, or interview guests.
Excludes "Broadcast News Analysts" (27-3021).
27-3021 Broadcast News
Analysts
Analyze, interpret, and broadcast news received from
various sources.
27-3022 Reporters and
Correspondents
Collect and analyze facts about newsworthy events by
interview, investigation, or observation. Report and
write stories for newspaper, news magazine, radio, or
television. Excludes "Broadcast News Analysts" (27-
3021).
27-3031 Public Relations
Specialists
Engage in promoting or creating an intended public
image for individuals, groups, or organizations. May
write or select material for release to various
communications media.
27-3041 Editors Plan, coordinate, or edit content of material for
publication. May review proposals and drafts for
possible publication. Includes technical editors.
27-3042 Technical Writers Write technical materials, such as equipment manuals,
appendices, or operating and maintenance instructions.
May assist in layout work.
27-3043 Writers and Authors Originate and prepare written material, such as scripts,
stories, advertisements, and other material. Excludes
"Public Relations Specialists" (27-3031) and
"Technical Writers" (27-3042).
Source: Bureau of Labor Statistics
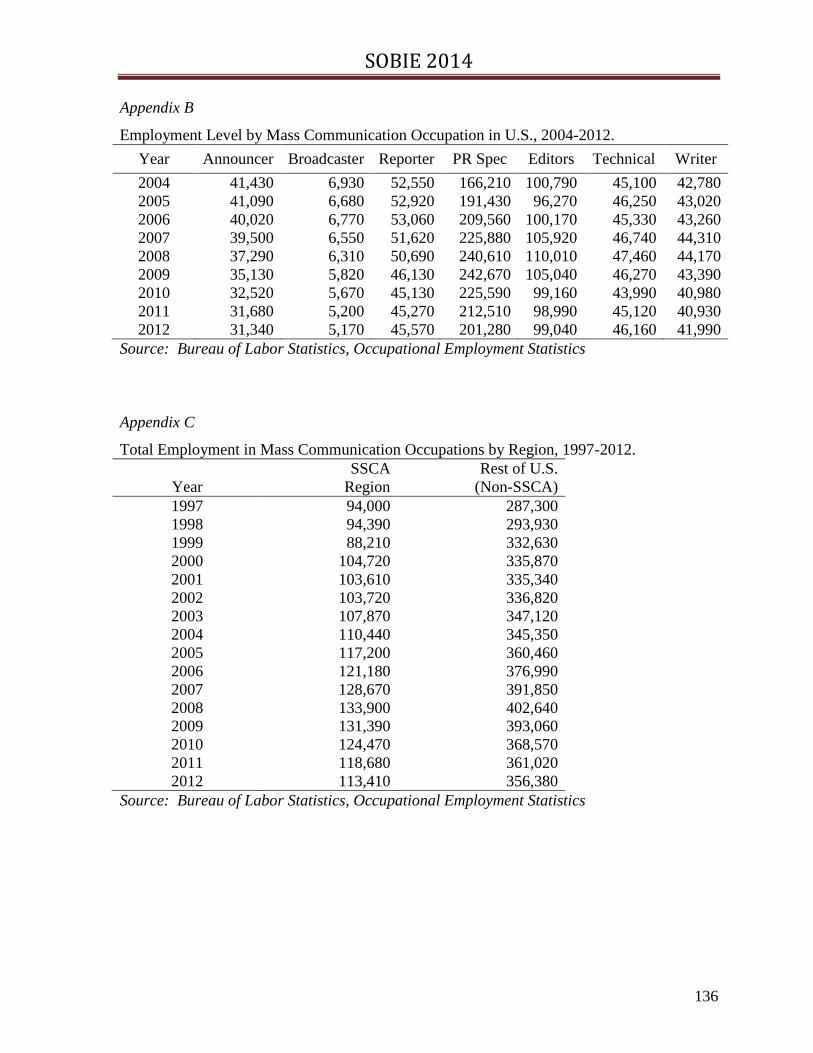
SOBIE 2014
136
Appendix B
Employment Level by Mass Communication Occupation in U.S., 2004-2012.
Year Announcer Broadcaster Reporter PR Spec Editors Technical Writer
2004 41,430 6,930 52,550 166,210 100,790 45,100 42,780
2005 41,090 6,680 52,920 191,430 96,270 46,250 43,020
2006 40,020 6,770 53,060 209,560 100,170 45,330 43,260
2007 39,500 6,550 51,620 225,880 105,920 46,740 44,310
2008 37,290 6,310 50,690 240,610 110,010 47,460 44,170
2009 35,130 5,820 46,130 242,670 105,040 46,270 43,390
2010 32,520 5,670 45,130 225,590 99,160 43,990 40,980
2011 31,680 5,200 45,270 212,510 98,990 45,120 40,930
2012 31,340 5,170 45,570 201,280 99,040 46,160 41,990
Source: Bureau of Labor Statistics, Occupational Employment Statistics
Appendix C
Total Employment in Mass Communication Occupations by Region, 1997-2012.
Year
SSCA
Region
Rest of U.S.
(Non-SSCA)
1997 94,000 287,300
1998 94,390 293,930
1999 88,210 332,630
2000 104,720 335,870
2001 103,610 335,340
2002 103,720 336,820
2003 107,870 347,120
2004 110,440 345,350
2005 117,200 360,460
2006 121,180 376,990
2007 128,670 391,850
2008 133,900 402,640
2009 131,390 393,060
2010 124,470 368,570
2011 118,680 361,020
2012 113,410 356,380
Source: Bureau of Labor Statistics, Occupational Employment Statistics

SOBIE 2014
137
Appendix D
Employment Change in Occupations, SSCA vs Non-SSCA Regions, 2004-2012.
Change Percent SSCA Change
Occupation SSCA Non-SSCA SSCA Non-SSCA
As Percent
of National*
Announcers -2,520 -6,200 -21 -22 29
Broadcast news** -910 -1,020 -37 -25 47
Reporters -2,470 -3,010 -19 -8 45
PR specialists 9,300 25,840 21 21 26
Editors -1,470 340 -7 0 130
Technical writers 1,220 130 11 0 90
Writers & authors -180 -320 -2 -1 36
Source: Bureau of Labor Statistics, Occupational Employment Statistics
Note: * National comparison includes SSCA and non-SSCA data. Percent does not indicate
direction. ** Arkansas, Louisiana & South Carolina did not report data for this occupation
in 2012.
Appendix E
Location Quotient of Occupation by State, 2012.
State Announcer Broadcaster Reporter PR Sp Editors Technical Writer
Alabama 1.64 2.31 0.75 0.73 0.52 1.28 0.47
Arkansas 1.38 1.04 0.52 0.53 0.28 0.44
Florida 0.96 0.87 0.98 0.87 0.67 0.69 0.81
Georgia 0.81 0.63 0.70 0.82 0.49 0.75 0.44
Louisiana 1.46 0.86 0.68 0.40 0.26 0.35
Mississippi 1.27 1.41 0.78 0.83 0.33 0.23 0.87
N. Carolina 1.02 1.40 0.59 0.80 0.56 0.96 0.55
S. Carolina 0.94 0.82 0.71 0.45 0.43 0.30
Tennessee 1.64 0.74 0.79 0.63 0.57 0.45 0.63
Texas 0.71 0.99 0.60 0.96 0.59 0.92 0.59
Virginia 0.74 1.61 0.66 1.27 1.23 2.29 1.21
Average 1.14 1.25 0.78 0.80 0.58 0.78 0.61
Source: Bureau of Labor Statistics, Occupational Employment Statistics

SOBIE 2014
138
Appendix F
Employment Level in SSCA Region for 2004-2012 with 2016 Projections.
Year Announcer
Broad
caster Reporter
PR
Spec Editors Technical Writer Total
2004 11,900 2,440 12,710 43,770 20,090 11,160 8,370 110,440
2005 11,830 2,580 11,960 51,110 19,620 11,760 8,340 117,200
2006 11,530 2,430 12,090 56,180 18,090 11,530 9,330 121,180
2007 10,940 2,370 12,080 60,720 21,420 11,870 9,270 128,670
2008 10,780 2,040 12,070 65,310 22,750 11,820 9,130 133,900
2009 9,890 1,420 11,090 66,660 20,900 12,170 9,260 131,390
2010 9,450 1,840 10,590 62,400 19,790 12,050 8,350 124,470
2011 9,210 1,550 10,680 58,040 18,620 12,330 8,250 118,680
2012 9,380 1,530 10,240 53,070 18,620 12,380 8,190 113,410
2016 7,459 841 9,140 67,656 19,189 12,954 8,326 125,565
Source: Bureau of Labor Statistics, Occupational Employment Statistics
Note: Projections in bold.

SOBIE 2014
139
Probability Distributions: A Comparison for Risk Management Purposes
Raymond M. Johnson, Ph.D.
Kenneth Linna, Ph.D.
Joseph A. Newman, Ph.D.
Auburn University at Montgomery
Abstract
In recent years there has been a growing concern over the appropriateness of traditional
probability distributions for risk management analysis. It is widely known, but rarely
accepted in conventional economic and financial modeling that the assumptions underlying
many probability distributions, including the normal distribution, do not provide appropriate
describers of most related financial and economic data. Recent economic and financial
events have renewed interest in the discovery, analysis and management of risk exposure.
This increased interest in risk exposure measurement and management has resulted in a
renewed interest in, and application of, some long existing probability distributions as well as
many probability distributions that exist at the periphery of statistical analysis.
Congruently, software is also becoming more assessable to academicians, practitioners, and
even classroom applications that enables one to analyze data of interest and choose the
analytical methodology that is most appropriate for the analysis at hand. This paper
evaluates a number of distributions as to their appropriateness for risk management analysis
and to ascertain the extent to which they can be relied upon to provide good data descriptors
from one sample period to another and of the same genre. After the introduction, the paper
provides a brief review of the literature related to risk management and related quantitative
methodologies. Next, a discussion of the risk management techniques and the data to be
analyzed by selected, but relevant, probability distributions is provided. Lastly, the
summary, conclusions, and suggestions for additional research are provided.
Introduction
The purpose of this study is to see if the application of a number of theoretical and
computational methodologies to selected financial data offers promised improvements in
“goodness of fit” accuracy over conventional theoretical constructs and methodology. The
scope of this study is constrained to an evaluation, in terms of goodness of fit, of a number of
SOBIE 2014
140
probability distributions rather than to an evaluation of risk management techniques. Those
probability distributions providing the best fit of the data can be used to determine the
probability that the value at risk (VaR) will exceed a certain amount. In years past much of
the theoretical analysis and portrayal of risk analysis has relied on the conventional
assumption that probable risk exposures conform to a pattern best described by the normal
distribution. In recent years many risk analysts have become increasingly concerned whether
conventional methodology is adequate for assessing risk exposures associated with many
financial instruments, especially financial derivatives. It has been long known among
finance and economics academicians, as well as practitioners, that the normal distribution
frequently does not accurately reflect the distribution of some financial and economic data.
Aragones and Palfray (2002) point out our traditional financial models and statistical
methods sometime fail us when we need them the most. This concern has caused many to
turn toward some methodologies that have existed for some time but have been largely
ignored by risk managers; the exception being the insurance industry. Much of the renewed
interest has turned toward the methodology arising from the study of hydrology, nonlinear
relationships, and actuarial science. The insurance industry has had a long established
understanding of many aspects of distributions that do not conform to the prescriptions of the
normal distribution. Interest in the shape of the various financial distributions and an
accurate assessment of the implied risk exposures are very important to the various
disciplines of finance because of the need for economic capital (reserves) needed for
protection against improbable losses due to severe weather damage, credit risk liquidity risk,
excessive trading losses, etc.
As mentioned above, the purpose of this paper is to apply a number of probability
distributions to two data sets in order to determine the goodness of fit they each provide. The
data we select are daily exchange rate data for the Euro and the Japanese Yen per unit of the
U.S. dollar. For risk management purposes, these daily exchange rates, expressed as
percentage changes, are a proxy for exchange rate volatility assumed to be the risk exposure
of interest faced by the trader, trading desk and consequently the financial institution. The
scope of this study is restricted to an evaluation of sixty five probability distributions in an
effort to determine which provides the best goodness of fit, and to determine if the ranking
remains consistent from one currency to the other. It is beyond the purview of this study to
address risk management methodologies as such. However, the best fitting distributions can
be utilized to illustrate how the application of different probability distributions to the same
data set may lead to different probable occurrences; consequently different risk exposures.
The rest of the paper proceeds as follows. Next a brief background, or foundation, is
provided for risk management as it relates to financial institutions including a presentation
some of the popular probability distributions utilized in the assessment of financial risk
exposure. Following this section is a presentation of the application of selected probability

SOBIE 2014
141
distributions to determine their goodness of fit with respect to selected exchange rate data.
Lastly we present the summary, conclusions, and agenda for future research.
Background
The financial industry, especially certain sectors, is cyclical in nature. Likewise, in response
to cyclical downswings, modern societies’ responses have been to propose regulatory
prophylactics designed to dampen, if not prevent, cyclical downswings. The U.S. recession
of the 1890’s gave rise to the movement that resulted in the Federal Reserve System. Up to
this point despite the repeated occurrence of financial cycles, the founding fathers, and
national leaders who followed, resisted the idea of a central banking system. Their
reluctance to accept the concept was predicated on their perception of the European system
whereby the European governments were heavily dependent on the large banking houses and
financial dynasties such as the Rothschild’s financial empire. Later systemic changes were
made to the regulatory environment of the U.S. in response to the 1930’s great depression.
Using the Keynesian revolution as a guiding light many governments, and their citizens, of
developed nations embraced varying degrees of government intervention into their
economies. Despite repeated efforts to prevent cyclic swings, economies still exhibit
fluctuating degrees of variability. Consequently, in efforts to quantitatively measure and
manage their risk exposure financial institutions have established multinational organizations
designed to quantify and formalize procedures with respect to risk exposures. In the United
States, the insurance industry is largely regulated by the different states with the various
insurance companies determining the risk exposures they perceive and are willing to accept
and writing their policies and setting their rates accordingly to the acceptable risk exposures.
In addition to their respective national regulatory environments the global commercial
banking industry has formed multinational organizations and groups that set, and periodically
modify, compliance agreements with respect to risk exposures, and capital requirements
responding to the degrees and types of risk exposures. Prior to 1988 the various countries’
regulatory agencies set their own standards with respect to such things as credit standards,
ratios of acceptable capital to assets, capital components, acceptable risk exposures, etc., and
the degree of enforcement precision. A series of conferences beginning in the year of 1988,
and later known as the Basel agreements have been held periodically in Basel Switzerland.
Initially known as the Basel agreement it quickly became known as Basel I and is the
precursor for Basel IA, Basel II and Basel III. The sequence of agreements is a result of the
successes of the previous agreements and recognition of the evolving nature of the finance
industry, the development of new finance products, and the risk exposures emitting from
these products. Two risk measures arising from the various Basil agreements are the value
at risk (VaR) and expected shortfall. As Hull (2012) points out, VaR is directed to the issue
of how bad can things get. In addition to the assessment of how bad can things get risk
managers need to know the expected loss, that is, expected shortfall. These two concepts are

SOBIE 2014
142
so commonly utilized by risk managers of the different financial genre, in their calculations
of risk exposure and probable occurrence that frequently little thought is given to whether the
conventionally used probability distribution provides the best fit of the data. Perhaps another
probability distribution, or distributions, would prove to be better. Frequently, risk managers
may not know if another probability distribution would provide a better fit for another data
sample, even if the data sample is taken from the same series. For one, there are many
distributions that are not common knowledge among the profession. Secondly, even if the
analyst is satisfied with a given probability distribution’s fit of a given data set, there is a
chance that it might not provide the best fit for another sample, even if the sample is
extracted from the same data set. Lastly, the analyst may decide that a particular probability
distribution’s parameters may provide a sufficiently close approximation so that it is the
preferred methodology because it is widely known and professionally acceptable, thus
defensible in a learned, or legal dispute.
To Illustrate, the complexity of the issue, financial institutions face a number of risk
exposures. These include credit risk, operational risk, market risk, and business risk. As Hull
(2012) mentions, Rosenberg and Schuermann (2004) collected data from a variety of sources
in order to estimate the different shapes of the above mentioned distributions. Out of the
four risk exposures, only market risk usually has a symmetrical probability density function.
However, it is not perfectly normally distributed. The other three have probability density
functions exhibit characteristics that are either highly skewed, leptokurtic, or both. As an
additional complication, the correlations between these risk categories should be accounted
for. Consequently it is difficult to aggregate the risk exposures for purposes of determining
the aggregate amount of economic capital to hold against probable losses.
Although a detailed discussion of the methodology for estimating required aggregate
economic capital is beyond the scope of this study, it is worth noting that Rosenberg and
Schuermann (2004) estimate that aggregating and assuming the above mentioned probability
loss distributions are normally distributed underestimates the needed economic capital by
approximately 40 percent. Clearly methodology that is more appropriate for fitting non-
normal distributions is called for.
For example, Hull (2012) presents a methodology called extreme value theory (EVT)
that is highly favored by many risk analysts. Hull (2012) vividly explains how the
rediscovery, and revived interest in, the works of such early mathematicians as Pareto and
Gnedenko (1943) , as well as others, provide a means whereby the tails of distributions can
be examined and used to measure the heaviness of the tails of a distribution. Likewise, the
general shape of the distribution is of little importance. The significance of this is that many
data distributions found in finance exhibit the characteristics of kurtosis, skewedness, or
both. According to Hull (2012), Gnedenko’s (1943) contribution to risk analysis is that “…
for a wide class of distributions F(v), the distribution of Fu(y) converges to a generalized

SOBIE 2014
143
Pareto distribution as the threshold of u is increased.” According to Hull (2012) only two
parameters need to be estimated for (EVT); the shape parameter and the scale parameter
where the scale and shape parameters can be estimated by maximum likelihood methods
(Hull, 2012, p. 315). According to Hull (2012, p. 315) for most financial data, the shape
parameter usually has a value ranging from 0.1 to 0.4 A remaining value, designated as a
threshold value, is selected by the analyst. Utilizing these three parameters, (EVT)
methodology is used to estimate the probability that a given value will exceed the selected u
value. One of the drawbacks of (EVT) is that the estimates of the shape and scale parameters
are sensitive to the selected threshold value. However, Hull (2012, p.315) contends that a
threshold value, u, selected near the 95th percentile point of the empirical distribution is
usually a safe selection. As mentioned, (EVT) is favored by many risk managers for
estimating the value at risk (VaR) and the expected shortfall associated with risky ventures
whose probability distributions most likely do not conform to, or approximate, the normal
distribution. When financial or economic data distributions conform to, or closely
approximate, the normal distribution many analysts may naturally prefer to use the normal
distribution for testing and forecasting purposes. Although the above mentioned distributions
are frequently utilized by financial risk managers, there may be less conventionally accepted
probability distributions that provide better parameter estimates of the data of interest. For
example the Wakeby distribution is highly favored by those, for example Griffiths (1989),
studying flood patterns whose frequency distributions often exhibit kurtosis and are
frequently skewed. In what we show below the Wakeby performs relatively favorably.
Another distribution favored in some circles, for example, Elghaly, et.al. (2008), but not
widely known is the Burr distribution. A third distribution that performs relatively well
when fitted to our data is the Log-logistic distribution. This distribution resembles the
normal distribution except it accommodates more observations in the distribution’s tails;
leptokurtosis. The Log-Logistic has been successfully utilized, and stood the test of time, in
describing abnormally shaped distributions by such analysts as Askar and Smail (1983),
Bennett (1983), and Tadikamalla and Johnson (1982). It is not surprising that the Burr and
Log-Logistic distributions frequently provide similar results when applied to the same data
set because they are in many instances compatible, Zimmer, et. al. (1998), Wu and Yu
(2005). These distributions may be more useful for analysis.
The Analysis
The St. Louis Federal Reserve Bank is the source of the daily exchange rate data we utilize in
this study. The U.S. Dollar per unit of the Euro and U.S. Dollar per unit of the Japanese Yen
for the time span 1-3-2013 – 2-15-14, for a total of 784 observations, are the sources of the
results we provide in this study. These currencies and time periods are arbitrary selections.
As indicated above, these data are modified so as to be expressed as percentage changes as is
customary for risk exposure measurement and management.
SOBIE 2014
144
In this study we utilize sixty five probability distributions in order to ascertain their
respective parameters. The goodness of fit for each distribution is measured by three different
tests; the Kolmogorov Smirnov, Anderson Darling, and the Chi-Squared tests. The results of
these tests, their respective parameters and goodness of fit tests, are provided in the
Appendices.
For the Euro data only thirty seven of the sixty five probability distributions provide
statistically significant results. In order to provide a view of the distribution of the Euro’s
data Appendix A contains a depiction of the Wakeby probability distribution’s histogram.
Also provided are the rankings of the different significant distributions as well as their
parameter values. For the Wakeby probability distribution the parameter values are: α =
0.10211, β = 8.2744, δ= -0.14747, ϒ= 0.00527, and ἐ= -0.01555 where α and β are shape
parameters and δ and ϒ are scale parameters and ξ is the location parameter.
The Kolmogrov Smirnov test ranks the Wakeby distribution highest of the
distributions it tested with a rank of one while the Anderson Darling test provides it with a
rank of only 28. The Chi- Squared test did not rank the Wakeby distribution. In contrast,
the Anderson Darling test ranks the General Logistic test highest as does the Chi-Squared test
while the Kolmogorov Smirnov ranks it second. The General Logistic test is a three
parameter test with parameter values of k = -0.03505, δ= 0.0032, and μ= 2.3505E-4. The
Error distribution is likewise a three parameter distribution with k = 1.2991, ϭ = 0.00587. and
μ = 5.0163E-5. For the Euro data the Anderson Darling test ranks it second, followed by the
Chi-Squared test with a rank of three. The Kolmogorov Smirnov ranks if fifth however.
The General Extreme Value distribution, highly favored by many risk managers and
analysts, with parameters of k=-0.34775, δ= 0.00585, and μ= -0.00178 ranked relatively
poorly compared to the Wakeby and General Logistic tests. The Chi-Squared test did not
rank this distribution. The General Extreme Value’s rankings were respectively ten for the
Kolmogorov Smirnov test, 27 for the Anderson Darling test parameters.
The Japanese Yen exchange rate data for the abovementioned time period, also
expressed in terms percentage changes, and exhibited in Appendix B, exhibits comparable
skewedness and kurtosis with the Euro data discussed above. Of the sixty five distributions
tested only thirty eight provided significant results. Again, the three goodness of fit tests
used in this study, provide conflicting rankings. The Kolmogorov Smirnov test indicates the
Wakeby test provides the best fit, and ranks the four-parameter Burr second with the Chi-
Squared test providing no conclusive results with respect to the Wakeby test. The four-
parameter Burr (4P) test is ranked first by the Anderson Darling test and fourth by the Chi-
Squared test. For the Yen data period, the Burr’s four parameter values are: k = 0.86077, α =
58.252, β = 0.17406, and ϒ = -0.17457. The Wakeby parameter values are: α = 0.10588, β =
9.2898, ϒ = 0.0048, δ= -0.03169, and ξ = -0.01467, and for Burr (4P) the respective
parameters are: k = 0.86077, α = 58.252, β = 0.17406, and ϒ = -0.17457 where k is one of
SOBIE 2014
145
the continuous scale parameters, k > 0, α, also represents the other continuous shape
parameter, α > 0, β, measuring the degree of dispersion, represents the continuous scale
parameter, and ϒ indicates the location parameter. According to the Kolmogorov Smirnov
and the Anderson Darling tests the General Logistic distribution does not perform as well for
the Japanese Yen data as it did for the Euro data. Both the Kolmogorov Smirnov and the
Anderson Darling tests each rank the Yen fourth. The Chi-Squared test, however, ranked it
second. The Error distribution with parameters of k = 1.0, Ϭ = 0.00609, and μ = 3.1150E-4
does not do as well for the Yen as it did for the Euro. The Anderson Darling test provided it
with a rank of five and the Kolmogorov Smirnov and Chi-Squared test each provided a rank
of six.
The General Extreme Value probability distribution, fairs relatively poorly compared
with the above mentioned probability distributions. When fitted to the Euro data, the General
Extreme Value probability distribution ranked tenth and twenty-seventh respectively by the
Kolmogorov Smirnov and Anderson Darling tests. The Chi-Squared test did not provide a
significant ranking. The parameters for the General Extreme Value distribution are k = -
0.34775, Ϭ = 0.00585, and μ = -0.00178. For the Japanese Yen time frame, the General
Extreme Value distribution likewise underperformed the above mentioned distributions. As
was the case with the Euro data, the Kolmogorov Smirnov test ranked this distribution tenth,
but the Anderson Darling test showed a slight improvement with a ranking of twenty-five
instead of twenty-seventh for the Euro data.
An initial impression is that under ceteris paribus conditions the four parameter
distributions would provide a better fit of these data than would the distributions with fewer
parameters. In general, this study finds conflicting evidence. For the Euro data ten four
parameter distributions provide significant results. However, the Error distribution, a three
parameter distribution is ranked second and third respectively by the Anderson Darling and
the Chi-Squared distributions respectively and fifth by the Kolmogorov Smirnov distribution.
The Error distribution did not fit the Japanese data sample as well as it did the Euro sample.
The Anderson Darling test ranks it fifth; while the Kolmogorov Smirnov and Chi-Squared
provide it a slightly lower rank of six. Although it is a three parameter distribution, the
General Logistic distribution, as mentioned above, performed relatively well for both data
sets in this study. In this respect one cannot say that a four parameter distribution has a
decided advantage with respect to distributions characterized by fewer parameters.
Given the conflicts in the rankings by the different tests and even between the
samples it seems that prudent risk analysts and risk managers should subject their data of
interest to a number of different probability distributions and goodness of fit tests to ascertain
the shape of the distribution, how well the respective probability distributions fit the data, and
the respective parameter values. Armed with this information assessments with respect to the
value at risk (VaR), expected shortfall, or other risk metrics can be made.

SOBIE 2014
146
Summary, Conclusions, and Implications
The agenda of this paper is to explore a number of probability distributions with respect to
their ability to accurately describe selected financial data. Financial analysts, and risk
managers frequently utilize some but ignore many, of these frequency distributions in their
professional responsibilities to measure and manage risk exposures resulting from their
trading activities and financial decisions. In this study we utilize Euro and Japanese Yen
exchange rate data, for a randomly selected time period, converted to percentage changes in
order to simulate risk exposures experienced by currency traders, trading desks, and
ultimately their respective financial institutions. It is a common practice to measure the
volatility of financial time series data in this manner, and to use the resulting volatility as a
measure of risk exposure.
The results of our findings indicate one should not assume that a given probability
distribution can consistently outperform all other probability distributions. Rather, our
findings indicate that the analyst should routinely test different distributions in order to
ascertain the one(s) that provide the best fit of the data rather than relying on preconceived
favorites. However, when goodness of fit tests provide conflicting results, analysts are most
likely to give more weight to the one they have the most confidence in. That is, the one that
has proven to best meet their needs in the past.
The main implication that can be gathered from this study is that an analyst may find
some less known probability distributions that provide a better fit for their data than the ones
they have been using in the past. One should remain open to probability density distributions
that are not found in popular usage. Also, it is possible that a given distribution may provide
the best fit for a given time period, but not for another time period. Events may change the
data distribution in some manner, and for some reason, and the favored probability
distribution is incapable of providing as good of a fit as was the case in the past.
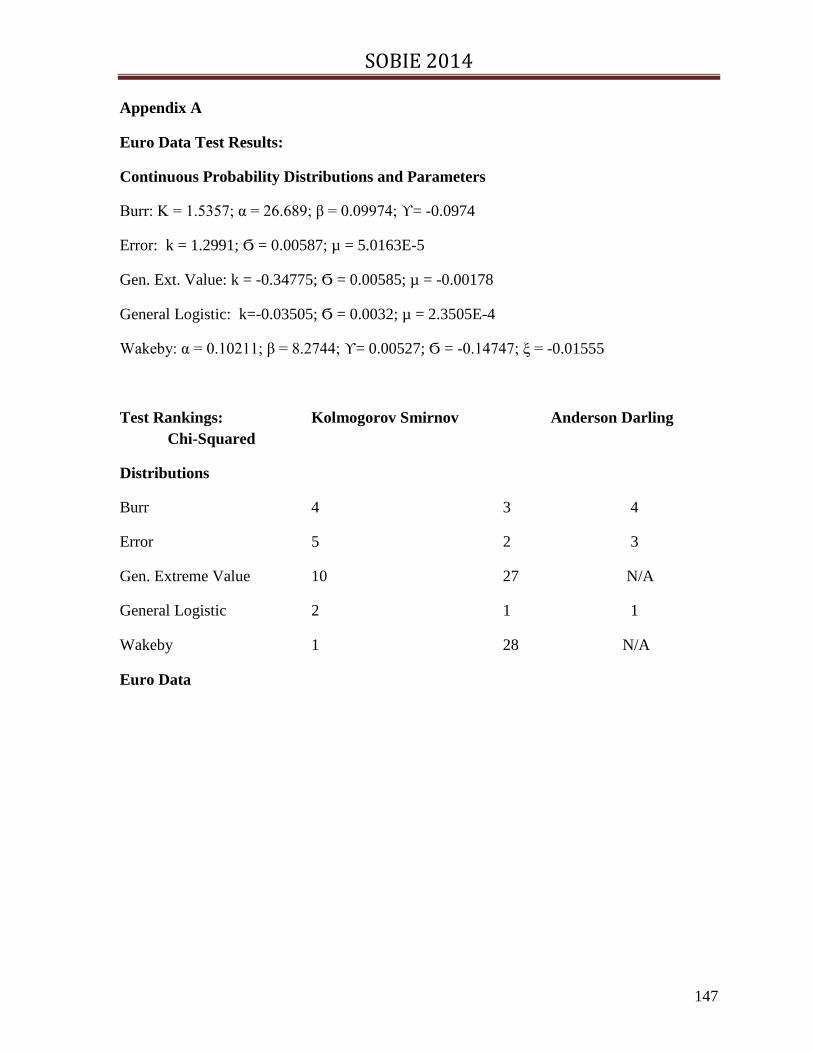
SOBIE 2014
147
Appendix A
Euro Data Test Results:
Continuous Probability Distributions and Parameters
Burr: K = 1.5357; α = 26.689; β = 0.09974; ϒ= -0.0974
Error: k = 1.2991; Ϭ = 0.00587; µ = 5.0163E-5
Gen. Ext. Value: k = -0.34775; Ϭ = 0.00585; µ = -0.00178
General Logistic: k=-0.03505; Ϭ = 0.0032; µ = 2.3505E-4
Wakeby: α = 0.10211; β = 8.2744; ϒ= 0.00527; Ϭ = -0.14747; ξ = -0.01555
Test Rankings: Kolmogorov Smirnov Anderson Darling
Chi-Squared
Distributions
Burr 4 3 4
Error 5 2 3
Gen. Extreme Value 10 27 N/A
General Logistic 2 1 1
Wakeby 1 28 N/A
Euro Data
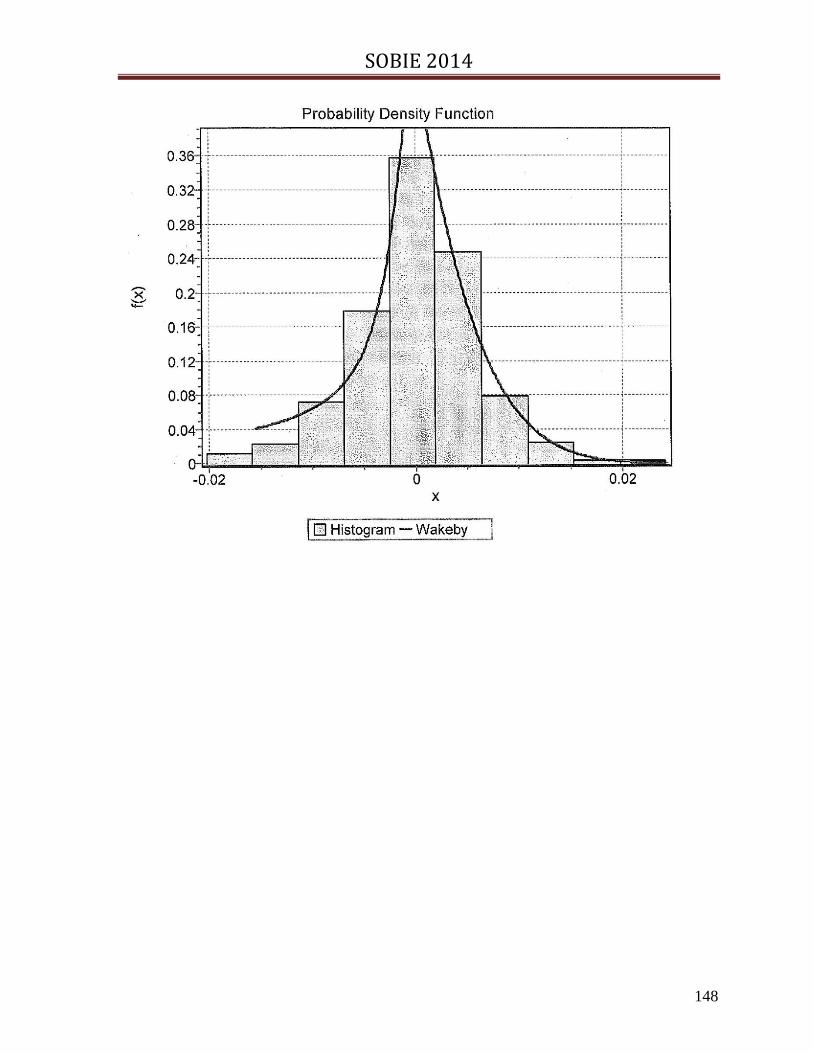
SOBIE 2014
148
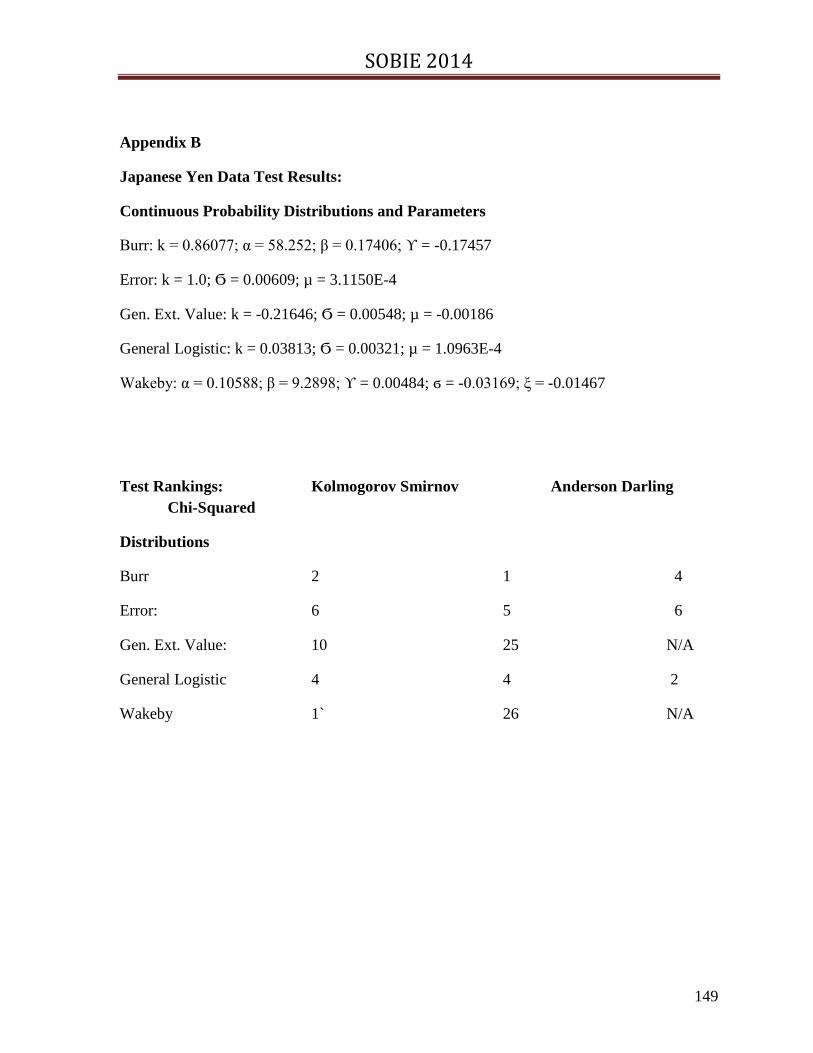
SOBIE 2014
149
Appendix B
Japanese Yen Data Test Results:
Continuous Probability Distributions and Parameters
Burr: k = 0.86077; α = 58.252; β = 0.17406; ϒ = -0.17457
Error: k = 1.0; Ϭ = 0.00609; µ = 3.1150E-4
Gen. Ext. Value: k = -0.21646; Ϭ = 0.00548; µ = -0.00186
General Logistic: k = 0.03813; Ϭ = 0.00321; µ = 1.0963E-4
Wakeby: α = 0.10588; β = 9.2898; ϒ = 0.00484; ϭ = -0.03169; ξ = -0.01467
Test Rankings: Kolmogorov Smirnov Anderson Darling
Chi-Squared
Distributions
Burr 2 1 4
Error: 6 5 6
Gen. Ext. Value: 10 25 N/A
General Logistic 4 4 2
Wakeby 1` 26 N/A

SOBIE 2014
150
Japanese Yen Data

SOBIE 2014
151
References
Aragones, Enriqueta; Thomas R. Palfrey, (2002), “Mixed Equilibrium in a Downsian Model
with a Favored Candidate.” Journal of Economic Theory, Elsivier, Vol. 103 (1) pages 131-
161, March.
Ashkar, Fahim; Smail Mahdi (2006), “Fitting the Log-logistic Distribution by Generalized
Moments,” Journal of Hydorology 328 (3-4): 694-703.
Bennett, Steve (1983),“Log-Logistic Regression Models for Survival Data”, Journal of the
Royal Statistical Society, Series C 32 (2): 165-171.
Elghaly, A. A. A., A. M. Abd-Elfattah and S.M. Assar, (Expected Experiment Times for
Burr Type II Distributions Under Progressive Centering With Random Removals”,
InterstatJournals.net (2008).
Embrechts, P., C. Kluppelberg, and T. Mikosch. Modeling External Events for Insurance and
Finance. New York: Springer, 1997.
Gnedenko, D. V. “Sur la Distribution Limite du Term d’une serie aleatoire,”Ann. Math. 44
(1943): 423-453.
Griffiths, George A. “A Theoretically Based Wakeby Distribution for Annual Series”,
Hydrological
Sciences Journal – des Sciences Hydrologiques, 34, 3, 6, 1989.
Hull, John C., Risk Management and Financial Institutions. Hoboken, New Jersey, John
Wiley and Sons, 2012.
Rosenberg, J.V., and T. Schuermann, “ A General Approach to Integrated Risk Management
with Skewed, Fat-Tailed Risks,” Federal Reserve Bank of New York, Staff Report no.185,
May 2004.
Tadikamalla, Pandu R; Norman L. Johnson (1982), “Systems of Frequency Curves
Generated by Transformations of Logistic Variables,” Biometrika, 69 (2): 461-465.
Tadikamalla, Pandu R. (1980) “A Look at the Burr and Related Distributions,” International
Statistical Review 48 (3) : 337-344.
Wu, J.W. and H.Y. Yu. “Statistical Inference and the Shape Parameter of the Burr Type XII
Distribution Under Failure-Censored Sampling Plan.” Applied Mathematics and
Conputation, Vol. 163, No.1 pp.443-482.
Zimmer, W.J., J. B. Keats and F.K. Wang, (1998). “The Burr XII Distribution in Reliability
Analysis,” Journal of Quality Technology. Vol. 30, 386-394.

SOBIE 2014
152
Optimal Tariff and Environmental Tax under Mixed Oligopoly
Abstract:
In a three country – one good mixed oligopoly model with local pollution we investigate the
effects of privatization in home country on tariffs and environmental taxes. Results are
compared with those obtained in the literature. We show that although privatization raises
tariffs in all three countries environmental taxes remain unchanged in foreign countries.
Key Words: Mixed oligopoly, Environmental tax, Tariff
JEL Classification Number: L 33, Q28
Mixed Oligopoly, Trade and Environment
Introduction
The literature on strategic environmental policy has analyzed the impact of trade liberalization on
environment and welfare to show that free trade and environmental policy may not be mutually
compatible (see Antweiler et al (2001), Bakshi and Roychowdhury (2008), Barrett (1994), Burguet
and Sempere (2003), Kennedy (1994), Tanguay (2001), Ulph (1996), Walz and Wellisch (1997)).
Authors such as Barrett (1994) and Kennedy (1994) have found that trade liberalization will lead to a
lower than efficient tax which is equal to marginal damage. In the absence of tariff governments have
an incentive to use environmental tax as a rent extracting instrument. Lower tax leads to higher
output and profit. In other words, by lowering tax environmental policy is used as a substitute for
trade policy to provide domestic firms a competitive advantage. While Tanguay (2001) has shown
that free trade may lead to lower tax and lower welfare Burguet and Sempere (2003) have shown that
tax and welfare may increase under certain conditions. Although a bilateral reduction in tariff and
raises output and profit it also raised the level of environmental damage. This reduces the incentive
to use environmental policy strategically to gain competitive advantage and increases incentive for
higher environmental protection. On the other hand, lower tariff revenue makes import less attractive
and export more attractive and thus reduces the incentive for environmental protection. The effect on
environmental tax depends on these two opposite effects. As Burguet and Sempere (2003) have
shown, either of these effects can dominate. As global move towards free trade has gained momentum
in recent years several authors have extended the literature on strategic environmental policy by
incorporating public enterprise to analyze the effect of privatization of public enterprise on trade and
environmental policies (see Barcena-Ruiz and Garzon (2006), Fjeill and Pal (1996), Ohori (2004)
Serizawa (2000)). Barcena-Ruiz and Garzon (2006) and Ohori (2004), using a mixed oligopoly model
with one public and one private firm, have shown that although environmental tax is lower than

SOBIE 2014
153
marginal damage regardless of whether public firm is privatized or not, privatization raises both tax
and tariff. Moreover, while Ohori (2004) has shown that privatization raises marginal damage and
lowers welfare, Barcena-Ruiz and Garzon (2006) have shown that welfare may increase under
privatization. On the one hand, although government has an incentive to protect the environment by
stricter environmental law (i.e, higher tax), it has, on the other hand, has an incentive to protect newly
privatized firms by lowering tax and thus raising ouput and profit.
The purpose of the paper is to extend the mixed oligopoly model by introducing a third country to
analyze the effect of privatization on environmental and trade policies. In particular, we seek to
investigate the effect of privatization of public firm on environmental taxes and tariffs.
The paper is organized as follows. In the second section, we present the basic model with two private
firms and a public firm. In the third section, we derive optimum tariffs and taxes and compare them
with those obtained in the literature. In the last section, we provide some concluding remarks.
2. The Model:
We consider a reciprocal dumping model of trade (see Brander and Krugman (1983) and Brander and
Spencer (1985), Ohori (2004)) with three firms located in three countries, Home (1), Foreign (2) and
Rest of the world (3). Without loss generality, we assume that firm 1 is a publicly owned firm. Each
firm sells in all three countries. Brander and Krugman (1983) have shown that rivalry among
oligopolistic firms may lead to dumping where each firm perceives each country as a separate market
and makes separate quantity decision for each. This is an extension of “segmented market” argument
made by Helpman (1982). In each country, the demand for the good is given by an inverse demand
function,
where represents price in and represents output
sold by firm in market. Finally, represents “choke price” or the intercept of the demand
function.
In each country government maximizes welfare by choosing environmental tax, and import tariff,
We assume that for represents damage caused by pollution emitted by
each unit of output. Note that we only consider local pollution. Trans-boundary pollution has been
considered by Tanguay (2001) and Bakshi and Roychowdhury (2008). We simplify the analysis by
assuming constant and identical marginal costs and marginal damages in all three countries. That is,
and for
We also assume that for Following the literature on both
PTA and strategic environmental policy (see Burguet and Sempere (2003), Hamilton and Requet
(2004) ,Krishna (1998), Ohori (2004), Tanguay (2001)), we consider a two-stage game. In the first
stage governments maximize welfare to choose tariffs, and environmental taxes. In the second stage,
public firm (firm 1) maximizes welfare, , and firms 2 and 3 maximize profits, , for
tochoose output.

SOBIE 2014
154
3. Optimal Tariff and Tax under Mixed Oligopoly:
We let and represent consumer surplus, tariff revenue, total damage and tax
revenue respectively in country Firm1, the public firm, chooses for j=1, 2, 3 by
maximizing where, ,
,
and
. (1)
First order conditions yield:
(2)
Firms 2 and 3 maximize respectively to choose , i=2,3 and j=1, 2, 3. The first order
conditions yield:
(3)
From (2), it is clear that firm 1’s output is independent of its own tax and tariff. However, output
produced by firms 2 and 3 depend on both domestic and foreign taxes and tariffs. Furthermore, from
(2) and (3), it follows that import tariffs reduces import and boosts sales of domestic firms. Using (2)
and (3) we can derive total output sold in country and output produced in country
where
for

SOBIE 2014
155
(4)
From (4), we observe that tariff lowers output sold in all the countries. Tariff boosts domestic
production and lowers import. It is clear from (4) that “import effect” is stronger than “production
effect”. Note that total output produced inn country 1 is independent of tariff imposed by country 1.
Therefore “output effect is absent in country 1. Entire decline in sale can be explained by reduction in
import from countries 1 and 2. It seems that foreign environmental tax raises domestic production.
From (2), (3) and (4), it is clear that tax lowers domestic output and raises import. This implies that
foreign firms have an incentive to produce more in the face of a higher tax at home. Again, for
country 1 domestic tax plays no role.
Next, we derive optimal tariffs and taxes. Country 1 maximizes welfare, to choose and
countries 2 and 3 maximize and to choose First order conditions yield, after
using (2) and (3), the following solutions:
(5)
Substituting optimum taxes and tariffs in (2), (3) and (4) we get,
(6)

SOBIE 2014
156
From (5), it is clear that Since country 1 maximizes welfare in both stages it has
a stronger preference for import than countries 2 and 3. In the absence of trans-boundary pollution,
import does not cause environmental damage. Note higher (resp. lower) marginal damage lowers
(resp. raises) tariffs and raises (resp. lowers) tax. Higher marginal damage makes import relatively
more attractive and domestic production relatively less attractive. Therefore, government has an
incentive to encourage import by lowering tariff and discourage domestic production by raising
environmental tax. Finally, note that optimal tax is below the efficient level which equals the
marginal damage. This is consistent with the literature on both strategic environmental policy and
strategic environmental policy with mixed oligopoly (see Ohori (2004), Barrett (1994), Kennedy
(1994)). This is what is known as “rent shifting” effect. Government has an incentive to use
environmental tax to extract economic rent and give domestic industry competitive advantage. The
presence of a public firm and an additional firm does not change the result obtained in the literature
on strategic environmental policy (see Barrett (1994), Kennedy (1994)).
It will be interesting to analyze the impact of privatization on tariff and tax. If firm 1 is privatized, it
also maximizes profit like firms 2 and 3. This becomes a three firm oligopoly model where
governments maximize welfare to choose taxes and tariffs in the first stage. In the second stage, given
optimum tariffs and taxes firms maximize profits to choose output. The optimum tariffs, taxes and
output are as follows (for detailed derivation see Dasgupta and Lee(2012)): for i,j =1, 2, 3,
(7)
Comparing (7) with (5) we find that optimal environmental taxes remain lower than marginal
damage. This result is consistent with results obtained in the literature (see Ohori (2004)). This
indicates that government continues to have an incentive to use environmental tax as a rent-shifting
instrument. Furthermore, we find that privatization raises tariff across the board. This is consistent
with the literature on mixed oligopoly (see Ohori (2004) and Barcena-Ruiz and Garzon (2006)). This
implies that home country has an incentive to protect the newly privatized firm by raising tariff. It
appears that the presence of third country does not change the result obtained in the literature (see
Ohori (2004) and Barcena-Ruiz and Garzon (2006)). However, although Ohori (2004) and Barcena-
Ruiz and Garzon (2006) predicts a higher environmental tax after privatization, it is clear from (7)
and (5) that for countries 2 and 3 environmental taxes do not change. In other words, regardless of
whether home country privatizes its firm or not environmental policies for countries 2 and 3 remain
unchanged.

SOBIE 2014
157
4. Conclusion
We have extended the traditional mixed oligopoly model by introducing a third country and analyzed
the effect of privatization on tariffs and environmental taxes. We have shown that privatization raises
tariffs in all three countries. This result is consistent with those obtained in the literature on mixed
oligopoly (see Ohori (2004) and Barcena-Ruiz and Garzon (2006)). However, our results on the
effects of privatization on environmental taxes differ from those obtained in the literature. Although
literature on mixed oligopoly predicts that privatization will lead to higher environmental taxes, we
show that environmental taxes will remain unchanged even after privatization.
References:
1. Antweiler,W, B.R. Copeland and M. S. Taylor. “Is Free Trade Good for
Environment?” American Economic Review, 2001, Vol. 91, 877 – 908.
2. Bakshi, Soham and Amrita Ray Chowdhury. “Trans-boundary Pollution, Trade
Liberalization and Environmental Taxes” Mimeographed. 2008. Tilburg University.
3. Barcena-Ruiz, Juan Carlos and Maria Garzon. “Mixed Oligopoly and Environmental
Policy” Spanish Economic Review, 2006, Vol. 8, 139 – 160.
4. Barrett, S. “Strategic Environmental Policy and International Trade” Journal of
Public Economics, 1994, Vol. 54, 325 – 338.
5. Brander, J and P. Krugman. “A Reciprocal Dumping Model of International Trade”
Journal of International Economics, 1983, Vol. 17, 313 – 321.
6. Burguet, R and J. Sempere. “Trade Liberalization, Environmental Policy and
Welfare” Journal of Environmental Economics, 2003, Vol.46, 25 – 37.
7. Dasgupta,M and S.D. Lee. “Free Trade Areas, Welfare and Strategic Environmental
Policy” Journal of Busness and Economic Perspectives, 2012, Vol. 39. 118 – 127.
8. Fjell,K and D. Pal. “A Mixed Oligopoly in the presence of Foreign Private Firms”
Canadian Journal of Economics, 1996, Vol. 29, 737 – 743.
9. Gordon, R. H and A. L. Bovenberg. “Why Capital is so Immobile Internationally?
Possible Explanation and Implication for Capital Income Taxation.” American
Economic Review, Vol. 86, 1057 – 1075.
10. Hamilton, S and T. Requate.”Vertical Structure and Strategic Environmental Policy”
Journal of Environmental policy and Management, 2004, Vol. 47, 260 – 269.
11. Kennedy, P. W. ”Equilibrium Pollution Taxes in Open Economies with Imperfect
Competition”, Journal of Environmental Economics and Management, 1994, Vol.
27, 49 – 63.

SOBIE 2014
158
12. Ohori, Shuichi. “Environmental Tax, Trade and Privatization” The Kyoto Economic
Review, 2004, 73, 109 -120.
13. Serizawa, N. “Optimal Trade Policy in an International Mixed Oligopoly” Seoul
Journal of Economics, 2000, Vol. 13, 107 – 122
14. Tanguay, G. “Strategic Environmental Policies under International Duopolistic
Competition”, International Tax and Public Finance, 2001, Vol.8, 793 – 811.
15. Walz, U and D. Wellisch. “Is Free Trade in the Interest of Exporting Countries when
there is Ecological Dumping?”, Journal of Public Economics, 1997, Vol. 66, 275 –
291.

SOBIE 2014
159
The Effect of Problem-Based, Experiential Learning on
Undergraduate Business Students
Elizabeth Rich, Athens State University
Tina Sloan, Athens State University
Bryan Kennedy, Athens State University
Susan Calhoun, Athens State University
Abstract
To introduce undergraduate business students to integrated business process concepts in an
experiential and engaging way, a learning activity was created using Mr. Potato HeadTM. The exercise
was included as a three-hour lab activity in a semester-long management class and allowed students
to interact with one another in a simulated manufacturing environment. By building Mr. Potato Head
to customer specifications, students learned about a basic production process through cooperation and
problem solving. The purpose of this study was to investigate the effects of problem-based,
experiential activities on students’ understanding and enjoyment of learning. In this paper, we outline
the process through which we engaged the students, conducted the production process experiment,
and confirmed our hypotheses using pre- and posttests, and qualitative analysis of student evaluations
of this learning activity.
Introduction
Learner-centered approaches have been linked to increased student learning, higher
graduation rates, and enjoyment of course content (Kuh, 2001; Pollard & Duvall, 2006; Schmidt,
Cohen-Schotanus, & Arends, 2009; Strobd & Van Barneveld, 2009). Thus, educators often advocate
the use of cooperative, experiential, hands-on, problem-based, constructivist, and other learner-
centered methods to ensure students’ active engagement in the learning process (Chickering &
Gamson, 1987; Savin-Baden, 2000; Weimer, 2002). In spite of these research findings, many college
professors primarily use traditional lecture-based techniques to disseminate information to students.
Therefore, college classrooms often remain teacher-centered as opposed to learner-centered.
SOBIE 2014
160
As a response to this issue, a number of research studies have investigated the pedagogy of
learner-centered teaching within higher education. Pollard and Duvall (2006) reported cooperative
learning, peer instruction, and team games led to a deeper understanding of course content among
students enrolled in an undergraduate computer science class. Likewise, Reynolds and Hancock
(2010) reported positive gains in problem-solving skills and achievement among university students
enrolled in a problem-based learning environmental biotechnology course which emphasized finding
solutions to real-world problems based on course content through cooperative learning structures.
Similarly, college students participating in an experiential approach to learning Enterprise Resource
Planning (ERP) indicated, through a self-assessment, the hands-on techniques were positive and
beneficial to their comprehension of business process integration (Rienzo & Han, 2010). Findings
from Kirkham and Seymour (2005), utilizing a live ERP system, also supported previous
research related to the role of hands-on experiences in problem-based settings and gains in students'
confidence and comprehension of business processes.
Other studies of instructional pedagogy within college settings have reported similar results; thus, the
literature suggests support for a paradigm shift from a traditional teacher-centered system to a learner-
centered paradigm (Saulnier, Landry, & Wagner, 2008). Sezer (2010) found shifting from teacher-
centered to learner-centered instruction within a community college math class was instrumental in
strengthening students’ conceptual understanding and appreciation for course content. Yadav, Subedi,
Lundeberg, and Bunting (2011) also noted students' problem-solving abilities and conceptual
understanding of electrical engineering concepts were significantly enhanced with problem-based
learning strategies as compared to passive methodology (traditional lectures) among students enrolled
in an undergraduate engineering course.
Meta-analyses of the effects of problem-based learning have suggested that students participating
in problem-based learning (PBL) environments excel in their application of knowledge and perform
better on assessment measures which require students to link myriad concepts (Dochy, Segers,
VandenBassche, and Gijbels, 2003). Research of undergraduate nursing students conducted by Gabr
and Mohamed (2011) also reported a statistically significant difference with respect to gains in
problem-solving skills and increased student motivation among students taught through PBL
strategies as compared to their peers who were taught through lecture. Problem-based
learning strategies have been shown to enhance additional cognitive measures such as long-term
retention in contrast to traditional methods, which were most effective with measures
requiring declarative knowledge or short-term memory (Gijbels, Dochy, Bossche, & Segers, 2005;
Pollard & Duvall, 2006; Strobd & Van Barneveld, 2009).
In addition to cognitive gains, researchers have reported gains related to affective measures as a result
of problem-based learning approaches (Pollard & Duvall, 2006; Reynolds & Hancock, 2010).

SOBIE 2014
161
Empirical evidence has demonstrated that students enrolled in university courses employing PBL
strategies obtained more university course credits and reported higher levels of social and academic
integration compared to students enrolled in lecture-based courses (Severin & Schmidt,
2009). Similarly, a study of 13,845 medical students indicated that students who participated in small
group, problem-based learning settings needed less time to graduate and reported higher graduation
rates than peers taught through traditional means (Schmidt, Cohen-Schotanus, & Arends, 2009).
Delialioglu (2011) noted university students’ active engagement with academically meaningful
activities within a computer networks course was significantly higher during the eight weeks portion
of the semester dedicated to problem-based, learner-centered strategies as compared to the eight
weeks of lecture-based, teacher-centered strategies. These findings support earlier research literature
linking students' levels of active engagement within learner-centered contexts to student satisfaction,
application skills, and retention in academic settings (Ginns & Ellis, 2007; Kuh, 2001).
While several pedagogical studies of learner-centered approaches have been conducted within
university settings, the current qualitative and quantitative study was designed to further add to the
body of knowledge by investigating the effects of problem-based learning on undergraduate students'
comprehension and enjoyment of learning subject matter presented within an undergraduate business
course (Gijbels, Dochy, Bossche, & Segers, 2005; Kuh, 2001; Pollard & Duvall, 2006; Schmidt,
Cohen-Schotanus, & Arends, 2009Strobd & Van Barneveld, 2009).
Methods
The eight participants in this study consisted of undergraduate business students who were
beginning their third year of collegiate study at a mid-sized, southeastern university. A pretest was
administered to determine the students’ comprehension of what they had read in their textbook about
the production process prior to the exercise. The pretest was comprised of 10 multiple-choice
questions designed to identify what students’ understood about the triggers, data, activities, and
documents in a simplified production cycle. Each question had a value of 10 points with four possible
answers and only one correct answer. The pretest was scored from 0 to 100 with 0 being the lowest
possible score and 100 the highest.
The same test was given to the students immediately following the learning activity. In this one
group, pretest-posttest design, the posttest scores were compared to the pretest scores to determine
whether there was a statistically significant difference in learning outcomes as a result of the
experiential activity. If the subject’s score on the posttest was higher than the subject’s pretest score,
he/she was considered to have learned from the exercise.

SOBIE 2014
162
A satisfaction survey was administered after the posttest to identify students’ preference for learning
experientially. The instrument included four multiple-choice questions with only one correct answer
and three open-ended discussion questions. Results were used to gather qualitative data about the
students’ perception of the usefulness of this type of learning activity in an undergraduate business
class.
Results
A dependent paired samples t-test was conducted to assess whether there was a significant
difference among students' pretest mean and posttest mean scores following an experiential learning
activity. The results are shown in Tables 1 and 2. Overall pretest scores ranged from a low of 30 to a
high of 80; posttest scores ranged from 50 to 90. Results from the one-tailed t-test indicated a
statistically significant gain in achievement based on subjects' pretest (M=52.50, SD= 12.46) and
posttest (M=71.25, SD=18.32) scores, with t(7)=3.23, p<.01.
One hundred percent of the participants responded the hands-on exercise positively
influenced their learning. When asked how the activity compared to traditional lectures, 75% replied
the activity significantly reinforced concepts in the text. Finally, 100% responded they enjoyed the
activity.
Open-ended comments from participants showed that they liked the interaction that occurred
during the exercise and valued the practical, hands-on approach to learning. Many indicated their
understanding was enhanced because of the problem-based method. Students least enjoyed the part of
the exercise that required flow-charting to reinforce learning.
Several suggestions for improvement were made, 100% of them involving the supporting
documentation that was provided. Students requested that all participants be given all job aids and
worksheets so that they could see the roles, responsibilities, and data for the entire process.
Discussion
Research question one sought to determine if there was a significant difference among pre-
and posttest scores of undergraduate business students as a result of participation in an experiential,

SOBIE 2014
163
hands-on learning activity. Quantitative results indicated there was a statistically significant
difference among pre-and posttest scores.
Based on the mean increase of 18.75 points between the pretest and posttest scores, it seems
reasonable to conclude that the experiential approach was an effective strategy with regard
to increased student learning (p < .01). The results of the present study support previous findings
of gains in comprehension as a result of learner-centered methodology within college settings
(Kirkham & Seymour, 2005; Pollar & Duvall, 2006; Reynolds & Hancock, 2010; Rienzo & Han,
2010).
The second research question was qualitative in nature and captured information about
business students’ enjoyment of learning the subject using an experiential activity. Results showed
that all participants enjoyed the hands-on activity a great deal and felt it enhanced their learning.
While the results supported the hypotheses, the study was constrained by the small sample
size. It is recommended that to generalize the findings, further studies be conducted with larger
samples and participants from different populations such as graduate students and non-business
majors.
SOBIE 2014
164
References
Albanese M.A. & Mitchell S. (1993). Problem-based learning: A review of literature on its outcomes
and implementation issues. Academic Medicine 68, 52-81.
Chickering, A.W. & Gamson, Z.F. (1987). Seven principles for good practice in undergraduate
education. AAHEBulletin (March 1987), 3-7.
Delialioglu, O. (2012). Student engagement in blended learning environments with lecture-based and
problem-based instructional approaches. Educational Technology & Society, 15(3), 310-322.
Dochy, F., Segers, M., Van den Bossche, P., & Gijbels, D. (2003). Effects of problem-based learning:
a meta-analysis. Learning and Instruction, 13, 533-568.
Gijbels, D., Dochy, F, Van den Bossche, P., & Segers, M. (2005). Effects of problem-based learning:
A meta-analysis from the angle of assessment. Review of Educational Research, 75 (1), 27-
61.
Ginns, P., & Ellis, R. (2007). Quality in blended learning: Exploring the relationships between on-line
and face-to-face teaching and learning. The Internet and Higher Education, 10(1), 53-64.
Kirkham, K. & Seymour, L. (2005).The value of teaching using a live ERP System with resource
constraints, WorldConference on Computers in Education (WCCE), Cape Town.
Kuh, G.D. (2001). Assessing what really matters to student learning: Inside the National Survey of
Student Engagement. Change, 33(3), 10-17, 66.
Pollard, S., & Duvall, R. C. (2006). Everything I needed to know about teaching I learned in
kindergarten: Bringing elementary education techniques to undergraduate computer science
classes. SIGCSE Bulletin, 38(1), 224-228.

SOBIE 2014
165
Reynolds, M. J., & Hancock, D. R. (2010). Problem-based learning in a higher education
environmental biotechnology course. Innovations in Education & Teaching International,
47(2), 175–186.
Rienzo, T.,& Han, B. (2010). Learning business process integration: Step by step is only the first step.
Decision Line, 41(2).
Savin-Baden, M. (2000). Facilitating problem-based learning: The impact of tutors’ pedagogical
stances. Journal on Excellence in College Teaching, 11(2/3), 97-111.
Saulnier, B. M., Landry, J. P. Wagner, T. A., Longenecker, H. E.(2008). From teaching to learning:
Learner-centered teaching and assessment in information systems education. Journal of
Information Systems Education, 19 (2), 169-174.
Schmidt, H.G., Cohen-Schotanus, J.,& Arends, L.R. (2009). Impact of problem-based, active learning
in graduation rates for 10 generations of Dutch medical students. Medical Education, 43 (3),
211–218.
Sezer, R. (2010). Pulling out all the stops. Education, 130(3), 416-423.
Severiens, S. E., & Schmidt, H. G. (2009). Academic and social integration and study progress in
problem based learning. Higher Education, 48, 59-69.
Strobel, J., & van Barneveld, A. (2009). When is PBL more effective? A meta-synthesis of meta-
analyses comparing PBL to conventional classrooms. Interdisciplinary Journal of Problem-
Based Learning, 3(1), 44–58.
Weimer, M. (2002). Learner-centered teaching: Five key changes to practice. San Francisco, CA:
Jossey-Bass.
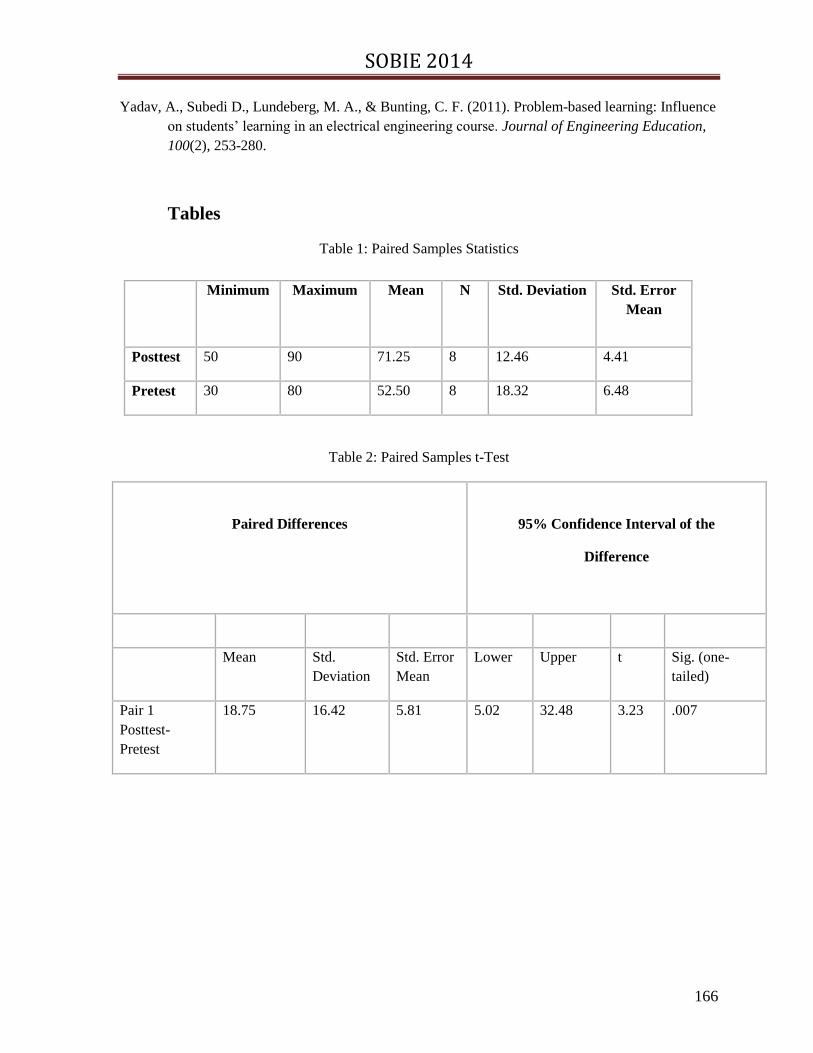
SOBIE 2014
166
Yadav, A., Subedi D., Lundeberg, M. A., & Bunting, C. F. (2011). Problem-based learning: Influence
on students’ learning in an electrical engineering course. Journal of Engineering Education,
100(2), 253-280.
Tables
Table 1: Paired Samples Statistics
Table 2: Paired Samples t-Test
Paired Differences
95% Confidence Interval of the
Difference
Mean Std.
Deviation
Std. Error
Mean
Lower Upper t Sig. (one-
tailed)
Pair 1
Posttest-
Pretest
18.75 16.42 5.81 5.02 32.48 3.23 .007
Minimum Maximum Mean N Std. Deviation Std. Error
Mean
Posttest 50 90 71.25 8 12.46 4.41
Pretest 30 80 52.50 8 18.32 6.48

SOBIE 2014
167
Exploring the Mechanisms and Processes of Authentic Leaders:
A Multi-level Qualitative Examination of Leaders and Followers
Abstract
In the face of ethical meltdowns, financial crises and global recessions, organizational
functioning in the world has become even more complex, challenging, and constantly
shifting. Authentic leadership has increasingly gained widespread attention as a promising
resolution for the perceived need for organizational leaders to break away from traditional
paradigms of management and institutionalize exemplary leadership standards for others to
follow. It is postulated authenticity responds to the call for innovative leadership and offers
contemporary organizations an antipodean paradigm concentrated on cultivating an astute
workforce that is ethical, proficient, and follower focused. However, there is paucity in the
literature to substantiate these claims and this research attempts to fill the knowledge gap.
This qualitative study explores core characteristics, values, attributes and/or traits of
authentic leaders, and investigates the processes, behaviors and mechanisms for developing
authentically. The theoretical foundation builds on the work of Avolio and Gardner (2005),
Walumbwa, Avolio, Gardner, Wernsing and Peterson (2008), Shamir and Eilam (2005), and
others. Research questions are answered through in-depth, unstructured interviews by a
deliberate convenience sample of seven senior leaders from various business sectors. Data
were analyzed using NVivo 10 software and deduced through the methodological
configuration of Hycner (1985). The study finds authentic leaders are transparent individuals
who are governed by their personal convictions (and not outside influences) which are
derived from spiritual and family values grounded in openness, fairness, truth and honesty.
Implications for future research is discussed.
Introduction
According to Avolio and Gardner (2005, p. 316) leadership is traditionally more
difficult in challenging times, but the “unique stressors facing organizations throughout the
world today call for a renewed focus on what constitutes genuine leadership”. All types of
organizations, public, private, even volunteer, are addressing challenges that run the full
gamut from ethical meltdowns to terrorism, including bio-terrorism (e.g., SARS) (Avolio &
Gardner, 2005). Advancing the work of Lawrence and Nohria (2002), Bjugstad, Thach,
Thompson and Morris (2006) direct thoughtfulness to the imperative need for organizations
of all types to cultivate a perceptive workforce in order to be competitive in the future. In
doing so, Roche (2010) apprises the significance of “meaning, authenticity and being ‘real’
in leadership” (as cited in Vella-Brodrick & Page, 2009), is characterized by personnel which
is essentially crucial to the organization’s ability to operate in the uncertain and shifting times
of today (p. 71). As the cost of intellectual capital continues to rise steeply, Bjugstad et al.
(2006) caution contemporary organizations must have an ample supply of talented followers

SOBIE 2014
168
(as cited in Citrin, 2002). Toor and Ofori (2008, p. 621) purport authentic leaders are able to
see widely and deeply enough to break away from the “conventional paradigm of
management and set exemplary standards for others to follow”.
The authentic leader is described as possessing keen self-knowledge or level of self-
awareness, as well as a subjective viewpoint that reflects transparency into their principles,
opinions and belief system (Shamir & Eilam, 2005). According to former Medtronic CEO
Bill George authentic leaders cultivate a self-concept which involves attending to the
personal clarity and convictions needed to develop an authentic meaning system (George,
2003). The literature speculates authentic leaders allude to higher moral and ethical purposes
for the betterment of their followers and possess constructive and continuous self-
development characteristics (Bhindi, Riley, Smith & Hanson, 2008). Perhaps these are
derived from the underlying assumption in the literature that authenticity is informed by
openness and revelation of a self that is true (Avolio & Gardner, 2005). Self-awareness is
theorized as being key to authenticity (Avolio et al., 2004) and thus, Avolio and Gardner
(2005) hypothesize a new classification for authentic leadership as the “‘root’ informing
construct of all new positive forms of leadership, including transformational, charismatic,
servant and spiritual leadership” (Ladkin & Taylor, 2010, p. 65). Furthermore, it is also
predicted that followers will have a higher trust in the leader when they observe the leader’s
high commitment to transparent decision-making, expression of core values and relational
openness (Avolio et al., 2004).
Statement of the Problem
Dychtwald, Erickson and Morrison (2006) apprise in the face of ethical failures,
financial crises, and global recessions the normal range of organizational functioning in the
business world is multifaceted, perplexing, and unstable. Advancing the research of Avolio
and Gardner (2005), Dychtwald et al. (2006), and Erickson (2009), Roche (2010) suggests
some of the great challenges for contemporary business environments involve technologies
and capabilities, market demands, job related conflicts, skill shortages, and competition. To
add to the complexity of operational concerns, Toor and Ofori (2008, p. 621) posit recent
nonprofit and government corruption, the colossal failure in the banking system, and
numerous ethical corporate scandals, described by George (2003) as illustrations of
administrative malfeasance, have left uncomplimentary impressions about leaders and
leadership authenticity. Specifically, the incidents at Enron, WorldCom, Arthur Andersen,
and Adelphia, to name a few, have led to a societal inquisitorial distrust of top leadership
(George, 2003; Bjugstad et al., 2006).
George (2003) offers distinctive acknowledgements to Enron and Arthur Andersen
and explicates the infiltration of their misconduct traumatized the world into a reality that
organizations were being directed toward self-destruction. Although regulators, controllers,
and lawmakers have since crafted codes of practice to close loopholes, George (2003) asserts
improved integrity, stewardship and sound governance are deeper issues that must be
addressed by leaders themselves. With a shift in focus to accountability, Toor and Ofori
(2008) affirm an imperative call for effective authentic leadership propagates a kind of
behavior that embraces practical and realistic performance standards, moral and ethical
SOBIE 2014
169
leadership, and a followership development process that influences positive follower and
organizational achievements. In addition to generating profits and positive outcomes,
Walumbwa et al. (2008) advise this supplication calls organizations to incorporate integrity,
morality and transparency into their culture and as part of their bottom line. Sharing these
concerns, Luthans and Avolio (2003, p. 244) purport “a need for a theory-driven model
identifying the specific construct variables and relationships that can guide authentic leader
development and suggest researchable propositions” and henceforth, introduce the initial
model for this purpose.
While Bjugstad et al. (2006) assert organizational mergers, acquisitions and
downsizing have additionally accounted for more skepticism in the workplace, Maccoby
(2004, p. 79) hypothesizes “the changing structure of families – more single parent homes,
dual working parents and so on – have begun to create work environments where people
value traditional leaders less”. This, according to Maccoby (2004), suggests principles
regarding family dynamics may support reasoning behind the change in how authority
figures are now viewed. Despite varying implicit leadership theories, Avolio et al. (2004)
contend a tumultuous society can only deliver uncertain and shifting environments to which
organizations must seek to operate competently, routinely, and efficiently through a usage of
formalized structures and processes that are led by key organizational leaders with high
levels of integrity, consistent values, and grounded principles that are manifested through
actual behavior.
A synchronized propagation of the literatures has spawned several competing
conceptualizations of authentic leadership resulting in confusion about the construct. Cooper,
Scandura and Schriesheim (2005) speculate areas of conceptual ambiguity exist (e.g., levels
of analysis) and caution scholars to circumvent the pitfalls of advancing prior leadership
theories by cautiously describing, quantifying, qualifying and ultimately rigorously
examining the construct. Citing the research of Cooper et al. (2005), Ladkin and Taylor
(2010) construe “one of the difficulties with the concept from a theoretical perspective is that
a unified, agreed definition for authentic leadership does not exist” (p. 65). Referencing the
work of George (2003), Luthans and Avolio (2003), Avolio and Gardner (2005), and George
and Sims (2007), Toor and Ofori (2008) posit the characteristics of authentic leaders are
comprised of “positive energy, high sense of integrity, moral character and self- discipline,
clear purpose, concern for others, confidence, hope, optimism, resilience and personal
values” (p. 624). With no universally accepted definition compounded by a scarce amount of
empirical research, only a few studies have investigated the precursors, consequences, and
facilitating circumstances for authentic leadership and even fewer have examined the
phenomenon within the environ of the organization (Luthans, Youssef & Avolio, 2007).
Luthans et al. (2007) posit the emergence of multiple practitioner and scholarly conceptions
of authentic leadership has simply created widespread ambiguity.
Purpose of Study
While the literature purports authentic leadership is complex, undefined, and a
philosophy with much fluidity, it is also conjectured as a significant facilitating condition in
organizational culture (Gardner et al., 2005). In the face of several theoretical variants,

SOBIE 2014
170
Luthans et al. (2007, p. 51) do not delineate a process, but simply assert “authenticity
development is a personal and dynamic process”. Yukl (2010) purports authentic leaders
have “high self-awareness about their values, beliefs, emotions, self-identities, and abilities”,
and further suggests their effectiveness stem from innate “motivation, as defined by their
energy, persistence, optimism and clarity about objectives in the face of difficult challenges,
obstacles, setbacks, and conflicts with rivals or opponent” (p. 424). To this assertion Ladkin
and Taylor (2010) contend Yukl (2010) gets the closest to defining the processes required to
get through the ‘centrality of embodiment’ and get to the core of ‘one’s true self” (p. 72).
However, such deep somatic-type work cannot be a straight- forward process, but rather one
that involves self-acknowledgement, balancing, and the resolution of innate paradoxes and
tensions that can be manifested in corporeal and unconscious functioning (Ladkin & Taylor,
2010). Ladkin and Taylor (2010) postulate discovering one’s true self situates an individual
in a highly exposed state that has “corresponding benefit and difficulties associated with such
potential insecurity” (p. 72). With the understanding that authentic leadership is embodied in
self- awareness and exposure processes, this study seeks to understand procedures and
devices an authentic leader appoints to address issues and concerns relating to morality. It
also explores the types of somatic clues and mechanisms the leader utilizes to impact self-
awareness, relationships with followers, and achieving organizational goals (Ladkin &
Taylor, 2010).
Acknowledging the purview of Adorno (1973), Shamir and Eilam (2005) state a
purely subjective concept of authenticity may include instances of ‘honest’ self-delusion in
which leaders who believe they were uniquely gifted with distinctive qualities may begin to
act accordingly (p. 400). Shamir and Eilam (2005) contend actors with a greater-than-thou
mentality has proven dangerous in the past and because of this these researchers have
thickened their definition to embrace attributes for authentic leaders as well as the attributes
of their relationships with followers. Peterlin, Penger and Dimovski (2009) opine
authenticity responds to the call for a new form of leadership that would offer contemporary
organizations an antipodean paradigm that concentrates on (a) personalizing competitive
advantages for an individual; and (b) developing positive organizational behavior which
includes self-esteem, hope, trust, optimism and flexibility. Referring to the research of
Gardner and Schermerhorn (2004), Stewart-Wherry (2012) hypothesizes when authentic
leaders include, develop, and cultivate followers’ high in-role performance (leader, follower
and subsequently, organization), high follower job commitment may result (Stewart-Wherry,
2012).
The literature purports leadership studies acknowledge a growing concern that
contemporary leaders are challenged to be self-disciplined, honest, principled, and follower
focused. Although there is a postulated problem that contemporary leaders are challenged to
become more efficient, principled, and employee focused, a gap in the literature posits
silence on identifying the traits, characteristics, behaviors and mechanisms used by authentic
leaders. This study examines the characteristics of authentic leaders and the relational
maneuvers and influence processes these individuals employ to guide the development of
self, identity, perspectives and decision-making in their relationships with followers. The aim
of the study is to make a contribution to the field of leadership research on authentic

SOBIE 2014
171
leadership in the sense that addresses the silence in the literature pertaining to identifying the
tools and procedures utilized by authentic leaders.
Significance of the Study
Theoretically, Stewart-Wherry (2012) asserts authentic leadership has gained
recognition, focus, and attention from the applied, academic management and organizational
leadership literatures. While a recent upsurge in theoretical, empirical, and practical
investigations signify possibilities for lessening some of the conceptual confusion in the
authentic leadership literature, identifying specific methods for personal development and
functioning in leader-follower relationships have not been studied in the context of
organizational leadership (Zhu, 2006). Further, Zhu (2006) suggests mechanisms and
processes through which authentic leaders utilize in their day-to-day practice to engage and
develop followers and achieve organizational goals including identity, perspectives, and
decision-making remains unknown. This gap in empirical research makes it difficult to assess
the validity of assertions regarding any positive effects of authentic leadership advanced by
its proponents. Hypotheses regarding theoretical and empirical associations between
authentic leadership and follower attitudes, behaviors and performance outcomes have not
been fully investigated (Avolio et al., 2004; Avolio & Gardner, 2010; Walumbwa et al.,
2011a).
Utilizing a qualitative research design, this interview-driven investigation seeks to
examine the prevalence of theorized characteristics, values, attributes and/or traits of an
authentic leader, as well as identify the innate processes, behaviors and mechanisms for
developing authentically. Creswell (2007, 2009) elucidates unstructured interviews allow
researchers to collect required qualitative data in the form of open-ended questions that
attempt to elicit personal views and opinions of respondents and add depth to the
understanding and comprehension of the phenomenon being studied. With an overall
objective to deliver a deeper understanding into the processes, mechanisms, and influence
dynamics associated with authentic leadership, this scholarship may be instrumental to
future research that proposes strategies for ethical and moral leadership, building stronger
relationships and or positive staff development for positive organizational outcomes. While
few empirical studies have been conducted on the theory’s direct relationship to or impact on
organizational outcomes (Stewart-Wherry, 2012), this study pursues to fill the research gap
between theory and real world exercise.
Theoretical Framework
Although several related theories on authentic leadership have been reviewed and
infused into this research to compare and contrast, the study builds on the works of several
authentic leadership scholars including, Avolio and Gardner (2005), Walumbwa, Avolio,
Gardner, Wernsing and Peterson (2008), Shamir and Eilam (2005) and others. Many
authentic leadership scholars view self-awareness as a grounding element of authenticity
(Lord & Hall, 2005; Avolio et al., 2004; Silvia & Duval, 2001) and throughout the literature
authenticity centers around being informed by the real self (Avolio & Gardner, 2005).
According to Avolio and Gardner (2005) the significant intent for defining authentic

SOBIE 2014
172
leadership as a construct was to make it multi-dimensional and multi-level. With this concept
in mind, Avolio and Gardner (2005) postulate four dominating characteristics: (1) “rather
than faking their leadership, authentic leaders are true to themselves”; (2) “authentic leaders
are motivated by personal convictions”; (3) “authentic leaders are originals, not copies” and
(4) the actions of authentic leaders are based on their personal values and convictions” (p.
321). These theoretical conceptualizations solidify the notion that subjective values and
beliefs, positive self-concept, self-regulated positive behaviors, and truth are integral
components of the authentic leadership construct (Luthans & Avolio, 2003; Avolio &
Gardner, 2005; Ilies, Morgeson & Nahrgang, 2005). Although emphasis is placed on the
importance of self-concept in other investigations by Shamir and Eilam (2005), Avolio and
Gardner (2005), and Ilies et al. (2005), Harris (2011) purports the latter two groups of
researchers are virtually silent on how leaders’ experiences might shape their self-concept (p.
28). Due to the extensiveness of early elaborations on the authentic leader, authentic
leadership and authentic leadership development paradigms, Shamir and Eilam (2005)
advance a narrower focus with the creation of their definition.
Progressing the research of Shamir and Eilam (2005), Harris (2011) suggests
“authentic leadership is based on the life experiences of leaders and the followers’ abilities to
identify with these life experiences” (p. 21). In this opinion, Shamir and Eilam (2005)
contend life world experiences of leaders and the associated meanings of these experiences
foster authentic leadership development versus the constant and or open development of
specific skillsets that are learned. Further, Shamir and Eilam (2005) posit the life-stories
approach supports the leader authentication process by followers in three ways, starting with
the followers’ evaluation of whether the life story is logical and plausible. Secondly,
followers get to conclude whether the life-story is consistent with the leader’s behaviors,
which include purported traits, values, and convictions (Shamir & Eilam, 2005). Lastly,
followers also measure alignment by utilizing implicit leadership theories to evaluate the
degree in which the leader’s life-story correlates with their own backgrounds, values and
belief systems (Shamir & Eilam, 2005). Avolio and Gardner (2005) elucidate one of the
primary differences between their conceptualization of authentic leadership and the view
described by Shamir and Eilam (2005) is the “intentional disregard for the leader’s style or
the content of the leader’s values or convictions” (p. 321).
Avolio et al. (2004) hypothesize organizations can benefit from authentic leadership
because of its key determinant of organizational commitment. Chen (2010) elucidates theses
researchers postulate authentic leadership is concerned with enhanced organizational
performance which instills confidence in the future of the organization and the economic
state to which it contributes. In mapping the emergent theoretical territory for authentic
leadership, Avolio and Gardner (2005) delineate several imperative components that play a
critical role in the development and behaviors of authentic leaders, to which the first of which
is leader self-awareness. Ilies et al. (2005) and Shamir and Eilam (2005) assert leader self-
awareness is an emerging process that occurs when individuals practice innate cognizance of
their own existence (including strengths, weaknesses, purpose, values, and desires) and
identify what inaugurate that existence within the context in which they function.
SOBIE 2014
173
Self-awareness or strong sense of self details self-regulatory processes which are
consistently, subjectively, and are continuously explored according through Deci and Ryan’s
(1995, 2000) self-determination theory. Self-determination theory postulates a system of
internal regulatory processes, as opposed to external standards and consequences, is the way
authenticity is achieved (Deci & Ryan, 2000). While Avolio and Gardner (2005) suggest
authenticity is self-reflective, they apprise Kernis’ (2003) theoretical conceptualization
asserts “authenticity involves unbiased (balanced) processing, relational
transparency/authenticity, and authentic behavior”. Further, Luthans and Avolio (2003)
augment authentic leadership and its development encompasses an inherent ethical/moral
factor (Avolio & Gardner, 2005, p.325). The theories of May et al. (2003) delineate an
authentic leader’s ethical and transparent decision-making philosophy is based upon his or
her reserves of moral capacity, efficacy, courage, and resiliency and functions as the
foundation to address ethical concerns and accomplish reliable and sustained moral actions
(Avolio & Gardner, 2005).
In the face of ongoing concerns about organizational injustice and corruption, a deep
longing and need arises for leaders who can be trusted (Kretzschmar, 2007). Luthans and
Avolio (2003) opine new rules are needed to address the ambiguities, lack of clarity, and the
extent of the vulnerability people and organizations face. Avolio and Garner (2005)
conjecture authentic leadership and its development can relate to the sustainable performance
of organizations and recommend continued theory building and methodical testing to
enhance understanding, prediction, and application of the construct. Thus, this interview-
driven investigation examines the prevalence of theorized core characteristics, values,
attributes and/or traits of an authentic leader, as well as identifies innate processes, behaviors
and mechanisms for developing and practicing authentically. As the literature purports a
dearth of research have studied authentic leader development and practice within the
organizational environment and so, the extent of the benefits to the field of business is
basically hypothesized. This investigation tests theoretical research by (1) identifying that
authentic leaders exist in contemporary organizations; based on the theoretical construct, (2)
examine how authentic leaders process, operate, develop, and work with others; and, (3) add
to the body of literature.
In a multi-level examination of leaders and followers, the sampling strategy, based on
the literature and phenomenology approach, utilized qualitative methodology in a parallel
sampling design. Parallel sampling design represents a framework of sampling strategies that
facilitate credible comparisons of two or more cases (Onwuegbuzie & Leech, 2007). The
respondents were conveniently selected based on their status and relationships within and
outside of the organization, identification as an authentic leader, and perceived ability to
actualize the leadership construct being studied. While qualitative investigations typically
involve the use of small samples, Onwuegbuzie and Leech (2005) assert choice of sample
size is important as it determines the extent to which researchers can achieve three types of
generalizations. This investigator pursued to assure that the sample size was not be so large
that extracting thick, rich data would prove difficult; or too small that data saturation (as cited
in Flick, 1998; Morse, 1995), theoretical saturation (Strauss & Corbin, 1990), or
informational redundancy (Lincoln & Guba, 1985) would not be achieved (Onwuegbuzie &
Leech, 2007). The sample consisted of leaders and followers, identified as being an authentic
SOBIE 2014
174
leader, with a minimum of ten years of experience in a leadership role and whose employer is
a corporation, government agency, educational institution, or nonprofit organization.
Seven cases were compared in a tightly nested sampling scheme which, according to
Onwuegbuzie and Leech (2007, p. 238) is a set of “sampling strategies that facilitate credible
comparisons of two or more members of the same subgroup, wherein one or more members
of the subgroup represent a sub-sample of the full sample”. The sampling design involved
comparing each case to all others in what is called pairwise sampling strategy which is
customary in qualitative research (Onwuegbuzie & Leech, 2007, p. 238). Onwuegbuzie and
Leech (2007) label this rigor as “pairwise” because all selected cases of a group are treated
individually or by each “voice” and compared to all other cases, one at a time, in order to
understand better the underlying phenomenon (p.238). Onwuegbuzie and Leech (2007)
postulate the assumption that the collective voices generated by the group of cases will lead
to data saturation. In situations where theoretical saturation is reached, analyzing these sets of
voices can also lead to the generation of theory (Onwuegbuzie & Leech, 2007).
Phenomenology was selected as the qualitative methodology because of its concern
with the study of experience from the perspective of the individual as well as other
customary ways of perceiving, including bracketing, taken-for-granted assumptions, and
conventional wisdom (Hycner, 1985). From an epistemological purview, Hycner (1985)
posits phenomenological approaches are grounded in the paradigm of biased knowledge and
subjectivity, and allows for insight into personal perspective, interpretation, motivations and
behaviors. The rigor of the study encompassed a reliable comparison of three subgroups that
were extracted from a baseline level (group 1) and two subsequent levels (groups 2 and 3) in
a parallel sampling design. Following a phenomenological process that was applied to a
purposefully selected convenience sample, Onwuegbuzie and Leech (2007) assert this
methodology permits a multilevel sampling design which facilitates a credible comparison of
three subgroups extracted from different levels of the study.
Research Questions
Yukl (2010) asserts authentic leadership research is understudied and over-defined as
contemporary scholars, perceived through multiple versions of authentic leadership theory,
are in less agreement. A recent conceptual variation includes focus on self-concepts and self-
identities and refers to inner qualities and values germane to the self (Moore, 2008).
According to Yukl (2010, p. 424) some contemporary researchers and theory focuses are:
Be true to yourself and to the world (Terry, 1993); self-referential actions (Cashman,
1998); emotional intelligence principles of self-efficacy; self-regulation and empathy
theory (Goleman, 1998); self-awareness, positive self-regulation, positive
psychological capabilities (Luthans & Avolio, 2003) and positive self-development
(Schabram, 2009); behavioral integrity (Simons, 1999); integrity and consistency
(Palanski & Yammarino, 2007); the theories of two dimensional altruistic
frameworks (Price, 2003); two dimensional frameworks based on values and
emotions (Michie & Gooty; 2005); the dissimilarity between personal moral code and
organizational moral code (Novicevic, Davis, Dorn, Buckley & Brown, 2005); four
tenets model of self-development (Kernis, 2003); and the expanded version of Kernis’
four tenets model (Ilies, et al., 2005).

SOBIE 2014
175
Yukl (2010) posits these models build on conceptualizations that behaviors of authentic
leaders include espoused values that are consistent with a core value system which
perpetuates a trueness to selves and others, consistency in transactions, and ethical and moral
deployments of what are right and fair regarding people. Variations on viewpoints suggest
authentic leaders construct distinctive types of relationships that incorporate shared trust,
exhibit transparency (exposed and genuine), provide leadership towards common
organizational objectives, and place prominence on follower welfare and development (Yukl,
2010).
Research Question #1: Identify core characteristics, values, attributes and/or traits
of an authentic leader.
Other theoretical variations on authentic leadership theory emphasize intuitiveness
towards others, for example, five dimensions for empowering others (George, 2003) or
Gardner et al.’s, (2005) speculation that authentic leaders encourage self-determination in
followers to bring about autonomy, and competence and relatedness which constitutes a
theoretical focus (as cited in Becker, 1998; Yammarino, Dionne, Schriesheim & Dansereau,
2008) or “directive approach” (Yukl, 2010, p. 424). Advancing the research of Bass and
Steidlmeier (1999), Yukl (2010) progresses a version of authentic leadership that
encompasses transformational and transactional attributes. Their hypothesis critically tests
the presence of authenticity by measuring the extent of arousal and engagement by followers
in activities beyond or outside of their scope due to influence by the leader (Bass &
Steidlmeier, 1999). While it is important to identify the convergent validity between
leadership constructs, Avolio and Gardner (2005) opine much ambiguity remains about the
authentic leadership construct and for this reason the case for discriminant validity is
important, as well.
It is concerning that because of the multitude of variables residing in the construct,
processes underlying authentic leadership have not yet undergone rigorous testing.
Advancing the work of Peus et al. (2010), Cottrill (2011) suggests “eleven studies on
authentic leadership focused on the impact of ethically-oriented leadership styles, i.e.,
transformational, authentic, ethical, and spiritual leadership, on organizational performance
between 1990 and 2009” (p. 41). Absent of concrete guidelines to test the various
hypotheses, models or direction of the research, empirical investigations are simply isolated
and cannot build upon each other (Cottrill, 2011). Yukl (2010) postulates “until differences
in the definition of authentic leadership are resolved, differences between authentic
leadership theory and other theories of leadership (e.g. servant, spiritual, transformational)
remain unresolved because it will be difficult to determine what should be included in the
research” (p. 425).
Research Question #2: What are the processes, behaviors and mechanisms for
developing authentically?
The unique role of authentic leadership in organizations is evidenced by the limited
but existing literature. Empirical, theoretical, and practitioner research hypothesizes authentic
leadership may matter significantly at the individual, group, and organizational levels. This

SOBIE 2014
176
research examines the individual who is identified as an authentic leader and performs and
systematic rigor to identify the mechanisms and processes by which authentic leaders exert
their influence on follower’s attitudes and behaviors. The researcher of this study considers
three assumptions in pursuit of this examination:
1. Respondents will be honest and transparent in their responses;
2. Respondents will accurately define their constructions;
3. Qualitative phenomenological examination is most appropriate for this type of
study and the best approach for answering the research questions.
Scope and Limitations
Seven individuals were identified as authentic leaders and, in meeting this particular
criteria, were invited to participate in a study specifically designed to investigate the
existence of authentic leadership in contemporary organizations, identify and provide
understanding of the mechanisms and processes authentic leaders utilize in their real world
practice within an organizational setting, and add to the body of existing knowledge. This
qualitative research design utilized unstructured, in-depth interviews that asked 25 open-
ended questions based on the literature to obtain subjective descriptive information that
provided answers to the research questions. All interviews were recorded by digital recorder
and data were subsequently transcribed, member-checked, and then interpreted and
evaluated. Only one respondent purported knowledge of the term “authentic leader”. The
respondents were representatives of four types of organizations: corporate, government,
educational institution and nonprofit.
The generalizability of research findings is controlled by the logic of sampling and
usually postulates a random selection process of the representative sample which is
conducted in a manner that offers the ability to generalize findings to the population
(Creswell, 2009). The qualitative paradigm ambitions to understand a phenomenon from the
innate viewpoint of each respondent, by means of detailed descriptions of cognitive and
symbolic actions, and through meaning related to observable behavior (Wildemuth, 1993).
Because qualitative research methodology is generally comprised of a small convenient
sample, results do not account for or predict the behavior of a wide classification of people.
Munhall (1989) apprises this methodology, which rejects both a cause-and-effect hypotheses
and any widespread laws lacking socio-historical context, the researcher and respondent
become involved together in the phenomenon being studied. While relevant literature warns
that understandings derived from experiential qualitative investigations may be realized only
after several exchanges are carried out or through interpretations of data collection
methodologies (Greenberg, Rice & Elliot, 1993), Kemmis (1980) avows the real significance
of non-experimental research rests in its connection to the real world, its ability to define
behaviors within social and historical contexts, and its capacity to rationally critique these
descriptions. Holistic by nature, qualitative research is concerned with specific human
behavior in all of its intricacies (Creswell, 2009).
Another limitation that the researcher encountered was running out of time due to
several occurrences (e.g., the rescheduling interviews, lapses in member-checking timeline, a
computer crash, re-processing of lost data) along the way that impacted the time-frame
SOBIE 2014
177
allotted for interviews and observations. One observation and one face-to-face session was
conducted on the same day for each respondent. Thus, contact between researcher and
respondents was personal, individually focused, and lengthy. It is the researcher’s belief that
a lack of time was the causal factor in the decision to reduce the number of projected
respondents. Data were transcribed and member-checked for seven interviews. Interviews
and observation data were analyzed using NVivo 10 software and deduced through the
methodological framework of Hycner (1985). NVivo 10 results were qualified in order to
ensure a clear and concise demonstration of study results.
Definition of Key Terms
Authentic leadership. “A process that draws from both positive psychological capacities and
a highly developed organizational context, which results in both greater self-awareness and
self-regulated positive behaviors on the part of leaders and associates, fostering positive self-
development” (Luthans & Avolio, 2003, p. 243). “A pattern of leader behavior that draws
upon and promotes both positive psychological capacities and a positive ethical climate, to
foster greater self-awareness, an internalized moral perspective, balanced processing of
information, and relational transparency on the part of leaders working with followers
fostering positive self-development” (Walumbwa et al., 2008, p. 94 ).
Authentic leader. “People who have the following attributes: (a) the role of the leader is a
central component of their self-concept, (b) they have achieved a high level of self-
resolution or self-concept clarity, (c) their goals are self-concordant, and (d) their behavior is
self-expressive” (Shamir & Eilam, 2005, p. 399).
Authenticity. “Owning one’s personal experiences, be they thoughts, emotions, needs,
preferences, or beliefs, processes captured by the injunction to know oneself and behaving in
accordance with the true self” (Harter, 2002, p. 382).
Authentic follower. “Followers who follow leaders for authentic reasons and have an
authentic relationship with the leader” (Shamir & Eilam, 2005, p. x). “Mirrors the
developmental processes of authentic leadership and is characterized by heightened levels of
followers’ self-awareness and self-regulation leading to positive follower development and
outcomes” (Gardner & Schermerhorn, 2004, p. 322).
Organization of Study
The research paper is organized in the following order: Chapter 1 introduces a qualitative
investigation of authentic leadership that encompasses an integrated theoretical framework.
Based on the literature, this study addresses the imperative need to recognize specific
characteristics, traits, behaviors, processes and mechanisms of an authentic leader.
Perspectives regarding the characteristic of authentic leaders and how leaders develop
personally are used to create two research questions. Chapter 2 offers a review of the extant
literature on authentic leadership and compares and contrasts various concepts on authentic
leadership. Chapter 3 presents the research methodology engaged to study the problem. An
explanation is provided as to the reasoning behind selecting an interview-driven qualitative
methodology and its suitability for this particular type of research project. Data collection
methods, instrumentation, researcher role, protection of the rights of the respondents, and
SOBIE 2014
178
data analysis are also discussed in the chapter. Chapter 4 delivers principle findings, with
regards to the research questions, in an analysis and explanation of the findings. Chapter 5
discusses the theoretical implications, insights and conclusions drawn from the analysis of
Chapter 4 and includes the significance of the study, limitations, implications and
suggestions for future research.
Summary
Viewed by some scholars as an extension of transformational and transactional
leadership (Bass & Steidlmeier, 1999) or being closely related to charismatic, servant and
spiritual leadership (Avolio & Gardner, 2005), the literature purport authentic leaders are
stewards and servants who not only lead with their heads but with their hearts as well. While
authentic leaders are passionate about their followers and those they serve, they are
passionate on doing the right thing and thus, produce high energy to make the impossible
possible (Gardner, Avolio, Luthans, May & Walumbwa, 2005). To this end, it is argued that
through the modeling of authentic deeds (Shamir & Eilam, 2005), self-awareness (Avolio &
Garner, 2005; Avolio et al., 2004; Walumbwa et al., 2008), positive psychological capital
(Avolio et al., 2004), relational transparency (Avolio & Garner, 2005), self-regulation
(Sparrowe, 2005) and balanced processing (Walumbwa et al., 2008), authentic leaders are
the “solution to the leadership crisis in the modern business world” (Toor & Ofori, 2008, p.
624). Citing the research of Avolio (2005), Zhu (2006) suggests authentic leadership is “the
highest end of leadership” as the “leading by example” concept is the key factor that nurtures
authenticity within a leader follower relationship (p. 6). According to Avolio et al. (2004)
and Luthans and Avolio (2003), “authentic leaders influence follower’s moral, emotional,
affective and cognitive development through the modeling of positive values, psychological
states, moral behaviors and self-development” (Zhu, 2006, p. 6). Thus, according to Zhu
(2006, p. 6) authentic leaders positively impact followers to the extent that followers are
empowered to confront “potential moral dilemmas and ethical challenges and solve these
challenges in an ethical way, placing the interests of the organization above self-interests”.
The review of the literature concentrates on the dynamics and intricacies of authentic
leadership theory.
Review of the Literature This literature review process includes the utilization of the ProQuest database which
searches eighteen databases (ABI/INFORM Complete; Dissertations and Theses@ Regent
University; EconLit; Engineering Research Database; ERIC; Ethnic NewsWatch;
International Index to Performing Arts; MEDLINE; PAIS International; ProQuest
Dissertations and Theses; ProQuest Education Journals; ProQuest Entrepreneurialship;
ProQuest Historic Newspapers: Christian Science Monitor, New York Times, Wall Street
Journal, Los Angeles Times, Washington Post; and ProQuest Religion) for literature in
relation to the keyword phrases. Keyword phrases used for the search were: authentic
leadership, authentic leadership in organizations, authentic leader, authenticity, authentic
followership, moral leadership, and authenticity in leader – follower relationships.
The construct, examined in theoretical, practitioner, and empirical studies, is mostly
tested through qualitative or mixed method procedures (Avolio & Gardner, 2005). While it
is recognized that leadership literature has paid limited attention to the processes,
construction and development of authentic leaders and authentic followers and even less

SOBIE 2014
179
regard to its relevance in organizations, authentic leadership is frequently investigated with
transformational leadership theory, servant leadership theory, spiritual leadership theory,
charismatic leadership theory or ethical leadership (Avolio & Gardner, 2005). This review of
the literature utilized the ProQuest database, scholar.google.com, JSTOR
(http://www.jstor.org) and printed manuscripts to produced 114 resources of which 77 were
selected for their relevance to this neglected discussion. The review of the literature defines
authentic leadership and discusses the historic roots of authenticity, contemporary theories of
authentic leadership, constructual challenges, consequences and solutions, and the conclusion
section, which includes the implications for theory, policy and practice for future research.
Authentic Leadership Defined
Chan, Hannah, and Gardner (2005) contend authentic leadership is a comparative
“newcomer to the leadership literature canon, first appearing in the 1990s in the fields of
sociology and education” (Ladkin & Taylor, 2010, p.65). However, citing the work of
Hollister (1993), McMurray, Pirola-Merlo, Sarros & Islam (2010) postulate authentic
leadership research has been a neglected area in organizational studies. In the absence of a
succinct definition that is generally accepted, the characteristics constituting authentic
leadership characteristics vary in definition (see Table 1). Nonetheless, while the concept is
broadly defined Yukl (2010) postulates it is a normative theory that describes an ideal leader
for organizations. Silver (2008) suggests this knowledge and understanding is necessary to
the “integration of representatives from the social sciences and business fields that enable
organizations to deliver what O’Connell (1988) describes as worthwhile service” (p. 27).
Table 1
Definitions of Authentic Leaders
Source Definition
Avolio and Gardner
(2005, p. 321)
Authentic leaders are “those who are aware of how they think
and behave and are perceived by others as being aware of their
own and others values/moral perspectives, knowledge, and
strengths; aware of the context in which they operate; and are
confident, hopeful, optimistic, resilient, and of high moral
character”.
Avolio, Luthans and
Walumbwa (2004, p. 4)
Authentic leaders are “those individuals who know who they
are, what they think and behave and are perceived by others as

SOBIE 2014
180
as cited in Avolio,
Gardner, Walumbwa,
Luthans and May (2004,
pp. 802-803)
being aware of their own and others’ values/moral perspective,
knowledge, and strengths; aware of the context in which they
operate; and who are confident, hopeful, resilient, and of high
moral character”.
Begley (2004, p. 5) Authentic leaders exhibit, “self-knowledge, sensitivity to the
orientations of others, and a technical sophistication that leads to
a synergy of leadership action”.
Fields (2007, p.195) as
cited in Chan et al. (2005)
Authentic leaders are “characterized as having (a) heightened
capacity to effectively process self-information, including
values, beliefs, goals, and emotions; (b) ability to use their self-
system to regulate behaviors while acting as a leader; (c) high
levels of clarity of self; and (d) ability to manage tension
between self and social demands”.
George & Sims (2007, p.
xxxi) Authentic leaders are “genuine people who are true to themselves and
to what they believe in. They engender trust and develop genuine
connections with others. Because people trust them, they are able to
motivate others to high levels of performance. Rather than letting the
expectations of other people guide them, they are prepared to be their
own person and go their own way. As they develop as authentic
leaders, they are more concerned about serving others than they are
about their own success or recognition”.
Ilies, Morgeson &
Nahrgang (2005, p. 374)
“Authentic leaders are deeply aware of their values and beliefs,
they are self-confident, genuine, reliable and trustworthy, and
they focus on building followers’ strengths, broadening their
thinking and creating a positive and engaging organizational
context”.
Luthans & Avolio (2003,
p. 243)
“The authentic leader is confident, hopeful, optimistic, resilient,
transparent, moral/ethical future-oriented, and gives priority to
developing associates into leaders themselves. The authentic
leader does not try to coerce or even rationally persuade
associates, but rather the leader’s authentic values, beliefs, and
behaviors serve to model the development of associates.”
Shamir & Eilam (2005, p.
399) “Authentic leaders can be distinguished from less authentic or
inauthentic leaders by four self-related characteristics: 1) the
degree of person role merger i.e. the salience of the leadership
role in their self-concept, 2) the level of self-concept clarity and
the extent to which this clarity centers around strongly held
values and convictions, 3) the extent to which their goals are
self-concordant, and 4) the degree to which their behavior is
consistent with their self-concept.”
Walumbwa et al. (2008,
p. 94)
An authentic leader is one who exhibits “a pattern of leader
behavior that draws upon and promotes positive psychological
capacities and a positive ethical climate, to foster greater self-
awareness, and internalized moral perspective, balanced
processing of information, and relational transparency on the
part of leaders working with followers, fostering positive self-
development”.

SOBIE 2014
181
Historical Roots of Authenticity
According to Harter (2002) the concept of authenticity has an expansive history
within the fields of philosophy and psychology (Erickson, 1995, p. 319). From an historical
purview, Avolio and Gardner (2005) elucidate the roots or authenticity originate in Ancient
Greek philosophy to which this foundational theme elevates to the recognized Greek
aphorism, to thine own self be true. Citing the investigation of Trilling (1972), Gardner,
Cogliser, Davis and Dickens (2011) apprise the etymology of the word “authentic” points to
the Greek word, “authento” which means to have complete control (p. 5). This notion
reflects the belief of Kernis and Goldman (2006) that authentic leaders are completely self-
controlled. Based on the postulation that an “‘unexamined’ life is not worth living”, Gardner
et al. (2011, p. 5) inform Socrates provides an early orientation to authenticity by
concentrating on the importance of self-inquiry. Hutchinson (1995) purports Aristotle trailed
with an ethical interpretation that suggested a person’s individual pursuit of a higher good is
accomplished through self-realization. Kernis and Goldman (2006) suggest self-realization
is associated with an innate well-being or “eudaimonia,” which according to Gardner et al.
(2011) is formed from contentment that arises from effectively accomplishing activities that
reflect one’s own true calling.
Although the concept of authenticity can be traced back to sixth century BCE,
Liedtka (2008) asserts the Existentialism work of Jean Paul Sartre (1956) and Martin
Heidegger (1962) has also supported much of its scholarly attention. According to these
early 20th-century philosophers authenticity is developmental or a process of continually
becoming (Liedtka, 2008). Heidegger (1962, p. 159) further asserts “each one of us is what
we pursues and cares for” to which in everyday terms, Liedtka (2008) vies “we understand
ourselves and our existence by way of the activities we pursue and the things we take care
of” (p. 239). Etzioni (1968) posits by the 1950s through 1960s the study of authenticity
transitioned from a sole focus on executive level leadership to encompass all levels of staff.
With former attention drawn to top executives, Barnard (1949) distinguishes between
“personal responsibility…an obligation to personally engage in social codes such as abiding
in the law and personal commitments” and “organizational responsibility” considered
formerly as “a mandate to morally guide the company internally and in the social context”
and recognized conflict theory and the numerous variables between desires and
responsibilities (Schabram, 2009, p. 16). Sartre (1956) and Etzioni (1968) clarified the
concept of authenticity further by implying a responsibility to be true to one’s moral self; in
addition to making sound business decision that value self-interest and public good
(Schabram, 2009).
From an organizational leadership standpoint, this paradigm shift examines the entire
organization through an authentic lens that displayed strong accordance between external
behavior and internal values (Etzioni, 1968). During this period, Avolio and Gardner (2005)
opine of particular relevance are the writings of humanistic psychologists Carl Rogers (1959,
1963) and A. H. Maslow (1968, 1971) who focused on the development of the self-actualized
person (i.e., individuals that possessed a clear and accurate picture of self and life). The

SOBIE 2014
182
observations of these psychologists fully functioning self-actualized persons were
unencumbered by others’ expectations of them and are able to make sound personal choices
(Liedtka, 2008). Maslow’s five-level needs hierarchy considers persons arriving at the fifth
level, self-actualization, as authentic and having strong ethical convictions (Ivancevich,
Konopaske & Matteson, 2008; Liedtka, 2008). While the achievement of total authenticity is
ideal, Erickson (1995) argues humans do not have the capacity to be completely authentic or
inauthenticity. Viewing authenticity as a progressive (e.g., more) or regressive (e.g., less)
development, Erickson (1995) counsels it is unwise to consider the construct as an either/or
condition (Gardner et al., 2011).
While the emergence of various theoretical frameworks defining what constitutes
effective leadership existed long before the 1900s, advancing the work of Antonokis et al.
(2004), Mahoney (2009) purports documentation of these constructs only began around the
beginning of the 20th
century and the earliest philosophical conceptions of authenticity surfaced in the 1960s reflecting the Novicevic et al. (2006) hypothesis that organizational authenticity
is manifest through the leadership (Gardner et al., 2011). In an examination of varied historical
ideologies in leadership research, Mahoney (2009) concludes scholars have traditionally
failed to recognize any level of significance or correlation between one’s personal honesty,
values, and moral characteristics and their behaviors in ways that impact self, others, the
work place and society until the Grover and Moors-Man (2007) global study. Along these
lines and in acknowledgment of the research of Lowe and Gardner (2001), McMurray,
Pirola-Merlo, Sarros and Islam (2010) advance leadership studies have historically neglected
the “unconscious and affective features of leader-follower interactions” in organizational
studies (p. 438). Silver (2008) asserts such scholarship and understanding does not only
progress organizational development, but is significant to the “integration of representatives
from the social sciences and business fields that enable organizations to deliver what
O’Connell (1988) describes as worthwhile service” (p. 27). Conclusively, Gardner et al.
(2006, p. 6) suggest a meta-analysis of the historical literature conducted by Kernis and
Goldman (2006) offered a basic understanding of authentic leadership that was centered on
four themes: A range of mental and behavioral processes that explain how people discover and construct a
core sense of self, and how this core self is maintained across situations and over time.
Moreover, they assert that this literature reflects four central themes: “authentic functioning
of people’s (1) self-understanding, (2) openness to objectively recognizing their ontological
realities (e.g., evaluating their desirable and undesirable self-aspects), (3) actions, and (4)
orientation towards interpersonal relationships” (p. 284). Moreover, these themes are
consistent with their conceptualization of authenticity as encompassing four key components:
(1) awareness (i.e., knowledge and trust in one’s thoughts, feelings, motives and values); (2)
unbiased processing (i.e., objectivity about and acceptance of one’s positive and negative
attributes); (3) behavior (i.e., acting based on one’s true preferences, values, and needs rather
than merely acting to please others, secure rewards, or avoid punishments); and (4) relational
orientation (i.e., achieving and valuing truthfulness and openness in one's close relationships;
Kernis, 2003; Kernis & Goldman, 2006). This multi-component conceptualization of
authenticity, in turn, has provided the theoretical foundation for several theories of AL
(Gardner, Avolio, Luthans, May, & Walumbwa, 2005a; Ilies, Morgeson, & Nahrgang, 2005;
Spitzmuller & Ilies, 2010; Walumbwa, Avolio, Gardner, Wernsing, & Peterson, 2008).
Contemporary Theories of Authentic Leadership

SOBIE 2014
183
A total disappearance of authentic leadership from the literature occurred between
1970s until the early 1990s (Liedtka, 2008), to which Chan et al. (2005) opine the construct
resurfaced initially in the fields of sociology and education initially but also attracted
attention, once again, from the leadership studies community (Ladkin & Taylor, 2010).
Gardner et al. (2011) postulate the research most instrumental in reigniting scholarly interest
is Luthans and Avolio (2003) conceptualization that the model include positive
organizational behavior (POB) (as cited in Luthans, 2002), theories for authentic
development in leaders (e.g., transformational/full-range leadership (as cited in Avolio,
1999), and ethical perspective-taking (as cited in Kegan, 1982). While Walumbwa et al.
(2008) posit scholars (e.g., Cooper et al., 2005; Shamir & Eilam, 2005; Sparrowe, 2005)
express concerns about defining authentic leadership as a construct that encompasses the
positive psychological capacities of confidence, hope, optimism, and resilience (as cited in
Luthans et al., 2007), the core components of the construct are governed by four themes: self-
awareness, constructive self-regulation, constructive self-development, and morality, which
have consistently underpinned much of the way in which the term is used (Gardner et al.,
2011).
Moving away from the “outdated notions of ‘heroic’ models of leadership that
encourage adulation of a few gifted individuals at the top of organizations” (Alban-Metcalfe
& Alimo-Metcalfe, 2007, p.116), Luthans and Avolio (2005) assert an innovative way to
define authentic leadership as a construct was to make it multi-dimensional and multi-level.
Engaging an effort to gain clarity into the characteristics, traits and processes of authentic
leaders, Avolio, Gardner, Walumbwa, Luthans and May (2004, p. 4) elucidate authentic
leaders are:
Those who are deeply aware of how they think, behave and are perceived by others as
being aware of their own and others’ values/moral perspectives, knowledge, and
strengths; aware of the context in which they operate; and who are confident, hopeful,
optimistic, resilient, and of high moral character.
Referencing a broadminded study on leadership behavior by Hansen (1987), Bjugstad et al.
(2006) postulate active authentic followership signifies true acceptance of a leader’s
authority and gives legitimacy to the direction and vision of the leader. This
conceptualization purports followers introduce acceptance which impacts the progression of
authentic leadership to the extent that authentic leaders are non-existent until they are
validated by “followers who authenticate the leader and follow him or her authentically”
(Shamir & Eilam, 2005, p. 401). While Bjugstad et al. (2006) acquaint leaders can only
accomplish something at the permission of their followers (as cited in Dupree, 1992), Shamir
and Eilam (2005) agree the development of authentic leadership is not only contingent on the
existence or creation of authenticity in leaders but also the authentication of the leader by
followers which reinforces the leader’s authenticity. As the significance of follower
perceptions is infused into the construct, Gardner, Avolio, Luthans, May and Walumbwa
(2005) contend authentic leadership outspreads past the authenticity of the leader to
encompass authentic dealings with followers and others acquaintances.
Leader and follower associations are specified behaviors that engage both “leaders
and followers as active agents in an authentic relationship” (Kliuchnikov, 2011, p. 72) and

SOBIE 2014
184
are characterized by “a) transparency, openness, and trust, b) guidance towards worthy
objectives, and c) an emphasis on follower development” (Gardner, 2005, p. 345). Goldman
and Kernis (2002) assert “relational authenticity involves an active process of self-disclosure
and the development of mutual intimacy and trust so the intimates will see one’s true self-
aspects, both good and bad” (p. 19). Delineated as a unique leadership style hypothesized to
occupy personality and charisma, George (2003) augments authentic leaders demonstrate a
high level of self-discipline, are grounded in purpose, engage in a practice of solid values and
morals, and lead with the heart, passion, and compassion to establish connected relationships.
Kernis (2003) advance a developmental model that suggests attainment of
authenticity produces ultimate levels of self-esteem. That is, as individuals come to know and
accept themselves, including their strengths and weaknesses, they begin to exhibit high levels
of stable, as opposed to fragile, self-esteem (Walumbwa et al., 2008). Such individuals are
mature and comparatively free of the defensive and self-justifying biases exhibited by
immature or less self-aware individuals (Walumbwa et al., 2008). Kernis (2003) postulates
persons at this stage of development are consequently more comfortable forming transparent,
open, and close relationships with other leaders and or followers. Moreover, these individuals
display authentic behaviors and attitudes that reflect consistency with their values, beliefs,
and actions (Kernis, 2003). Ryan and Deci (2003) profoundly assert authenticity is achieved
when individuals enact internalized self-regulation processes-namely, a conduct that is
guided by internal values as opposed to external threats, inducements, or social expectations
and rewards (Walumbwa et al., 2008).
While there are many positive approaches to effective leadership, such as
transformational leadership, ethical leadership, charismatic leadership, and authentic
leadership (Eagly & Carli, 2007), Avolio and Gardner (2005) postulate authentic leadership
serves as the single root construct for all positive leadership approaches and is fundamental
to the ability of individuals to develop meaningful workplace relationships and to establish
positive, ethical work environments (Dann, 2008; Chanchal, 2009; Harris, 2011).
Consistently throughout the literature authentic leadership is found to be informed by the
“true” self (Avolio & Gardner, 2005). Most scholars perceive self-awareness as the key
component of authenticity (Lord & Hall, 2005; Avolio et al., 2004; Silvia & Duval, 2001)
and have yielded models “grounded in Kernis’s (2003) multi-component conception of
authenticity” (Gardner, 2011, p. 9). However, advancing the research of Hannah, Lester and
Vogelgesang (2005), Luthans and Avolio (2003), and May, Chan, Hodges and Avolio
(2003), Ladkin and Taylor (2010) posit the literature strongly connects authentic leadership
to moral leadership which in some ways resemble philosophies of socialized charismatic
leadership.
In developing workplace relationships, the initial task for the authentic leader is to
build followers’ self-efficacy which is reportedly what Luthans et al. (2007) call the state of
confidence (Gardner & Schermerhorn, 2004). Self-efficacy is defined as “one’s own belief or
personal judgment about how well one can execute a specific task within a particular
context” (Gardner & Schermerhorn, 2004, p. 274). Advancing the meta-analytic examination
of 114 studies by Alexander and Andersen (1993) and research by Stajkovic and Luthans
(2001) and Luthans and Luthans (2004), Gardner and Schermerhorn (2004) suggest “the
SOBIE 2014
185
self-efficacy was more strongly linked to work performance than any other well-known
organizational behavioral construct, such as job satisfaction, goal-setting, conscientiousness,
feedback and organizational behavioral modification” (p. 274). Authentic leaders
demonstrating transparent decision-making, confidence, optimism, hope, pliability, and
consistency between word and deeds, have translucent intentions and can recognize their
own weaknesses (Ceri-Booms, 2010). Gardner and Schermerhorn (2004) postulate true
authentic leaders are focused on creating, building and strengthening relational trust and
positive capabilities in others, to which Jones (2009) asserts is an admirable goal that
supports the desires of followers. Authentic leaders whose behaviors are transparent, ethical,
credible, and well intentioned (Harris, 2011) contribute responsively to the “eudaemonic
well-being of leaders and followers” (Avolio & Gardner, 2005, p. 317).
According to McMurray (2010, p. 21) authentic leadership engages a relational
process which “unites diverse individuals committed to a just common good through shared
experiences in a spirit of caring and social responsibility”. In reviewing authentic leadership
from a relational perspective, Eagly (2005) posits the focus moves beyond one’s relationship
with self and considers an active dynamic and evolving process with others (Harris, 2011).
Relational authenticity represents an integral component of authentic leadership and the
process of developing authentic leaders (Avolio & Gardner, 2005; Eagly, 2005). Citing the
work of Rosener (1990), Goodsell (2010) purports contemporary authentic leaders are
continuously learning to lead by collectively embracing and supporting each other’s
experience. In a gradual progression, authentic leadership engages an evolving application
that seeks full comprehension on how authenticity relates to leadership, followership, leader
and follower relationships and subsequently positive organizational climates and outcomes
that promote and sustain authentic performance (Brennan, 2010). Authentic leaders integrate
their leadership role into their own concept of self and possess a clear sense of personal
values and convictions (Shamir & Eilam, 2005). Further, authentic leaders are innately
driven by their passion versus externally directed influences, and these leaders have a high
congruence between their ideals and actual self (Anderson, 2005; Ceri-Booms, 2010).
Relational authenticity advances significant attention to the various facets of
inclusion, engagement, commitment, positive social exchanges, and trust (Avolio & Gardner,
2005). Through increased self-awareness, self-regulation, and positive modeling, authentic
leaders develop authenticity in followers and foster solid relationships (Avolio & Gardner,
2005). Genuine behaviors characteristically attribute to followers’ conscious distinctions
between postured inauthenticity and authentic behaviors (Verbos, Gerard, Forshey, Harding
& Miller, 2007). When these activities are done well, leaders’ and follower’s experience
eudaemonic well-being (e.g. happiness “personal expressiveness, self-
realization/development, flow experiences, self-efficacy/self-esteem”) which evolves into a
conjoint focus on achieving sustainable and authentic performance (Avolio & Gardner, 2005,
p. 318). According to Shamir and Eilam (2005) authentic leadership, similar to other
positive leadership approaches, represents a relational-oriented model wherein both leaders
and followers play an integral role in the authentic leadership development process (Harris,
2011). Thus, to thoroughly define authentic leadership, Shamir and Eilam (2005) introduced
the construct of authentic followership, which is achieved by “followers who follow leaders
for authentic reasons and have an authentic relationship with the leader” (p. x). Gardner and
Schermerhorn (2004) argue authentic followership “mirrors the developmental processes of

SOBIE 2014
186
authentic leadership and is characterized by heightened levels of followers’ self-awareness
and self-regulation leading to positive follower development and outcomes” (p. 322).
Advancing the work of Cameron, Dutton and Quinn (2003), Verbos et al. (2007)
suggest positive organizational scholarship (POS) as an application of positive consciousness
at the macro or organization level. This practice of positive psychology concentrates on
human functioning at the positive end of the psychological spectrum (Verbos et al., 2007).
The process engages such non-clinical relationship-building concepts as flourishing, hope,
optimism and subjective well-being and affords a more friendlier approach to psychology
than the disease-based model (as cited in Seligman & Csikszentmihalyi, 2000) that studies
pathology and repair (Verbos et al., 2007). Dissimilar from other leadership approaches,
Chen (2010) purports authentic leadership incorporates the essences of both macro
(organization and system level analysis) and micro (individual or leader-follower
relationships) levels of management. At the macro level, authentic leaders are focused on
moral and ethical behaviors as the business code of conduct (Chen, 2010). At the micro level,
(as cited in Avolio, 2007) and through self-awareness, authentic leadership behavior
produces a substantial difference in the workplace through encouraging followers to build
connections and experience personal meaning at work (Chen, 2010).
According to Ryan and Deci (2000) and Walumbwa et al. (2008) authentic
organizational leaders who are cognizant to abide by their true beliefs will motivate and
cause commitment from followers. By means of strong authentic relationships that are more
powerful and lasting when the leader is transparent and personal experiences, followers are
encouraged to imitate self-awareness, transparent and authentic behaviors (Chanchal, 2009;
Chen, 2010). Gardner and Schermerhorn (2004) further elucidate that through the ongoing
process of developing authentic leaders, both leaders and followers are engaged in gaining
self-awareness and establishing open, transparent, trusting and genuine relationships, which
can be shaped and impacted by planned interventions. Henceforth, authentic followers are
caused to exhibit “internalized regulatory processes, balanced processing of information,
relational transparency, and authentic behavior that parallels what is described as
characterizing authentic leaders” (Gardner & Schermerhorn, 2004, p. 274). Gardner and
Schermerhorn (2004) clearly differentiate and define authentic leadership development as a
very complex process that could be broadly labeled as “life long program” (Harris, 2011).
Walumbwa et al. (2008, p. 104) purport authentic leaders are “anchored by their own deep
sense of self (self-awareness) … know themselves and remain true to their values”.
From a global perspective, Hofstede (2001) asserts organizations within a culture are
most impacted by the dimensions of power distance and uncertainty avoidance. Cultures with
a high power distance show an acceptance of centralization of leadership and autocratic
leadership, while those with a lower power distance show an acceptance of decentralization
and participative leadership, with participation initiation by subordinates evident at very low
levels (Moore, 2007). Badaracco (1992) accredits Barnard (1938) with conjecturing the idea
that leader authenticity emerges during periods of moral outrage against the corporate world.
Barnard (1938, p. 83) defines leadership as “the quality of the behavior of individuals
whereby they guide people or their activities in an organized effort” (Schabram, 2009, p. 15).
Given the current global state of economic disasters existing in most parts of the world,

SOBIE 2014
187
including environmental catastrophes which have far-reaching business impacts, Avolio and
Gardner (2005) assert people are longing for increased assurance, faith, confidence, and
genuine interactions with others (Harris, 2011, p. 29). Organizations are comprised of levels
and layers of relationships. The relational construct of authentic leadership in organizations is
defined by Luthans and Avolio (2003, p. 243) as “ a process that draws from both positive
psychological capacities and a highly developed organizational context, which results in both
greater self-awareness and self-regulated positive behaviors on the part of leaders and
associates, fostering positive self-development” (Avolio & Gardner, 2005, p. 321). Avolio
and Gardner (2005) hypothesize authentic leadership is one kind of leadership specifically
for a global context.
Constructual Challenges, Consequences and Solutions
Yukl (2010) postulates “a leader’s authenticity is the most prominent aspect of the
theory, and although conceptualized as a continuous variable, it is often discussed in terms of
a dichotomy” (p.426). However, the broadness of definitions by several scholars suggest
individualized and invisible mechanisms as well as complications in quantifying the
construct (Avolio & Gardner, 2005; Yukl, 2010). As Cooper et al. (2005) point out, multiple
conceptualizations and variable processes by which theorists on authentic leadership have
developed, impose even more difficulty with the concept from empirical, theoretical and
practical standpoints. It is broadly postulated that a unified, shared and agreed upon
definition of authentic leadership does not exist (Ladkin & Taylor, 2010; Yukl, 2010;
Gardner et al., 2011).
With deep roots in many disciplines, for example, philosophy, developmental and
social psychology, and even the fine arts, the historical view of authenticity is centered
around one’s relationship with self (Avolio & Gardner, 2005; Liedtka, 2008; Yukl, 2010;
Gardner et al., 2011). While the construct purports individuals utilize personal experiences to
interact with others in accordance to their true selves (Avolio & Gardner, 2005), a
psychological perspective (as cited in Harris, 2011) suggests authenticity is associated with
personality traits and self-identity to which Deci and Ryan (2000), Kernis (2003), Kernis
and Goldman (2005), and Ryan and Deci (2001, 2003) purport is thus grounded in advanced
levels of cognitive, emotional, and moral development (Walumbwa et al., 2008).
While it is theorized that various concepts in the authentic leadership literature may
reflect an association with the positive organizational studies movement (Ladkin & Taylor,
2010), two most distinguishing and crucial components of authentic leadership theory are
postulated by Avolio, Gardner, and colleagues (e.g., Avolio & Gardner, 2005; Gardner,
Avolio, Luthans et al., 2005; Gardner et al., 2005) and include an inherent moral component
and the self-development focus (Walumbwa et al., 2008). Specifically, Gardner, Avolio,
Luthans et al. (2005) and others (as cited in Chan et al., 2005; Eigel & Kuhnert, 2005;
Hannah, et al., 2005; Luthans & Avolio, 2003; May et al., 2003) assert an advanced level of
moral development is compulsory for one to achieve leader authenticity. Gardner, Avolio,
Luthans et al. (2005) advance several definitions, theories, and philosophical explanations as
justification for rejecting the argument that authentic leadership is ethically neutral. These

SOBIE 2014
188
researchers assert that by means of defining authenticity as incorporating self-awareness,
self-regulation, positive self-acceptance, and morality low levels of moral development in
leaders is empirically and theoretically inconsistent with the model (Walumbwa et al., 2008).
Shamir and Eilam (2005) postulate “authentic leadership is based on the life
experiences of leaders and the followers’ abilities to identify with these life experiences”
(Harris, 2011, p. 21). In this view, Shamir and Eilam (2005) contend the life world
experiences of leaders and their associated meaning foster authentic leadership development
versus the ongoing and open development of specific skills or leadership styles (Harris,
2011). Avolio and Gardner (2005) postulate one of the primary differences between their
conceptualization of authentic leadership and the view described by Shamir and Eilam (2005)
is their “intentional disregard for ―the leader’s style or the content of the leader’s values or
convictions” (p. 321). In addition to viewing only positive values orientation as an integral
component of authentic leadership, Shamir and Eilam (2005), Avolio and Gardner (2005)
and Ilies et al. (2005), emphasize the importance of the role of a positive self-concept in the
authentic leadership construct, Avolio and Gardner (2005), as well as Ilies et al. (2005), are
silent on how leaders’ experiences may shape their self-concept (Harris, 2011, p. 28).
While many researchers have developed authentic leadership models that integrate
self-based theories “(e.g., self-awareness, self-regulation, self-knowledge, self-esteem, self-
verification, self-concept clarity, self-certainty, self-determination, self-congruence, self-
consistency, self-concordance, self-expression) and identification processes described by
social psychologists (Leary & Tangney, 2003)” (Gardner et al., 2011, p. 21), Shamir and
Eilam (2005) posit their life-stories approach to authentic leadership supports the leader-
follower relationship building which then supports the follow’s authentication process in
three ways. First, followers evaluate whether the life story is coherent and plausible; second,
they determine whether the life-story effectively exhibits the leader’s traits, values, and
convictions; and lastly, followers assess to what degree the life-story of the leader relates
with their own backgrounds and values. Interestingly, Harris (2011) challenges of this
methodology to authentic leadership by hypothesizing gender, culture and even race
differences of leaders may or may not resonate with others in the workplace. More
specifically the methodology could prove problematic for women leaders, for example,
working in the dominant culture organizations seeking to build authentic relationships
through the life-stories approach, who’s life-stories and associated meaning systems,
different culture, race, background, experiences, and values system may differ greatly or
somewhat, from her followers (Harris, 2011).
Shamir and Eilam (2005), who deliberately omit consideration of the leader’s values
and convictions from their conceptualization of authentic leadership, hypothesize that a
leader can be true to him/herself without reaching extraordinary levels of moral development
or complying with high standards of ethical conduct. According to Walumbwa et al., (2008)
Shamir and Eilam raise the argument of whether authenticity is a good thing in leaders with
dysfunctional personalities. Although these and others scholars (e.g., Sparrowe, 2005) have
questioned whether authenticity is morally good among leaders with narcissistic or otherwise
dysfunctional personalities (Walumbwa et al., 2008), Walumbwa et al. (2008, p. 94) purport
“although people may be true to themselves at a modest level of moral development, Kegan

SOBIE 2014
189
(1982) and Kohlberg (1984) hypothesize they would unlikely be able to possess the capacity
for self-reflection and introspection required for a true understanding of the self (or others)”.
Gardner et al. (2005, pp. 395-396) assert based on characteristics alone narcissistic leaders
throughout history are disqualified from being able to satisfying their definition of authentic
leadership (Walumbwa et al., 2008).
Drawing on the distinct conceptualizations of authenticity theory, Kernis (2003) and
Ilies et al. (2005) propose a concentrated four-component model of authentic leadership that
included self-awareness, unbiased processing, authentic behavior/acting, and authentic
relational orientation. In describing behavioral and attitudinal attributes of authentic leaders
from a life-story perspective, Shamir and Eilam (2005) admits their conceptualization of
authenticity says nothing regarding the content of the leader’s values, in contrast to numerous other
definitions that embrace assumptions of morality. Alternatively however, Shamir and Eilam
(2005) advance a narrower focus within the creation of their definition by asserting “(a) the
role of the leader is a central component of their self-concept, (b) they have achieved a high
level of self-resolution or self-concept clarity, (c) their goals are self-concordant, and (d)
their behavior is self-expressive” (p. 399). Avolio and Gardner (2005, p. 321) postulate four
characteristics of authentic leaders “(1) rather than faking their leadership, authentic leaders
are true to themselves; (2) authentic leaders are motivated by personal convictions; (3)
authentic leaders are originals, not copies; and (4) the actions of authentic leaders are based
on their personal values and convictions”.
From a philosophical purview, authenticity is strongly anchored on moral capacity,
values and ethical choices (Harris, 2011). Ciulla (2004) contends given the profound impact
that leaders exert on the lives of others - for betterment or harm – there is a clear indication
that ethics lie at the very heart of leadership. Progressing the studies of Avolio (2005) and
Kanungo and Mendonca (1996), Walumbwa et al. (2008) suggest a philosophical rationale
stems from the conviction that all efforts to cultivate leaders must focus attention on their
moral development. Walumbwa et al. (2008) postulate impressive empirical evidence suggest
positive consequences that accrue in terms of physical and psychological well-being to
individuals who achieve relatively high levels of authenticity (Deci & Ryan, 2000; Kernis &
Goldman, 2005). Schabram (2009) assert “authentic leaders are those who can lead
subordinates while remaining introspective and aware of their ethical and moral obligations”
(p. 16). With attention drawn to top executives, Barnard (1949) distinguishes between
“personal responsibility” (“an obligation to personally engage in social codes such as abiding
in the law and personal commitments”) and “organizational responsibility” (“a mandate to
morally guide the company internally and in the social context”) and recognizes conflict
theory and the numerous variables between desires and responsibilities (Schabram, 2009, p.
16).
According to Gardner et al. (2007) the initial attempt to formally define,
operationalize and contrast the constructs of leader authenticity and leadership inauthenticity
was conducted by Henderson and Hoy (1983). Citing the research of Henderson and Hoy
(1983), Gardner et al. (2007) suggest leader authenticity encompasses three components “(1)
acceptance of personal and organizational responsibility for actions, outcomes and mistakes;
(2) the non-manipulation of subordinates; and (3) the salience of the self over role
SOBIE 2014
190
requirements” (p. 7). According to Henderson and Hoy (1983, p. 66) salience of self over role
“refers to the tendency to behave in a genuine manner relatively unconstrained by traditional
role requirements. Such a person is viewed as being real and authentic”. Based on their
research, Gardner et al. (2011) postulate its similarity to the theories of authenticity. The
investigation discovered leader inauthenticity comprised of low levels of accountability,
manipulation of followers, and “salience of the role over self” (Gardner et al., 2011, p. 7).
According to Gardner et al. (2011, p. 7) some components slightly overlapped with the
dimensions of authenticity proposed by Kernis and Goldman (2006), there also seemed to be
some confusion with other constructs, for example “abusive supervision” (as cited in Tepper,
2007), “organizational politics” (as cited in Ferris & Kacmar, 1995) and “accountability” (as cited in
Hall, Blass, Ferris, & Massengale, 2004).
In their conceptualization of authentic leadership, Shamir and Eilam (2005) propose
“the journey to authentic leadership is influenced by the relevant meaning the leaders are
attached to their life experiences and ―leaders are authentic to the extent that they act and
justify their actions on the basis of the meaning system provided by their life stories” (p.
396). Harris (2011) purports these researchers distinguished authentic leaders from
inauthentic leaders by the following criteria “(a) the extent to which individuals embrace
their leadership role as an integral component of their self-concept, (b) the degree of values
clarification and behavior integration, (c) the alignment between leaders’ goals and
convictions, and (d) the congruence between their self-concept and their leadership
behaviors” (p. 23).
Implications for Theory, Policy and Practice
Citing the study of Friedman (2006), Harris (2011) proposes authenticity, in
conjunction with integrity and creativity, is one of the three most important capacities leaders
must possess to be successful in 21st century organizations. Characterized as individuals who
possess self-knowledge about their strengths and weaknesses, governed by innate
convictions, and achieve a high level of congruence between espoused beliefs and actions
(George, 2007; Harvey et al., 2006), authentic leaders and followers can make a fundamental
difference in organizations by helping individuals discover meaning and connections at work
through greater awareness, restoring and building optimism, confidence and hope, and
fostering inclusive structures and positive ethical climates (Harris, 2011, p. 20).
Advancing the work of Dirks and Ferrin (2001), it is proposed that authentic leader
behaviors encourage group members’ involvement and participation in the decision making
process and promote the sharing of information is also likely to enhance member’s trust
(Walumbwa, Luthans, Avey & Oke, 2011). Based on theory, research, and practice, the
notion that group trust may contribute to desire outcomes such as citizen behavior and job
performance is clearly supported (Walumbwa et al., 2011). To this end, trust is most likely to
influence group identity as well as performance (as cited in Jones & George, 1998) even in
the face of diversity, because trust perpetuates the free and open exchange of information;
which is likely to result in positive group and team experiences (Walumbwa et al., 2011).
Trusting relationships strengthen the group’s identity and supports goal accomplishment
(Walumbwa et al., 2011).

SOBIE 2014
191
The authentic leader ultimately strives for authentic and sustained performance
beyond expectations in financial, human, social, and psychological aspects of the
organization” (Cottrill, 2011, p. 39). In this pursuit, this leader exhibits performance that
encompasses respecting people, rather than manipulating them, in order to achieve the goals
and objectives of the organization (Gardner & Schermerhorn, 2004). Ideally, authentic
leadership cascades down an organization from the top however, Luthans and Avolio (2003)
suggest authenticity be manifested within and throughout the organization which will
naturally flatten hierarchies and close power distance (Cottrill, 2011).
Shamir and Eilam (2005) argue that authentic leaders are more effective than
inauthentic leaders because they are better equipped to make sound choices based on an
internal source of strength rooted in their personal convictions. However, these personal
convictions according to Shamir and Eilam (2005) are derived from the leader’s experiences
and they demonstrate, through the leader’s actions, his or her vision of leadership. In this
view of authentic leadership, Shamir and Eilam (2005) contend that the life world
experiences and the associated meanings are most significant in fostering authentic
leadership development versus learning specific skills or leadership styles (Harris, 2011, p.
23). Authentic leadership varies in definition by researcher, nonetheless can be broadly
defined as a normative theory that describes an ideal leader for organizations (Yukl, 2010).
Concerned with enhanced organizational performance that naturally implants confidence in
the future of organizational functioning and economic state to which it significantly
contributes (Chen, 2010), Avolio et al. (2004) theorize organizations in general can benefit
from authentic leadership because of a key determinant of organizational commitment.
However, Luthans and Avolio (2003) warns that with few clear guidelines, rules, and or
direction for action, new rules are needed to address construct ambiguities, lack of clarity,
and the vulnerability people and organizations face.
Research Methodology
According to Holloway and Wheeler (2002) qualitative studies permit researchers to
explore actions, viewpoints, feeling and experiences in the depth, quality and complexity of a
situation by means of a holistic framework in an environment that is uncontrolled. The
qualitative methodology encompasses the role of the investigator who then becomes the
mechanism used to determine that appropriate data are collected, evaluated, and subsequently
interpreted (Eisner, 1991). Such a role involves various attempts to ascertain a convergence
of authenticity and corroboration which results in raising the level of integrity of the study
(Eisner, 1991). Taking into consideration the emerging understanding that leadership is
learned through a variety of naturalistic mechanisms, the works of Bryman (2004) and
Conger (2004) purport only through the rigor of an exhaustive qualitative approach can the
situated lived experience of leadership be truly revealed (Shamir & Eilam, 2005; Kempster &
Cope, 2010). Qualitative research methodology permits researchers to experience confidence
in its design as well as assurance in the data gathered (Eisner, 1991). Of the four common
approaches within qualitative research, phenomenology, grounded theory, ethnography,
historiography, this investigator deemed phenomenological methodology as being the best
approach for this individual level of analysis to obtain rich thick data.

SOBIE 2014
192
While Smith and Eatough (2006) reason phenomenology involves a comprehensive
examination of the respondent’s life-world, the processes of interpretative phenomenological
analysis (IPA) further deepens the scrutiny into how respondents make sense of their peculiar
and collective world, and divulges the meanings those particular experiences, events and
activities hold for them personally (Smith, 2004). A two-stage interpretation or double
hermeneutic process is occupied to intellectually connect style to “hermeneutics and theories
of interpretation” (Smith, 2004, p. 53). Smith (2004) asserts “IPA has a theoretical
commitment to the person as a cognitive, linguistic, affective and physical being and assumes
a chain of connections between people’s talk and their thinking and their emotional state” (p.
54). This qualitative study uses the principles of IPA to answer the research questions. The
processes of IPA reflect a commitment on behalf of the investigator to understanding the
deeper personal perception or account of an object or event, as opposed to merely attempting
to produce an objective statement of the object or event itself (Smith & Eatough, 2006).
The goal of qualitative research is not to yield positivist or scientific results as in
quantitative research, but to understand the world more deeply from the various perspectives
of those in it (Merriam, 2009). As such, unlike objective statistically relevant quantitative
data, replication is a component that probably cannot occur without precision within the
qualitative methodology (Merriam, 1995). With this understanding, replication of the realism
paradigm may not yield same or similar results, but rather different interpretations of the
same phenomenon (Merriam, 1995). Further, Lincoln and Guba (1985, p. 288) elucidate
instead of reliability in qualitative research, the investigator should be most concerned with
“dependability” or “consistency” and must ensure that the “results of a study are consistent
with the data collected” (Merriam, 1995, p. 56). Thus, the role of the researcher is of extreme
importance in a qualitative design utilizing interviews are used for data collection. In
qualitative research, Seidman (1998) purports it is imperative that face-to-face and
transcribed interviews, observations, documentation review, etc. are meticulously evaluated
to highlight elements that are of particular interest to the research.
Research Design
The research design involved face-to-face interviews facilitated by open-ended
questions, and thereby provided the opportunity for each respondent to openly elucidate their
innate, personal, specific and unambiguous ideas (Bernard & Ryan, 2010). Merriam (1995,
p. 54) posits the realism paradigm postulates a reality that is “constructed, multidimensional,
and ever-changing; there is no such thing as a single, muted reality waiting to be observed
and measured”. Thus in conducting qualitative studies, Seidman (1998) contends data
collection would never occur under optimal conditions but rather the uncertainty of natural
settings (Gall, Gall, & Borg, 2003). Here, the value of the information received in qualitative
research is unmistakably correlated to the proficiency and disposition of the researcher
(Patton, 1990) as it all boils down to the researcher’s interpretation of someone else’s
deduced or understood reality (Merriam, 1995). In order to be assured that the design was
appropriate and would stand the test of thoroughness, the researcher upheld the Research
Standards for Human Subjects by initiating and assuring accountability to trustworthiness,
rigor, and uniformity (Lincoln & Guba, 1985). Generally, interview-driven studies utilize

SOBIE 2014
193
open-ended questions and emphasis is placed on the meanings of the proceedings or
experiences revealed (Rubin & Rubin, 2005).
According to Golafshani (2003) despite the various schools of thought regarding the
applicability of validity to qualitative research, it is still realized that qualifying checks and
measures are needed regardless of methodology. In exploring the significance of rigor in
qualitative research, Davies and Dodd (2002) distinguish the application of rigor between the
methods by asserting “accepting that there is a quantitative bias in the concept of rigor, we
now move on to develop our reconception of rigor by exploring subjectivity, reflexivity, and
the social interaction of interviewing” (p. 281). Seidman (1998) elucidates qualitative inquiry
compels the researcher to follow a reasonable, consistent, and credible course of action that
encompasses quality, rigor, and trustworthiness to ensure data received are methodically well
documented. Then and only then is trustworthiness maximized which may lead to the
replicability of the analysis (Golafshani, 2003). The internal validity of the study was a
cognizant concern and established through the use of triangulation.
Guion, Diehl and McDonald (2002) assert validity, in qualitative research, pertains to
whether the conclusions of a study are true, if such truth precisely reflects the circumstances,
and if a sense is attained that the research inferences are supported by the evidence.
Triangulation is a methodology utilized in the rigor of realism paradigms to establish and
verify validity by examining research questions from various perspectives (Guion et al.,
2002). The benefits of triangulation include “increasing confidence in research data, creating
innovative ways of understanding a phenomenon, revealing unique findings, challenging or
integrating theories, and providing a clearer understanding of the problem” (Thurmond,
2001, p. 254). In the face of these benefits, Patton (2002) warns a common misunderstanding
is that the goal of triangulation is to reach consistency across data sources or methods.
According to Guion et al. (2002) due to the comparative strengths of the different
triangulation approaches, inconsistencies are most likely. Thus supporting Patton’s (2002)
opinion, Guion et al. (2002) postulate such irregularities should not be perceived as abating
the evidence, but rather as “an opportunity to uncover deeper meaning in the data” (p. 1) .
With regards to reliability, Merriam (1995, p. 55) asserts “scientific notion of
reliability assumes that repeated measures of a phenomenon (with the same results)
establishes the truth of the results”. In qualitative research where the human element is
involved, measurements and observations can be repeatedly wrong (Merriam, 2009). To this,
Seidman (1998) emphasizes that the interview should be conducted in a systematic fashion to
the best of the researcher’s ability, even if the environment (that the interviews were being
conducted in) is deemed unstable or not the most ideal. In this study four respondents were
observed in their work environment for a minimum of three hours. Due to the issue of time,
the researcher could not observe the three remaining respondents. Thus, observation data
were not analyzed for this investigation and the data collection methodology consisted of one
technique, a face-to-face interview.
With a goal to understand particular aspects of the authentic leadership phenomenon
in depth, as opposed to whether or not the findings are the general truth of the masses,
Merriam (1995) apprises of three unconventional notions of generalizability that are
SOBIE 2014
194
compatible with the philosophical traditions that govern qualitative research. Concrete
universals (Erickson, 1995) postulate that all situations convey insights that surpass the
situation from which they originally emerged. Merriam (1995) posits concrete universals
determine how humans make sense of their life experiences and how new situations are
handled. Human beings will take the learning from one situation and generalize it by
applying existing knowledge to other similar situations (Merriam, 1995). Reader or user
generalizability is the determination of individuals in a situation to measure the extent of
which findings from an empirical investigation can be applied to their situation or not
(Merriam, 1995). This study examines each respondent’s concrete universals as a way of
measuring how experiences are generalized to various real life situations.
Seidman (1998) speaks to the issue of trustworthiness and legitimacy in empirical
research and suggests an explicit structure of the interview process should facilitate the
process to determine legitimacy. Specifically, Seidman (1998) asserts as long as the
researcher (and or interviewer) and the respondents are in agreement as to the composition of
the dialogue, then the process ultimately possesses integrity which will contribute to the
validity of the investigation. To demonstrate an attempt to preserve interpretive validity of
the study, member-checking was conducted. Member-checking is the process whereby
verbatim documentation and tentative interpretation of respondent data is submitted to the
respondent for plausibility and confirmation the document reflects their precise intent
(Merriam, 1995).
As another way to ensure validity, data source triangulation was established by
utilizing primary, secondary, and tertiary foundations of data (Denzin, 1970; Guion et al.,
2002). These face-to-face interviews were conducted with respondents representing four
types of organizational settings which constitutes the establishment of environmental
triangulation that tests if changed environmental factors have any significance on findings
(Patton, 2002). Selected by convenience sampling, three respondents were identified by the
investigator as authentic leaders and these individuals represented the primary foundation of
data for this study. Each primary level respondent was asked to identify an authentic leader
that s/he knew to participate in the study and represent the secondary foundation of data and
each secondary level respondent was asked the same. A total of seven respondents,
representing four types of organizations, participated in the study at various times and at
various locations. Data source triangulation supports the strength of data set by providing
breadth and depth into understanding various perspectives of the phenomenon being studied
(Merriam, 1995), and thus facilitates the researcher’s ability to make sense of data and
information received (Patton, 2002).
Role of the Researcher
The researcher in qualitative research is the primary instrument for data collection
and analysis. In this modality, data are mediated through the human instrument rather than
through some inanimate inventories, questionnaires, statistical softwares, or computers (Guba
& Lincoln, 2005). The specific characteristics that differentiate the human apparatus from
data collection instruments are (1) the qualitative researcher is receptive to the context and
can adjust research techniques to the surroundings (2) s/he studies the context as well as

SOBIE 2014
195
respondent (3) s/he expands data to include nonverbal communication, and (4) s/he processes
data immediately, elucidates and recapitulates as the study progresses, and can explore
deeply into anomalous responses (Guba & Lincoln, 2005). Due to the level of direct
involvement a scholar has in qualitative research design (as cited in Husserl, 1931),
Moustakas (1994) purports it is most significant that qualitative researchers bracket their
thoughts, prior philosophies, and any other suppositions about the phenomenon being studied
to eradicate possible biases that could invalidate the research.
The researcher entered into this process with a belief that authentic leadership is
merely a theorized concept with no significant data supporting its existence in the real world.
This bias is based on direct and indirect witness of what seems to be a large display of
corruption across all genres of organizations over the recent years. This bias had to be
consciously forced aside to allow the literature to assist in identifying three primary level
respondents for the study.
Protection of Participant’s Rights
Respondents were initially contacted by telephone for an introduction and or
discussion that explained the research project, information as to why they were identified as
authentic leaders and selected to participate in the study, and to obtain initially their verbal
consent and agreement to participate. Upon receiving verbal consent and agreement,
interviews and observation sessions were scheduled and the Research Participant
Information and Consent Form (Appendix A) was emailed to each respondent. The
information and consent form provided an overview of the study and delineated specific
procedures (e.g., confidentiality policy, use of data, disseminating and storing of data, contact
information, and university information) that would be carried-out by the researcher. Based
on the information in this document, respondents were offered the opportunity to formulate
questions regarding the research project that would be answered by the researcher at the
onset of their interview. A signed Research Participant Information and Consent Form was
collected from each respondent acknowledging an understanding of the processes and
agreement to the procedures.
Sampling
Moving away from broad objective overviews, this study attempts to understand
seven independent personal experiences, perceptions, and interpretations engaged in the
practice of authenticity. Patton (1990) postulate one of the most common types of a
nonprobability sample is called a convenience sample – not because such samples are
necessarily easy to recruit, but because the researcher uses specific individuals rather than
randomly selecting from the entire population. This qualitative interview-driven study
conducted a process for selecting respondents that were identified by the literature, the
researcher, as well as the study respondents as authentic leaders, thus establishing a study
sample from a position of minimum bias, and is genuine and trustworthy.

SOBIE 2014
196
The researcher acquired an initial convenience sample of three executive-level
professionals, one male and two females, constituting the primary foundation of data, who
were between 49 and 70 years of age, had a minimum of ten years of executive leadership
experience, and are currently employed in a corporate, educational institution or government
organization.
This primary group of respondents was selected and contacted directly by the
investigator between June 20, 2013 and June 23, 2013. At this time each respondent was
verbally informed about the research, who then was asked to provide verbal consent and
permissions to progress the scheduling of interviews and observation sessions. Prior to the
scheduled interview and observation sessions, respondents were emailed the Research
Participant Information and Consent Form (see Appendix A) to allow them the opportunity
to formulate questions they might have regarding the study, research process, anonymity, etc.
The secondary and tertiary levels respondents were unknown individuals to the researcher
and identified by a study respondent. Initial notification was made by telephone by the
referring respondent to introduce the researcher, research project and solicit consent to
participate.
After receiving verbal consent from the secondary and tertiary level respondents,
interview and observation sessions were scheduled, and the information and consent form
was emailed by the researcher. Secondary and tertiary level respondents were all female,
ranging in age between 41 and 53 years, with a minimum of ten years in concurring
leadership and followership functions at a nonprofit organization. A confirmation reminder
of the interview was always emailed two days prior to the scheduled interview and
observation sessions. All interviews were completed by July 23, 2013.
Instrumentation
As is common in qualitative research, all survey questions were open-ended and
based predominantly on the authentic leadership models of Avolio and Garner (2005),
Gardner et al. (2005) and Walumbwa et al. (2008) and others. The principles of IPA inspire
deeper questioning processes that are concerned with accurately understanding what life and
work is like from the perspective of the respondent by endeavoring a figurative walk in the
respondent’s shoes (Smith, 2004). Due to the particular subjective and exposing nature of
the authentic leadership phenomenon, interview questions were deemed to be constructed in
a manner that allowed respondents time to articulate their viewpoints in a thorough and
complete way. The research design utilized probing, clarifying and elaboration methods as
necessary in order to qualify and specify answers substantively.
Protocol questions
Based on the theoretical constructs of Avolio and Garner (2005), Gardner et al.
(2005), Walumbwa et al. (2008) and colleagues 25 survey questions were divided into four
areas of focus, (1) Leader self-awareness, (2) Relational transparency, (3) Balanced
processing, and (4) Internalized moral perspective. The researcher believes that pursuit into

SOBIE 2014
197
these areas will facilitate a deeper understanding of the authentic leadership phenomenon and
provide answers to the research questions.
Interview Survey Battery
I. Leader self-awareness
1. Define the Ancient Greek admonition, “To thine own self be true…”
2. Identify three areas of strength and how each strength is used to influence those you
interact with and or lead.
3. Describe a past experience of self-exposure.
4. What do you think others learned about you?
5. Specify what you learned about yourself.
6. Identify three areas of weakness and how each weakness is revealed to those you
interact with and or lead.
7. Name and explain two elements in your self-regulation plan.
8. What strategies do you use to monitor your own developing constructions (i.e.,
progressive subjectivity) and how do you track these processes of growth, digression,
development, and change?
II. Relational transparency
9. Empower or motivate… Choose your preference. Explain.
10. Describe how you practice transparency amidst those you interact with and or lead.
11. How do you engage others? Or, how do you incorporate the thoughts, perceptions,
feelings, concerns, assertions, and experiences of those you interact with and or lead?
12. What methods do you use to ensure the constructions of individuals that you interact
with and or lead are presented, clarified, and member-checked in as balanced a way
as possible?
13. How do you minimize displays of inappropriate emotions without appearing fake,
irrational, or of distorted self?
14. Which is more important to you (a) reinforcing positive outcomes, (b) reducing
negative outcomes, or (c) comprehending the cause of the outcome(s)? Explain.
15. How do you elicit personal commitment from your followers?
16. Name the characteristics, behaviors, and qualities you look for in your/a leader?
III. Balanced processing
17. Could a narcissistic leader or leader with another dysfunctional personality disorder
satisfy the requirements of an authentic leader? Explain.
18. Dissect your step-by-step process for making sound decisions and explain how this
method impact those you interact with and or lead.
19. How does your concrete universals help you facilitate change? Apply to self and
others.
20. What is your process for dealing with resistance?
IV. Internalized moral perspective
21. Moral manager or moral person… Choose your preference. Explain.
22. Are you at the beginning stage, median or advanced level of moral development?
Explain.
23. What governs your conduct? (A) Internal values (B) External inducements and/or
threats (C) Social expectations (D) Rewards. Explain.
24. Explain the impact your inner drive has on your behavior integrity (or level of
consistency between values and actions).

SOBIE 2014
198
25. Describe the moral perspective process or meaning system that guides your decision-
making.
Data Collection
According the Strauss and Corbin (1998, p. 11) a qualitative research methodology is
a “nonmathematical process of interpretation, carried out for the purpose of discovering
concepts and relationships in raw data and then organizing these into a theoretical
explanatory scheme”. Through the IPA process, the role of the qualitative researcher is
transformed into a dynamic process that facilitates attempts to delve deep into the
respondent’s subjective world (Smith, 2004). The data were collected through qualitative
phenomenological interviews with seven respondents who were identified as practicing
authentic leaders as postulated by the literature, the researcher or four other respondents.
Respondents were initially asked to allow two – 2.5 hours for the interview and a minimum
of three hours for their observation session.
Five face-to-face interviews were conducted at organization locations and two face-
to-face interviews were conducted in home/work environments. While four respondents were
observed in their work environment for a minimum of three hours, the concern for running
out of time caused the researcher to exclude three remaining observation sessions
respondents. Thus, all observation data were excluded from this study. The data collection
methodology consisted of one technique which comprised of the face-to-face interview.
Face-to-face interviews lasted between 42 and 85 minutes and were recorded on a digital
recorder.
This parallel sampling design encompassed three foundations of data. The first level
involved a face-to-face interview with three respondents, constituting the primary foundation
of data. These primary level respondents were previously known to the investigator and were
specifically selected to participate in this study because an exhibition of leadership
characteristics and behaviors that, based on the literature, classified them as authentic
leaders. At the onset of each interview, respondents reviewed and signed the Research
Participant Information and Consent Form, were given the opportunity to ask questions
regarding the study, were verbally informed of their rights (e.g., right to stop the interview at
any time, right to not answer a question, right to ask for clarity, right to contact the
university, right to anonymity, etc.), and then each respondent was asked for verbal approval
to record the session before proceeding.
According to Onwuegbuzie and Leech (2007) there are multiple aspects of debriefing
interviews and observations and/or assessing for their completeness to consider. In the case
of this study, the analysis stage began immediately at the end of each interview to allow the
respondent to provide feedback on the process itself that would also be analyzed to ascertain
areas of agreement as well as areas of divergence (Merriam, 2009). Utilizing the experience
they had just engaged in, or their concrete universals, each respondent was also asked to
identify an individual they deemed to be an authentic leader to participate in the study as a
subsequent level respondent. As a result of this parallel sampling design, secondary and
SOBIE 2014
199
tertiary foundations of data comprised of respondents who were not previously known the
researcher.
After collection, a process Smith and Eatough (2006, p. 338) suggest is a “narrative
account of the interplay between the interpretative activity of the researcher and the
participant’s account of her experiences in her own words” is the formal process of this stage,
data were transcribed into an interview verbatim document and seven respondents were
emailed a copy for review, revisions and or approval that the document reflected their
interpretations, perceptions and intentions. Due to time constraints, the investigator allowed
for five days, upon receipt via email, for respondents to member-check their respective
document. The investigator received member-checked verbatim documents between three
and seven days after initial receipt. There were no misinterpretations, on behalf of the
investigator, on the document(s) and thus, no revisions were required. Member-checking
processes were completed by July 31, 2013. Subsequently coding, evaluation of data, and
analysis occurred thereafter.
Data Analysis
Of the seven respondents that were interviewed, all seven conducted a member-
check. Verbatim interview transcripts were originally given to the respondents for review for
accuracy and the determination whether or not any additions, revisions and or deletions were
necessary. All transcripts were verified, accepted and thus, approved by the respective
respondent. From this point multiple readings of the transcribed interviews are performed by
the researcher to recollect, gain appreciation and clarity of the journeys described, understand
the interpretations and perceptions of practice, and re-establish intimacy with the purported
experiences (Senior et al., 2002).
Jack and Anderson (2002, p. 473) posit the strength of a qualitative research design
“lies in its capacity to provide insights, rich details and thick descriptions”. Drawing on and
acclimating to the ideologies of IPA, Smith and Eatough (2006) advance the seminal work of
Hycner (1985) on the phenomenological analysis of interview data (see Table 2) in six
rigorous levels to which all member-checked verbatim documents endured. Qualitative
research software was used to help the investigator manage, shape and make sense of the
abundance of unstructured information, including open-ended survey responses and the
review of the literature. Particularly, NVivo 10 provided the workspace and tools to classify,
sort and arrange data and facilitate the investigator’s ability to examine seven data sets, from
three foundations of data, and identify isolated (e.g., intra) and collaborative (e.g., inter)
themes, glean insights and develop meaningful conclusions in order to answer two research
questions.
NVivo 10 software was utilized to help unify, develop, code, and preserve the data
and keep track of such the large volume of data. Based on the ground-breaking theory of
Hycner (1985), units of meaning are identified in each interview transcription which undergo
a deep scrutiny of to categorize reoccurring themes or consistencies of each respondent for
the development of a “master-theme list” (created from within each interview). NVivo 10
provided a level of depth and thoroughness to the analysis process which assisted

SOBIE 2014
200
significantly in developing word clusters, groups, themes, and interpretation of the data
within each interview and between the seven interview transcriptions. Smith and Osborn
(2008) purport this free textual analysis process allow for highlighting significant
words/wording or phrases. However, while NVivo 10 assisted significantly in the study of
the data, it was still absolutely necessary for the researcher to methodically scrutinize and
reevaluate the data for clarity, accuracy, and conciseness. NVivo 10 software is the storage
facility of the data.
Table 2
Interpreting Phenomenological Data
Process of analysis Level of analysis Description of analysis
Familiarization/gaining
insight
Case review Conducting multiple readings of the
transcribed interviews to recollect, gain
appreciation and clarity of the journeys
described, understand the interpretations and
perceptions of practice, and to become
intimate with the experiences (Senior, Smith,
Michie & Marteau, 2002).
Immersion and sense-
making
Diagnosis of the
case
A “free-textual analysis”, according to Smith
and Osborn (2008) the process allows for
highlighting significant words/wording or
phrases. Based on the ground-breaking theory
of Hycner (1985), units of meaning are
identified from each transcript and then
grouped to identify commonalities. Word
clusters are color coded in the text and used
to identify patterns and themes.
Classification Developing intra-
case themes
In a holistic reflective analysis, Kempster and
Cope (2010, p. 15) assert this process
involves a deep scrutiny of each interview
transcription or case to identify any
reoccurring themes or consistencies of each
respondent for the development of a “master-
theme list” (created from within each
interview).
Pattern recognition Developing inter-
case themes
Five “superordinate themes” are created from
a meta-level analysis across the seven cases
(Kempster & Cope, 2010, p. 15). According
to Easterby-Smith, Thrope, and Lowe (2002)
this type of examination looks for similarity
of experiences and creates links between
accounts. This master-theme list consists of
five significant and reoccurring themes in the
leadership processes and characteristics of

SOBIE 2014
201
seven authentic leaders.
Interpretation/representat
ion
Narrative summary Smith and Eatough (2006, p. 338) postulate a
“narrative account of the interplay between
the interpretative activity of the researcher
and the participant’s account of her
experiences in her own words” is the formal
process of this stage. To ensure a pure
inductive phenomenological approach; all
theoretical propositions were derived from
the data. Citing Cope (2005), “this allows
the data to speak for itself” (Kempster &
Cope, 2009, p. 15).
Explanation and
abstraction
Enfolding the
literature
The produce a theoretical explanation, the
theory-building process enfolded the
literature in the analytical discussion of the
data (Kempster & Cope, 2009). Yanow
(2004) asserts this iterative and comparative
process involves appending or making the
connection between existing theory and the
data (Kempster & Cope, 2009). In doing so,
Kempster and Cope (2009, p. 15) posit the
research is not only phenomenologically
sound but additionally “interpretative and
hermeneutic”.
In closing, bracketing and carrying out a phenomenological reduction, according to
Hycner (1985, p. 281), refers to suspending the investigator’s interpretation and entering
fully “into the world of the unique person being interviewed”. While Hycner (1985)
acknowledges a complete and absolute phenomenological reduction is virtually impossible, it
is suggested that research data, transcripts and recordings, are reviewed several times with a
conscious openness to receiving whatever meanings emerge. To this end, the investigator
should admit and document all presuppositions that s/he are aware of (Hycner, 1985). This
investigator entered this study with several presuppositions that included, (1) questioning
whether authentic leadership really existed; (2) thinking the probability of finding authentic
leaders might be minimal; and (3) because of the subjective nature of the construct, what if
people believe they are authentic when they are not?
Results
An examination of seven leaders representing four types of organizations was
conducted to answer two research questions, (1) identify core characteristics, values,
attributes and/or traits of authentic leadership and, (2) identify the processes, behaviors and
mechanisms leaders use to develop authentically. Through phenomenological unstructured
interview, a questionnaire battery consisting of 25 questions was developed based on the
literature and utilized to gather data leading to a deeper understanding of the authentic
leadership phenomenon as well as an enhanced understanding of how authentic leaders

SOBIE 2014
202
develop. Study respondents were not self-identified but rather recognized by another as
being an authentic leader and thus, were selected by convenience sample. Theoretical
foundation for this research builds on the work of Bruce J. Avolio, William L. Gardner, Fred
O. Walumbwa, Fred Luthans, Douglas R. May and colleagues.
Data tracking
Each interview was recorded by digital recorder and categorized by an interview
number code and date the interview occurred. During the recorded interviews, no respondent
was identified by name, but rather by their interview number code. At the conclusion of the
interview sessions respondents openly expressed their interest in the research and
appreciation for being considered to participate. However, five of seven respondents made a
special request that the recorder stayed on so that their gratitude, appreciation for the
research, and respect for the researcher and the manner in which she conducted the study
could be a part of the record. The respondents were very encouraging and the researcher
expressed her deep gratitude for their time. But the researcher used the five remaining
opportunities to inform respondents just how they came to be selected. The researcher’s
process for selecting respondents was based on the authentic leadership literature. Prior to a
respondent’s recommendation for the following secondary or tertiary foundations of data,
they were asked to review the survey questions and the process they had just experienced.
This method assisted in establishing a study sample from a minimum bias perspective. All
recorded interviews were transcribed and emailed to the respective respondent to be member-
checked. All recorded files were deleted after each respondent provided his or her approval
of their transcribed verbatim interview document. The transcribed interview data are stored
in a password protected file in the investigator’s email and in the NVivo 10 database. All
data will be destroyed after seven years of the initial date of this research study. To ensure a
pure inductive phenomenological approach, all theoretical propositions were derived from
the data. According to Cope (2005) “this allows the data to speak for itself” (Kempster &
Cope, 2009, p. 15).
Results and Findings
All seven respondents were given the option to omit any question they felt was
intrusive and or uncomfortable with answering as the survey battery comprised of queries
that were very personal nature. There were moments of discomfort for almost every
respondent. Comments included, “Oh, my… I have to think about that”, “This is hard…”,
“Give me a moment…”, “Hmmm….”, “…“(silence and deep thought)”…, “…I have to
expose myself here…” or “Wow, that’s really deep”…, however all respondents persevered
through moments of discomfort and answered every question on the interview survey battery.
Research Question #1: Identify the core characteristics, values, attributes and/or
traits of an authentic leader.
There is one interview question (question five) that overlaps and provides a response
to both research questions however, a total of thirteen questions contributed to answering
research question one which is regarding the identification of core characteristics, values,
attributes and /or traits of an authentic leader. The specific interview questions that address

SOBIE 2014
203
research question one are questions: one, two, three, five, six, nine, ten, thirteen, sixteen,
seventeen, twenty-one, twenty-two, and twenty-three. Six of seven respondents discussed
spiritual values being the foundation of how they govern themselves and treat and or behave
with others. All seven respondents spoke about family values and the impact those values
have on how they function in their world and life. Responses included, “…the death of my
Mother at a very early age I think caused my deep spiritual connection…”, “I was raised in
a religious family, so I believe my core characteristics and values are deeply rooted my
Christianity and belief in Jesus Christ…”, “…I’m a Christian, I’m not led by external threats
or inducements, I ultimately have to live with myself and answer to a higher power…”,
“…unapologetically, everything I do, my dealings, my deployment, my relationships, my
behaviors are based on my Christian worldview…”, “…I have a spiritual foundation that
everything I am is built upon…”, “…my parents taught me that there are benefits of being
true to one’s self…”, “…my Mom always said, ‘People will judge you by what you do, not
what you say’…”,”…based on my spiritual values, I must be open and honest with
others…”, “…I was taught to be morally just , and so I refuse to lie and cheat or be
dishonest in any way…even if it means me losing my job…I refuse to be compromised.”,
“…my Parents made us self-evaluate, and then evaluate each other, and then we would
compare notes. Once we were all close or in the teen years, we did that thing about twice a
year. We definitely learned about being true to ourselves and being able recognize our
strengths and learning how to build on weaknesses…”, “...by being transparent with others,
you are modelling for them and at the same time, creating solid relationships”, “…the truth
regarding myself reveals who I am to others…”, “my beliefs and values speak to who I am”.
Seven respondents felt that they were grounded in morality and ethicality. Six out of
the seven felt they were at the median level of moral development and believed that an
advanced level of moral development is not humanly attainable. When asked about
weaknesses, five out of seven respondents referred to being impatient as their major flaw.
Responses included “…impatience is my weakness…”, “… I am very impatient…”, “…I
have to work on being more patient”… “…I like fast, accurate responses…I know I have a
problem with impatience…”, “…point blank…I’m impatient…and I’m working on that…”,
“; while the other two felt “Being overly emotional, I would say is my weakness”, “…you
know the answer to this one…I wear my emotions on my sleeve…”.
Research Question #2: What are the processes, behaviors and mechanisms for
developing authentically?
Thirteen questions focused on identifying processes, behaviors and mechanisms used
by authentic leaders for ongoing authentic development. Those questions precisely were
numbers: four, five, seven, eight, eleven, twelve, fourteen, fifteen, eighteen, nineteen, twenty,
twenty-four, and twenty-five. Every respondent articulated specified stratagems or regulated
processes in which they use to facilitate change and accomplish organizational goals. Three
respondents did not initially feel they had any specified processes, but after talking it though
with the researcher and giving the notion some thought they realized they did. For example,
“…I create To Do lists…”, “…I keep a logs and lists of things that must get accomplished
with their due date…”, “…I bring everyone to the table…every idea is important to the
process…every team member is essential to the process…”, “…I work on relationships with

SOBIE 2014
204
people to allow them to see who I am…I guess my process is to expose who I am so that
people feel safe and free enough to reveal who they are…”, “…I am careful to be consistent
and always follow-through”, “…I show my appreciation… by doing unexpected things, for
example, out of the blue I will buy lunch…it is only a small gesture of my appreciation…”,
“…I lead by example…”, “…one of my main focuses early on was to get to know my team,
each person’s strengths and each person’s weaknesses…my next focus is ongoing…I build on
each person’s strengths and work with them to overcome their challenges…”, “…I want my
followers to see me for who I am…”, “…I am not induced by outside influences…I am
convicted by the values I was raised on...”, “…developing strong relationships is extremely
important to me…”, “…my focus is on empowering others. In doing so you give something to
someone else that you cannot get back… and it should not be expected”…, “…I incorporate
the views of others in my decision making…”.
“Sincere”, “open”, “authentic”, “honest”, “trusting”, “credulous”, and
“straightforward” relationships with others (organizational, societal, personal, spiritual,
etc.) was purported as key and essential to the seven respondents. In descriptions of how
transparency in relationships is practiced, the intra-case analysis across the seven cases
(Kempster & Cope, 2010, p. 15) identified several key words, for example, “trustworthy”,
“motivate”, “honesty”, “leader”, “moral”, “openness”, “freedom”, “fairness”, “real”,
“manage”, “truth”, “engage”, “influence”, “trust”, “teach”, “inspire”, “develop”,
“observe”, and “monitor”. The discussion of processes utilized for minimizing
inappropriate emotions revealed various tactics unanimously involved some kind of self-
removal method of sorts, for example, “… I closed my door to regroup…”, “…I’ll leave and
go for a walk to get myself together”, “…I usually just take a moment in my office…which
quite often includes prayer…”, “…I will call out sick, take a mental health day, to regain my
equilibrium and come back…because I have to come back…”, “…I usually go out to my car
to be alone, and to pull myself back together…”, “…I will use vacation or sick leave if I need
to…”, “…leave…whether it’s for a few moments, a few hours, or a day…”, to avoid displays
of inappropriate behaviors or appearing fake. A superordinate theme, revealed in the meta-
level analysis across the seven cases (Kempster & Cope, 2010, p. 15), is isolation is used as a
tactic used to regain self-control.
Word clusters were color coded in the inter-text analysis and used to identify patterns
and themes within each interview document. After processing the data several times, patterns
started unfolding and emerging themes finally started to become apparent. According to
Kempster and Cope (2010) this inter-text process identifies the most significant patterns and
the most significant themes presenting in each verbatim interview manuscript. In an intra-
case analysis, five “superordinate themes” were created from the meta-level examination
across the seven cases (Kempster & Cope, 2010, p. 15). Easterby-Smith et al. (2002)
postulate this type of examination looks for similarity in experiences and creates links
between interpretations. Such a level of scrutiny progresses a composite description into the
significance and fundamental nature of the phenomenon being studied (Easterby-Smith et al.,
2002).
In discovering the answer to research question one, identify the core characteristics,
values, attributes, and/or traits of an authentic leader, repetitious patterns and themes
formulated around particular characteristics and values found it unanimously imperative to

SOBIE 2014
205
the respondents in this study that authentic leaders must (1) be aware of and true to oneself,
(2) be trustworthy, open, and transparent in relationships with others, (3) walk the talk, (4)
function with grounded morality and ethicality in life and the world, and (5) attend to and
take care of the self. To answer research question two, what are the processes, behaviors
and mechanisms for developing authentically?, repetitive patterns and themes signified
authentic leaders: (1) focus on empowering followers, (2) are openness in relationships to
encourage to same, (3) use lists, schedules, technology, and other devices to maintain
stability, (4) use isolation as a procedure that allows them to regain composure, and (5)
believe morality is the core of life.
Analyzing the data obtained from seven transcribed interviews in the rigor of a meta-
level analysis, five superordinate themes emerged:
1. Transparency. The findings in this research suggest authentic leaders are
individuals who believe in order to lead one must be real, open, and genuine. It
was purported that this level of realness and openness offers others the freedom to
reveal their truths, thoughts, challenges and feelings.
2. Highly structured. The study findings suggest authentic leaders are innately
structured and this deep level of organization governs their behaviors, both
subjectively and objectively. The use schedules, technology, isolation are
examples of how authentic leaders systematically stay on assignment and
maintain or retain balance. “Decision-making”, “facilitating change”, “engaging
followers”, “leading teams”, and “developing staffs” are processes that involve
others which authentic leaders will systematically, consciously and
unconsciously, have step-by-step details for. Further, authentic leaders
consistently monitor their emerging constructions to analytically ensure ongoing
growth, development, and transformation.
3. Morality and ethicality. Findings suggest authentic leaders are moral agents with
an allegiance to upholding high moral and ethical standards. The six of seven
respondents purported, at this time in their life, they are in the median range of
moral development. This stage was emphasized as “under construction”, and
defined as a process that continues to develop as one’s life journey continuously
develops. The majority (all but one) of the respondents felt that the advanced level
of moral development is not humanly attainable.
4. Grounded values orientation. Study results suggest authentic leaders are
grounded family and spiritual values. The values orientation of all seven
respondents was demarcated as “unwavering” and “motivated by personal
convictions and not outside influences” developed by “family”, “parent(s)”, and
“Christianity”. This value system that is postulated as grounded in “fairness”,
“truth”, and “honesty”.
5. Spirituality. The findings in the research study purports authentic leaders are
spiritual beings. Seven respondents informed they have a solid spiritual
foundation. This spirituality is accredited to that which has made them the person
they are, governs how they treat others, directs their behaviors and actions, and
impacts their overall worldview.

SOBIE 2014
206
Chapter 4 includes a data analysis of seven face-to-face in-depth interviews that
queried a survey battery of 25 survey questions, derived from and based on the authentic
leadership literature. The methodology of the analysis was guided by the theories of Hycner
(1985) which supplemented a richness and depth of the interpretation of the data. The
general purpose of the research, in conjunction with finding the answers to the research
questions, was to add to the body of literature. The research findings postulated five themes
which includes: transparency, highly structured, morality and ethicality, grounded values
orientation, and spirituality. Chapter 5 consists of future research potential, general
discussion of the research, and the conclusion.
Discussion
An examination of seven executive leaders, from four different types of organizations
was conducted to (a) understand and identify the core characteristics, values, attributes and/or
traits of authentic leadership, and (b) identify the processes, behaviors and mechanisms that
leaders use for developing authentically. As stated, the data were generated through face-to-
face phenomenological interview-driven method with leaders from corporate, nonprofit,
educational institution, and government organizations who were identified by the literature,
researcher, or a respondent as an authentic leader. The IPA process provided a greater depth
of evaluation which led to a better understanding of the authentic leadership experience
which was then applied to answer the research questions.
Repetitious patterns and themes that were formulated around identifying specific
characteristics and values in authentic leaders suggest these leaders (1) are aware of and true
to the self, (2) are authentic, open, and transparent in relationships with others, (3) walk the
talk, (4) function with high morality and ethicality in life and the world, and (5) attend to,
nurture and take care of the physical and mental self. The repetitive patterns and themes
formulated around behaviors, mechanism and processes suggest authentic leaders: (1) are
focused on empowering others, (2) function with an open and engaging manner, (3) utilize
schedules, technology, and other devices to keep track, (4) isolate themselves to regain
composure, and (5) believe morality is the foundation of life.
Limitations, Conclusions and Implications
As in all research, limitations exist in this study which initially have to do with its
qualitative nature that suggests replication may be difficult to reenact. Another limitation is
regarding the study sample which included six female respondents and one male respondent
or a configuration that by no means recommends generalizability to the larger population.
While Threinen (2009) purports a relative dearth of research on authentic leadership in
organizations (only fifteen studies completed between 2004 and 2007) (as cited in Barling et
al., 2011), this study builds upon the theoretical foundations of authentic leadership, adds an
examination of the construct in a real world organization to the body of literature, and opens
the door for deeper more extensive future study.
Authentic leadership is theorized as an imperatively important leadership, however
the literature seems to have many variants to describing the characteristics and behaviors of
SOBIE 2014
207
authentic leaders. Furthermore, the literature is virtually silent regarding the processes for
becoming an authentic leader, identifying the mechanisms used by authentic leaders or the
methods utilized to develop authentic followers. To this end, future research into the
phenomenon of authentic leadership must investigate the characteristics, traits, attributes,
behaviors, processes and mechanisms of authentic leaders used in the real world setting.
Future studies might also examine how “leaders distil their ‘storied construction of reality’”
to extrapolate meaning that may enrich and serve purpose (Shamir & Eilam, 2005, p. 406);
how authentic leaders select and organize their personal legends in significant and coherent
ways that result in them becoming “authors of their own lives in the sense of creating new
and improved versions of themselves” (Bennis, 2003, p. 334); identify what exactly
transpires for followers to authenticate the leader; and delineate how authentic leadership,
considered to be a solid representative of a stable workforce, functions in a constantly
changing world. Shamir and Eilam (2005) contend authentic leadership does not rely on skill
and behavioral developments at all but rather complete acute awareness of self-concept
which builds from a unique internal compass comprised from implicit beliefs, values and
principles (George, 2009). If this is so, future research might query the processes for
developing and testing the personal meaning system for flaws or discern how authentic
leaders avoid the dangers of power.
In sum, scholars regard numerous frameworks as credible authentic leadership
theories with the potential to prepare organizations all over the world for the unprecedented
challenges of today and in the future. These hypotheses suggest the imperativeness that
future research investigate how authentic leaders may possibly influence various individual
and organizational outcomes (Threinen, 2009). While authentic leadership is related to
cognitions and behaviors not only at the individual level but also at the group or
organizational level, implications for future study could advance leader-follower associations
(as cited in Moore, 2007), organizational environment (as cited in McMurray, 2010),
authentic performance (as cited in Brennan, 2010), authentic organizations (as cited in
George, 2003), integrative model of authentic leadership (as cited in Ceri-Booms, 2010),
quantifying the value of authenticity and balance (as cited in Goodsell, 2010), and expanding
the understanding of authenticity on ethnicity, race and gender (Harris, 2010; Cottrill, 2011).
Since there are gaps in the literature that measure the impact of authentic leader and follower
relationships on organizational outcomes, as well as progress the understanding of how
authentic leaders develop authentic followers, perhaps longitudinal analyses may present a
sound way to examine these characteristics over the long term.
References
Adorno, T. W. (1973). The Jargon of Authenticity. Translated by Knut Tarnowski and
Frederic Will. Evanston, IL: Northwestern University Press.
Aguilera, R. V. (2005). Corporate governance and director accountability: An institutional
comparative perspective. British Journal of Management, 16, S39-S53.
Alban-Metcalfe, J. & Alimo-Metcalfe, B. (2007). Development of a private sector vision of
the (engaging) transformational leadership questionnaire. Leadership & Organization
Development Journal, 28(2), 104-121.

SOBIE 2014
208
Anderson, C. (2005). A qualitative study of the effectiveness of a leadership development
program on community sustainability and the activities that influence community
improvement in the context of sustainable development. ProQuest Dissertations and
Theses, p. 225. Retrieved from http://0-
search.proquest.com.library.regent.edu/docview/305342346?accountid=13479
Avolio, B. J. (2005). Leadership development in balance: Made/born. Mahwah, NJ:
Lawrence Erlbaum Associates, Inc.
Avolio, B. J., & Gardner, W. L. (2005). Authentic leadership development: Getting to the
root of positive forms of leadership. Leadership Quarterly, 16(3), 315-338.
Avolio, B. J., Gardner, W. L., Walumbwa, F. O., Luthans, F. & May, D. R. (2004).
Unlocking the mask: A look at the process by which authentic leader’s impact
follower attitudes and behaviors. Leadership Quarterly, 15, 801-823.
Avolio, B. J., & Luthans, F. (2006). The high impact leader: Authentic, resilient leadership
that gets results and sustains growth. New York, NY: McGraw-Hill.
Barling, J., Christie, A., & Hoption, A. (2011). Leadership. In S. Zedeck (Ed.). APA
handbook of industrial and organizational psychology. Vol. 1: Building and
developing the organization (pp. 183-240). Washington, DC: American
Psychological Association.
Bass, B. M., & Steidlmeier, P. (1999). Ethics, character, and authentic transformational
leadership. Leadership Quarterly, 10, 181-217.
Begley, P. T. (2004). Understanding valuation processes: Exploring the linkage between
motivation and action. International Studies in Educational Administration, 32(2), 4-
17.
Bennis, W. (2003). On becoming a leader. Cambridge, MA: Perseus Publications.
Bernard, H., & Ryan, G. (2010). Analyzing qualitative data: Systematic approaches. Los
Angeles, CA: Sage Publications.
Bhindi, N., Riley, D., Smith, R., & Hanson, J. (2008). Authentic leadership in education: A
cross country reality? Paper presented at Enhancing the Heart, Enhancing the Mind,
New Zealand.
Bjugstad, K., Thach, E. C., Thompson, K. J., & Morris, A. (2006). A fresh look at
followership: A model for matching followership and leadership styles. Journal of
Behavioral and Applied Management, 7(3), 304-311,313-319. Retrieved from
http://0-
search.proquest.com.library.regent.edu/docview/196732400?accountid=13479
Brennan, P. T. (2010). Pursuing success without scandal: Exploring the relationship between
transformational and authentic leadership. ProQuest Dissertations and Theses.
Retrieved from http://0-
search.proquest.com.library.regent.edu/docview/518653228?accountid=13479
Brown, M. E., Treviño, L. K., & Harrison, D. A. (2005). Ethical leadership: A social learning
perspective for construct development and testing. Organizational Behavior and
Human Decision Processes, 97, 117-134.
Ceri-Booms, M. (2010). An empirical study on transactional and authentic leaders:
Exploring the mediating role of trust in leader on organizational identification. The
Business Review (14)2, 235-243.
Chan, A., Hannah, S. T., & Gardner, W. L. (2005). Veritable authentic leadership:
Emergence, functioning, and impacts. In W. L. Gardner, B. J. Avolio & F. O.
SOBIE 2014
209
Walumbwa (Eds.). Authentic leadership theory and practice: Origins, effects and
development, (pp. 3-41). Oxford, UK: Elsevier Science
Chanchal, S. (2009). Exploring "workplace spirituality" as a concept of value for the
contemporary practice of public administration. ProQuest Dissertations and Theses.
Retrieved from http://0-
search.proquest.com.library.regent.edu/docview/305065613?accountid=13479
Chen, C. (2011). The mediating effect of employees' experience of inclusion and the
moderating effect of individual work values on the relationship of authentic
leadership style and organizational commitment. Alliant ProQuest. Dissertations and
Theses. Retrieved from http://0-
search.proquest.com.library.regent.edu/docview/863203879?accountid=13479
Ciulla, J. B. (Ed.). (2004). Ethics, the heart of leadership. Westport, CT: Greenwood
Publishing Group.
Cottrill, K. R. (2012). Antecedents and outcomes of inclusion: Exploring authentic
leadership, organizational climate for ethics, organization-based self-esteem, and
organizational citizenship behaviors. ProQuest Dissertations and Theses. Retrieved
from http://0-
search.proquest.com.library.regent.edu/docview/927909447?accountid=13479
Creswell, J. W. (2007). Qualitative inquiry & research design (2nd
ed.). Thousand Oaks, CA:
Sage Publications.
Creswell, J. W. (2009). Research design (3rd
ed,). New Delhi, India: SAGE Publications.
Dann, P. L. (2008). Emergent leadership models and generative leadership: Research toward
new leadership paradigms in nonprofit organizations. ProQuest Dissertations and
Theses. Retrieved from http://0-
search.proquest.com.library.regent.edu/docview/304838848?accountid=13479
Davies, D., & Dodd, J. (2002). Qualitative research and the question of rigor. Qualitative
Health Research, 12(2), 279-289.
Dealy, M. D., & Thomas, A. B. (2006). Managing by accountability: What every leader
needs to know about responsibility, integrity – and results. Westport, CT: Praeger.
Denzin, N. K. (1970). Sociological methods: A sourcebook. London: Butterworths
Publishing.
Dychtwald, K., Erickson, T. J., & Morison R. (2006). Workforce crisis: How to beat the
coming shortage of skills and talent. Boston, MA: Harvard Business Press.
Eagley, A.H. (2005). Achieving relational authenticity in leadership: Does gender matter?.
Leadership Quarterly, 16(3): 459-474.
Eagly, A. H., & Carli, L. L. (2007). Women and the labyrinth of leadership. Harvard
Business Review, 85(9), 62-84.
Easterby-Smith. M., Thorpe, R., & Lowe, A. (2002). Management research: An introduction
(2nd
ed.).Shoreditch, London: Sage Publications.
Eisner, E. (1991). The enlightened eye: Qualitative inquiry and the enhancement of
educational practice. New York, NY: Macmillan.
Erickson, R. J. (1995). The importance of authenticity for self and society. Symbolic
Interaction, 18(2), 121-144.
Etzioni, A. (1968). The active society: A theory of societal and political processes. London:
Collier-Macmillan.

SOBIE 2014
210
Fields, D. (2007). Determinants of follower perceptions of a leader’s authenticity and
integrity. European Management Journal, 25(3), 195-206.
Gall, M. D., Gall, J. P., & Borg, W. R. (2003). Educational research: An introduction. (7th
ed.). Boston, MA: A & B Publications.
Gardner, W. L., Avolio, B. J., Luthans, F., May, D. R., & Walumbwa, F. O. (2005). Can you
see the real me?: A self-based model of authentic leader and follower development.
Leadership Quarterly, 16, 343-372.
Gardner, W. L., Avolio, B. J., & Walumbwa, F. O. (2005). Authentic leadership
development: Emergent trends and future directions. In W. L. Gardner, B. J. Avolio,
& F. O. Walumbwa (Eds.), Authentic leadership theory and practice: Origins, effects
and development: 387-406. Oxford, UK: Elsevier Science.
Gardner, W. L., Cogliser, C. C., Davis, K. M. & Dickens, M. P. (2011). Leadership: A
review of the literature and research agenda. Leadership Quarterly, 22(6), 1120-1145.
Gardner, W. L. & Schermerhorn Jr., J.R. (2004). Unlashing individual potential:
Performance gains through positive organizational behavior and authentic
leadership. Organizational Dynamics, 33(3), 270-281.
George, B. (2003). Authentic leadership: Rediscovering the secrets to creating lasting value.
San Francisco, CA: Jossey-Bass.
George, B. & Sims, P. (2007). True north: Discover your authentic leadership. San
Francisco, CA: Wiley Publications.
George, B., Sims, P., McLean, A. N., & Mayer, D. (2007). Discovering your authentic
leadership. Harvard Business Review, 85(2), 129-138.
Goffee, R. & Jones, G. (2009). Authentic leadership. Leadership excellence (26)7, 17-24.
Golafshani, N. (2003). Understanding reliability and validity in qualitative research.
Qualitative Report, 8(4), 597–607.Retrieved from
http://www.nova.edu/ssss/QR/QR8-4/golafshani.pdf
Goldman, B. M. & Kernis, M. (2002). The role of authenticity in healthy psychological
functioning and subjective well-being. Annals of the American Psychotherapy
Association, 5, 18-20.
Goodsell, K. (2010). Authenticity and balance in leadership among women executives.
ProQuest Dissertations and Theses. Retrieved from http://0-
search.proquest.com.library.regent.edu/docview/305229620?accountid=13479
Greenberg, L., Rice, L. & Elliott, R. (1993). Facilitating emotional change: The moment-by-
moment process. New York, NY: Guilford Press.
Guion, L. A., Diehl, D. C., & McDonald, D. (2002). Triangulation: Establishing the validity
of qualitative studies. Retrieved from http://edis.ifas.ufl.edu/fy394
Harris, W. W. (2011). Achieving personal and leadership authenticity in the workplace:
Understanding the lived experiences of African American women leaders. ProQuest
Dissertations and Theses. Retrieved from http://0-
search.proquest.com.library.regent.edu/docview/873552962?accountid=13479
Heidegger, M. (1962). Being and time. Translated by John Macquarrie & Edward Robinson.
London: Harper & Row.
Hofman, R. E. (2007). Conscious-authentic leadership in the workplace: Its impact on
employee behavior and specific organizational outcomes. (Order No. 3268246, The
Claremont Graduate University). ProQuest Dissertations and Theses, 178-n/a.
Retrieved from http://0-
SOBIE 2014
211
search.proquest.com.library.regent.edu/docview/304891338?accountid=13479.
(prod.academic_MSTAR_304891338).
Hofstede, G. (2001). Culture’s consequences: Comparing values, behaviors, institutions, and
organizations across nations. Thousand Oaks, CA: Sage Publications, Inc.
Holloway, I. & Wheeler, S. (2002).Qualitative research in nursing. Oxford, UK: Blackwell
Science, Ltd.
Hutchinson, D. S. (1995). Ethics. In J. Barnes (Ed.). The Cambridge companion to Aristotle
(pp. 195-232). Cambridge, UK: Cambridge University Press.
Hycner, R.H. (1985). Some guidelines for the phenomenological analysis of interview data.
Human studies, 8(3), 279-303.
Ilies, R., Morgeson, F. P., & Nahrgang, J. D. 2005. Authentic leadership and eudaemonic
well-being: Understanding leader-follower outcomes. Leadership Quarterly, 16: 373-
394.
Ivancevich, J., Konospake, R., & Matteson, M. (2008). Organizational behavior and
management. New York, NY: McGraw-Hill Irwin.
Jack, S. L., & Anderson, A. R. (2002). The effects of embeddedness on the entrepreneurial
process. Journal of Business Venturing, 17(5), 467-487.
Jones, G. R., & George, J. M. (1998). The experience and evolution of trust: Implications for
cooperation and teamwork. Academy of Management Review, 23(3), 531-546.
Kemmis, S. (1980). The imagination of the case and the invention of the study. In H. Simons
(Ed.). Towards a science of the singular (pp. ). Norwich, CT: CARE.
Kempster, S. & Cope, J. (2010). Learning to lead in the entrepreneurial context.
International Journal of Entrepreneurial Behavior & Research, 16(1), 5-34.
Kernis, M. H. 2003. Toward a conceptualization of optimal self-esteem. Psychological
Inquiry, 14, 1-26.
Kernis, M. H., & Goldman, B. M. (2006). A multicomponent conceptualization of
authenticity: Theory and Research. In M. P. Zanna (Ed.). Advances in experimental
social psychology (Vol. 38, pp. 283-357). San Diego, CA: Academic Press.
Kirkpatrick, S. & Locke. E. A. (1991). Leadership: Do traits matter? Academy of
Management Executive, 5(2), 48-60.
Kliuchnikov, A. (2011). Leader’s authenticity influence on followers’ organizational
commitment. Emerging Leadership Journeys, 4(1), 70-90.
Kretzchmar, L. (2007). The formation of moral leaders in South Africa: A Christian-ethical
analysis of some essential elements. Journal of Theology for Southern Africa, 128,
18-36.
Ladkin, D. & Taylor, S. (2010). Enacting the ‘true self’: Towards a theory of embodied
authentic leadership. Leadership Quarterly, (21), 64-74.
Liedtka, J. (2008). Strategy making and the search for authenticity. Journal of Business
Ethics (80)2, 237-248 Retrieved from http://0-
www.jstor.org.library.regent.edu/stable/25482139
Lincoln, Y. S., & Guba, E. G. (1985). Naturalistic inquiry. Beverly Hills, CA: Sage.
Lofland, J. & Lofland, L. H. (1995). Analyzing social settings: A guide to qualitative
observation and analysis (3rd
ed.). Belmont, CA: Wadsworth
Lorenzi, P. 2004. Managing for the common good: Prosocial leadership. Organizational
Dynamics, 33, 282-291.

SOBIE 2014
212
Luthans, F. & Avolio, B. J. (2003). Authentic leadership development. In Cameron, K. S.,
Dutton, J. E., Quinn, R.E. (Eds.). Positive organizational scholarship: Foundations of
a new discipline. San Francisco, CA: Berrett-Koehlerr
Luthans, F., Youssef, C., & Avolio, B. (2007). Psychological capital: Developing the human
competitive edge. Oxford, UK: Oxford University Press.
Maccoby, M. (2004). The power of transference. Harvard Business Review, 82(9), 76-85.
Mahoney, T. (2009). Exploring authentic leadership: A narrative case study. ProQuest
Dissertations and Theses. Retrieved from http://0-
search.proquest.com.library.regent.edu/docview/305167769?accountid=13479
McMurray, A. P. (2010). Exploring the essence of relational leadership in the role of
university president. ProQuest Dissertations and Theses, Retrieved from http://0-
search.proquest.com.library.regent.edu/docview/288309193?accountid=13479
McMurray, A. J., Pirola-Merlo, A., Sarros, J. C., & Islam, M. M. (2010). Leadership,
climate, psychological capital, commitment, and wellbeing in a non-profit
organization. Leadership & Organization Development Journal, 31(5), 436-457. doi:
10.1108/01437731011056452
Merriam, S. (1995). What can you tell from an N of l?: Issues of validity and reliability in
qualitative research. PAACE Journal of Lifelong Learning, 4, 50-60.
Merriam, S. B. (2009). Qualitative Research: A Guide to Design and Implementation. San
Francisco, CA: John Wiley & Sons.
Moore, E. M. (2007). The impact of leadership style on organizational effectiveness:
Leadership in action within united way of America. ProQuest Dissertations and
Theses. Retrieved from http://0-
search.proquest.com.library.regent.edu/docview/304723158?accountid=13479
Moore, S. (2008). It's not just nice, it's necessary: Authentic leadership in the new economy.
ProQuest Dissertations and Theses. Retrieved from http://0-
search.proquest.com.library.regent.edu/docview/89231395?accountid=13479
Munhall, P. (1989). Philosophical ponderings on qualitative research methods in nursing.
Nursing Science Quarterly, 2 (1), 20-28.
Novicevic, M. M., Hayek, M., & Fang, T. (2011). Integrating Barnard's and contemporary
views of industrial relations and HRM. Journal of Management History, 17(1), 126-
138. doi: 10.1108/17511341111099547
Onwuegbuzie, A. J., & Leech, N. L. (2005). The role of sampling in qualitative research.
Academic Exchange Quarterly, 9, 280-284.
Onwuegbuzie, A. J., & Leech, N. L. (2007). Sampling designs in qualitative research:
Making the sampling process more public. Qualitative Report, 12(2), 238-254.
Patton, M. Q. (1990). Qualitative Evaluation and Research Methods (2nd ed.). Newbury
Park, CA: Sage Publications, Inc.
Patton, M. Q. (2002). Qualitative Research and Evaluation Methods. Thousand Oaks, CA: Sage
Publications.
Peterlin, J., Penger, S., & Dimovski, V. (2011). Authentic leadership as the promising link
between western and eastern management practices: The case of Slovenian company.
International Business & Economics Research Journal (IBER), 8(12), 87-98.
Roche, M. (2010). Learning authentic leadership in New Zealand: A learner-centred
methodology and evaluation. American Journal of Business Education, 3(3), 71-79.
SOBIE 2014
213
Rubin, H., & Rubin, I. (2005). Qualitative interviewing: The art of hearing data (2nd
ed.).
Thousand Oaks, CA: Sage Publications.
Ryan, R. M., & Deci, E. L. (2001). On happiness and human potential: A review of research
on hedonic and eudaimonic well-being. Annual Review of Psychology, 52, 141-166.
Sartre, J. P. (1956). Being and Nothingness. Translated by Hazel E. Barnes (pp. 330-356).
New York, NY: Philosophical Library Press.
Schabram, K. (2009). To thine own self be true: Authentic leadership and managerial
training. ProQuest Dissertations and Theses, Retrieved from http://0-
search.proquest.com.library.regent.edu/docview/807619523?accountid=13479
Seidman, I. (1998). Interviewing as qualitative research. (2nd
ed.). New York, NY: Teachers
College Press.
Senior, V., Smith, J. A., Michie, S., & Marteau, T. M. (2002). Making sense of risk: an
interpretative phenomenological analysis of vulnerability to heart disease. Journal of
Health Psychology, 7(2), 157-168.
Shamir, B. & Eilam, G. (2005). What’s your story?: A life-stories approach to authentic
leadership development. Leadership Quarterly, 16, 395-417.
https://www.courses.fas.harvard.edu/~soc186/AssignedReadings/Shamir-Stories.pdf
Scott, H. G. (2010). Women leaders in protestant, evangelical nonprofit organizations:
Individual perceptions regarding congruity between gender and leadership roles.
ProQuest Dissertations and Theses. Retrieved from http://0-
search.proquest.com.library.regent.edu/docview/861751500?accountid=13479
Silver, G. (2008). A qualitative examination: Ways of leading among non-profit executives.
ProQuest Dissertations and Theses. Retrieved from http://0-
search.proquest.com.library.regent.edu/docview/304319031?accountid=13479
Smith, J. A. (2004). Reflecting on the development of interpretative phenomenological
analysis and its contribution to qualitative research in psychology. Qualitative
Research in Psychology, 1(1), 39-54.
Smith, J.A. & Eatough, V. (2006). Interpretative phenomenological analysis. In G. M.
Breakwell, S. Fife-Schan, S. Hammond, & J. A. Smith (Eds.). Research methods in
psychology (3rd
ed.). Newbury Park, London: Sage Publications.
Smith, J. A. & Osborn, M. (2008). Interpretative phenomenological analysis. In J. A. Smith
(Ed.). Qualitative psychology: A practical guide to research methods, (2nd
ed).
Newbury Park, London: Sage Publications.
Sparrowe, R. T. (2005). Authentic leadership and narrative self. Leadership Quarterly, 16,
419-439.
Stewart-Wherry, H. M. (2012). Authentic leadership, leader-member exchange, and
organizational citizenship behavior: A multilevel analysis. Theses, Dissertations and
Student Scholarship: Agricultural leadership, Education and Communication
Department, Paper 91. Retrieved from
http://digitalcommons.unl.edu/cgi/viewcontent.cgi?article=1091&context=aglecdiss&
sei-redir=1&referer=http%3A%2F%2Fwww.google.com
Stogdill, R. M. (1974). Handbook of leadership. New York, NY: Free Press.
Strauss, A., & Corbin, J. (1998). Basics of Qualitative Research: Techniques and procedures
for developing grounded theory. (2nd ed.). Thousand Oaks, CA: Sage Publications.
Sudman, S., & Kalton, G. (1986). New developments in the sampling of special populations.
Annual Review of Sociology, 12, 401-429.
SOBIE 2014
214
Threinen, N. (2009). Ways of learning and leadership: Midlife women in communities of
practice. Retrieved from http://0-
search.proquest.com.library.regent.edu/docview/250907590?accountid=13479
Thurmond, V. (2001). The point of triangulation. Journal of Nursing Scholarship, 33(3),
254–256.
Toor, S. R. & Ofori, G. (2008). Leadership for future construction industry: Agenda for
authentic leadership. International Journal of Project Management, 26, 620-630.
Trilling, L. (1972). Sincerity and authenticity. Cambridge, MA: Harvard University Press.
Vella-Brodrick, D., & Page, K. (2009). Positive leadership: Accentuating and cultivating
human resources. Prahran, VIC: Tilde University Press.
Verbos, A. K., Gerard, J. A., Forshey, P. R., Harding, C. S., & Miller, J. S. (2007). The
positive ethical organization: Enacting a living code of ethics and ethical
organizational identity. Journal of Business Ethics, 76(1), 17-33.
Walumbwa, F. O., Avolio, B. J., Gardner, W., Wernsing, T., & Peterson, S. (2008).
Authentic leadership: Development and validation of a theory-based measure.
Journal of Management, 34(1), 89-126.
Walumbwa, F., Christensen, A., & Hailey, F. (2011). Authentic leadership and the
knowledge economy: Sustaining motivation and trust among knowledge
workers. Organizational Dynamics, 40(2), 110-132. Retrieved on August 1, 2011
from ABI/INFORM Global. (Document ID: 2380733661).
Walumbwa, F. O., Luthans, F. Avey, J. B. & Oke, A. (2011). Authentically leading groups:
The mediating role of collective psychological capital and trust. Journal of
Organizational Behavior 32, 4-24.
Wildemuth, B. M. (1993). Post-positivist research: two examples of methodological
pluralism. Library Quarterly, 63, 450-468.
Yanow, D. (2004). Translating local knowledge at organizational peripheries. British Journal
of Management, 15(S1), S9-S25.
Yukl, G. (2010). Leadership in organizations (7th
ed.). Upper Saddle River, NJ: Prentice
Hall.
Zhu, W. (2006). Authentic leadership and follower moral decision intention: Role of follower
moral identity. The University of Nebraska - Lincoln. ProQuest Dissertations and
Theses, 183-183 Retrieved from http://0-
search.proquest.com.library.regent.edu/docview/305274989?accountid=13479.
(305274989).

SOBIE 2014
215
APPENDIX A
RESEARCH PARTICIPANT INFORMATION AND CONSENT FORM
REGENT UNIVERSITY
School of Business & Leadership
Title of Study Understanding the degree authentic leadership is demonstrated in organizations: A multi-level
examination of executive leaders and their followers
Request for your participation
You are invited to voluntarily participate in a research study, conducted by Principle Investigator
Rochelle KP. Thomas. This research project is part of the academic requirements for earning a PhD
degree from Regent University.
Purpose of the study
The purpose of this study is to investigate and measure the extent in which authentic leadership is
demonstrated in three types of organizations - nonprofit, corporate and government – by executive
leaders and their followers. The characteristics of an authentic leader is one who maintains positive
energy, high sense of integrity, moral character and self-discipline, clear purpose, concern for others,
confidence, hope, optimism, resilience, thoroughness in decision-making, and high personal values. It
is believed that this study will provide evidence of the degree in which the authentic leadership
construct is purposefully permeated in the daily leadership and business practices of executive leaders
and their followers.
Why have you been asked to take part?
The authentic leadership concept, comprising of leader self- awareness, relational transparency,
internalized moral perspective, and balanced processing in decision-making, will be measured by an
initial sample of five executive leaders from various types of organizations with a minimum of 15
years of leadership experience. You have been asked to participate in this study because you have
been identified by the Principal Investigator or a research participant as an authentic leader. It is of
belief that you are specifically appropriate to provide valuable data for this study.
What will your participation encompass?
Your participation will initially involve the review of this consent form and any preliminary questions
you might have regarding this study. A face-to-face interview and an observation session will be
conducted with you as the subject. A self-defining autobiographical statement of personal character,
behaviors and attitudes can be substituted for the observation session. You will be asked to
recommend an individual in which you believe performs authentically in their day-to-day leadership
and/or business practice to participate in this study. That person will be contacted by the Principal
Investigator only after you have informed them of your recommendation and have received their
initial consent. Your verbatim face-to-face interview document and observation document (if

SOBIE 2014
216
applicable) will be forwarded to you via email for review and approval. The total time commitment
being requested of each participant is approximately 2 – 2.5 hours.
Risks and discomforts
There are no known risks associated with this research. However, there may be some discomforts
related to the research as interview questions are very personal in nature and query personal character,
strengths and weaknesses, internal processing methods, and handling relationships with others. At any
point in time, if a question feels uncomfortable, you are permitted to request that the question be
withdrawn.
Potential benefits
There are no known benefits to you personally that would result from your participation in this
research. However, in the face of an uncertain and constantly shifting external environment,
institutions and organizations alike must seek to operate efficiently, routinely and effectively through
positive forms of leadership led by key organizational leaders with high levels of integrity, and
consistent values and principles to restore confidence in all levels of organizational leadership. This
research may add to the body of literature and help answer the imperative call for authentic leadership
intervention to propagate an organizational leadership behavior that encompasses practical and
authentic performance standards, moral and ethical leadership and followership development to
influence followers and organizational outcomes.
Protection of confidentiality
Data and information provided by you, the research participant, is confidential. Your identity and
privacy are protected and will never be revealed without retrieving your additional explicit consent.
The information and data you provide is for specified research purposes only and will not be used in
any manner incompatible with these purposes. Specifically, no personal identifiers, data or
information provided for this study will be used for non-research purposes. Your identity will not be
revealed in any publication resulting from this study.
Voluntary participation
Your participation in this research study is absolutely voluntary. You may choose not to participate
and you may withdraw your consent to participate at any time. You will not be penalized in any way
should you decide not to participate or to withdraw from this study. Your decisions about
participating in a study, responding to specific questions, or discontinuing participation will be
respected without question.
Contact information
If you have any questions or concerns about this study, please do not hesitate to contact Rochelle KP.
Thomas, Principal Investigator at cell: 917. 903.0462; home: 631 893-9022; or email:
[email protected]. If you have any questions or concerns about your rights as a research

SOBIE 2014
217
participant, please contact Dr. Emilyn Cabanda at Regent University Human Subjects Review Board
Consent
I have read this consent form and have been given the opportunity to ask questions. I give my
consent to participate in this study.
Participant signature________________________________________ Date: _________________
Participant email address: _________________________________________________________
Principal Investigator signature _______________________________ Date: _________________

SOBIE 2014
218
Decision Support Systems Ruchi Bhade, Kennesaw State University
Abstract
The aim of this research paper is understanding what a Decision Support System
(DSS) is, its types, how do different types of DSS work and their applications. A DSS is an
automated/computerized system that enables the top executives or managers to take correct
decisions at correct time by providing them with a full-fledge summary of analyzed data.
Thus basically, a DSS enhances the decision making process effectively so as to reduce the
tendency of failure by suggesting an array of possible decisions that can be taken by the
managers/respective authorities for an organization to succeed. This paper discusses the
definition, working and applications of different types of DSS like Group Decision Support
Systems (GDSS), Organizational Decision Support Systems (ODSS), Intelligent Decision
Support Systems (IDSS), Web-Based Decision Support Systems (WDSS), Model-Based
Decision Support Systems (MDSS), Self evolving Decision Support System (SEDSS) and
Knowledge-Based Decision Support Systems (KDSS).
Model-Based DSS and Adaptive Decision Support
A model-based DSS focuses on modification and accessing of simulation model. A
model following a particular implementation strategy facilitating decision making is
developed. Users provide the data and factors to this type of DSS which assists decision
makers in taking decisions. This type of DSS for e.g. can be used for the adaptive decision
making of mergers and acquisitions.
Chiu, D.W, Lau, R.K., Liao, S.Y. & Wong, K.F. in their research have mentioned
about the ABIMA model based on the business intelligence technology. ABIMA stands for
Adaptive Business Intelligence for Mergers and Acquisitions. ABIMA is an environmental
scanning model which performs finding the scanning needs, information collection and
analysis, resulting communications; and decision making. This model supports strategic
planning, target selection and valuation, integration post merging, legal matters, finance,
transaction structuring and primary due diligence ( Chiu, Lau, Liao & Wong, 2012).
A quantitative analysis is performed on the desired data by using web intelligence
consequently improving the decision making process. A user starts by initiating a query, i.e.
entering the name of the acquirer, entering target information is optional. User also needs to
provide the time-window i.e. the historical data available through certain number of years. If
user is unable to provide the time-window, then the system takes certain number of years as
default and progresses ahead. This is done for calculating the due diligence. These queries
can be captured from the intranet as well as other search engines and dedicated crawler
programs which are then processed to get an output.
Sentiment analysis is also calculated which is nothing but a qualitative analysis of the
data. This is performed by sentiment analyser which uses sentiment tokens. The purpose of

SOBIE 2014
219
carrying out sentimental analysis is for managing the social, cultural, economic and political
post-implementation issues.
A financial analyser is responsible for analysing the finance of the company and
produce finance results. A target selection and valuation scoresheet is produced by this DSS
using the business mining strategy for each company. The Business Intelligence technology
helps in making corporate investment decisions. The suggestions provided by the DSS to the
top-management are flexible as a DSS can change its suggestions according to the changing
environment by analysing the environment change. In other words it can adapt easily to the
smallest occurring business change and perform accordingly. This highly increases the
chances of making a correct decision.
At the end, a due-diligence scoresheet, a sentiment analysis scoresheet ranking a
single list of firms that are eligible for merger and acquisition, a target selection and
valuation sheet are produced by the DSS which helps the decision makers to take decisions
effectively and lead the organization to success.
Group Decision Support Systems
This DSS is used for developing communication between group members solving a
decision making problem. Thus, this DSS falls in the category of communication-driven
decision support system which allows multi-users to solve problems. The first type of GDSS
is loosely coupled GDSS and the other one is tightly coupled GDSS.
In a decentralized loosely coupled DSS, a multi-layered relationship is established
between the group via any network of an individual DSS. Individual decision support
systems are linked together. But here, each and every individual interacts with the DSS on
the behalf of group. This can be considered as an example for distributed problem solving.
The other desired type of GDSS is having a tightly coupled GDSS. Here, the two
individual DSS interact with each other using the communication component of the GDSS
framework. The Users, individual DSS and the network operating systems combine to form a
GDSS. The communication protocols are developed for enhancing communications between
the components. This enables data exchange between the desired decision support systems.
The factors like network design and topology, error detection, data flow are also taken into
account.
It is also important to know how much and what information has to be transferred
exactly and its privacy. Input-output format flexibility needs to be incorporated. In GDSS, if
some information exchanges are wanted by the participants to be public and some private
(individual to individual), then for this purpose the established group norms are applied
before starting the group decision making process. The communication patterns also are
studied. Implementing this DSS involves implementing the seven layered OLAP model.
The Application layer monitors the information exchange between individual decision
support systems with lot of flexibility. The decision maker is notified of the ongoing data
transfers. A filter processes the user requests if the requests meet all the rules of a pre-defined

SOBIE 2014
220
set and if it doesn’t meet the requirements, then the user is notified of the violation. A
decision maker can modify the communication protocols set by the norm constructor.
The presentation layer acts like a formatter. For, any information exchange taking
place it verifies whether the document needs to be compressed or not and takes care of other
such formatting procedures. The session layer maintains the state of the nodes between which
communication is taking place.
The transport layer looks up to successful end-to-end delivery of messages
considering all kinds of topology configurations. The network layer is responsible for
correctly routing the information to the given destination routing address. This includes
routing all the packets in correct order to the correct destination which means routing the
whole message correctly in sequence. It is also responsible for switching. The priority and
delay operations come under network’s layer control.
Thus, basically the filter receives the protocols. These are then converted to dedicated
group decision algorithms of the group monitor. These requests are transformed in to
commands and these commands finally are executed by the network operating systems.
Web-Based Decision Support Systems
The DSS that provides assistance to top managers in decision making by using the
client web browsers is called a web-based DSS. In the first phase of intelligence, the problem
existing in an organization is identified and an individual user finds and gathers information
from different internal and external sources. Internal sources may be classified as his
personal contacts while external sources are any mass media like television, any experts of
this field and other non-personal contacts. This can be called as the requirement gathering
phase.
Now comes the next phase which is designing phase. In this phase, an effort is made
to solve the existing problems. This is achieved by understanding and analysing the
problems; and then accordingly a strategy is developed to solve these existing problems. This
system is fast, efficient and easy to use; and hence is easily accepted by the decision makers.
Thus, a WDSS is checked for compatibility, ease of usage and for also for reliability. There
are research models that actually check a WDSS for these three features as these are the basic
important features which a WDSS should possess so that there is no chance for a
compatibility issue to arise.
From the set of alternatives produced in the designing phase, the decision maker now
chooses one of the alternatives that he thinks will solve his problems at its best. Now, here
the efficiency or productivity of WDSS is checked. The decision maker will accept any
alternative as best only if he feels that it is reliable and valid. Thus, any user or decision
making authority needs to trust the usefulness or productivity of WDSS. WDSS being a new
concept, it is sometimes hard for the management to trust it. Thus, any user should get
correctly acquainted with using WDSS which will make him trust the system and hence will
help him enhance his decision making skills.
Knowledge Based Decision Support Systems

SOBIE 2014
221
This DSS is basically used to solve problems concerning certain facts, procedures and
rules. It helps identify problems and constantly takes the ability of a decision maker to a
higher level, improving it more and more; and striving to make it more efficient specifically
in an unstructured domain of information or unstructured environment.
The working of this DSS is as follows. The concerned strategic planners first of all
develop a strategy after finding out the existing problems by understanding this DSS with the
help of training sessions using different decision making tools. The files of this training
session are then stored and can be reviewed as per the need.
The operation part involves the whole knowledge base being investigated or being
inquired including each and every folder of the Knowledge Base for a proposed question
describing the existing problem. Knowledge Base comprises of set of Boolean norms which
are in an encoded form. The folder containing an answer to the proposed question is retrieved
from the Knowledge Base but is considered as a valid solution only if it matches the context
of the decision maker, not otherwise. This was the first method of solving problems using
KDSS. The second method is as follows.
The second approach gives the decision making authority an option to investigate or
search the folders that he wishes to according to his will. Each and every folder is not
necessarily being scanned. This is more of an interactive approach wherein the DSS doesn’t
bring forth the recommended folders but gives the user a chance to select a folder of his
choice for investigation. But again, this requires a user to have a complete and good
knowledge of the Knowledge Base as only then it will be possible for him to choose the best
folder from such a large Knowledge Base to make this approach successful.
This DSS can provide two types of output. The first type is as follows, the user is
provided with the detailed response for each question that he has answered. The whole
session is recorded and the list of all the investigated folders is also provided to the users
along with the expert suggestions.
The second type of output is a summary being provided to the user depending on the
questions that are answered followed by the expert recommendations by the DSS. A user can
use the dictionary feature when he finds it difficult to answer the questions asked by the DSS.
A user also can use the feature of justification sequence wherein he can determine the reason
of a particular question being asked by the DSS to him.
The strategic planning process can also be used to determine where an organization
stands in terms of its success or efficacy. Here, an effort is made to find out a large range of a
domain wherein a strategy can be successful to a greater extent recognizing and further
eliminating an unstructured domain; thus leading an organization to a good decision
consequently increasing the scope of success.
These solutions are then compared with the expert opinions to again assure the
correctness of a decision made. This DSS also identifies the crisis situation and tries to
eliminate it by allocating certain required resources to it. A problem can be made dormant or
inactive by this type of DSS again by assigning it with the certain required resources which
in-turn reduces the chances of failure.
SOBIE 2014
222
Organizational Decision Support Systems
The DSS which firstly assess the environment or nature of any organization and based
on it helps make the concerned authority; a decision, is an ODSS. Every organization
possesses a different atmosphere and hence decisions can be made supporting those specific
environments using this kind of DSS.
There are different models that facilitate this type of decision making. The author in
his study has explained four models; namely, the rational model, the political model, the
program model and the garbage model. The most important out of all is the rational model. It
finds out the nature of any organization, information use by each individual and program
assessment with the help of certain predefined procedures. Thus, this model can effectively
produce solutions to the organizational problems by studying as well as analysing the
organizational behaviour (Sprague, 1981).
The political model produces solutions based on the strategies developed by the
strategy development team which results in to the outcomes that are favourable to them. A
decision is made by studying the capital and budget management as well the political
processes that are being carried out in an organization. The garbage model proposes solutions
to the problems arising due to the unstructured domain. The program model supports
decision making process on the basis of scientific programs that are designed to make
decisions. This model help visualize the impact of implementing programs and hence
provides an insight on which program needs to be implemented as per the organizational
behaviour (Sprague, 1981).
Self-evolving Decision Support Systems
This is a new concept that is being studied. A DSS can be called self-evolving if the
DSS itself understands of how and in what it is being utilized, and hence adapts
automatically to the existing organizational circumstances and evolving users on its own.
As explained by the authors in their research, it has the capability to provide a
dynamic user interface and drop down menu hierarchy. This DSS contains a self-
evolutionary mechanism that enables it to do so. This mechanism involves three components.
They are as follows. The first component is the database of the users which displays the
amount of system data used. The second component is having a Knowledge Base that
contains set of procedures or rules and the third required component is a control mechanism
that can control the evolution of the DSS (Jones & Ting-Peng, 1987).
It follows the evolutionary design implementation strategy which gives users the
freedom to participate in the process of system development. It emphasizes the evolutionary
nature of this approach removing the rigidity factor of the decision making process. Human
involvement here is combined or integrated highly with the evolutionary DSS thereby
providing flexibility in decision making. A user here is required to develop a DSS according

SOBIE 2014
223
to his choice and preferences with the help of a designer provided by the DSS. The DSS then,
whenever needed; adapts itself to the user requirements set by the user himself leading to a
high user-friendliness. But for this, it is necessary for the user to possess the required
technical skills and expertise (Jones & Ting-Peng, 1987).
Thus, it concludes that this DSS can be called as a self-evolving Data-Driven DSS as
it possesses certain qualities of the Data-Driven DSS like user flexibility, dynamic system
performing data retrieval and management according to the user’s preferences. It also
performs data filtering, provides drop down menus facility, allowing multiple users to use the
system, automatically adapts to changes in the data; hence performs data manipulation, users
can use data from different sources, meta-data production as well retrieval and the reports
depicting the production results can be viewed.
Intelligent Decision Support Systems
According to the research carried out by the authors, this DSS uses the collaboration
technologies. This includes again the integration of human excellence and an automated
system for making a decision.
This DSS, according to the authors involves three components. The first component is
the Database Management System (DBMS) which is responsible for storing internal as well
as external data. The second component is the Model Base Management System (MBMS)
which produces, stores and keep the models updated as well as maintained for efficient
decision making. The third and the last component is the Knowledge Base Management
Component. This component contains the intelligent DSS structure that provides the decision
maker with the reasoning on choosing a particular decision. It provides explanations and
expert recommendation to the decision makers on which can be a really effective decision
out of the all. This can be achieved by using the artificial intelligence tools (Adla, Laskri &
Soubie, 2007).
Conclusion
This paper concludes with providing an insight on how Decision Support Systems
work and its applications. It concludes leaving the user with the knowledge and insight on
which Decision Support System can be used in which kind of situation thus rendering a high
level of effectiveness.
In today’s competitive world, it has become very important for any organization to
survive the competition and stay in league. An organization ultimately survives on the
decisions it takes as it is the decisions that are implemented giving out the results and hence
understanding as well as using the Decision Support Systems correctly to its maximum
possible extent is of utmost importance when it comes to achieving success. Thus, this paper
wraps up providing the user an insight and information on working and the applications of
various Decision Support Systems.
SOBIE 2014
224
References
Adla, A., Laskri, M., & Soubie, J.L.(2007).A Cooperative Framework for Intelligent
Decision Support Systems. International Review on Computers & Software, 2(4), 292-301.
Chiu, D.W., Lau, R.K., Liao, S.Y., & Wong K.F.(2012). Web 2.0 Environmental
Scanning and Adaptive Decision Support for Business Mergers and Acquisitions. MIS
Quarterly, 36(4), 1239-A6.
George, J.F.(1991).The Conceptualization and Development of Organizational
Decision Support Systems. Journal of Management Information Systems, 8(3), 109-125.
Goul, M., Shane, B., & Tonge F.M.(1986).Using a Knowledge Based Decision
Support System in Strategic Planning Decisions: An Empirical Study. Journal of
Management Information Systems, 2(4), 70-84.
Hsiang, L.W., Shin-Yuan, H.(2012).Factors Influencing User Acceptance of Web-
Based Decision Support Systems. Journal of Computer Information Systems, 52(4), 70-77.
Huber, G.P.(1981).The Nature of Organizational Decision Making and the Design of
Decision Support Systems. MIS Quarterly, 5(2), 1-10.
Jones, C.V., & Ting-Peng, L.(1987).Design of a Self-evolving Decision Support
System. Journal of Management Information Systems, 4(1), 59-82.
Matthias, J. & Tung, B.(1986).Communication Requirements for Group Decision
Support Systems. Journal of Management Information Systems, 2(4), 8-20.
Phillips-Wren, G.(2012).AI Tools in Decision Support Systems: A REVIEW.
International Journal on Artificial Intelligence Tools, 21(2), 1240005-1-1240005-13
Power, D.J.(2008).Understanding Data-Driven Decision Support Systems.
Information Systems Management, 25(2), 149-154.

SOBIE 2014
225
Service Economics – A Brief Look at a New Subject
Harry Katzan, Jr.
Webster University
ABSTRACT
Most commercial, educational, governmental, and social activities in modern society involve service.
The work of professionals in areas such as medicine, law, and education is prototypically service, and
the primary participant is actually a service provider, because service is core to their usual work.
Business, governmental, and educational enterprises essentially provide service, as do most products
and social activities. In fact, approximately 90% of the GNP in developed countries is derived from
service. Service is also a major component of many academic disciplines such as marketing,
management, economics, and of course accounting and information systems. This paper provides a
brief look at the new subject of service economics and takes the view that service is the main driving
force behind modern society, building on the groundbreaking work of Adams, Mill, Jevons, and
Fawcett. It explores how the knowledge of service principles can serve as the operational basis of a
complex civilization.
INTRODUCTION
A service is generally regarded as collaboration between a provider and a client that creates and
captures value for both parties. Both the provider and the client contribute in the interchange and
both benefit, even though the form of participation is diverse and varies between different forms of
service execution. [Katzan 2008] A prototypical example is the relationship between a doctor and
patient that relies on the participation of both persons, since both entities are required in order for the
service to be instantiated. Moreover, a doctor’s service varies between patients and yields different
results, depending on the situation. This characteristic is customary with most service. The entity
supplying the service is known as the service provider and the entity receiving the service is known as
the service client. The domain of service providers includes individuals, teams, products, electronic
systems, groups, and ad hoc units organized to execute a particular service delivery situation.
Similarly, service clients include persons, groups, social organizations, governments, and commercial
entities. In some cases, the object receiving the service is the responsibility of the client, as in child-
care and maintenance work. In this instance, the object receiving the service is known as the service

SOBIE 2014
226
object. A service is often complicated requiring supplementary and subsidiary services, so that a
complex chain of services, called a service system is necessary to achieve a particular result. The
underlying reasons for typical services fall into the following modalities: tell me, show me, help me,
and do it for me. [Maglio 2007] Thus the term “service system” is representative of a wide range of
activities and artifacts, such as a missile system, an educational system, or a medical system. Many
commercial activities, such as airline transportation are based solely on service, and in other cases,
service is only a part of a complicated commercial arrangement, as in vehicle retailing. Many
business firms specialize in providing service. Service design is a field of study in art and design
curricula. Governmental and educational work is a service, and religious groups provide a service.
Military personnel are designated as being in the service. The manufacturing process uses services to
assemble products that effectively supply a service. The ubiquitous use of the term “service” in
everyday communication is so pervasive that the significance of the concept is diluted through
overuse. Even though most social, commercial, educational, and governmental activities are actually
service, most people like to submit to their own intuition when designing and providing service
without knowledge of basic service concepts. They are often surprised when results do not turn out
as expected. Actually, a complete knowledge of the interaction of the various and diverse forms of
service, together with its developmental hierarchies, would require a lifetime of study. [Ferrario 2008,
Jevons 1880]
Derivation of Service Needs
Services are derived from societal needs, such as medical care, fire and personal safety, and
educational assistance. So, how do services in the proverbial sense differ from products that are
purportedly also derived from people’s needs? A service is derived from a specific need and is
created at the point of instantiation, that is, when the service experience actually occurs. A product is
created, on the other hand, from an anticipated need and is created independently of the specific
entities that will eventually use it. Accepting the fact that some products are constructed as special
orders, the majority of products are manufactured beforehand and held until purchase. That said,
products are in fact services, because the use of a product provides a service to the user. A vehicle
that entails transportation provides a service. A famous painting, displayed in a suitable place, also
provides a service to the owner, although its value is totally different, and ordinarily supplies an
intangible benefit.
Varieties of Service
A tangible service is a provider/client event that results in demonstrable value to the service
participants. In people or possession processing service, value is created through the work performed
on behalf of the client by the provider. With information services, the value of the service is derived
SOBIE 2014
227
from the transfer of information form the provider entity to the client entity. The value proposition
for a product is determined from the service it provides, rather then from the intrinsic value of its
specific components. A tangible service is something that is observable in the real world and delivers
results that are utilitarian and measurable.
An intangible service provides an affective value for a service participant through the feeling one
obtains from a service interaction or the ownership of a product. Certain products, such as premium
automobiles, special jewelry, and elegant real estate are typically associated with this category. The
results from intangible service are affective and hedonistic. Often, the education or affiliation of a
service provider supplies intangible value over and above tangible value. Many forms of service
incorporate both tangible and intangible components. [Katzan 2009, Katzan 2008]
Basic Service Science
Service is the prevalent activity of persons and organizations, and yet, very little is known about the
subject. There are no theories, best practices, and no principles of precisely what constitutes good
service. From a business viewpoint, service sustainability has not even been considered in most
instances. People are interested in service, and its academic foundation is known as service science.
It will eventually change the predominant economic focus in developed countries from products to
service. The subject is important to providers and consumers of service, since most service providers,
such as individuals, businesses, governments, and other organizations, are also consumers of service.
The notion of service is straightforward and a conceptual view of the subject matter is easily acquired.
Service is work performed by one person or group that benefits another person or group. Clearly, the
provider and client have differing roles and they need to exchange information to execute the service
event. If one were to consider the interactive component of basic service, it would considered to be a
social activity that is consumed at the point of production. The service provider and the service client
co-produce a service. Thus, service is a process, usually referred to as a service event, characterized
by customer participation, simultaneity, perishability, and heterogeneity. Customer participation
refers to fact that the customer brings an asset to the event and that is the domain within the event
takes place. Simultaneity refers to the unique instance where the service is produced and consumed at
the same time. Perishability denotes that if the opportunity to engaging in the service event by the
provider or client is not taken, then the opportunity is lost. Lastly, heterogeneity specifies that each
service event is unique. [Katzan 2008] A service event cannot be repeated. If it is performed an
additional time, it becomes another service.

SOBIE 2014
228
In the case of business, the nature of service is the same, as in the elementary form, but the scope is
often greater and requires organizational as well as functionary skills. When a business process is
given to an outside party, the activity is called outsourcing, which can occur at the local or global
level. Some firms are in the business of providing services on a broad scale and the various processes
are normally governed by an explicit or implicit service-level agreement.
Service Process and Organization
Service can be viewed from a global level or a local level. At the global level, an organizational
entity that provides a service normally goes through a service lifecycle consisting of service
commitment, service production, service availability, service delivery, service analysis, and service
termination. As such, the service organization can be characterized, as being composed of as a
layered set of activities that constitute a value chain for services, comprised of people, technology,
and organizations. This is essentially a process view of generic services supplied by a governmental
or economic entity, such as a governing body, a business, an institution, or an individual acting in a
service capacity. Service commitment refers to the formal agreement that provides a class of services
to a service audience by a principal or trustee with proper administrative control over the service
domain. The agreement, such as a charter, to provide fire service by a municipality and the
establishment of a health clinic are common examples. The mayor of a city is a common example of
a service principal. Service production pertains to the operational aspects of service provisioning that
encompass service design, infrastructure, availability, quality management, and back-office
processing. The producer is the agent of the principal in a prototypical principal-agent scenario. The
principal and the agent may be the same economic entity or different entities in a distinct service
relationship. The producer is responsible for insuring the resources are available to execute a service,
including those persons charged with actually performing that service. Service availability denotes
the time when a service is available, including initiation and termination dates and times. Service
delivery is the comprehensive class of activities usually regarded as the “service” and is the layer
where the service provider and client come into the picture. The doctor/patient relationship is a good
example of this layer. The service provider, who could have a dual role as a producer, is an agent of
the producer as the primary source of service revenue and is the primary provider of service. Service
delivery normally consists of several inherent services constituting a service value chain. Service
analysis refers to the measurement activities and the determination of value propositions needed to
sustain service operations. Service termination reflects the inevitable consequence of evolving
services where a total service operation has to be retired, because of insufficient activity or realigned
opportunities. [Katzan 2009]

SOBIE 2014
229
BASIC CONSIDERATIONS FOR SERVICE ECONOMICS
In the traditional world of economics, the efficiency of labor, production processes, marketing, and
sales is paramount to a successful and sustainable enterprise. The concepts apply as well to non-
profit organizations as they do to profit-making business, and equally well to education and
government. Everything else being equal, an inefficient worker can extend the length of employment
or provide an opportunity for additional workers. The implication is that capital, needed to sustain
economic activity, is unlimited. With automation, of course, the significance of capital changes.
Fewer positions are needed, and the character of the workplace is improved. Thus, the employers and
employees benefit. In service, the interactions are more complicated in that the initial success of a
particular service, within a specific domain, engenders an increased demand that leads to additional
service provisioning and also a larger client population. Increased service demand should result in
decreased client costs.
Service Economy and Service Economics
Service economy and economics are related terms concerned with the value proposition of a service
and how it is provisioned and consumed. Service economy is the study of the nature of services that
underpin the activities of persons, organizational entities, institutions, governments, and nations. It is
based on derived value that enables one entity to be more successful as a service provider than
another. Service economics is the study of the interactions of service entities that essentially
constitute a service experience. Service economy operates at the general level, and service economics
operates at the detailed level.
A service economy is concerned with how a service is formulated through a life cycle of
commitment, production, availability, delivery, analysis, and termination. Most services adhere to
this life cycle. The service interaction in service economics incorporates activities, primarily based
on the client, that include service acquisition, invocation, execution, and service termination. These
topics will be expanded upon in subsequent pages.
Learning and Applying Service Concepts
It is important to recognize that service is a science, as is chemistry or biology, in the sense that
knowledge of the subject matter increases the ability to provide and consume service. [Jevons op cit,]
There is published information supporting the subject of service science together with characteristic
problems and a wealth of appropriate solutions. People, in general, do not become familiar with a

SOBIE 2014
230
subject until the underlying principles have been exposed. The nature of service should be considered
when any political, financial, or business question arises.
There is a body of knowledge, however, that supports the conjecture that a set of principles governs
the operation of services, and that the information contained therein has a basis in modern
Philosophy. In social constructivism, individuals and groups participate in a perceived reality, and
create an element of knowledge, as espoused by the philosophical doctrine of Equal Validity.
[Boghossian 2006] Equal Validity suggests the notion that other means of knowing exists in addition
to the factual predominance of scientific investigation. As an example of constructivism, consider a
simple wooden chair developed in antiquity. A chair is often made from wood that has been
determined as useful to the purpose. Clearly, wood exists as a natural phenomenon, independently of
its various uses. The precise form and substance of a chair, however, is a socially constructed form of
knowledge that none but the hardened skeptic would deny is a valid form of knowledge. So it is with
service. Service systems are socially constructed forms of interaction wherein entities exchange
beneficial forms of action through the combination of people and technologies that adapt to the
changing level of information in the system. Thus, service is a social reality constructed through a
dynamic process replicated and maintained by social interactions within a service and between
services.
Service economics, and by extension service provisioning and service utilization, is different than
other sciences used to make the lives of individuals more healthy and prosperous. For organizations,
it might be a matter of success or failure. Service economics deals with the value derived from
services, how that value is derived, and how it can be enhanced by modern technology. Certainly,
wealth derived from service provisioning is an important consideration in the availability of service,
but there are other non-monetary benefits to be derived from service, such as success, happiness,
opportunity, and possibly mere existence.
Structural Dynamics of Service
Most services adapt a common structure that essentially determines how the provider and client
interact in order to execute a service process. Ordinarily, the total service process incorporates
several well-known steps that constitute what is commonly regarded as the service: service
acquisition, service invocation, service execution, and service termination. More will be said later
about this service process lifecycle. Clearly, this is a provider view of service. The prevailing
opinion is that the client is involved as a secondary participant. However, what would occur if there
were no clients? Without clients, a doctor is simply a person with a medical degree, and a bricklayer
is someone that knows how to position bricks or similar objects. A client provides a service to the
provider by engaging in the service process as being a receiver of service. The basic idea is that there
is a certain duality in services, wherein the client depends on the provider and the provider depends
SOBIE 2014
231
on the client. We will refer to this phenomenon as service duality. Thus, the common practice of
denoting the client as a secondary participant is not valid in the modern view of service execution.
The provider and the client, in the most general sense regarding service, are on an equal footing.
In many instances, the provider and client are not singular but are groups. A group of service
providers, known as a provider set, is a collection of service systems designed to support a particular
endeavor in its respective domain, such as a university, medical group, or even a newspaper. Each
element in the set provides a specific service to a client. Associated with the provider set is a client
set composed of elements that functions in a complementary manner with provider set elements to
instantiate a service event. A service is thereby an interaction between an element from the provider
set and an element from the client set, represented as a mapping between the sets. Accordingly, the
collection of mappings is known as a service set. It follows that a service collective is a 3-tuple
consisting of a provider set, a client set, and a service set, all of which can interact through an eclectic
platform designed to sustain a unified service system. A unified service system is created when a
client set is combined with the provider and service sets, and the inherent process is called
unification.
Examples of service collectives are commonplace. A university, for example, provides services to
students. The provider set would consist of administrative, student, and academic services. The
students comprise the client set. Similarly, a newspaper consists of sections, such as sports news,
national news, international news, financial news, and so forth. Readers are the clients. In both
instances, not all clients require the use all of the services, and a section of providers do not supply all
of the services.
A service value chain is a progression of activities adopted to materialize a service. Not all service
resources perform functions that are specifically evident in a provider/client interaction. In fact, there
are three major stages in a service value chain: service commitment, service production, and service
delivery. The three stages are collectively referred to as service provisioning. When practitioners
refer to service, they normally intend the service delivery stage.
In many cases, the provider set operates as a connected service system that interacts through shared
information to provide a service. Two forms are clearly distinguished: flow and interactive. In a flow
system, information is passed between service providers in a sequential basis. Operationally adjacent
providers are coupled to provide service delivery, where coupling reflects dependency, as opposed to
cohesion that reflects stickiness. Essentially, one provider performs the initial step in a service
process; a second provider performs a second step, and so forth. In an interactive system, members of
a collection of providers interact on a needs basis to execute a service. Thus, the provider set can be
viewed as a partitioned set in which sections demonstrate coupling or cohesion.

SOBIE 2014
232
Collaboration
In the classic view of service, the roles of the provider and client are not symmetrical. In the most
general sense, and even though the provider supplies a service to the client, and the client provides a
service to the provider by being a client, the roles each entity plays is markedly different. In actuality,
a team of providers may supply the service, and the client may be a singleton. For example, a team of
doctors may service a single patient. The converse is also true, in the sense that is mayor provides
leadership to an entire town. As mentioned earlier, the client provides a reciprocal service to the
provider. This is an example of service duality. Clearly, the question is “Does the mayor provide
service to the town or does the town provide service to the mayor?” It is conceivable that service
duality is a form of exchangeable value in service. [Katzan 2010]
In some instances, a set of service providers collaborates to execute a service. A primary service is
the core service for which the provider and the client interact to produce demonstrable value.
Accordingly, the key person, in a human instance, is the primary service provider, and in all but
exceedingly simple cases, that person has helpers that provide secondary services. A secondary
service is a service that ordinarily does not exist separately as a primary service and plays a
supportive role to a core service. A doctor that supports a surgeon is functioning as a secondary
service provider. It is important to note at this point that the name “secondary service provider”
does not imply capability, but what is actually performed during the execution of a service process.
The notion of a secondary service traditionally encompasses separate functions involved in the
performance the core service process, existing in close physical and temporal proximity. A core
service is dependent upon a secondary service, and the reverse is also true. The cohesion between
core and secondary service processes is high. (See below.) When this phenomenon occurs, the core
and secondary service providers are regarded as collaborating in the service process. Examples of
secondary services are numerous and have a substantial variation. Three instances are the weigh in
and blood pressure checks associated with a doctor’s visit, the acceptance and delivery of garments at
a dry cleaning establishment, and the routine support functions performed in support of an automobile
mechanic.
When two service providers are cooperating to perform a task, or set of tasks, but working
independently as with a couple of masons building a structure, the concept of core and secondary
service processes does not necessarily apply, since the cohesion of the two participants is low.
There are two additional forms of supporting service: facilitating service and auxiliary service. A
facilitating service is disjoint from a primary or secondary service and enables a client to obtain
utility from a service, such as instruction on how to use an automobile or a computer. Another

SOBIE 2014
233
example is a ticket agency that provides access to a tangible event, such as the theatre or an
amusement park. An auxiliary service is independent from a core service and takes place before or
after the core service. A referral event, for example, would be an auxiliary service.
Service Process Lifecycle
It is useful to identify the key events in the operational service, because this is how value is created.
The service lifecycle can be viewed as those activities that exist between service acquisition and
service termination – from both structural and operational viewpoints. From the structural point-of-
view, the set of layered activities incorporate the service commitment, service infrastructure, service
availability, service delivery, and the eventual termination of a service, as delineated previously.
From an operational point-of-view, the layered activities describe service events and incorporate
those transactable actions that constitute the essence of service.
Based on the above definitions, the lifecycle of a service process consists of a loosely defined set of
steps intended to co-create value for complementary service participants. It is useful to conceptualize
a generic lifecycle for domain ontology as consisting of the following steps: Service acquisition,
Service invocation, Service execution, and Service termination. Service acquisition refers to the
process of identifying a service provider with the requisite infrastructure, and its corollary, the
process of attracting clients. Service invocation involves the scheduling and logistics part of the
service process. Service execution entails the actual steps in the service process including
supplementary services. Service termination incorporates referral, warranty, and archiving activities.
The requisite infrastructure for sustaining the service process lifecycle is referred to as the service
platform and is related to the activities of the producer in the upper ontology, covered previously.
The service process lifecycle can be viewed as a set of layered events. One would ordinarily
supplement the service process lifecycle with service analytics that are descriptive of the end state of
a service event.
FUNDAMENTALS OF SERVICE ECONOMICS
Service economics is a subject that studies the nature of wealth generated by service. [Fawcett 1870]
It is an important subject because the modern view of the service economy must be considered when
any political, financial, or business question arises. People do not generally become familiar with a
topic until its underlying principles have been identified. Service is largely a utilitarian discipline

SOBIE 2014
234
[Mill 1861], wherein a coherent set of underlying principles are not yet available, so that in everyday
affairs, it is not prudent to defer analyzing the subject until those principles have been verified or
confirmed. Every social question involves service, so that service economics would necessarily
involve the following endeavors: production, exchange, distribution, and commerce. Another
consideration is that the focus of economics has changed from land, labor, and capital to participants,
knowledge, and capital. Capital is an important component, but not a defining characteristic, and
necessarily encompasses wages and infrastructure.
Wealth and Service Value
Wealth is an important aspect of the end result of any commercial activity. Like service, wealth is a
term with a many different meanings. In business, wealth refers to money and things that have
exchangeable value. In government, wealth refers to the capability of having commercial and
political power using money as a facilitator. In education, wealth is usually reflected in facilities and
instruction. A wealthy country would have more exports than imports resulting in an importation of
money, using the precise form of money available at the time. Mill [1885] wrote that the wealth of a
country is dependent on the skill that its labor is employed, and Smith [1776] remarked that labor is
the basis of all production. This leads, of course, to the modern reflection that an increase of wealth
is not only an increase in money, but it is the potential for providing service. Early political
economists considered wealth as anything with exchange value. [Fawcett op cit.] However, many
things with useful purpose, such as the air and sunlight, are not wealth unless modified by human
intervention. Money, as a public instrument, is solely a measure of value and a medium of exchange.
A wealthy person or organization has a large collection of desirable or necessary items, or the means
of obtaining them, provided that they are not provided by nature without some form of labor.
Another consideration is that wealth is increased by producing where and by whom it is produced
most expeditiously. [Ricardo 1817]
Although service can and does involve products, it is not a material product of nature, so that service
wealth, in its most basic form, is useful activity that produces value through human involvement.
Service wealth lies in the potential for providing service, so that service-provisioning agents are the
basis of all service. Clearly, humans, products, and informational resources can provide service.
Thus, value is established by an exchange of service through a provider-client relationship. Service
is usually associated with business, where value is produced through the manipulation of goods,
capital, people, and events. Thus, service is a refinement of the business process.
A vertical is used to establish the value of service, consisting of value, price, and cost. The difference
between cost and price yields the margin, and the difference between price and willingness to pay is
the service value.
SOBIE 2014
235
There is no explicit exchangeable value in service, per se, because you can’t purchase someone else’s
service. A service is established at the point of instantiation and ends when the service is complete.
The particular service under consideration is then finished. It no longer exists – only a record (or
memory) of that service persists, along with tangible or intangible results, as determined by the
specific incident. Separate from the actual service process, the facility of obtaining service, in the
general view of society, can be scheduled, rescheduled, unscheduled, transferred, and purchased. The
access to service is transferable, but the actual performance of service is not. Moreover, it is possible
to purchase the ability to obtain a service, and it is possible to pay for actually receiving a service by
the client or a client’s advocate.
A clarification is in order. One might view the purchase of an airline seat or of an automobile, as a
product that can provide a service, as something of exchangeable value. The purchase of a seat or an
automobile is an entity capable of providing or sustaining a service is a service facilitator, but it is not
a service per se. A service is the execution, or more properly the instantiation, of a process that
provides the service, as in the airline or automobile form of transportation.
On the other hand, there must be some explicit value in service, since it serves as the basis of the
modern economic system. Thus, the wealth inherent in service results from the co-creation of value.
The execution of a service yields two or more distinct values: the act of performing or receiving the
service and the result of having the service process performed. Accordingly, a service value can have
two related components: commercial value and personal value. The result may be tangible or
intangible, as covered previously. During the act of performing a service, it is useful to recognize two
things: the provisioning dimension and the “receiving” dimension, to which we can add the service
object dimension that may coincide with the receiving dimension.
When a service provider executes a service, including auxiliary and supplementary services, it is done
for an economic value – salary, a fee, or another form of compensation. When a service client
receives a service, it is often the case that a personal value is obtained – a state that is inconvenient or
impossible to achieve independently.
The reasons are clearly evident, since most services result from one or more of the following
circumstances: (1) Something you can’t do; (2) Something you don’t want to do; and (3) The
opportunity cost of the client performing the service. There are, of course, two points of view: that of
the element of the provider set and the element of the client set. From the perspective of the
provider, the service value lies in the performance of the service process, and from the client’s
perspective, the service value results from the end state after the service is performed.

SOBIE 2014
236
The Domain of Service
It is clearly obvious that the work of a professional entity is a service. Retailing is a service by
changing the ownership property of an item within its domain. Employees of an organization provide
a service, as does the mayor of a city or governor of a state. Federal, state, and local governments
provide a service to their constituents. Police and fire departments provide a service. The religious
clergy provides a service. Educators and parents provide a service. Products provide tangible and
intangible services. Most forms of commercial and social activity involve service of some sort. Yet,
we, as a society, actually know very little about service; we can elicit no principles of good service
behavior, and very little evidence of best practices – in spite of the fact that at least 80% of persons
are engaged in service – through commercial or social activity.
Service Structuralism
The thesis of service structuralism concerns the concept that what really matters about service is not
the concrete elements of provider, client, and object, but rather the manner in which the elements
relate to each other. Thus, a service system is a collection of abstract objects with relations on how
the objects interact to each other, so that a structure is an abstract form of a system. [Hilbert 1899]
Only when concrete objects are abstracted from the service system can principles of behavior be
developed.
A property is an attribute or characteristic of a service element. There are two forms of study:
conceptualism and realism. In the former case, properties exist but are dependent upon the mind. In
the latter case, properties exist independently of the mind. We are concerned with realism for the
development of principles that govern service. Again, there are two forms. With in rebus realism, a
property exists only if it has instances. With ante rem realism, a property can exist if it has no
instances. [Audi 1999] This paper takes the ante rem view of service economics. To sum up, what we
are concerned with in service economics is not the characteristics of the provider, client, and service
event, but the relationship between the various constituent elements.
Service Requisites
Service economy is a discipline that investigates the operational conventions that govern the
production, exchange, and distribution of value resulting from the execution of service process,
service event, or use of a service artifact. Value is a demonstrable result of the application of the
operational conventions.
SOBIE 2014
237
The value of a service essentially incorporates three entities: the service provider, the service
customer, and the service object. The important element, as least at this point, is the junction where
the three entities interact. Recall that the customer is typically more concerned with the result than
the service process. The service provider is more concerned with the service process, because if the
service is performed correctly, then the result will be satisfactory. The service object is independent
of the service process, unless it coincides with the customer.
The basis of classical economics stems from the writings of Smith [op cit.] and Mill [op cit.] and is
recorded in the publication of Fawcett [op cit.], and is synthesized from the coordination of land,
labor, and capital, serving as the input to production. Within a background of classical economics,
the tenets of service provisioning are specialization, division of labor, and comparative advantage. A
client arranges for service with a specific provider to obtain the knowledge and experience in a
particular domain. The service process is designed to utilize the notion of service itself – the division
of labor – to enhance efficiency and achieve quality of the service experience. Comparative
advantage results from the practice of employing a service provider with the most prudent
infrastructure to achieve the highest quality results from the service process.
The basic tenets of service model those of classical production that have stood the test of time.
Specialization allows the service producer to take advantage of existing abilities. [Fawcett op cit.]
Division of labor allows specialization to be applied where it is most applicable, and comparative
advantage permits outsourcing to be employed to provide service efficacy. The three basic tenets
expedite large-scale provisioning, yielding a better quality of service and efficient operations.
Focus of Service Economics
The view of service economics was described earlier as being focused on the participants, knowledge,
and capital. The participants in a generic view of service are the provider and the client sets that
result in the notions of collaboration and duality. Technological, organizational, and human elements
are traditionally combined to create service.
Knowledge, as in the case of professional endeavors, and capabilities, as in the case of manual
procedures, are paramount to service. Knowledge and capability supersede specialization, provide
the basis for division of labor, and often constitute the requirement for outsourcing.

SOBIE 2014
238
Capital takes on its traditional value, as the part of wealth that is advanced to establish infrastructure,
stock, and supplies and to cover wages until service renders a return on investment. Owners of
capital will ordinarily appropriate funds unless they are rewarded with a share of the value generated
by service – referred to as the profits of capital. It has three components: interest on the money
expended, compensation for risk, and the variability of the service domain. If the profits derived from
the capital investment were not greater than the interest on the funds, for example, then clearly the
investment would not be made – unless special exogenous considerations apply.
Participants, knowledge, and capital are the basis of and the forerunners of further work on service
economics.

SOBIE 2014
239
SUMMARY
It is generally recognized that service is a provider/client collaboration that creates and captures value
for both participants. Both entities contribute in the interchange and both benefit, even though the
sense of participation is diverse and varies between different forms of service execution. An example
is the relationship between a doctor and patient that relies on the participation of both persons, since
both entities are required in order for the service to be instantiated. Moreover, a doctor’s service
varies between patients and yields different results, depending on the situation. This characteristic is
typical of most service. The entity supplying the service is known as the service provider and the
entity receiving the service is known as the service client. The domain of service providers includes
individuals, teams, products, electronic systems, groups, and ad hoc units organized to execute a
particular service delivery scenario. Similarly, service clients include persons, groups, social
organizations, governments, and commercial entities. In some cases, the object receiving the service
is the responsibility of the client, as in cleaning and repair services. In this instance, the entity
receiving the service is known as the service object.
Most commercial and social activity involves service, yet very little is known about the subject. This
paper covers the structure and operation of services, as well as a lifecycle of service processes. The
relationship between service and traditional economics is explored as a basis for the study of service
economics.
REFERENCES
Audi, R. (General Editor), The Cambridge Dictionary of Philosophy (2e), Cambridge, UK:
Cambridge University Press, 1999.
Boghossian, P., Fear of Knowledge: Against Relativism and Constructivism, Oxford: Oxford
University Press, 2006.
Fawcett, M., Political Economy for Beginners, New York: Barnes and Noble, Inc., 2004, (Originally
published in 1870.)
Ferrario, R. and N. Guardino, “Towards an Ontological Foundation for Services Science,”
Proceedings of the Future Internet Symposium, Vienna, Austria, 28-30 September 2008.
SOBIE 2014
240
Hilbert, D., Grundlagen der Geometrie, Leipzig: Teubner, 1899. (Townsend, E. (Translator),
Foundations of Geometry, La Salle, Illinois: Open Court, 1959.)
Jevons, W., Political Economy, New York: D. Appleton and Company, 1880.
Katzan, H., “Principles of Service Systems: An Ontological Approach,” Journal of Service Science,
2(2): 35-52, 2009.
Katzan, H., “Service Collectivism, Collaboration, and Duality Theory,” IABR Business Conference,
Orlando: The Clute Institute for Business Research, 2010.
Katzan, H., Service Science: Concepts, Technology, Management, New York: iUniverse, Inc., 2008.
Maglio, P., “An Interdisciplinary Approach to Service Innovation,” IBM Almaden Research Center,
http://almaden.ibm.com/ssme, 2007.
Mill, J.S., Principles of Political Economy, New York: D. Appleton and Company, 1885.
Mill, J.S., Utilitarianism, New York: Barnes and Noble, Inc., 2005, (Originally published in 1861.)
Ricardo, D., The Principles of Political Economy and Taxation, New York: Barnes and Noble, Inc.,
2005, (Originally published in 1817.)
Smith, A., The Wealth of Nations, New York: Barnes and Noble, Inc., 2004, (Originally published as
“An Inquiry into the Nature and Causes of the Wealth of Nations” in London England, 1776.
****************

SOBIE 2014
241
ABET Accreditation of IS and IT Programs In 2013
Ron MacKinnon, Georgia Southern University
Kevin Elder, Georgia College & State University
John Dyer, Georgia Southern University
Abstract
The Accreditation Board for Engineering and Technology (ABET) has been accrediting
engineering and computer science for many years and they are the standard accreditation in
these areas. . In recent years ABET has been accrediting Information Systems and
Information Technology programs. ABET first accredited IS in 2000 and IT in 2003. ABET
appears to have become the standard accreditation for IT and in the spring of 2014 there are
25 IT programs accredited by ABET. There are 38 IS programs accredited by ABET since
2000 but it does not appear that ABET accreditation has become the standard for IS
programs. This paper looks at the IS and IT ABET accredited programs and examines the
common features and differences of these related accredited programs.
Background
The topic of ABET accreditation of IS programs has been a topic of interest since 2000, as
can be seen by the papers written on this topic, as shown in the references. There were many
papers written on ABET accreditation of IS programs in 2000-2005 but the number of papers
slowed down after 2010. This paper will give an update to the accreditation of IS and IT
programs by ABET up to 2013 and will show the characteristics of ABET accredited IS and
IT programs. The information in the following tables was acquired by visiting the web sites
of the various universities. These pages are continually updated so the data that will be
available in the future might not match the data used for this paper.
ABET Accreditation of IS Programs.
The ABET accreditation of IS programs started in 2000 and for 10 years there was a steady
growth of accredited IS programs. However in the past 4 years there have only been 3 IS
programs accredited, as can be seen in Table 1. At one time it appeared that ABET
accreditation of IS programs might become the standard IS accreditation like ABET is the
standard accreditation for engineering and computer science. However, at this time it does
not appear that ABET will be the standard accreditation for IS programs.

SOBIE 2014
242
Year Program Was
Accredited
No of IS Programs
Accredited
Year Program Was
Accredited
No of IS Programs
Accredited
2000 1 2007 2
2001 6 2008 3
2002 3 2009 3
2003 3 2010 1
2004 4 2011 2
2005 3 2012 0
2006 4 2013 0
Total 2000-2013 38
Table 1 The Number of IS Programs Accredited by Year
ABET Accreditation of IT Programs.
In Table 2 below, it can be seen that ABET accreditation of IT programs began in 2000 and
there has been a steady growth of IT programs accredited by ABET, although this growth
slowed down in 2012 and 2013. . In Table 4 it can be seen that most IT programs are not in
Colleges of Business, so IT programs do not have many options as to who will accredit them.
It is possible that over time, ABET will become the standard accreditation for IT programs.
Year Program Was
Accredited
No of IT Programs
Accredited
Year Program Was
Accredited
No of IT Programs
Accredited
2003 3 2009 2
2004 1 2010 3
2005 3 2011 2
2006 2 2012 0
2007 5 2013 1
2008 2
Total 2003-2013 25
Table 2 The Number of IT Programs Accredited by Year
Characteristics of ABEP Accredited IS Programs
The vast majority of IS programs are in colleges of business and they are often accredited by
AACSB. In Table 3, there are several characteristics of ABET accredited IS programs that
stand out. Most IS programs in colleges of business offer a BBS IS degree. In Table 3 it can
be seen that of the 38 ABET accredited IS programs, 35 of them offer BS degrees. Another
characteristic that stands out is that most of the ABET accredited IS programs are not offered
in Colleges of Business.
In addition to offering a BS degree and not being located in a college of business, ABET
accredited IS programs are often located in more technical oriented colleges. As can be seen

SOBIE 2014
243
in Table 5, universities offering ABET accredited programs also often offer computer science
and engineering programs and they do not offer a BBA IS degree.
Characteristics of ABET Accredited IT Programs.
In Table 4 below, it can be seen that IT programs have several differences from IS programs.
IT programs offer BS degrees and do not offer BBA degrees. IT programs are often offered
in joint departments of IT or computer science departments and are located in colleges that
are technically oriented and these colleges are not usually business oriented.
# University ABET Department IS Deg College
Acred
Year Title
1 Arkansas Tech 2006 C & Info Science IS BS Applied Science
2 California SU, Chico 2008 Acct & MIS MIS BS Business
3 California U of Penn 2008 Math, CS & IS CIS BS Science & Tech
4 Drexel U 2001 None IS BS IS & Technology
5 East Tennessee SU 2010 Computing IS BS Coll of Bus & Tech
6 Fitchburg State College 2006 Computer Science CIS BS None
7 Florida Memorial U 2008 CS & Math CIS BS School of Arts &
Science
8 Gannon 2004 Computer & Info Sciences MIS BS Hum, Bus & Education
9 Grand Valley SU 2007 School of Comp & IS IS BA Engineering & Comp
10 Illinois State U 2001 School of IT MIS BiS School of IT
11 Jacksonville SU 2003 Math, Computing & IS CIS BS Arts & Science
12 James Madison 2003 CIS & Mgmt Sci CIS BS Business
13 Kennesaw State U 2002 CS & IS IS BS Science & Math
14 Metropolitan S College 2005 CIS MIS BS School of Business
15 NJ Institute of Tech 2002 IS IS BS Computing Sciences
16 Pace U 2000 None IS BS School of CS & IS
17 Quinnipiac U 2005 Info Sys Mgmt ISM BS School of Business
18 Radford U 2008 Info Tech IS BS Science & Technology
19 Regis U 2010 None CIS BS School of C & IS
20 Robert Morris U 2001 CIS ISM BS School of Comm & IS
21 Rowan U 2006 None MIS BS Business
22 Slippery Rock 2003 Computer Science IS BS Bus, Info & Social Sci
23 Southern Utah U 2009 CSIS, Sch Comp & Tech IS BS Science & Engineering
24 SUNY Brockport 2011 CIS CIS BS Sch of Bus Admin &
Econ
25 U of Tampa 2009 Info & Tech Mgmt MIS BS Business
26 U Arkansas, Little
Rock
2006 Info Sc IS BS Engineering & IT
27 U Houston, C of Tech 2009 Info & Logistics
Technology
CIS BS Technology
28 U Houston-Clear Lake 2004 Comp & Math Division CIS BS Sch of Science & Engin
29 U Nebraska, Omaha 2002 IS & Quant MIS BS IS & Technology
30 U North Alabama 2006 CS & IS CIS BBA Business
31 U North Florida 2001 C & IS Sciences IS BS School of Computing
32 U of South Alabama 2001 C & IS IS BS School of Computer &
IS
33 U South Carolina 2004 Computer Sci & BIS BS Engin & Computing

SOBIE 2014
244
Engineering
34 Utah S U 2005 Computer Science CS BS Science
35 Utah Valley U 2007 IS & Tech IS BS Technology &
Computing
36 Virginia
Commonwealth
2001 IS IS BS School of Business
37 West Texas A&M U 2011 CI & DM CIS BBA College of Business
38 Wright SU 2004 IS & Oper Mgmt MIS BS College of Business
Table 3. ABET Accredited IS Programs in 2013
# University ABET
Accre
d
Year
Department IT
Titl
e
Degree College
1 Brigham Young U 2004 IT IT BS School of Tech
2 Capella U 2009 Bus & Tech IT BS IT School of UG Studies
3 Drexel 2007 IT IT BS IT Col of Com & Info
4 East Tennessee 2005 Computing IT BS Col of Bus & Tech
5 Georgia Mason 2008 Applied IT IT BS School of Eng
6 Georgia Southern 2003 IT IT BS Col of EIT
7 Indiana U-Purdue 2008 Comp & Info
Sc
IT BS School of Science
8 Middle Georgia 2007 IT IT BS School of IT
9 Oakland 2010 CS & Engin IT BS School of Engin & CS
10 Purdue West
Lafayette
2005 Com & IT IT BS College of Tech
11 Purdue Calumet 2010 Com IT &
Graph
CIT BS College of Tech
12 Rochester IOT 2003 IS & Tech IST BS Coll of Comp & IS
13 Slippery Rock 2009 CS IT BS Coll of Bus, IS & SS
14 Southeastern
Louisiana
2011 CS & IT IT BS IT Coll of Science & Tech
15 Southern Poly 2007 IT IT BSIT Sch of Comp & Soft Eng
16 U of Toledo 2010 Joint Depts IT BSIT Col of Engin, Col of Bus
17 US Military
Academy
2007 EE & CS IT BS None
18 US Naval Academy 2005 CS IT BS Math & Science
19 U Cincinnati 2006 School of IT IT BSIT Col of Ed, CJ & HR
20 U Missouri-KC 2006 CS & EE IT BIT Sch of Comp & Eng
21 U New Hampshire 2011 CS IT BSIT CEPS
22 U North Florida 2007 Sch of Comp IT BS Col Eng, Comp, Const
23 U South Alabama 2003 Sch of Comp ITE BS None
24 Walden 2013 IT IT BS School of IS & Tech

SOBIE 2014
245
25 Winston-Salem 2011 CS IT BS Col of Arts & Sciences
Table 4 ABET Accredited IT Programs in 2013
Additional Characteristics of ABET Accredited IS Programs.
In Table 5 the title of the IS courses in ABET accredited programs could be IS or CIS or MIS
or ISM or BIS. There is no standard name for IS courses in an ABET accredited program. In
Table 5 it can also be seen that most ABET accredited IS programs are BS degrees but there
are 2 BBA degrees offered so it is possible for a BBA program to get ABET accredited.
In universities with an ABET accredited IS program, they generally do not also offer IT or
engineering programs. However, all universities offering an ABET accredited IS program
also offer a computer science program. It might be noted that most computer science
programs are ABET accredited.
In Table 5, most universities offering an ABET accredited IS program do not offer a BBA IS
degree, however, in many of these universities their business programs are AACSB
accredited.
# University Year
ABET
Accred
IS
Title
ABET
IS
Deg
Exis
Of
IT
Exis
Of
CS
Exis
Of
Engin
Exis
Of
BBA IS
Bus
AACSB
Accred
1 Arkansas Tech 2006 IS BS Y Y Y N Y
2 California SU, Chico 2008 MIS BS N Y Y Y Y
3 California U of Penn 2008 CIS BS N Y Y N N
4 Drexel U 2001 IS BS Y Y Y Y Y
5 East Tennessee SU 2010 IS BS Y Y Y N Y
6 Fitchburg State College 2006 CIS BS N Y N N N
7 Florida Memorial U 2008 CIS BS N Y N N N
8 Gannon 2004 MIS BS N Y Y N N
9 Grand Valley SU 2007 IS BA N Y Y BA Y
10 Illinois State U 2001 MIS BiS N Y N BIS Y
11 Jacksonville SU 2003 CIS BS N Y N Mgmt Y
12 James Madison 2003 CIS BS N Y Y Y Y
13 Kennesaw State U 2002 IS BS Y Y N N Y
14 Metropolitan S College 2005 MIS BS N Y Y N N
15 NJ Institute of Tech 2002 IS BS Y Y Y N Y
16 Pace U 2000 IS BS Y Y N Y Y
17 Quinnipiac U 2005 ISM BS N Y Y N Y
18 Radford U 2008 IS BS N Y N N Y
19 Regis U 2010 CIS BS N Y N N N
20 Robert Morris U 2001 ISM BS N SE Y N N
21 Rowan U 2006 MIS BS N Y Y N Y
22 Slippery Rock 2003 IS BS Y Y N N N
23 Southern Utah U 2009 IS BS N Y Y N Y
24 SUNY Brockport 2011 CIS BS N Y N Y Y

SOBIE 2014
246
25 U of Tampa 2009 MIS BS N N N N Y
26 U Arkansas, Little Rock 2006 IS BS N Y N N Y
27 U Houston, C of Tech 2009 CIS BS Y Y Y N Y
28 U Houston-Clear Lake 2004 CIS BS N Y Y BS Y
29 U Nebraska, Omaha 2002 MIS BS PhD Y PhD N Y
30 U North Alabama 2006 CIS BBA N Y N N Y
31 U North Florida 2001 IS BS N Y Y N Y
32 U of South Alabama 2001 IS BS Y Y Y N Y
33 U South Carolina 2004 BIS BS N Y Y N Y
34 Utah S U 2005 CS BS N Y Y BA Y
35 Utah Valley U 2007 IS BS Y Y N N Y
36 Virginia Commonwealth 2001 IS BS Y Y Y N Y
37 West Texas A&M U 2011 CIS BBA N Y Y Y Y
38 Wright SU 2004 MIS BS N Y Y N Y
Table 5. ABET Accredited IS Programs in 2013

SOBIE 2014
247
Conclusion
At one time many IS and IT faculty assumed that ABET accreditation would become the
standard IS and IT accreditation, as it is for computer science and engineering. If you look at
Table 1 and 2, it can be seen that the growth rate of ABET accredited IS and IT programs
has slowed down to a virtual halt. In 2012 and 2013 there were no new IS programs ABET
accredited and in 2012 and 2013 there was only one new IT program AABET accredited. It
can be concluded that ABET accreditation has not yet become the standard accreditation for
IS programs and this does not appear likely to happen in the near future.
35 of the 38 IS programs that are accredited by ABET are BS degrees.
Most of these BS degrees are located in non-business colleges that are more technically
oriented
.
There has been a slow but a steady growth of ABET accreditation of IS programs (38
programs in 10 years)
After 10 years, only 25 IT programs are ABET accredited.
ABET accredited IT programs are not located in a College of Business
Of the 25 ABET accredited IT programs, 8 are located in IT departments, 7 are located in CS
departments, and 10 are located in joint depts. IT departments can be located in many
different IT & CS departments
The bottom line is that the growth of ABET accredited IS programs has slowed down and it
appears that ABET accreditation of IS programs has not yet become the standard IS
accreditation like engineering & CS and there is no indication that this will happen in the
near future.
If an IS program is not in a School/College of Business, they should consider ABET
accreditation

SOBIE 2014
248
References
AACSB (2014). Accreditation. Retrieved April 1, 2014, from
http://www.aacsb.edu/accreditation/
ABET (2014a). Accredited Information Systems Programs, -ordered by name. Retrieved
April 1, 2014 from http://main.abet.org/aps/Accreditedprogramsearch.aspx
ABET (2014b). Criteria for Accrediting Computing Programs. Retrieved, April 1, 2014, from
http://www.abet.org/accreditation-criteria-policies-documents/
Challa, C.D., Kasper, G.M., & Redmond R. (2005). The Accreditation Process for IS
Programs in Business Schools. Journal of Information Systems Education, 16 (2),
207-217.
Gorgone, J. T. (2003). ABET’s General Accreditation Criteria to Apply to All Computing
Programs, the Special Interest Group on Computer Science Education (SIGCSE)
Bulletin, 35(4), 14-16.
Gorgone, J.T. (2004). Draft Information Systems Accreditation Criteria for 2006, the Special
Interest Group on Computer Science Education (SIGCSE) Bulletin, 36(2), 15-17.
Hilton, T. S. & Stone, M. (2003). MIS Program Accreditation: Comparing AACSB and
ABET. International Association for Computer Information Systems (IACIS), Retrieved from
http://isedj.org/isecon/2003/2211/ISECON.2003.Hilton.pdf
Hilton, T. S., Johnson, D. A., & Kasper, G.M. (2004), ABET Accreditation of MIS
Programs in AACSB Schools, In the Proceedings of Information Systems Education
Conference (ISECON), 21, 1-16.
Hilton, T. S. & Lo. B. W. (2007), IS Accreditation in AACSB Colleges via ABET, Journal
of the Association for Information Systems, 8(1), Article 1 1-15
IS Departments, ISWorld (2005), Retrieved from
http://www.georgiasouthern.edu/~rmackinn/infosys/na.htm#usa
Jones, C. G. (2004). An Analysis of Programmatic Differences Between Dual
ABET/AACSB and ABET-Only Accredited Information Systems Programs, International
Association for Computer Information Systems (IACIS), 2, 544-530.
Kohun, F. G. & Wood, D.F. (2003). The ABET CAC Accreditation Experience – Intent and
Reality – the Information Systems Perspective, Journal of Information Systems Education,
1(43), 3-11.
Kohun, F. G. & Wood, D.F. (2004). The ABET CAC Accreditation: Is Accreditation Right
for Information Systems?, International Association for Computer Information Systems
(IACIS), 2, 579-583.
Kohun, F.G. DeLorenzo, G.J. & Roull, A. F. (2011) Are All Information Systems Created
Equal – Does Accreditation Solidify Information As a Discipline?, International Association
for Computer Information Systems (IACIS), 12, 2, 264-272.
Landry, J.P. & Daigle, R. J. & Longnecker, H. E. & Pardue, H. (2009) IS 2002 and ABET
Accreditation: Meeting the ABET Program Outcome Criteria, ISECON, 26, 1-5.
Larson, S., Harrington, C., (2012) A Survey of ABET Accredited Information Systems
Undergraduate Programs in the USA, EDSIG, IS Educators Conference, v29, 1-18.
MacKinnon, R. J. & Butler, S.E. (2005). How Do IS Programs Compare with ABET
Accredited Programs? International Association for Computer Information Systems (IACIS),
6, 332-338.

SOBIE 2014
249
MacKinnon, R. J., & Elder, KL, & Dyer, JN. (2012). The Current Status of ABET
Accreditation of Information Systems Programs,. Issues in Information Systems, Vol. 13,
Issue 1, pp 151-159.
MacKinnon, R. J. & Han, HJ. (2008). An Analysis of IS Programs Accredited by ABET,
Communications of the IIMA, 8,1,43-52.
Management Information Systems Rankings (2011), US News and World Report, Retrieved
March 5, 2012 from
http://colleges.usnews.rankingsandreviews.com/best-colleges/rankings/business-
management-information-systems
Saulnier, B., & White, B., (2010). IS 2010 and ABET Accreditation: An Analysis of ABET-
Accredited Information Systems Programs, Journal of Information Systems education, V22,
N4, pp 347-354.
Topi, Heikki (2011) IS Education: Accreditation of Degree Programs in Information
Systems, ACM SIGCSE Bulletin, Volume 41, Issue 2, June 2009, 70-71.
SOBIE 2014
250
In-Memory Databases & Complex Event Processing: The Rise of
Real-Time Computing with Predictive Analytics
John Dyer, Georgia Southern University
Kevin Lee Elder, Georgia College & State University
Ron MacKinnon, Georgia Southern University
Abstract
Recent trends in Enterprise Resource Planning revolve around the ability to provide
powerful Business Intelligence reports in order for managers to make informed and timely
decisions. Because of this trend, new technologies such as in-memory databases (IMDB)
and complex event processors (CEP) have recently gained ground. The information
contained herein outlines the nature of both technologies, while providing measures of
performance. Also included are descriptions of several key vendor offerings within the realm
of in-memory and complex event processing. Both technologies offer distinct enhancements
to current ERP systems. The scope of this review is best served by explaining IMDB and
CEP independent of each other, then describing how they can be used in tandem to enhance
firms in various industries.
Background
Over the years, computer storage has evolved from vacuum tubes and magnetic
drums to hard drives, floppy disks, compact disks, and flash drives. Common to most large
organizations lately are three-tier architectures that include a presentation, application, and
database tier. The presentation tier allows an end-user to interact with the application tier via
a Graphical User Interface (GUI). The application tier houses groups of programs and ERP
modules needed to perform business transactions. The database tier includes the servers that
are responsible for storing data by writing it to disk and retrieving pertinent pieces of data
when requested. The 3-tier architecture is widespread and common for organizations that
need to gather, store, and retrieve massive amounts of data. However, the speed at which
data is aggregated, retrieved, and presented (under the three-tier architecture) is under
scrutiny given the rise of in-memory database computing and complex event processing.
This literature review explains in-memory databases, provides metrics in regard to the speed
of in-memory computing, details on various vendor’s in-memory offerings, rules to follow
during installation, and the benefits of in-memory computing as well as skepticism of IMDB.
Further, this review explains complex event processing, vendor offerings, the benefits within
different industries, and how it can be coupled with IMDB to provide automated responses to
real-time events.
An Explanation of In-Memory Databases
Put simply, in-memory database processing equals more data, faster. In-memory
databases rely on main memory to store data, which provides faster access to data because of
SOBIE 2014
251
the reduction in input/output reading activity that used to take place in the database server
(In-memory database, 2011). An in-memory database system allows data from an entire
database to be stored in the main (i.e. volatile) memory resulting in exponentially faster
response times for queries and transaction processing. A multitude of recent sources
indicates support for the transition to in-memory databases. Much of the support for IMDB
revolves around the metrics that have gauged the milliseconds at which these systems are
able to perform activities.
In-Memory Database Computing Metrics (Sybase, SAP, and Oracle)
Sybase created an in-memory database processing product aptly named Adaptive
Server Enterprise (ASE). In a May 2011 press release, SAP announced a merger with
Sybase to enhance its reach into both IMDB and CEP. Specifically, SAP stated that “Sybase
will be able to bring its complex event processing and analytics expertise, which was built in
the financial sector, to customers in other industries, markets and product areas in which SAP
has a complementary, strong presence” (SAP, 2010). SAP was also looking to enhance its
database business in order to enter into the in-memory market. Sybase provided the
technology that allowed SAP to become a player in both markets.
In a recent performance test, Sybase ASE found performance improvements over the
standard I/O disk in several key areas. Using Sybase ASE in-memory computing, transaction
processing improved by 1.3-2.2 times compared to disk. Incoming streaming market data
processing improved by 4-6 times. Telecommunications call processing improved by 1.5-4
times, and batch processing of Data Manipulation Language (DML) improved by 1.4-2.8
times (Sybase, Inc., 2010). The acquisition of Sybase allowed SAP to create an in-memory
solution called SAP HANA (High Performance Analytics Appliance) – based off of Sybase
ASE technology.
Jaikumar Vijayan’s article on ComputerWorld.com noted that SAP HANA was able
to provide a consumer goods company 450 billion records in a matter of seconds based on
complex queries, compared with the hours it would have taken previously. While SAP
HANA is a late-arrival to the in-memory space, it is able to leverage its existing relationships
with customers in order to provide a solution that can pull information directly from
previously implemented SAP ERP modules. Another advantage of HANA is that it is
designed to work within “non-SAP” computing environments. Therefore, SAP can also
market HANA to customers outside of its current client base (2010).
A report from SAP’s website summarized test results from HANA’s performance
running on IBM hardware. The report stated “complex queries, such as understanding trends
in the sales organization or material sales, were performed against 1.3-terabyte databases and
returned results within seconds.” During the test, HANA was able to perform extensive
analytics in lock step with incoming data. SAP HANA was tested against 10 analytical query
streams and four operational reporting streams. Under these conditions, it was able to
produce 10,000 queries per hour. The results of these tests allowed insight into the fact that
literal, real-time data analytics is truly possible (SAP, 2011). While SAP HANA is a

SOBIE 2014
252
powerful solution, Oracle too provides an in-memory mechanism that has garnered industry
attention.
Oracle TimesTen 11g is an in-memory database processing solution that is able to
work in standard SQL-based interfaces. Oracle’s internal tests revealed that it takes
TimesTen less than 15 microseconds to update a record and less than a mere five
microseconds to read a record (Oracle, 2009). Furthermore, real world applications of
Oracle’s TimesTen solution have helped financial services’ company Duetsche Bors reduce
its order processing time by 70-95% (Oracle, 2009). Oracle In-memory processing has also
helped KTF, a Korean-based mobile communications company; increase its transaction
speed by 1,000 percent, with a 1 millisecond average response time (Oracle, 2008). These
metrics are a good starting point to begin to understand the computing power of in-memory
databases. The following section provides a detailed analysis on how SAP HANA and
Oracle TimesTen increase performance in particular ERP modules.
A Detailed Look at In-Memory Database Solutions
SAP HANA:
In a 2011 presentation to the American SAP User Group, Carsten Hilker (SAP,
Solution Manager) outlined how SAP HANA can specifically enhance Profitability Analysis
(CO-PA) reporting. SAP HANA’s CO-PA Accelerator provides a highly integrated,
customer-defined Profitability Analysis in which it pulls data from many modules within
SAP (see Appendix 1). Hilker noted that process performance, data volumes, and speed of
analysis currently challenge extreme profitability insight. An example of how business
performance is impacted is in the poor profitability reporting and slow month-end closing
runtimes. Also, current systems provide only limited profitability insight due to large or
incomplete data sets. And the lack of access to trusted profitability data in a timely manner,
leads to suboptimal business decisions. Hilker identified that the amount of data provided
via in-memory solutions creates value by “providing transparency, enabling experimentation
to discover needs, exposing variability, and improving performance.” Because of automated
algorithms embedded in SAP HANA, human decision-making can be supported.
Furthermore, it allows population segmentation to customize actions for specific customer
groups. Perhaps the most telling advantage of in-memory computing with SAP HANA is the
fact that it can provide a potential increase of 60% in an organization’s operating margin.
Hilker (2011) ultimately provided three simple reasons to why in-memory computing
is relevant for not only Profitability Analyses, but also other business exchanges. Reason 1:
In-memory database processing speed allows an organization to do more in the same time,
dig deeper when needed, and to disengage in reports with previously prohibitive runtimes.
Reason 2: The generated results give an organization the ability to process high volumes of
data in order for analysis of complete and current data sets (i.e. consolidated, multi-year line-
item and life-time analysis). Reason 3: Access to instantly available data provides relevant
information, resulting in user-initiated automated decision-making.
Another advantage of moving to in-memory database processing is that the traditional
database does not have to be immediately abandoned. If an organization chooses the SAP

SOBIE 2014
253
HANA solution, the firm can use it as a secondary database. In so doing, archived data that
was originally stored in the traditional database can be seamlessly transported to HANA. At
this point, the data is available at a 100-times faster rate. Organizations can then phase out
traditional databases, because all data will be replicated on the in-memory database. While
there are concerns that the data now resides in volatile memory, in-memory databases such as
HANA do have archiving capability. This allows data to be retrieved that might have been
potentially compromised due to an unexpected power outage. If a firm chooses to employ a
cutover strategy to SAP HANA, it can be achieved. Hilker states that it is a “non-disruptive
installation, adding instant value with no implementation project required” (2011).
Oracle TimesTen 11g:
Oracle TimesTen In-Memory Database 11g can operate either in physical memory
using standard SQL interface or as an in-memory database cache to enhance throughput and
response time. TimesTen is a relational database with a standard SQL interface that stores all
data in main memory. In doing so, all network latency and disk input/output (I/O) is
eliminated. Because the data is stored in-memory, it is “closer” to the application server.
The result is elimination of worry regarding network speed or traffic congestion common on
traditional databases. TimesTen, much like SAP HANA, can be used either to replace an
existing database or as a cache to accelerate the existing applications. In regards to
implementation, TimesTen is compliant with existing code frameworks. Therefore, it does
not require developers to learn new skills (Oracle, 2011).
Benefits of SAP HANA vs. Traditional Databases
In order to provide insight into the speed at which in-memory computing operates,
SAP performed tests using traditional reporting tools against HANA-accelerated reporting
tools. An in-memory versus traditional database test scenario with 120 line items, on
product-related dimensions for a single company, revealed the following. In-memory
reporting provided information directly at the line-item level in less than one second; there
was no limit on drill-downs, and the data was immediately available for reporting. With the
traditional ERP reporting database, it took several minutes to provide pre-calculated data
aggregation levels. And in some cases drill downs were not possible because they were
dependent upon whether aggregate data existed.
Another database test scenario, involving 85 line items of overhead costs relating to
single product sales quantities, revealed the following. The in-memory database accelerated
the reading time from greater than one hour to less than 30 seconds for reference data. In
addition, the in-memory database allowed a product data-search that returned a result in less
than one second. With a traditional database, this type of search was only possible with
index support. Ultimately, these test cases showed that no data aggregation levels were even
required with in-memory; however, with a traditional database, time-consuming optimization
of pre-calculated data aggregation levels was needed.
The top value drivers for implementing SAP HANA (CO-PA Accelerator
specifically) include revenue growth across products, regions, divisions, and customer
segments; improved profitability within gross margins and at the product, region, and

SOBIE 2014
254
division level; and improved effectiveness through faster response to changing product cost
structures and the ability to make profitable portfolio decisions quickly. These
improvements are possible because HANA provides real-time access to massive amounts of
profitability data, accelerations in the cost allocation process, flexible and unconstrained
profitability reporting through Business Intelligence tools, and rapid, non-disruptive
deployment. The benefits of in-memory database processing with SAP HANA include the
speed of profitability which helps accelerate financial performance, leading to powerful
insights that unlock opportunities, thereby empowering users with access to trusted data to
optimize profitable business decisions. The benefits are evident, but installation will not
happen without proper planning and coordination (Hilker, 2011).
Installing an In-Memory Database
Deploying an in-memory database is a comparatively simple task taking into account
the painstaking amount of time required for a full ERP implementation. Installing an in-
memory database is a process that can be measured in weeks as opposed to months or years
in the case of large ERP implementations. While IMDB is a shift in the structure of how data
is stored, the complexities of installation can be streamlined with proper planning and
execution. It is imperative that a company install and set up an IMDB in alignment with the
vendor and hardware team. This ensures that the proper IMDB is selected and it will run on
the chosen (or existing) hardware. Frequent contributor to the SAP Journal, Tony de
Thomasis, concludes that successful IMDB installation comes down to sizing,
backup/restoration, automatic patching, and identifying and resolving early performance
problems. In order to achieve these goals, it is important to make sure the IMDB will align
with current systems, determine feasible replication options (Examples based on SAP
HANA: Sybase Replication Server for non-SAP data sources; SAP Landscape
Transformation trigger-based replicator), and ensure a front-end reporting tool such as SAP
BusinessObjects is up and running (2011). It is also worth reaching out to organizations (or
business units) that have already been through an installation. There is no exception for
deployment experience, and the insight gained from these types of relationships will only
improve the flow of performance during installation. Yes, this is new technology, but that
does not mean it has not been tested, installed, and used elsewhere. Taking advantage of
other installation use-cases is an important part of the go-live procedure. In-memory
computing does offer many exciting benefits, but considerations to data volatility and
implementation costs are a concern within the industry.
Challenges of In-Memory Solutions
David Menninger, in his article, “Advantages and Challenges of In-Memory
Databases and Processing,” examines that while the idea behind in-memory computing is
grand, there are serious considerations that need explanation. Menninger’s concerns with in-
memory databases revolve around recoverability of data, the cost of memory, and the
cumbersome calculations. By their very nature, in-memory databases rely on volatile
memory. Thus, these databases are seemingly susceptible to loss of data during power
outages. Menninger explains that in pursuing an in-memory computing environment, an
organization must be comfortable with completing streaming data operations with a safety

SOBIE 2014
255
net. Because there is no disk I/O, in-transit data may be lost during a power surge. At the
very least, the firm is now reliant on the system of record that generated the piece(s) of data.
In addition to the reliance on volatile memory, Menninger ascertains that in-memory
databases are also more expensive than traditional database systems. This claim is supported
by the fact that more and more data is readily available within organizations; therefore,
“memory…exacts a premium relative to the same quantity of disk storage.” Even though an
overwhelming majority (84%) of organizations indicates that they would like to employ
forecasting efforts into their day-to-day operations, the article indicates that in-memory
databases would provide too much data for the current spreadsheet-style calculations.
Menninger is skeptical that current RAM can handle this amount of data in a reasonable
fashion. However, he does conclude that in-memory will provide promise when
recoverability and cost concerns are harnessed and when in-memory systems mature to a
point that they can handle the complex data calculations needed for forecasting (2010).
While Menninger has plausible cause for skepticism of a somewhat new technology,
industries are eager to learn what IMDB could mean for their balance sheets. Companies
beginning to adopt in-memory solutions are doing so because of the value found in data
being readily available. Complimentary to data availability, is the ability to analyze streams
of data in real-time allowing subsequent answers and action in real-time. Therefore, in-
memory database processing is only half of the puzzle. A review of complex event
processing software solutions provides evidence that actionable data can provide measurable
results within many industries.
An Explanation of Complex Event Processing
Complex event processors allow data that is fed into a system in real-time to be
extracted in real-time. CEP cuts out the “Capture, Structure, Store” model that most BI
systems currently use and replaces it with a real-time integrated technique (Illapani, Kwong,
Herbas, & Welsh, 2010). The roots of CEP can be traced back to the financial sector.
Because of the large volumes of data related to trading on Wall Street, a mechanism was
needed to sift through the data and provide quick solutions to intricate problems. Out of this
setting came complex event processing. The processors act like “If, Then” statements within
a set of coded instructions. For example, a piece of financial data is linked to a stock price.
If a stock price dips low, then the system could be triggered to send a buy notification, and if
the stock price were to unexpectedly jump high, then the system could automatically trigger a
sale. The obvious advantage of CEP is the fact that data is understood and acted upon in
real-time allowing businesses to be more agile in how they operate.
CEP Systems and Benefits
Oracle, IBM, and Microsoft were the early frontrunners in the CEP arena. With
SAP’s acquisition of Sybase, it was not only able to move into the IMDB market, but it was
also able to introduce its own CEP solution (SAP BusinessObjects Event Insight) in early
2011 (Kanaracus, 2011). Oracle CEP provides “both a visual development environment as
well as standard Java-based tooling (see Appendix 2). Because Oracle has built their product
in industry standards such as ANSI SQL, Java, Spring DM and OSGI, their CEP provides the

SOBIE 2014
256
opportunity for an organization to analyze complex events throughout the enterprise. Oracle
uses these standards as a key selling point for organizations that may be hesitant about rolling
out a new product. By building their CEP solution on common standards, the
implementation curve can be flattened (Oracle, 2011). Merv Adrian, and IT Market
Strategist, published an article related to IBM InfoSphere Streams predicting that “stream-
based computing [would] change the world.” Particularly, Adrian was referring to IBM’s
solution that had already provided success to financial institutions that were able to harness
the CEP technology to make on-the-fly investment decisions (2009). Microsoft’s
StreamInsight system targets many of the same opportunities as Oracle, IBM, and SAP:
monitoring events, triggering responses, and providing predictive analytics. While Oracle
takes advantage of its widely-used SQL standards, Microsoft takes advantage of the .NET
framework upon which so many companies have built their system platforms (Microsoft,
2011). Complex event processing provides many benefits including: business process
monitoring, algorithmic trading, fraud detection, and risk management, network monitoring
for intrusion detection, and sensor network applications for Radio-Frequency Identification
(RFID) reading. While the choice of CEP system may be based on previous experience or
complimentary, pre-existing software, each solution is built based on a widely adopted
principle: REAL real-time data aggregation and automated decision-making is not only
possible but also necessary to compete at a high level within many different industries.
Furthermore, when CEP is used in conjunction with IMDB, it allows organizations to
become truly “live enterprises.” As such, live enterprises are those that are utilizing the
power of both in-memory computing and complex event processing.
Live Enterprise Results within Industries and Organizations
It is hard to imagine and industry that would not be better off by providing a way to
automate decision making based on massive amounts of data stored in main memory.
Because IMDB and CEP are only in infantile stages, it seems that these systems are only
beginning to scratch the surface of what is possible. The positive implications of CEP for
financial services companies have been touched on previously; however, what does CEP
combined with IMDB mean for government agencies, logistics enterprises,
telecommunications companies, toll roads, or the utilities industry?
Within the realm of government agencies, an exciting opportunity for live enterprises
is that it provides law enforcement individuals to learn about gang activity before crimes take
place. With IBM InfoSphere Streams, police can use real-time data mining analytics to
provide the location of street gangs based on cell-phone and GPS devices. This information
could then be used to automatically send notifications to patrol cars to arrive at specific
locations in order to prevent crime (IBM, 2011).
Canadian National Railway (CNR), based out of Montreal, was a first-mover into the
use of SAP HANA powered by BusinessObjects Event Insight. Specifically, it is using the
software combination for near real-time visibility into fuel consumption and train handling.
CNR is able to extract data at the rail-car level, which provides g-force information. Based
on g-force levels, the complex event processors can make decisions based on the contents of
the rail car. If the g-force levels exceed a certain number, then the rail-car load is in danger
SOBIE 2014
257
of being damaged. Therefore, triggers built into the system can automatically send
notification to deploy a replacement shipment. CNR is also working on a way to use the data
provided by CEP to make operational decisions on “whether it would be cheaper to have a
train refuel at the next refueling station, or to send out a refueling truck” (Kanaracus, 2011).
Within the telecommunications world, Oracle CEP combined with TimesTen 11g is
providing practical solutions for cable companies. Household event data is provided by cable
boxes in customer’s homes. These boxes provided information in regard to the amount of
time a cable box is “On” and “Off.” Furthermore, the cable companies gather data based on
viewing trends. The result of the data aggregation is ability of cable companies to
immediately offer additional services based on recently watched TV shows (Oracle, 2011).
Roadway toll companies are also seeing the benefits of complex event processing. In
a use-case defined by Oracle’s website, toll road companies are using CEP to track the
amount of road traveled by cars and trucks. In effect, the toll company can charge exact
amounts based on the amount of road traveled. Systematically, the CEP system tracks entry
and exit points on a road equipped with active-sensor charging gates. Oracle CEP defines
triggers based upon when vehicles enter the specific roadway. The CEP system tracks the
exit point based on whether another trigger is “hit.” However, if only one trigger is
calculated by the system, then it is understood that the car exited the toll road, thus is charged
an exact amount (Oracle, 2011).
Both Oracle CEP and SAP Event Insight have found traction within the utilities industry.
Smart meter analytics is a capability provided by advancements in meter reading technology.
Traditional meter reading, in which an individual is sent on-site to read the kWh output of a
meter, is quickly becoming a thing of the past. Companies are replacing traditional meters
with ones that are equipped with antennas that provide data specific to power usage for
homes, neighborhoods, buildings, and regions. By monitoring via smart meters a CEP
system can understand usage patterns and automatically allocate power as needed. In
emergency situations, such as power outages, CEP systems are able to provide back-up
power to certain locations quicker than when traditional meters and grid systems were in
place (Oracle, 2011). Besides the organizations mentioned previously, others moving toward
live enterprises include: Avaya, Bear Stearns, Caterpillar, Cisco, Colgate-Palmolive, J.P.
Morgan, Nestle, P&G, Sprint, and T-Mobile.
Conclusion
In summation, in-memory databases are systems that rely on main memory for data
storage, instead of writing said data to a disk. Because data stays in main memory, it allows
REAL real-time data processing, as data is readily available. Previous 3-tier systems relied
on data being sent to database server, which wrote data to a disk, then retrieved it when
needed. IMDB brings the application and database tier together to increase speed at which
transactions and queries can be processed, reduce (or eliminate) disk space, and reduce the
amount of staff required for disk-memory systems. Complex event processing provides
firms that ability to take immediate action based on data collected in real-time. Used in
combination with each other, IMBD and CEP provide countless opportunities for many
different types of organizations to improve their reach and profit-generating capability.

SOBIE 2014
258
References
In-memory database. (2011, November 23). Retrieved October 11, 2011, from Wikipedia:
http://en.wikipedia.org/wiki/In-memory_database
Adrian, M. (2009, May 22). InfoSphere Streams Is A Game Changer. Retrieved November
15, 2011, from IT Market Strategy: http://public.dhe.ibm.com/software/data/sw-
library/ii/analystreport/ITMarketStrategy2009-InfoSphereStreams.pdf
Hilker, C. (2011). High-performance profitability analysis with SAP HANA CO-PA. ASUG.
Atlanta.
IBM. (2011). InfoSphere Streams for Smarter Governments. Retrieved December 3, 2011,
from IBM: http://www-01.ibm.com/software/data/infosphere/stream-computing/smarter-
governments.html
Illapani, P., Kwong, K., Herbas, F., & Welsh, C. (2010). SAP BusinessObjects Event Insight:
SAP's for Complex Event Processing Engine for the Business User. SAP.
Kanaracus, C. (2011, February 23). SAP Enters Complex-event Processing Market. PC
World.
Menninger, D. (2010, November 27). Advantages and Challenges of In-Memory Databases
and Processing. Retrieved November 5, 2011, from David Menninger Blob:
http://davidmenninger.ventanaresearch.com/2010/11/27/advantages-and-challenges-of-in-
memory-databases-and-processing/
Microsoft. (2011). Microsoft StreamInsight. Retrieved December 3, 2011, from MSDN
Microsoft: http://msdn.microsoft.com/en-us/library/ee362541.aspx
Oracle. (2008, March). KTF Improves Transaction Speed by 1,000% with Integrated
Authentication Service System. Retrieved October 14, 2011, from Oracle:
http://www.oracle.com/technetwork/database/timesten/overview/ktf-case-study-129821.pdf
Oracle. (2009, March). Deutsche Börse AG Triples Speed of Xentric Order Routing System
with In-Memory Database. Retrieved October 14, 2011, from Oracle:
http://www.oracle.com/technetwork/database/timesten/overview/deutsche-borse-db-
snapshot-130682.pdf
Oracle. (2009). Oracle TimesTen In-Memory Database. Oracle.
Oracle. (2011). Complex Event Processing FAQ and Use Cases. Retrieved November 11,
2011, from Oracle: http://www.oracle.com/technetwork/middleware/complex-event-
processing/faq-100486.html

SOBIE 2014
259
Oracle. (2011). Oracle Complex Event Processing. Retrieved December 3, 2011, from
Oracle: http://www.oracle.com/technetwork/middleware/complex-event-
processing/overview/index.html
Oracle. (Director). (2011). Oracle TimesTen In-Memory Database [Motion Picture].
Oracle. (2011). Smart Meter Analytics Overview. Retrieved November 20, 2011, from
Oracle: http://www.oracle.com/technetwork/middleware/complex-event-processing/faq-
100486.html) (http://www.sap.com/asset/index.epx?id=f202afc4-a780-4201-9a68-
a9db2121cd03&name=SAP-Smart-Meter-Analytics-Overview-Video
SAP. (2010, May 12). SAP to Acquire Sybase, Inc. Retrieved October 11, 2011, from
SAP.com: http://www.sap.com/press.epx?pressid=13202
SAP. (2011, March 11). SAP and IBM Test SAP® In-Memory Appliance Software and
Demonstrate Incredible Results. Retrieved October 13, 2011, from SAP:
http://www.sap.com/corporate-en/press.epx?pressid=14906
Sybase, Inc. (2010). Performance & Tuning for In-Memory Databases in Adaptive Server
Enterprise 15.5. Dublin: Sybase, Inc.
Thomasis, T. d. (2011, September 28). SAP HANA best suited for solving ERP performance
issues. Retrieved December 4, 2011, from TechTarget:
http://searchsap.techtarget.com/news/1280099273/SAP-HANA-best-suited-for-solving-ERP-
performance-issues
Vijayan, J. (2010, December 1). SAP's HANA will speed real-time data analytics. Computer
World, pp. 1-2.
SOBIE 2014
260
Does a Pitchers’ Height and Weight Impact Performance:
Evidence from Recent Major League Baseball Data
Abstract
A widely held belief in baseball is that taller, bigger pitchers have better performance.
This might explain why the average baseball pitcher is 6’3” and 215 pounds, while in
comparison the average male in the United States is 5’91/2” and 196 pounds. Over ninety
percent of all pitched innings have been from pitchers six feet or taller. While pitchers are
clearly tall, it is unclear whether a pitcher’s height and weight actually improve or even
impact their performance.
In this paper, we examine whether height and weight impact pitching performance in
the 2013 Major League Baseball season. We find little evidence that a pitcher’s height
contributes to positive outcomes, with some of our results suggest that being taller is a
drawback for pitchers and leads to poorer pitching outcomes. However, the main result in our
research is that most estimates are not statistically significant, suggesting that height does not
have an impact on pitching performance. The most likely explanation is probably that Major
League Baseball pitchers do not constitute a random sample and that only players with
proven pitching records make it to this highest level of baseball, whether it is because of or in
spite of their height.
Introduction
It is a commonly held belief among scouts, general managers, coaches and fans that
bigger, taller pitchers perform better. There are several theories of why a pitchers height and
size might impact their pitching. According to Bejan et al. (2012) and the constructural law
theory, the larger and taller an athlete is the more force he or she can apply to the ball as it is
hurled forward. Accordingly, the constructural law theory of sports evolution predicts that
height and weight for pitchers equates to velocity and greater speed. This is similar to golf,
where the average golfer in the top 10 of driving distance was on average 2.5 inches taller
than the golfers at the bottom 10. The idea is that a larger moving body can exert greater
force.
Taller pitchers also have longer arms, creating more torque accelerating the ball.
Taller pitchers are going to release the ball closer to the plate making it hidden from the hitter
longer and reaching the base more quickly from the point of release. This means that the
batter has less time to identify the pitch and must begin their swing earlier, making them
more likely to make an error. Similarly, longer arms give a pitcher more leverage on the ball
and thus the ability to throw faster (Ramsey, 2007).
According to Gassko (2006) bigger and taller pitchers may do better since their
bodies can endure more stress. Thin pitchers do not pitch for as many years and are much
less likely to be pitching at age 32 than all other pitchers. However, height does not seem to
matter for survival or longevity. Taller pitchers allow for fewer home runs and more strike
than short pitchers, but he suggests that may be due to the angle of their pitches. This
different angle makes pitches look like they are coming from the sky and appear as if they
SOBIE 2014
261
will be out of the strike zone, but gravity pulls it into the strike zone. A sinking ball is more
likely to hit into the ground than a ball traveling horizontally. Along with gravity this
downward movement is also a little faster. Taller pitchers may also appear more
intimidating. Taller, bigger pitchers bring a more immediate fear, not because of their ability
but because of how they look on the mound.
Another explanation is that there is a selection bias that occurs in earlier grades. This
selection bias for tall pitchers over short pitchers, may mean that only the best shorter
pitchers get a shot, while taller pitchers are given chances more freely. Similarly, shorter
pitchers, especially right handed pitchers, know that they have very few chances so they
work harder.
While pitchers are clearly getting taller, it is not clear that taller, bigger pitchers
outperform smaller pitchers. “While the 69 best pitchers give hope to the bigger is better
theory that many scouts, general managers, coaches and fans have assumed true for
generation” (Lincoln, 2008), it appears to only be true for the top ten percent. Their results
found that when you examine all pitchers there is little correlation between height and
innings pitched or strikeouts, and there is only a very low correlation of (0.086) between
height and VORB (value over replacement pitcher) in 2007.
One explanation for the lack of correlation between a pitcher’s size and performance,
may be explained by Gladwell’s (2013) inverted-U curve. Relating performance to size in
this case, we can see that at the beginning of the inverted-U curve which is represented by
smaller pitchers, an increase in weight increases pitching performance. This is followed by
the middle of the inverted U-curve, where an increase weight for the mid-size pitchers has
little impact on performance and then to the right of the inverted U-curve with the tallest
pitchers, extra weight actually starts to hurt pitching performance. Thus, adding weight (or
strength) helps performance up to a point, but after that point weight gain doesn’t help and
can eventually hurt a pitchers performance. This can be seen in Figure 1 below, which shows
pitching performance and size (measured as height or weight).

SOBIE 2014
262
Figure 1: Pitching Performance and Size
SOBIE 2014
263
Cressey (2013) found that pitching is a combination of absolute and relative strength
and power. From an absolute standpoint, more body weight equates to more force to push off
the mound taken by the front leg, and more momentum moving downhill; that’s why gaining
weight can have such a profound impact on pitching velocity.” In contrast, from a relative
strength and power standpoint, eventually you max our on the force that you can create. He
finds that pitchers over 6’5” do not thrive with weight gain the way that shorter guys do.
Additionally, according Werner et al., the distraction forces on the shoulder are
approximately 108% of body weight. Thus while an increase in body weight increases arm
speed, it also increases shoulder distraction, which can create a negative impact on the body
and thus overall performance. This is supported by Gassko’s (2006) results showing that
players 5’11 or shorter and pitchers 21 pounds or more overweight perform better than
pitchers that are 6’5” or taller and 21 pounds underweight. However, he also finds that tall
pitchers allow for fewer homeruns and more hits, which may occur because of the slope of
the pitch that generates more ground ball tendencies for taller pitchers. His results show that
less than 50% of thin pitchers survive to 32, suggesting that weight might help with
durability. These conflicting results, suggest that it is not clear if an increase in weight or
height should have a positive impact on pitching performance.
While it is unclear if it is better for a pitcher to be taller and bigger, it is clear that the
typical pitcher is much taller and bigger than the typical U. S. male. While today the average
baseball pitcher is over 6’2” and 215 pounds, the typical American male is 5’9” and 196
pounds. According to St. Onge et al. (2008), pitchers are 20 pounds heavier than the general
population, but less obese. Not only are pitchers taller than the general population, they are
taller than they were in the past. From 1960 to 2010 MLB players increased their height by
1.1 inches and their body weight by 23 pounds. By 2010, pitchers that were 6’2” pitched
more innings than pitchers of any other height. In fact, 92.2 percent of innings pitched since
1960 have come from pitchers 6’0” or above and 99.3 percent of all innings pitched are from
pitchers 5’10” or over (Lee, 2010). In 2009, all buy 2 of the top 20 fastest pitchers were 6’2”
or taller and in 2013, the top 10 strikeout pitchers were an average height of 6’5” While the
majority of pitches today are thrown by players who are atleast 6’2”, less than 5% of the U.S.
population is over 6’3”.
Graph 1 shows that in 2013, fifty percent of all MLB pitchers were between 6’1” and
6’4” and that ninety percent of all pitchers were between 6’ and 6’5”. Only 7.5 percent of
pitchers or 14 people are shorter than 6 feet and only 17 pitchers are taller than 6 feet, 6
inches. This demonstrates that there is very little variation in height and suggests that at least
for MLB pitchers there appears to be a body type. (We also allowed for the possibility of
non-linear effects of height on pitching performance. Results are similar and available upon
request.) Not only are pitchers taller than the general population they are also taller than
other baseball players on the team. According to Christopher Lee, since 1960 the tallest
players on the field are pitchers at 74.2 inches, while short stop are the shortest players with
an average height of 71.2, a difference of 3 inches. Today, the average player of the MLB is
close to 6’1.

SOBIE 2014
264
Graph 1: Frequency Distribution of MLB Pitchers Height Included in Regressions
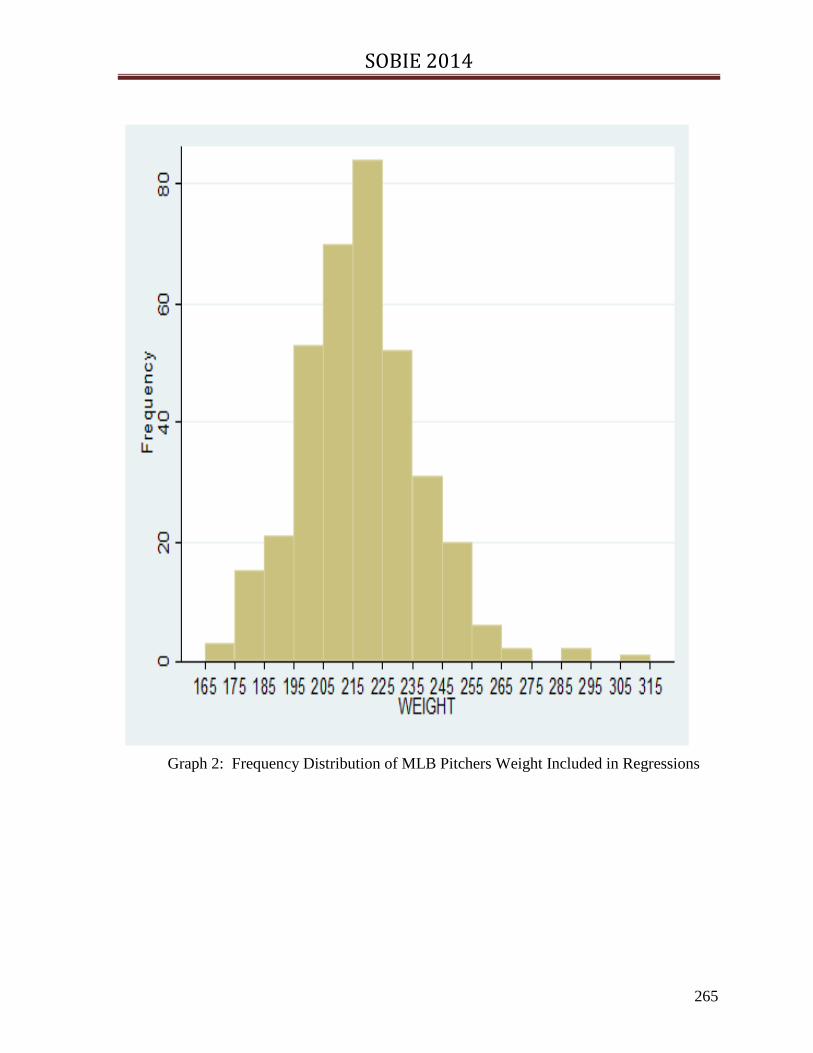
SOBIE 2014
265
Graph 2: Frequency Distribution of MLB Pitchers Weight Included in Regressions

SOBIE 2014
266
Graph 3: Frequency Distribution of MLB Pitchers BMI Included in Regressions

SOBIE 2014
267
Results in Graph 2 and 3 show that pitchers are bigger than the general population.
The average pitcher’s weight is close to 220 pounds, plus or minus 15 pounds. Graph 2
displays very little variation in pitchers’ weight, showing that with few exceptions, there is
very little disparity between the smallest and the biggest pitchers. Graph 3 shows that BMI
also shows a very tight distribution of pitchers size, with a typical pitcher having a BMI close
to 27. Such a high BMI would suggest that most MLB pitchers are overweight, however not
all weight is created equal. It depends on whether you care the extra weight in arm, chest,
and leg muscles or around the core, which might alter a pitchers throw. We believe that most
of the pitchers today are heavier due to muscle mass and weight training, not just too many
hot dogs.
Collectively, these graphs suggest there is a specific body type for MLB players
consisting of them being 6’3”, 220 pounds, with a BMI of 27, with very little variation.
According to Cressy (2013), the sweet spot for pitchers appears to by 6’3” 220 pounds.
While he suggest that it is beneficial for a smaller guy to add weight, he finds that the heavier
a person is the less sensitive they are to weight changes and that adding weight to a taller
frame can do more harm than good. Similarly, he suggests that the prime age of pitchers is
between 26 to 32. While this allows players to obtain more experience, he finds that
eventually getting older and throwing more innings reduces itching velocity. This was also
supported by Dun et al (2006) who find that baseball players’ peak in their late 20s and early
30s. In this paper, we examine the impacts of height and weight on pitching performance
controlling for experience, pay and whether they are right or left handed.
Estimation and Data
We obtained data on Major League Baseball (MLB) pitchers for the 2013 regular
season from baseball-reference.com. The URL for this particular data set is
http://www.baseball-reference.com/leagues/MLB/2013-standard-pitching.shtml, and the data
was augmented by individual pitchers’ data on (relatively) fixed variables such as height and
weight by following the hyperlink for individual players on the above-mentioned Web page.
We have observations for all the variables of interest on 360 MLB pitchers for the 2013
season. The following table shows the means and standard deviations of the variables that are
included in our analysis.
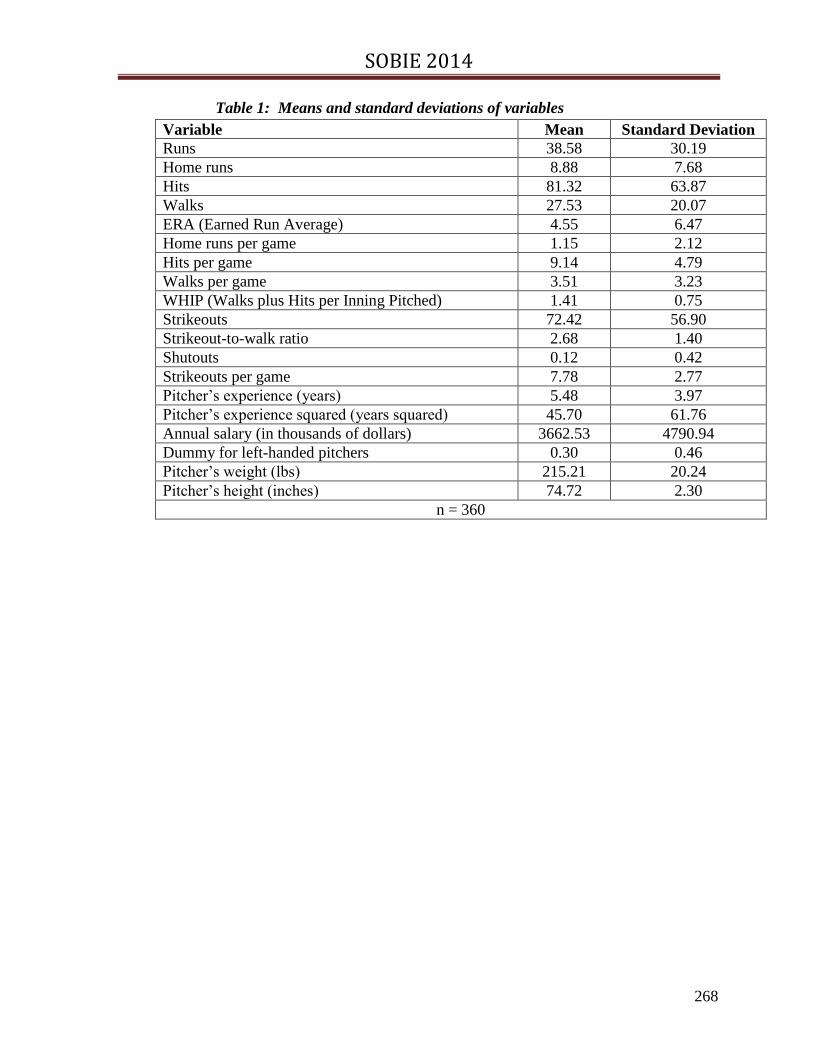
SOBIE 2014
268
Table 1: Means and standard deviations of variables
Variable Mean Standard Deviation
Runs 38.58 30.19
Home runs 8.88 7.68
Hits 81.32 63.87
Walks 27.53 20.07
ERA (Earned Run Average) 4.55 6.47
Home runs per game 1.15 2.12
Hits per game 9.14 4.79
Walks per game 3.51 3.23
WHIP (Walks plus Hits per Inning Pitched) 1.41 0.75
Strikeouts 72.42 56.90
Strikeout-to-walk ratio 2.68 1.40
Shutouts 0.12 0.42
Strikeouts per game 7.78 2.77
Pitcher’s experience (years) 5.48 3.97
Pitcher’s experience squared (years squared) 45.70 61.76
Annual salary (in thousands of dollars) 3662.53 4790.94
Dummy for left-handed pitchers 0.30 0.46
Pitcher’s weight (lbs) 215.21 20.24
Pitcher’s height (inches) 74.72 2.30
n = 360

SOBIE 2014
269
Data Analysis
Dependent Variables
In order to examine the impact of height and weight on a pitcher’s performance while
controlling for other relevant factors, we regressed a variety of measures for pitcher
performance on a number of explanatory variables. We include several commonly used
measures to assess a pitchers performance. As measures that are considered “bad” outcomes
for the pitcher, we use baseball statistics that are regarded as successes for the opposing
batter, including walks, hits, runs, and home runs. As mentioned in the heading, all these
measures capture a pitcher’s performance over the course of the season. One issue with that
is that players who get more playing time are likely to accumulate higher numbers than
players who do not play as much. Arguably, a better measure of pitching performance would
be on a per-game basis.
One of the most widely used statistics in evaluating baseball pitchers per game is the
Earned Run Average (ERA, calculated as the number of earned runs given up by a pitcher
per nine innings pitched). Similarly, we also examine walks per game, hits per game, and
home runs per game were calculated by extrapolating the actual numbers in a game to a (in
most cases hypothetical) 9-inning game played by the pitcher. Another widely use
sabermetric measurement we used as a dependent variable is Walks plus Hits per Inning
Pitched (WHIP), which, as the name suggests, indicates a pitcher’s average walks and hits on
a per-inning basis.
All the statistics to measure pitchers’ performance discussed so far were successes for
the opposing batter, i.e., they were “bad” things for the pitcher. There are various measures
that are available in our data set that are considered successes for pitchers. We re-ran a set of
regressions on the same set of explanatory variables with those measures for pitching
success. On a per-season basis, they were: Strikeouts, strikeout-to-walk ratio, and number of
shutouts.
Once again, one might argue that a more meaningful way to assess a pitcher’s
performance would be a measure that is calculated on a per-game basis. Hence, we also ran a
regression that has “strikeouts per game” as the dependent variable
Independent variables
In order to study whether a pitcher’s size has a meaningful impact on the various
measures of pitching performance discussed above, we regressed a pitcher’s height and then
weight along with a set of independent variables that, a priori, can be thought of as having an
impact on pitcher performance. The following section provides the motivation for including
those variables as regressors along with an explanation of their construction, as applicable.
Our variables of interest are a pitcher’s height and weight. It is a widely-held belief in
baseball that a player needs to be tall and big to be a good pitcher. We are interested in the
impact that height has on the various measures of pitching performance after a number of
other factors are controlled for.
SOBIE 2014
270
+
As controls, we included the following variables in our regressions: pitcher’s weight,
hand preference, salary and experience. While a pitcher’s height has a positive correlation
with a pitcher’s height (correlation coefficient r = .50), the correlation is not strong enough to
only use the pitcher’s height. Weigh may be an indication of a pitcher’s strength, durability,
or ability to move quickly, which may have an impact on the dependent variables used in the
analysis. It is clear that managers and coaches care whether a pitcher is right handed or left
handed, thus we use a dummy for left-handed pitchers: This variable takes on a value of “1”
if a pitcher is listed as left-handed in the baseball-referfence.com database, “0” otherwise. It
will capture any possible difference in the various pitching outcomes that may exist between
left-handed and right-handed pitchers.
Presumably, pitchers get better over time as they gain experience. In order to account
for that effect, we created a variable that is constructed by subtracting a pitcher’s age when
he debuted in Major League Baseball from his current age. As suggested by Cressy (2013),
the sweet spot for baseball player’s is between the age of 26-33.
It is quite possible that the experience variable does not have a linear effect since the
impact of experience on pitching performance may be stronger for younger players, but
diminish over time. To allow for that possibility of a non-linear effect, we include the square
of the experience variable as an additional regressor.
We also control for annual salary. This variable, measured in thousands of dollars, is
also included in the individual player statistics that are accessible from baseball-
reference.com. For multi-year contracts, we used the overall compensation and divided it by
the number of years of the contract. While it can be argued that good pitching performance
results in a contract with high compensation (i.e., that causation runs from performance to
salary), such an effect has a time lag, i.e., pitchers who perform well (especially early on in
their career) will often be rewarded financially in a future contract that is more lucrative than
their current contract. We include the salary variable because pitchers are arguably paid high
salaries currently because they are expected to perform well.
Results
Contrary to popular belief held by scouts, general managers, coaches and fans , our
results in Table 2 suggest that being taller does not appear to improve pitcher performance.
In fact, results in Table 2 show that in height has the wrong sign and it is not statistically
significant. This is true for the season as well as per game.
Perhaps the most notable result of Table 2 is that the majority of estimates are not
what could be considered statistically significant using any conventional significance level.
While it is a basic tenet that the fact that no effect could be found does not prove that no such
effect does exist, the persistent lack of statistically significant estimates despite a good
number of variations of models estimated does provide some indication that there may be
few meaningful relationships between most of the dependent variables used and the
independent variables in general and the height variable in particular. In addition to low p-
values, many of the R-Squareds in the table above are quite low. More specifically, the
highest R-Squareds are for regressions with per-season measures of pitcher performance.
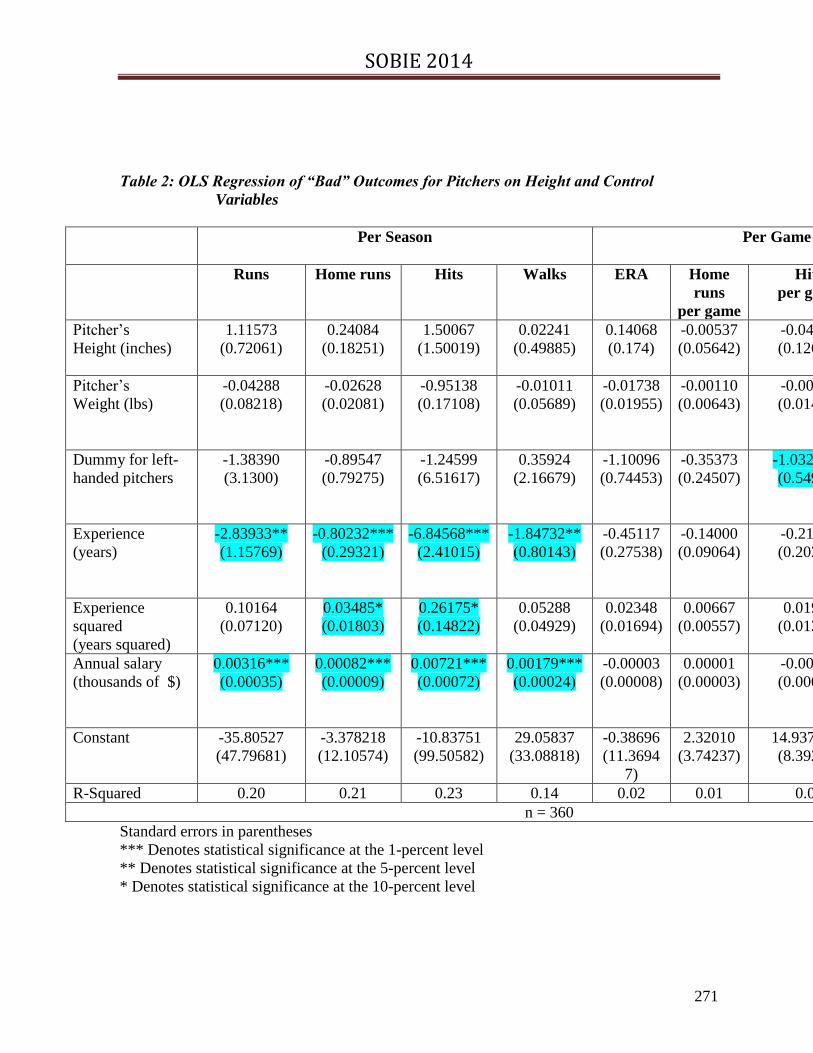
SOBIE 2014
271
Table 2: OLS Regression of “Bad” Outcomes for Pitchers on Height and Control
Variables
Per Season Per Game Per
Inning
Runs Home runs Hits Walks ERA Home
runs
per game
Hits
per game
Walks
per game
WHIP
Pitcher’s
Height (inches)
1.11573
(0.72061)
0.24084
(0.18251)
1.50067
(1.50019)
0.02241
(0.49885)
0.14068
(0.174)
-0.00537
(0.05642)
-0.04865
(0.12652)
0.09211
(0.08535)
0.00487
(0.0199
6)
Pitcher’s
Weight (lbs)
-0.04288
(0.08218)
-0.02628
(0.02081)
-0.95138
(0.17108)
-0.01011
(0.05689)
-0.01738
(0.01955)
-0.00110
(0.00643)
-0.00603
(0.01443)
-0.00817
(0.00973)
-
0.00159
(0.0022
8)
Dummy for left-
handed pitchers
-1.38390
(3.1300)
-0.89547
(0.79275)
-1.24599
(6.51617)
0.35924
(2.16679)
-1.10096
(0.74453)
-0.35373
(0.24507)
-1.03236**
(0.54956)
-0.25205
(0.37072)
-
0.14234
(0.0867
1)
Experience
(years)
-2.83933**
(1.15769)
-0.80232***
(0.29321)
-6.84568***
(2.41015)
-1.84732**
(0.80143)
-0.45117
(0.27538)
-0.14000
(0.09064)
-0.21695
(0.20327)
-0.06542
(0.13712)
-
0.03131
(0.0320
7)
Experience
squared
(years squared)
0.10164
(0.07120)
0.03485*
(0.01803)
0.26175*
(0.14822)
0.05288
(0.04929)
0.02348
(0.01694)
0.00667
(0.00557)
0.01928
(0.01250)
0.00135
(0.00843)
0.00228
(0.0019
7)
Annual salary
(thousands of $)
0.00316***
(0.00035)
0.00082***
(0.00009)
0.00721***
(0.00072)
0.00179***
(0.00024)
-0.00003
(0.00008)
0.00001
(0.00003)
-0.00007
(0.00006)
-0.00007*
(0.00004)
-
0.00002
(0.0000
1)
Constant -35.80527
(47.79681)
-3.378218
(12.10574)
-10.83751
(99.50582)
29.05837
(33.08818)
-0.38696
(11.3694
7)
2.32010
(3.74237)
14.93712**
(8.39219)
-0.97613
(5.66109)
1.55215
(1.3241
6)
R-Squared 0.20 0.21 0.23 0.14 0.02 0.01 0.02 0.03 0.02
n = 360
Standard errors in parentheses
*** Denotes statistical significance at the 1-percent level
** Denotes statistical significance at the 5-percent level
* Denotes statistical significance at the 10-percent level

SOBIE 2014
272
One potential explanation for the lack of impact that size has on performance is that it
may be due to Gladwell’s (2013) inverted U curve, suggesting that an increase in size helps
when you are smaller, has little impact if you are in the middle and can actually hurt you if
you are too big. As Jay Nolan suggest, being too tall or big may slow you down, reduce your
balance and makes it generally harder to control your body positioning.
Results in Table 2 show that increases in salary reduces pitching performance over
the season and is statistically significant at conventional levels. One explanation for the
unexpected sign and impact in our results is that instead of salary having a causal impact on
player performance, the experienced, highly-paid players get more playing time, hence
creating a statistically significant correlation with measures such as hits, walks, runs and
homeruns. However, almost all of those statistically significant effects of salary on the
various performance measures for pitchers disappear once the dependent variable is a per-
game or per-inning measure, and the R-Squared becomes very low in those regressions.
A plausible explanation for the observed relationships is that high-salary pitchers are
star players who will play “by default.” That is, the statistically significant relationships
between per-season measures on the left-hand side and salary are a statistical artifact that
shows that high-salary pitchers play in more games than less-highly paid pitchers. This
result supports that of Wiseman and Chatterjee (2003) showing that higher pay leads to better
performance. However the impact is very small, supporting results by Blass (1992) that
suggest that many players are overpaid and that their pay is not tied to current, but past
performance.
Experience also appears to reduce performance for the season, but helps overall
performance per game. Results from Table 2 consistently show that increases in experience
help to reduce hits, runs, walks, and home runs. These results are statistically significant and
contradicts results found by Bass (1992), who found that increases in experience increased
salary, but not necessarily productivity. Results also support those found by Greenberg
(2010) suggesting that being a left handed pitchers helps pitching performance.
Results in Table 3 continue to show that height and weight have very little impact on
a pitchers’ performance, once they are in the majors. This result supports that of Nate Silver
(2005) who finds that pitchers performance is not as related to body size as offensive play.
Looking at pitchers from 2004, he finds only a very week correlation between height and
strikeouts. Again, results suggest that experience and salary are statistically significant but
small impact on pitching performance.
We next investigated whether height, weight, and BMI has different effects
dependent on where in the distribution a pitcher is. For example, as suggested by the inverted
U curve it could be that an increase in height does not have a beneficial impact for a pitcher
who is close to the median of the height distribution, but it may help a pitcher’s performance
if they are among the shortest pitchers or hurt performance for the taller pitchers. We first
estimated the previously presented regression model with ERA as the dependent variable.
The regressors in the first two sets of regressions are height, weight, a dummy for left-handed
pitchers, salary, experience, and experience squared. The height and weight variables are
replaced by BMI in the third set of regressions (shown in Table 4 in the third column below).
Below are the estimated coefficients results.
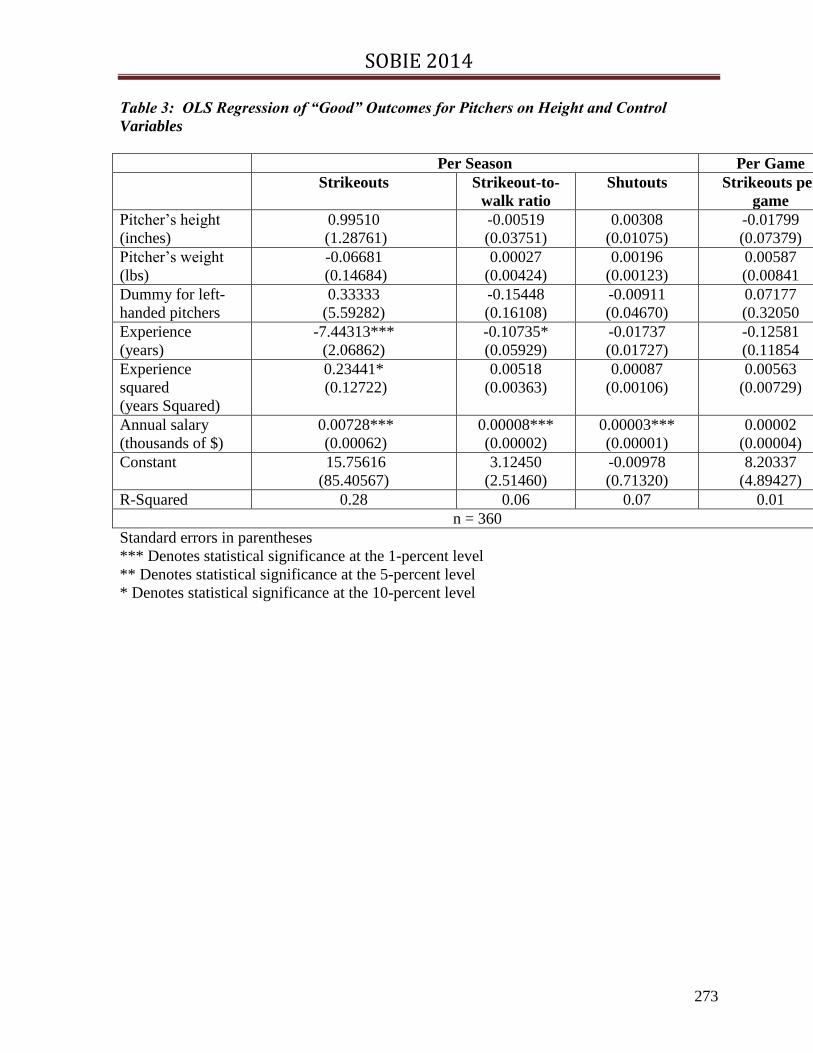
SOBIE 2014
273
Table 3: OLS Regression of “Good” Outcomes for Pitchers on Height and Control
Variables
Per Season Per Game
Strikeouts Strikeout-to-
walk ratio
Shutouts Strikeouts per
game
Pitcher’s height
(inches)
0.99510
(1.28761)
-0.00519
(0.03751)
0.00308
(0.01075)
-0.01799
(0.07379)
Pitcher’s weight
(lbs)
-0.06681
(0.14684)
0.00027
(0.00424)
0.00196
(0.00123)
0.00587
(0.00841
Dummy for left-
handed pitchers
0.33333
(5.59282)
-0.15448
(0.16108)
-0.00911
(0.04670)
0.07177
(0.32050
Experience
(years)
-7.44313***
(2.06862)
-0.10735*
(0.05929)
-0.01737
(0.01727)
-0.12581
(0.11854
Experience
squared
(years Squared)
0.23441*
(0.12722)
0.00518
(0.00363)
0.00087
(0.00106)
0.00563
(0.00729)
Annual salary
(thousands of $)
0.00728***
(0.00062)
0.00008***
(0.00002)
0.00003***
(0.00001)
0.00002
(0.00004)
Constant 15.75616
(85.40567)
3.12450
(2.51460)
-0.00978
(0.71320)
8.20337
(4.89427)
R-Squared 0.28 0.06 0.07 0.01
n = 360
Standard errors in parentheses
*** Denotes statistical significance at the 1-percent level
** Denotes statistical significance at the 5-percent level
* Denotes statistical significance at the 10-percent level
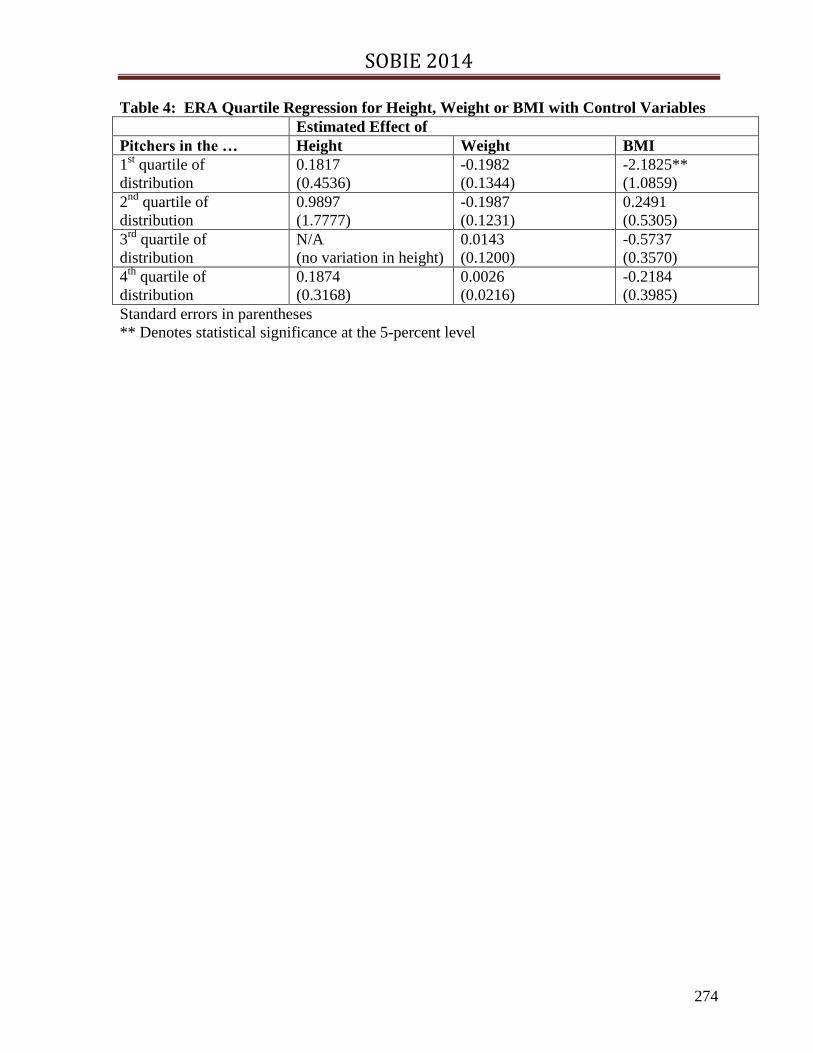
SOBIE 2014
274
Table 4: ERA Quartile Regression for Height, Weight or BMI with Control Variables
Estimated Effect of
Pitchers in the … Height Weight BMI
1st quartile of
distribution
0.1817
(0.4536)
-0.1982
(0.1344)
-2.1825**
(1.0859)
2nd
quartile of
distribution
0.9897
(1.7777)
-0.1987
(0.1231)
0.2491
(0.5305)
3rd
quartile of
distribution
N/A
(no variation in height)
0.0143
(0.1200)
-0.5737
(0.3570)
4th
quartile of
distribution
0.1874
(0.3168)
0.0026
(0.0216)
-0.2184
(0.3985)
Standard errors in parentheses
** Denotes statistical significance at the 5-percent level

SOBIE 2014
275
As can be seen in Table 4, almost all of the estimated effects are not statistically
significant at any conventional level. The one exception is the effect of BMI on a pitcher’s
ERA for pitchers whose BMI places them in the lowest quartile of the BMI distribution,
supporting the idea of a potential inverted U curve for BMI. The p-value of that estimate is
0.048 and the estimate suggests that an increase in a pitcher’s BMI of one would, on average,
decrease the ERA by slightly more than two, which is a substantial decrease given that the
mean BMI in the data set is approximately 4.5. Weight gain for the shortest players will help
to increase their BMI, which is then shown to reduce their ERA. This suggests that shorter
players could benefit from strength and weight training much more than taller pitchers.
So what other factors play a role in determining pitching performance? We can think
of a number of variables that matters, but that are not captured in our data set. For one, there
are numerous “immeasurables” such as a pitcher’s innate ability, his understanding of the
game and how to pitch given a certain situation, effort or determination to win, handling of
poor weather conditions, etc. Other possible factors are measurable, but are not included in
our data set. Examples include the number of different types of pitches (fastball, curveball,
slider, sinker, etc.) that a pitcher has at his disposal, speed of a pitcher’s fastball, proneness to
injury, and physical strength.
Conclusions and Extensions
Contradictory to popular opinion, results suggest that being taller and/or bigger is not
better for a pitcher. Results suggest that size does not improve pitching performance and that
being bigger might actually hurt a MLB pitcher’s performance. Height, weight and BMI are
not statistically significant using any measure of pitching performance. Results do suggest
that more experience increases a pitchers performance, suggesting that maybe scouts should
recruit pitchers based on their experience not there size.
While not statistically significant, the fact that an increase in a pitcher’s height seems
to be associated with worse outcomes in most of the estimations deserves further
examination. One possibility is that results are driven by the extreme values, e.g., it could be
that height does not play a big role for, say, the middle two quartiles, but becomes a negative
factor for extremely large pitchers. Results also may be driven by the lack of variation in
MLB pitcher size. Again, most pitchers are close to 6’3” and 215 pounds, with very little
variation.
A more plausible explanation may be that there is a selection bias that occurs well
before pitchers make it to the pros. It might be that taller kids are encouraged from a very
early age to become pitchers and that only the best shorter or smaller players are ever given a
chance to pitch.
While our results suggest that pitchers height and weight does not increase
performance, there has been a clear increase in pitcher’s size over the past few decades. To
examine how the increase in size, especially relative to the general population, over the past
few years impacts performance, we would like to extend our data to include several years of
data and then examine how height and weight impact pitching performance.
Results also suggest that paying pitchers more has very little impact on their pitching
performance. If paying pitchers more does not improve results, it is unclear why owners
would waste their money on high salaries for pitchers. However, there could be a lag
between past pay and future performance or vice versa. We would like to further examine
SOBIE 2014
276
the relationship between pitcher performance and salary by expanding our data set over
several years. It might be that there is a lag between performance and pay.
References
A. Bejan, S. Lorente, J. Royce, D. Faurie, T. Parran, M. Black, and B. Ash, “The Constructal
Evolution of Sports with Throwing Motion: Baseball, Golf, Hockey and Boxing” the
International Journal of Design and Nature and Ecodynamics, 2012, Vol. 0, No. 0, 1-16.
Blass, Asher, A. “Does the Baseball Labor Market Contradict the Human Capital Model of
Investment?” The Review of Economics and Statistics, 1992, Vol. 74 No. 2, May, 261-268.
Cressy, Eric, “Body Weight and Pitching Veocity. The Sabathia Conundreum”, Nov. 2.
2013.
Dun, S., G. Fleisig, G., Loftice, J., Kingsley, D. and J. Andrews “The Relationship Between
Age and Baseball Pitching Kinematics in Professional Baseball Pitchers”, Journal of
Biomechanics, 2006, Vo. 40, 265-270.
Gassko, David, “Does Size Matter”, September, 2006.
Gladwell, Malcolm, David and Goliath: Misfits, Underdogs, and the Art of Battling Giants
2013.
Greenberg, Glenn P. “Does a Pitcher’s Height Matter?” Baseball Research Journal, 2010,
Fall.
Hamilton, Lincoln, “Scouting Science: Does Height Matter for MLB Pitchers”, Project
Prospect, February 7, 2008.
Lee, Christopher, Scouting Science, March 2010.
Ramsey, Wayne, “Why tall baseball pitchers are better than short pitchers”, March 19, 2007.
Saint Onge, James, M. Patrick M. Kruger, and Richard G. Rogers, “Historical trends in
height, weight, and body mass: Data from U.S. Major League Baseball Players, Economics
ad Human Biology, 2008, Vol. 6, issue 3, December, 482-488.
Silver, Nate “Lies, Damned Lies, Does Size Matter” Baseball Prospectus, April 2005.
Werner, S., M. Suri, J. Guido, K. Meister, D. Jones, “Study Proves Body Weight is Pitching
Velocity Factor” Journal Shoulder Elbow Surgery, 2008, Nov.-Dec. (17) 6, 905-908.
Wiseman, F. and S. Chatterjee, “Team Payroll and Team Performance I Major League
Baseball: 1985-2002” Economics Bulletin, 2003, Vol. 1, No. 2, 1-10.
SOBIE 2014
277
Using the Cloud to Teach ERP
Kevin Lee Elder, Georgia College & State University
Ron MacKinnon, Georgia Southern University
John Dyer, Georgia Southern University
Abstract
SAP has traditionally been the domain for the Fortune 500, companies with millions
to spend on an ERP. Much the same has been the teaching of SAP Enterprise Resource
Process (ERP) has followed the traditional IaaS (Infrastructure as a Service) model with a
large mainframe ERP system that has kept ERP in the IS student domain and out of other
disciplines. With SAP Business ByDesign, one of SAP's Software as a Service (SaaS) cloud
solutions we have been very successful working with both technical and non-technical
students. It is the ease with which non-technical business students can complete exercises
throughout any business process that is exciting to educators. Small and medium business
professionals should also take note to see how easy Business ByDesign is to implement and
use. Exercises that students can complete range from standard procurement, to HR, to
Business Intelligence, to Mashups, and analytics/reporting and beyond. If you only have
experienced the big SAP ERP systems, read on to see what the cloud is all about and how
SAP can help you harness it, while learning about a university where you might want to hire
your next employees.
Background
The Enterprise resource planning (ERP) system is a large, complex software package
that provides an integrated real-time environment based on an enterprise-wide data model
with a set of software applications that allow processing of the core transactional data of the
organization (Bancroft, Seip, & Sprengel, 1998). The past research literatures has renewed
the understanding of ERP systems throughout the last decade. The researchers have split the
past decade into four main periods. First, in the late 1990s, enterprises have requested the
ERP system to cover all inter-organizational activities apart from the business network
instead to require a mere material planning system. In the early 2000s, the expectation of the
enterprises has shifted from a large number of unintegrated IT functions to a single integrated
backbone. In the mid-decade, the enterprises requested to implement an ERP suite from one
vendor that incorporated stand-alone point solutions to reach higher degree of integration and
improve customer relationship and the supply chain’s overall efficiency. Late in the decade,
alternative approaches such as hosting, subscription-based pricing, and SaaS (Software as a
Service) technology have attracted increasing attention (Shaul & Tauber, 2013).
Benefits of ERP Implementations
ERP implementation brings a lot of business benefits to organizations, such as the
business benefit of improved management decision-making is an important goal of ERP

SOBIE 2014
278
system adoption. (Staehr, 2010) A researcher conducted an investigation related to the
rationales and business benefits for why organizations have a desire for ERP
implementations. That research covered 12 industries and broke organizational agreed
business benefits into tangible and intangible categories. According to (Deloitte, 1998) the
tangible benefits include inventory reduction, personnel reduction, productivity
improvements, order management improvements, financial close cycle reduction, IT cost
reduction, procurement cost reduction, cash management improvement, revenue/profit
increases, transportation/Logistics cost reductions, maintenance reductions and on-time
delivery. Meanwhile, ERP system also bring intangible benefits including
information/visibility, new improved processes, customer responsiveness, cost reduction,
integration, standardization, flexibility, globalization, Y2K, business performance and
supply/demand chain. There are other business benefits, O'Leary (2004) found a number of
new benefits include acquisitions, new reports/reporting capability, sales automation, change
business model/competitive advantage, growth, financial controls, better decisions, leverage
size, increased time for analysis, no redundant data entry, reduce training with transfer and
speed.
Drawbacks of ERP Implementations
As researchers have investigated the main drawbacks of the ERP implementation
projects are too complex, demanding, expensive and risky (Stanciu & Tinca, 2013).
Furthermore, a new survey on the small businesses shows about half of the investigated ERP
projects taking longer time than expected, are exceeding the initial cost and budget, and
lowering registered benefits realization (Krigsman, 2011).
Successes with ERP Implementations
CBR (2011) presented that the ERP market size has had stable growth over the past
number of years with $43bn in 2010, and $40.6bn in 2009. Furthermore, the new prediction
and observation has displayed that the global ERP market will meet $45.5bn, and to $50.3bn
by 2015. This growth should show the excellent performance is enabled through the
successful ERP implementation projects and strategies.
Enterprise Resource Planning applications allow users to centralize departmental
data. In the past, each department would create and maintain its own data and then generate
reports to influence resource planning. ERPs function across all departments of an enterprise
and report from a central system. The application essentially takes the enterprise’s data and
converts it into knowledge that is then used to make informed decisions on business strategy
(Gupta 2000).
Experiences of ERP Use in Small Enterprises
There have been two difficulties associated with ERPs with smaller enterprises. The
first is establishing and maintaining the Information and Communications Technologies
(ICT) infrastructure necessary to run these platforms and the second is the ability to
determine the benefits realization. We are seeing the infrastructure necessary to operate

SOBIE 2014
279
these platforms reduced in the last few years due to the emergence of web-based, Software as
a Service (SaaS) platforms. Much of the past research accomplished in the area of ERPs in
Small-to-Medium Enterprises (SME) and even microenterprises has been based on countries
like India and China where these smaller enterprises make up the majority of their economies
and have focused on those entrepreneur’s and employee’s inability to implement the
application as well as having the resources needed to invest in the required ICT
infrastructure. Overall, ERP implementation in India has been found to have a beneficial
relationship to inventory, customer service, and communications (Kale, Banwait, & Laroiya
2010). So far, research does not provide any empirical data on this subject. It has, however,
pointed to ERPs ability to highlight the relative importance of organizational processes and
how they provide business value (Uwizeyemungu & Raymond 2012).
ERP adoption in SMEs has been the subject of much research. Whereas large
enterprises tend to struggle with the change aspect of implementing an enterprise-wide
software package, SMEs struggle with knowledge constraints associated with handling such
a robust package (Laukkanen, Sarpola, & Hallikainen 2007). This is a telling trait of ERP
use and will probably reflect on its use by microenterprise owners. Ultimately, we may need
to have a better understanding of how strategies need to be different for each enterprise level
for ERPs to be effective (Bohorqvuez & Esteves 2008). Part of these strategies will most
likely focus on how well ERPs can be customized to support the needs of these different
sized enterprises (Zach & Munkvold 2012). For this flexibility to occur, vendors will have to
focus energies on understanding the organizational climates and technical perspectives of
smaller enterprises (Upadhyay, Jahanyan, & Dan 2011).
The last few years have seen the infrastructure as a service platform, grow from being
just a promising business concept to one the fastest growing platform of the information
technology department (Dawoud, Takouna and Meinel, 2011). Post the recession;
organizations have been realizing the effectiveness of adopting an infrastructure as a service
platform. They are increasingly realizing the power of such infrastructures and the fact that
by the simple adoption of these infrastructures, they can gain fast access to top notch
business and client applications and boost their resources drastically, at negligible cost. A
striking 91 percent of the organizations in United States and Europe agreed that reduction in
cost is the primary reason for them to switch to infrastructure as a service environment (Van
Vactor, 2012). According to Gartner, the cloud-based security services market will reach
$4.2 billion by 2016. This is primarily due to direct cost savings from ease of deployment
and a considerably reduced technology maintenance burden.
Cloud Computing. Benefits, risks and problems for SMEs
There are many factors which should be minded when small and medium-sized
enterprises are trying to adopt cloud computing application in their business. Budriene &
Zalieckaitė (2012) explains the environment in which such businesses are acting and
describes problems and challenges. These small enterprises could develop their own
information and communication technology structure and strategy. Furthermore, a good
example is Ireland. Carcary et al. (2013) describe Irish small and medium sized enterprises as
an example for the adoption of cloud computing. They mentions that the cloud computing
SOBIE 2014
280
sector is still growing. In the year 2011 it was the top technology priority worldwide and the
market will grow up to 241 billion in the next 6 years. Cloud computing saves money (cost
reduction), improves the scalability and many more parts. SME are different to the bigger
companies and this is one reason why cloud computing offers big advantages for these
companies. Half of the investigated companies in Ireland did not adopt any cloud services.
Most of the others, who have adopted cloud services, did not do it deep enough for their
business (Carcary, Doherty, & Conway, 2013). On the other hand using cloud computing
has risks and treats for enterprises. There are risks in the phase of the adoption of a cloud
service and also later in the process. Cloud security experts have named 39 risks which are
described in this article. Under the top ten some risks are caused by the technical complexity
but also planning mistakes are in the top ten. (Dutta, Guo Chao Alex, & Choudhary, 2013)
Small and medium sized businesses have to manage a big amount of data from
various departments of their company. Accounting data is a big player in terms of decision
making. Data of all departments are coming together. Normal accounting software is
usually not capable to manage and to analyze this amount of data for decision making
because of their complexity and largeness. Cloud computing is good a opportunity to avoid
these problems. There are advantages and disadvantages of such a move of the accounting
software into the cloud. Therefor Lithuanian small and middle sized companies were
investigated after their move to the cloud. The author came to following advantages:
Reduced costs, Security, Respond to business, Easy administration, Compliance and Global
access. The following disadvantages were noted as well: Fear for safety, Internet failures,
Control loss, Dependency (Christauskas & Miseviciene, 2012). Gupta et al describe cloud
computing as a business factor for small and middle-sized enterprises based on the increased
speed of the internet. Five factors including ease of use, security and privacy are mentioned.
These factors are important for the implementation of cloud services (Gupta, Seetharaman, &
Raj, 2013).
SAP ByDesign in the Classroom
With SAP Business ByDesign, one of SAP's Software as a Service (SaaS) cloud
solutions businesses can use an ERP in the cloud and not on premise. As you can see in
Figure 1, ByDesign offers a full spectrum ERP tools for the organization.

SOBIE 2014
281
Figure 1 – Overview of SAP Business ByDesign
The employees of the organization or the students in our classroom have access to an
on demand deployment model, running in the SAP Cloud. It offers a full suite covering all
relevant aspects of a Business. It has a large set of scenarios & processes built in as you can
see from the screen shot of the help system in Figure 2.
Figure 2 – Help System With Built-In End-to-End Business Scenarios

SOBIE 2014
282
Business ByDesign is built on a Service Oriented Architecture and is model driven.
It is modular and flexible as well as being easy to configure and modify as you can see in the
screen shot in Figure 3.
Figure 3 – Sample Menu Structure
Figure 4 – Sample Report with Analytics and Usability Built In
Business ByDesign gives the user an intuitive user experience that includes ample
collaboration capabilities, business insight and analytics built in to educate the employees
and students on how to effectively run their business as witnessed in Figure 4 above. The
flexibility, extensibility and partner platform with an integrated knowledge base, built in
compliance, and built in service and support makes Business ByDesign easy to use and even
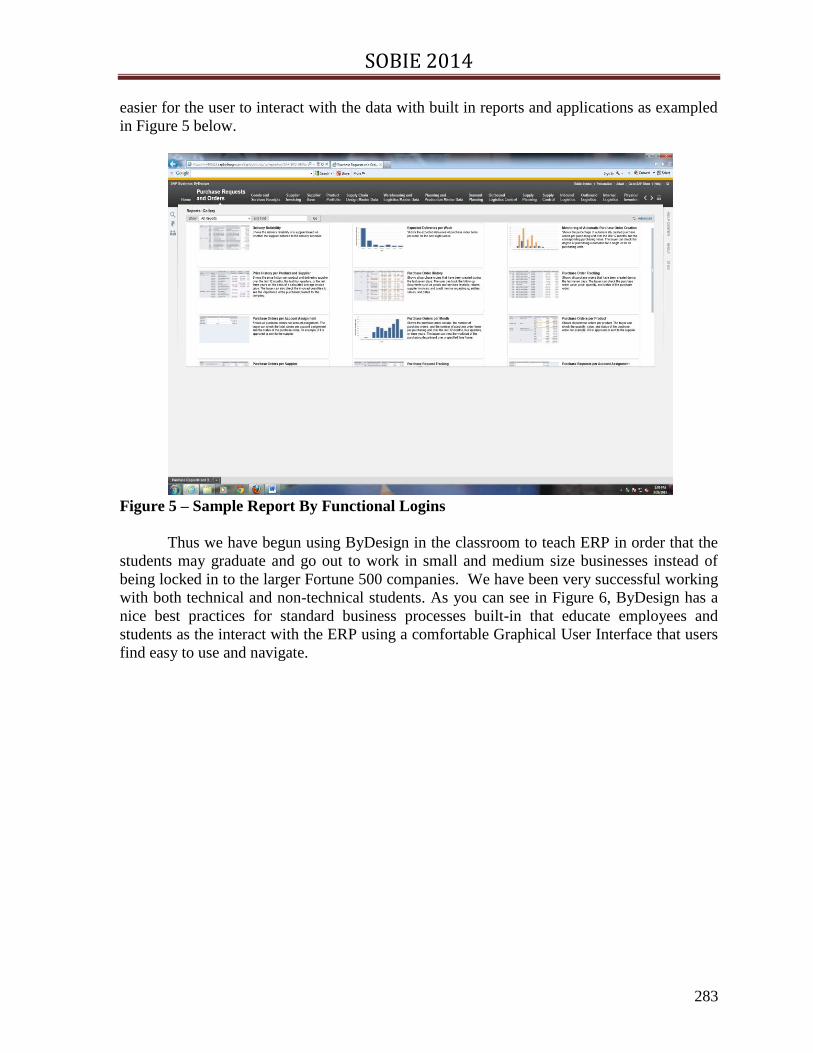
SOBIE 2014
283
easier for the user to interact with the data with built in reports and applications as exampled
in Figure 5 below.
Figure 5 – Sample Report By Functional Logins
Thus we have begun using ByDesign in the classroom to teach ERP in order that the
students may graduate and go out to work in small and medium size businesses instead of
being locked in to the larger Fortune 500 companies. We have been very successful working
with both technical and non-technical students. As you can see in Figure 6, ByDesign has a
nice best practices for standard business processes built-in that educate employees and
students as the interact with the ERP using a comfortable Graphical User Interface that users
find easy to use and navigate.
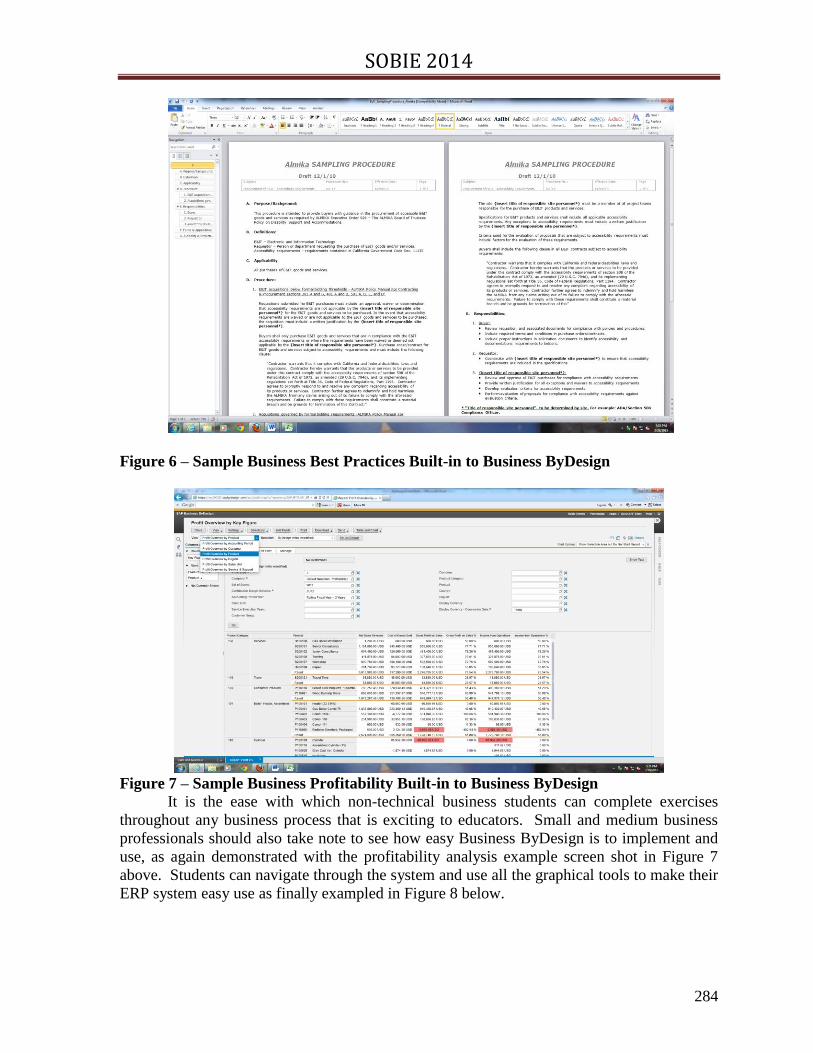
SOBIE 2014
284
Figure 6 – Sample Business Best Practices Built-in to Business ByDesign
Figure 7 – Sample Business Profitability Built-in to Business ByDesign
It is the ease with which non-technical business students can complete exercises
throughout any business process that is exciting to educators. Small and medium business
professionals should also take note to see how easy Business ByDesign is to implement and
use, as again demonstrated with the profitability analysis example screen shot in Figure 7
above. Students can navigate through the system and use all the graphical tools to make their
ERP system easy use as finally exampled in Figure 8 below.

SOBIE 2014
285
Figure 8 – Sample Product Data Capabilities Built-in to Business ByDesign
Conclusion
ERP systems don’t have to be large, expense or hard to use. SAP Business By
Design allows the educator or small business owner exercises that students or employees can
complete in minutes that range from standard procurement, to HR, to Business Intelligence,
to Mashups, and analytics/reporting and beyond. Customization of an ERP helps your
organization put the whole ERP fully integrated into your business or classroom.
Training/Teaching best practices will make your organization or students more successful.
SMEs can implement an ERP today and best practices can be incorporated into any size
organization. Knowing your Processes will make you operate more efficiently. Mapping
your Processes to your ERP is crucial for success. Teaching/Training does not have to be
painful, expensive or periodic, it can be an ongoing everyday event on the cloud. If you only
have experienced the big SAP ERP systems, I urge you to check out SAP Business ByDesign
and consider using it in your small to medium sized business or in the classroom to send your
students out into the world of industry ready to use the Cloud for ERP.
SOBIE 2014
286
References
Bancroft, N., Seip, H., & Sprengel, A. (1998). Implementing SAP R/3. In 2. edn (Ed.),
Manning. Greenwich, UK: Manning.
Bohórquez, V., & Esteves, J. (2008). Analyzing SMEs Size as a Moderator of ERP Impact in
SMEs Productivity, Communications of the IIMA, 8(3), 67-II. Retrieved from
http://search.proquest.com/docview/205910727?accountid=11078
Budrienė, D., & Zalieckaitė, L. (2012). Cloud Computing Application in Small and Medium-
Sized Enterprises, Issues of Business & Law, 4, 199-130. doi: 10.520/ibl.2012.11
Carcary, M., Doherty, E., & Conway, G. (2013). Understanding and Supporting Cloud
Computing Adoption in Irish Small and Medium Sized Enterprises (SMEs), Proceedings of
the European Conference on Information Management & Evaluation, 10-17.
CBR. (2011, May 6). ERP Market to Grow to $50.3BN in 2015: Forrester, Retrieved from
CBR:Your tech social network: http://www.cbronline.com/news/tech/software/enterprise-
apps/erp-market-to-grow-to-503bn-in-2015-forrester-060511
Christauskas, C., & Miseviciene, R. (2012). Cloud -- Computing Based Accounting for Small
to Medium Sized Business, Inzinerine Ekonomika – Engineering Economics, vol. 23, no 1:
14-21.
Dawoud, W., I Takouna, & C Meinel. (2010). Infrastructure as a service security: Challenges
and solutions, Informatics and Systems (INFOS), 2010 The 7th International Conference on,
pp. 1-8.
Deloitte, C. (1998). ERP's Second Wave, New York: Deloitte Consulting.
Dutta, A., Guo Chao Alex, P., & Choudhary, A. (2013). Risks in Enterprise Cloud
Computing: The Perspective of IT Eexperts, Journal of Computer Information Systems,
53(4), 39-48.
Gupta, A. (2000). Enterprise Resource Planning: The Emerging Organizational Value
Systems, Industrial Management + Data Systems, 100(3), 114-118, Retrieved from
http://search.proquest.com/docview/234918044?accountid=11078
Gupta, P., Seetharaman, A., & Raj, J. R. (2013). The Usage and Adoption of Cloud
Computing by Small and Medium Businesses, International Journal of Information
Management, 33(5), 861-874. doi: http://dx.doi.org/10.1016/j.ijinfomgt.2013.07.001
Kale, P. T., Banwait, S. S., & Laroiya, S. C. (2010). Performance Evaluation of ERP
Implementation in Indian SMEs, Journal of Manufacturing Technology Management, 21(6),
758-780. doi:http://dx.doi.org/10.1108/17410381011064030

SOBIE 2014
287
Krigsman, M. (2011, March 1). 2011 ERP survey: New IT failure research and statistics,
Retrieved from ZD Net: http://www.zdnet.com/blog/projectfailures/2011-erp-survey-new-it-
failure-research-and-statistics/12486
Laukkanen, S., Sarpola, S., & Hallikainen, P. (2007). Enterprise size matters: Objectives and
constraints of ERP adoption, Journal of Enterprise Information Management, 20(3), 319-334.
doi:http://dx.doi.org/10.1108/17410390710740763
O'Leary, D. (2004). Enterprise Resource Planning (ERP) Systems: An Empirical Analysis of
Benefits, Journal of Emerging Technologies in Accounting, pp. 63-72.
Shaul, L., & Tauber, D. (2013, August). Critical Success Factors in Enterprise Resource
Planning Systems: Review of the Last Decade, ACM Computing Surveys., Vol.45 (Issue 4),
p39-55.
Staehr, L. (2010). Understanding the Role of Managerial Agency in Achieving Business
Benefits from ERP Systems, Info Systems Journal, 20, 213-238.
Stanciu, V., & Tinca, A. (2013). ERP Solutions Between Success and Failure, Accounting
and Management Information Systems, Vol. 12, (No. 4,), pp. 626-649.
Upadhyay, P., Jahanyan, S., & Dan, P. K. (2011). Factors influencing ERP Implementation
in Indian Manufacturing Organisations, Journal of Enterprise Information Management,
24(2), 130-145. doi:http://dx.doi.org/10.1108/17410391111106275
Uwizeyemungu, S., & Raymond, L. (2012). Impact of an ERP System's Capabilities Upon
the Realisation of its Business Value: A Resource-Based Perspective, Information
Technology and Management, 13(2), 69-90. doi:http://dx.doi.org/10.1007/s10799-012-0118-
9
Van Vactor, Stephanie L. The Networked Enterprise: An Examination of Methodologies
Companies Can Use to Reduce Their Risks, Enhance Security, and Implement Effective
Policies in a Web 2.0 World, Diss. Utica College, 2012.
Zach, O., & Munkvold, B. E. (2012). Identifying Reasons for ERP System Customization in
SMEs: a Multiple Case Study, Journal of Enterprise Information Management, 25(5), 462-
478.
SOBIE 2014
288
FACTORS AFFECTING AVAILABILITY OF
COMPREHENSIVE CARE FOR THE ELDERLY WITHIN A
STATE
Avinash Waikar – Southeastern Louisiana University
Samuel Cappel - Southeastern Louisiana University
Kyle Meguess - Southeastern Louisiana University
Abstract
It is a general belief that seniors with chronic medical needs are better cared for in their homes and
communities whenever possible resulting in more desirable outcomes. Such all inclusive
comprehensive care options are offered in communities and funded by Medicare and Medicaid for the
elderly in an effort to seek a cost effective alternative to nursing home placement of such elderly.
However, due to severe budget constraints many states have chosen to cap the monthly growth in the
all inclusive care options to a net of two participants a month. This creates an uncertainty in the
availability of projected open enrollment slots each month. Gross enrollment slots open are the two
growth slots and the slots available due to a participant death in the previous month. This research
attempts to study factors that may affect enrollee deaths in a month. This could help provide a more
accurate projection of the enrollment slots that would become available to the elderly seeking
enrollment each enrollment period. We believe that standard life expectancy statistic should not be
used because enrollees in the all inclusive care options tend to require higher level of medical care
possibly resulting in lower life expectancies than the norm. This research investigated whether
enrollee gender, age and length of stay in the all inclusive care option affect the expected death rate.
Data was obtained for sixty five enrollees participating in the all inclusive care option in a southern
state in United States. Analysis showed that the life expectancy for the enrollees in the all inclusive
care option was no different from the national average which included enrollees and non-enrollees.
The factor enrollee gender was also examined to test the generally accepted idea that women have
longer life expectancies than men. This was done to determine if availability should be assessed with
consideration to additional life expectancy of females compared to males. No significant difference
was found between the average ages at death between men and women receiving the all inclusive
care. Finally, the length of participation in the all inclusive care option was also not found to affect
the age of death. Thus, national averages for life expectancies could be used to predict availability of
open slots for elderly wishing to enroll in the all inclusive care option.

SOBIE 2014
289
Introduction
Options of comprehensive all-inclusive care of the Elderly began in the early 1970’s in the
Chinatown-North Beach community of San Francisco where the needs of families whose elders had
migrated from Italy, China and the Philippines required long term care. Due to the cultural preference
of these communities, there was a strong desire to develop a community based alternative to the
traditional nursing home care available. Local physicians and community leaders worked together to
form a nonprofit corporation, On Lok Senior Health Services, to create a community based system of
care. On Lok, which means “peaceful, happy abode” in Cantonese, started by providing an adult day
health center which allowed the caregivers of it’s participants to work during the day while providing
care in their homes at night. Over time, it added additional components such as an onsite clinic and
home health services through demonstration grants and initiatives until it and twenty-one other
initiatives who replicated the model became permanently recognized providers in 1997 under the
Balanced Budget Act of 1997. This act established such options as a new provider type under
Medicare and Medicaid, (NPA, 2014).
Since 1997 comprehensive care options have grown to one hundred and three sites in thirty-one
states. Due to its status as a Medicare and Medicaid provider, new programs must have the
support of the Centers for Medicare and Medicaid Services (CMS) as well as its State’s
Department of Health and Hospitals (DHH). While CMS readily approves new programs since
they are considered Medicare Advantage programs; each state is a new challenge due to
Medicaid budgets and the new Program’s ability to prove its viability and cost savings
within its state.
Comprehensive care option programs act as a patient-centered medical home with the program
receiving capitated payments from Medicare and Medicaid for the total care of the participants they
serve. In effect these programs are small provider based insurance companies, and are at full risk for
the cost of the services they provide. The participants must be fifty-five or older and meet nursing
home level of care requirements for the state in which they reside. The program
Interdisciplinary team consists of a physician, registered nurse, occupational therapist, physical
therapist, licensed clinical social worker, home care coordinator, program center director,
SOBIE 2014
290
transportation coordinator, recreational therapist, nutritionist, and certified nursing assistant.
These disciplines assess the participant and develop a comprehensive care plan that fully
outlines the participant’s needs and interventions to insure complete care of the physical and
psychosocial needs. In addition, quality indicators including immunization rates and
readmissions are reported to CMS quarterly for review and discussion.
More on Comprehensive Care Options
While comprehensive care option programs are not currently affected by changes related to the
Affordable Care Act of 2010 (ACA), the national conversation has shed light on the fact that they
could be a viable model for the long term solutions to healthcare it seeks to establish. For decades
through this model, the elderly have been receiving the exact care that the Affordable Care Act seeks
to achieve for all Americans. Unfortunately in the current environment of accountable care and
patient-centered medical homes that the ACA supports, these programs are struggling to continue to
expand its services due to the limits established by current regulation. Through some regulatory
changes these programs can be adapted to provide coverage to additional demographic groups in a
cost effective and clinically sound way (Bloom, 2011).
Under the current structure, comprehensive care option programs in many states provide personal
care and supportive services, transportation, Adult Day Health Care, Nursing Facility Care, respite
care and caregiver education, assistive devices, social work services, recreation therapy and any other
care needed to maintain overall health (DHH, 2014). The Medicaid reimbursement cost of these
services is determined as a blended rate of nursing home and community based services provided by
other programs through the State’s Department of Health and Hospitals. States are required to
participate and provide resources if federal funding is desired. These programs are well accepted by
some. A participant’s family said it did the impossible for my mother, I never thought she could live
with us again. Virginia governor signed into law a legislation that allows for faster enrollment into
such programs. Legislation addresses issues in the clinical eligibility determination process of the
desiring participants.
Due to last recession and state budget constraints, some states have capped the growth of enrollees in
such programs. For example, the cap in one of the southern states has been set to two net participants
per period. This creates a unique enrollment challenge due to uncertainty of projecting total gross
enrollment slots available each period. Gross enrollment slots are two growth slots plus any slots
available due to enrollee deaths during the previous period.

SOBIE 2014
291
Methodology and Research Objective
Thus, the objective of this research was to determine what factors affect availability of enrollment
slots in such programs for the elderly care. Clearly, the number of slots available will be tied to the
number of enrollee deaths in the previous period. Therefore, a model needs to be developed to predict
expected number of enrollee deaths in a period. This could help develop a reliable projection of
available enrollment slots for the desiring participants in the upcoming period.
We suspect that “Enrollee’s Age at Death” would be related to “Enrollee Gender.” We suspect that
“Enrollee’s Age at Death” would also be related to “Enrollee’s current Age.” In addition we suspect
that “Enrollee’s Age at Death” would be related to “Enrollee Length of Stay in the program.” Thus,
we suspect that Factors (1) Enrollee Gender, (2) Enrollee Age and (3) Enrollee Length of Stay could
affect the number of deaths and thus the availability. In reference to variable Age, we believe
standard life expectancies should not be used for prediction because comprehensive care enrollees
tend to require higher level of medical care and nursing care. We suspect that they will likely have
lower life expectancy and span compared to the norm.
To confirm, the following hypothesis were tested in the study.
Null Hypothesis 1: The average Age at death for comprehensive care enrollees is lower than the
average Age at death for the general population.
Null Hypothesis 2: The average Age at death for comprehensive care female enrollees is higher than
that for the comprehensive care male enrollees.
Null Hypothesis 3: The average Age at death for comprehensive care enrollees is independent of the
enrollee’s length of stay in the comprehensive care program.
A random sample of sixty five enrollees was obtained from the current pool of participants enrolled in
comprehensive care program at a site in a southern state. Since, the minimum age to join
comprehensive care program is 55, the life expectancy for general population taken from the CDC
Table for comparison was that for the 55 year age group of males and females rather than from birth.

SOBIE 2014
292
Data was collected on Gender of enrollee, Length of Stay or years receiving comprehensive care and
Age at death.
Results
The demographic characteristics of the sample showed that the sample included 45 females and 20
females. Nationally, the average Age at death for females 55 years and older was = 82.58 years.
Nationally, the average Age at death for males 55 years and older was = 79.80 years. For the State
used in the study, the average Age at death for females 55 years and older was = 81.23 years. For the
State, the average Age at death for males 55 years and older was = 77.01 years.
A “t-test” showed no significant difference between Average Age at death between general female
senior population (55 and older) and Average Age at death for female enrollees in the comprehensive
care program (p > .10). Similarly, the “t-test” showed no significant difference between Average Age
at death between general male senior population (55 and older) and Average Age at death for male
enrollees in the comprehensive care program (p > .10). The analysis also showed that there was no
significant difference between the ages at death between men and women enrolled receiving the
comprehensive care. This was an unexpected finding as it contradicts the generally accepted theory
and CDC life expectancy tables that do show a longer life expectancy for women than men. Finally, a
Chi Square Test of Independence showed that the factors Age at death and Length of stay were not
dependent (p > .10).
Conclusions
From the results, it can be concluded that there is no significant difference in the life expectancy of a
person receiving comprehensive care from these programs compared to persons who are not receiving
the care regardless of gender or length of stay or length of enrollment in the program. These findings
are somewhat unexpected. One could say that comprehensive care from such programs does bring the
life expectancy of the enrollees to the national level but does not increase it any more. One must be
mindful that the benefits of such care are psychological to the elderly and also may bring relief to the

SOBIE 2014
293
family. On the other hand, medical benefit of such care may be questioned by some relative to the
cost of such care when pressures to bring down medical care costs are mounting every year.
Finally, based on the findings, we can say that separate prediction model to predict availability for
such comprehensive care is not needed. Standard life expectancy rates could be used.
The limitation of the study of the study is that the sample and the data came from an unhealthy
southern State characterized by high prevalence of smoking, high prevalence of obesity and physical
inactivity, and, high percentage of seniors living in poverty. On the positive note, the state did have
high prevalence of Flu vaccinations, good availability of home health workers and reported low
prevalence of falls.
References
Bloom, Shawn. “Accountable Care Strategy” Healthcare Executive Insight. 2011.
DHH. “DHH Website” 2014.
NPA website. “Policy Changes to Support Expansion, Flexibility and Access” Retrieved Online April
2014 from www.npaonline.org, 2014.

SOBIE 2014
294
The Influence of Cultural Intelligence on
Intercultural Business Negotiation
By
Steve A Varela
International School of Management
ABSTRACT
The persistent growth of international trade continues while a rebalancing of global economic
activity occurs. Eastern market challengers have shifted the world economy into their favor along
with the corresponding benefits of power and influence that are typically associated with developed
world economies. Consequently, the needs for more efficient negotiation outcomes take center stage
as an ever-increasing level of trading activity navigates the world economy.
This research examines the relationships between the four dimensions of the Cultural
Intelligence construct with intercultural business negotiation outcomes. Metacognitive cultural
intelligence, cognitive cultural intelligence, motivational cultural intelligence, and behavioral cultural
intelligence sub-dimensions and their relationships to intercultural negotiation planning, outcomes,
satisfaction, and performance-satisfaction are examined.
To test the hypotheses, the Cultural Intelligence Scale (Ang & Van Dyne, 2008) was administered to
102 experienced international negotiators from members of the Taiwan External Trade Development
Council, based in Taipei, Taiwan along with a self-report survey of the results of actual intercultural
negotiation exchanges. A cross-sectional research method incorporated a sequential survey design
and subsequent analysis was conducted using correlation and hierarchical regression analysis. Results
indicated that three of the four hypotheses were supported. Specifically, the results provided support
that aggregate cultural intelligence predicts intercultural negotiation outcomes, intercultural
negotiation satisfaction, and intercultural negotiation performance-satisfaction. Evidence also
suggests that two sub-dimensions, motivational cultural intelligence and behavioral cultural
intelligence predict inter-cultural negotiation performance-satisfaction.
Together, the findings suggest that the cultural intelligence scale can be relied upon to predict the
outcomes of intercultural negotiation outcomes as well as be utilized to select and train managers for
intercultural negotiation assignments.

SOBIE 2014
295
Introduction The need for effective intercultural negotiation expertise has never been greater. To be sure, the once
comfortable era of entering international markets as an option has quickly eroded into a business
imperative. Once stable markets controlled by large entities from developed, free-market economies are
now open territory for unknown upstarts due in part to technological, political, and economic advances.
As a result, upstarts from historically closed markets are now entering the global arena with the depth,
technology, and sophisticated resources that these advancements have provided. In short, an improved
understanding of intercultural negotiation efficacy is becoming increasingly important as the global
economy gradually shifts towards Asia.
Recent data from the United States Economic Research Service has demonstrated that the increase in
Asian gross domestic product (GDP) as a percentage of World GDP has risen from about 15% in 1969 to
28% at the end of 2012, surpassing the economies of both North America and the European Union.
During 2010, the Asian GDP surpassed the GDP of the European Union, and it similarly surpassed the
North American GDP during 2012. Indeed, the global power structure has changed in many ways (United
States Department of Agriculture, 2012).
Figure 2: World GDP Share (1969-2012)
Relatively little empirical research has been conducted on negotiation outcomes during actual
negotiations or under controlled simulations with experienced international negotiators, perhaps due to
logistical issues or the lack of willing participants (Imai & Gelfand, 2009; Gelfand & Christakopoulou,
1999). The majority of research that is available represents a large body of work that mainly focuses on
0.00
5.00
10.00
15.00
20.00
25.00
30.00
35.00
40.00
19
69
19
72
19
75
19
78
19
81
19
84
19
87
19
90
19
93
19
96
19
99
20
02
20
05
20
08
20
11
Pe
rce
nt
of
GD
P
World GDP Share (1969-2012)
Africa and ME
Asia and Oceania
European Union
North America
Latin America

SOBIE 2014
296
comparing one cultural style with another (Salacuse, 1988). Essentially, large amounts of independent
data are available, but not in a form which facilitates the use of such information to build effective
intercultural negotiation competencies.
Efficient negotiations that create value are essential for both the individual negotiating parties involved
and the global economy alike. While precise figures are difficult to find, data from a negotiation study by
Nadler, Thompson and van Boven (2003) suggests that the classic “win-win” or integrative negotiation
outcome is attained only about three percent of the time, and that the rate of success in reaching simple
agreements is less than 50 percent. As mentioned above, intercultural negotiations face an additional
degree of difficulty owing to numerous differences such as language and communication, context,
perception, styles, expectations, and values. As a result, scholars cite evidence that newly formed
international joint ventures that rely heavily on integrative negotiation expertise have notorious failure
rates (Luo & Shenkar, 2002).
Despite the benefit of large volumes of data gathered at the particular national or cultural level, today’s
business reality dictates that many international business executives traverse the globe seeking solutions
to opportunities from a host of cultures, often simultaneously. Unfortunately, it is not possible for an
individual negotiator to master the multitude of intercultural negotiation nuances required by today’s
interconnected world.
One intelligence construct based on specific cognitive and behavioral dimensions of culture that
researchers have recently developed is the cultural intelligence model (Earley & Ang, 2003). Similar to
other domain based intelligence models such as emotional intelligence or social intelligence that
complement our cognitive ability, the cultural intelligence scale is a four dimensional construct based on a
growing body of research emanating from original works by Schmidt and Hunter (1996) and Sternberg
and Detterman (1986) whose research suggests that real-world intelligence and associated outcomes
extend to competencies beyond mere cognitive capability.
The cultural intelligence model (CQ) asserts that intelligence is a construct that incorporates not only
what we know (cognitive CQ), but also the processes involved in how we plan and implement our
strategy for acquiring new cultural knowledge (metacognitive CQ). The construct additionally includes a
component for what motivates us to expend energy and time towards acquiring new knowledge
(motivational CQ) as well as a construct for assessing how well we use that knowledge in culturally
diverse settings (behavioral CQ). In sum, the multi-dimensional structure of CQ addresses the claims of
many scholars and practitioners who recognize that individuals with high levels of cognitive ability do not
always achieve similar levels of success with respect to their preferred outcomes (Sternberg, 1999).
The remainder of this paper considers relevant theoretical and empirical findings to buttress the
hypotheses relative to cultural intelligence and intercultural exchange outcomes. The next sections present
the conceptual framework and research methodology along with a description of the findings. I then
conclude with a discussion of the results and note implications for further research and practice.
Cultural Intelligence Cultural Intelligence, as an individual difference, is grounded in the intelligence literature based on its
state-like capability properties, particularly those with malleable features. The conceptualizers of cultural
intelligence view the construct as a “specific individual difference construct because it focuses on

SOBIE 2014
297
culturally relevant capabilities” (Ang & Van Dyne, 2008, p. 8). They do not consider the construct overly
expansive such as individual difference measures like cognitive ability or personality. However, they do
consider it sufficiently culturally broad in the sense that it does represent the individual ability to function
across many cultures rather than an ability to function within individual cultural matchups such as China
and Brazil.
From an intelligence perspective, cultural intelligence is both similar to and distinct from other forms of
intelligence such as general mental ability or emotional intelligence. It is similar to general mental ability
and emotional intelligence because it is a predictor of abilities rather than preferences, but it is different
from general mental ability because general mental ability represents the ability to perform across all
contexts but not granular enough to predict specific performance in intercultural contexts (Ang & Van
Dyne, 2008). It is also different from emotional intelligence for the reason that while emotional
intelligence represents the ability to identify and control emotions, there is no evidence that it is
transferrable across cultures (e.g. etic), which commonly express emotions in substantially different forms
(Law, Wong, & Song, 2004). Consequently, while cultural intelligence is a culture free construct,
emotional intelligence is more culture bound since the appropriate display of emotions are heavily
influenced by culture specific expectations and behaviors.
The Cultural Intelligence Scale The Cultural Intelligence Scale (Ang, et al., 2007) is a focused, meaningful, and robust construct owing to
more than six original development and refinement studies that have validated that the results: (1) are
generalizable across samples, (2 across time, (3) across countries, and (4) across methods, namely self-
report and observer report. Cultural intelligence research was motivated by two important realities: the
growing number of people involved in “real-world” multicultural activities brought about by
globalization, and the lack of theory that explores the predictability of individuals performing in
multicultural environments.
As noted above, cultural intelligence is a multi-dimensional construct that incorporates both behavioral
and cognitive facets.
Metacognition is the process of how we strategically accumulate and enhance our knowledge (Flavell,
1979). From an inter-cultural perspective, Metacognitive cultural intelligence (MetCQ) refers to our
conscious awareness of differences in intercultural interactions. Individuals with high levels of
metacognitive cultural intelligence consistently question and adjust their own cultural understanding,
often in real-time, when interacting with others from another culture. Metacognitive cultural intelligence
incorporates higher-level cognitive reasoning that permits us to develop new mental modes of
understanding social interaction in new environments.
The significance of metacognitive cultural intelligence is that it challenges the individual to think actively
about their existing cultural conventions and to continuously question previous assumptions in such a way
that the individual can increase their understanding and behavior. These metacognitive events occur
throughout the process as individuals plan for, monitor, and update their intercultural mental models
(Brislin, Worthley, & MacNab, 2006).
Cognitive cultural intelligence (CogCQ) focuses on an individual’s knowledge bank of cultural norms,
practices, context, and conventions, which frequently stem from culture specific value systems (Ang &

SOBIE 2014
298
Van Dyne, 2008; Early, Ang, & Tan, 2006). Cognitive cultural intelligence also indicates an individual’s
understanding of their own self-concept compared to others and an understanding of the existence of both
broad cultural universals and cultural differences. This expanded knowledge base makes for greater
predictability in social interaction, increased attribution accuracy, and at the end of the day, more
effective intercultural behaviors (Thomas, 2006).
Increasing cognitive level cultural knowledge has traditionally been the focus of inter-cultural training
and executive education programs for multinational corporations, government agencies, and non-profit
organizations. Examples of cultural understanding includes knowledge of systems that facilitate the
movement of goods and services (e.g. stores of value, economic exchange), various patterns of social
interaction (e.g. family, business, government), child rearing practices (e.g. maternal, paternal hierarchy),
beliefs and values that relate humans to the greater universe (e.g. religion, ethics); and educational
systems, legal systems, ceremony and other systems that provide for the basic physiological needs of a
society (Triandis, 2006).
Motivational cultural intelligence (MotCQ) refers to the level of interest and energy we devote to the
enhancement of our cultural knowledge and performance. It is conceptualized as ones intrinsic desire to
engage in inter-cultural exchanges based in part on one's self-growth objectives (Templer, Tay, &
Chandrasekar, 2006). According to the expectancy value theory of motivation, the key to increasing an
individual’s motivation is one’s expectations for successful outcomes and the expectations of increased
value in exchange for such effort (Robbins & Judge, 2009; Wigfield & Eccles, 2000). Therefore,
motivational cultural intelligence contemplates an individual’s values, self-efficacy, and goal setting
expectations.
Behavioral cultural intelligence (BehCQ) is a non-cognitive dimension of cultural intelligence and reflects
an individual’s ability to behave or act appropriately in culturally diverse situations through the exhibition
of appropriate verbal and/or non-verbal actions (Ang, et al., 2007). According to Hall (1959), an
individual’s mental faculties are not sufficient alone to bring forth success. Hall asserts that an individual
must utilize their mental (e.g. metacognitive, cognitive) and non-mental (e.g. motivational, behavioral)
capabilities in order to reach their goals. Utilizing ones knowledge and motivation as well as possessing
the capability to adapt their behavior to exhibit proper responses during intercultural interactions
contributes positively to intercultural outcomes (Koneya & Barbour, 1976; Ang, Van Dyne, & Tan,
2011).
Of all the dimensions of cultural intelligence, behavioral cultural intelligence is arguably the most
difficult dimension to acquire (Early, Ang, & Tan, 2006). For instance, there are many actions that we
aspire to achieve but cannot actually perform since many behavioral actions require refinement and
finesse.
Empirical research has demonstrated the validity of cultural intelligence as a predictor of intercultural
exchange outcomes in a number of cross cultural business situations. For example, Chua et. al (2012)
found that managers who scored high in metacognitive cultural intelligence were more likely to share new
ideas resulting in improved problem solving outcomes when involved in intercultural exchanges.
Furthermore, Ang et al. (2007) found that individuals with higher aggregate cultural intelligence were
more accurate in their decision making above and beyond cognitive ability, emotional intelligence,
personality, and international experience. In negotiation, Wilken et al. (2013) found that the use cultural

SOBIE 2014
299
moderators, who were natively familiar with both cultures, produced negotiation outcomes of higher
value when engaged in distributive negotiation exchanges. Finally, Imai and Gelfand (2010) found that
the use of reciprocal negotiation sequences, known to produce negotiation outcomes of higher value, were
more prevalent for negotiators who enjoyed higher levels of cultural intelligence than negotiators with
lower levels of cultural intelligence.
Hypothesis Development, Research Design, Methods, and Instrumentation The following research hypotheses, derived from the theoretical basis above, suggest that the use of the
cultural intelligence scale is a valid measure to predict the outcomes of intercultural negotiations. As
such, the following four hypotheses are examined.
H1: Intercultural Negotiation Outcome (ICNO)
Intercultural Negotiation Outcome (ICNO) represents the utility outputs of inter-cultural negotiations and
is hypothesized to be positively influenced by aggregate form of cultural intelligence, aggregate cultural
intelligence (CQ).
There has been consistent agreement among scholars that the results of inter-cultural negotiation
outcomes are suboptimal as compared to intra-cultural negotiation outcomes (Graham, 1985; Imai &
Gelfand, 2010; Adair, Brett, & Okumura, 2001; Adler & Graham, 1989) and that research into the
behavioral and psychological influences of negotiation outcomes has been inadequate (Malhotra &
Bazerman, 2008; Chung & Ingleby, 2011). Since Lewicki, et al. (2010) assert that effective planning and
strategy are the most important factors to achieving negotiation objectives, and Thompson (2009) asserts
that a majority of the negotiation effort should be dedicated to planning, metacognitive cultural
intelligence and cognitive cultural intelligence are jointly hypothesized to be positively related to
intercultural negotiation outcomes. Further, since a majority of researchers agree that motivation is
positively related to task performance (DeDreu, Weingart, & Kwon, 2000; Ang, et al., 2007),
metacognitive cultural intelligence is hypothesized to be positively related to intercultural negotiation
outcome. Moreover, since successful intercultural outcomes require the ability to display culturally
appropriate behaviors (Ang, et al., 2007), and effectively adapt their behaviors to the situation (Earley &
Ang, 2003), or shape the situation to maximize the exchange (Thomas, 2006), behavioral cultural
intelligence is also hypothesized to be positively related to intercultural negotiation outcome.
Therefore, it is hypothesized that aggregate CQ including MetCQ, CogCQ, MotCQ, and BehCQ are
positively related to ICNO, accordingly:
H1: Negotiators with higher levels of aggregate CQ will have higher levels of ICNO than
negotiators with lower levels of aggregate CQ.
Figure 3: Schematic of H1 (Intercultural Negotiation Outcome)
Metacognitive CQ
MetCQ
Cognitive CQ
CogCQ Aggregate
Cultural Quotient
CQ
Inter-cultural
Negotiation
Outcome
(ICNO)

SOBIE 2014
300
H2: Intercultural Negotiation Satisfaction (ICNS)
To further gauge the outcomes of inter-cultural negotiations, without measurement constructs that may
suffer from certain culture or response bias, a culture free construct, Intercultural Negotiation Satisfaction
is utilized (ICNS). The satisfaction outcomes of specific intercultural negotiations are influenced by the
perceptions and expectations of individual negotiators based on their underlying goals (Robbins & Judge,
2009) and the cultural values of negotiators themselves (Morris & Gelfand, 2004; Simintiras & Thomas,
1997). Moreover, the measurements of specific inter-cultural negotiation results are complex because
negotiator outcomes can vary widely in terms of financial benefits, inter-party relationship status, and
external constituencies, among others. In addition, it is reasonable to expect that negotiation satisfaction
measures are often the only authentic feedback a negotiator has for their performance, particularly in the
case of real-world negotiations as compared to laboratory simulations (Curhan, Elfenbein, & Xu, 2006).
This is due to the reality that negotiators largely do not know the value of the actual outcome to their
negotiating opponent, they do not know the opponent's alternatives, nor do they know with any certainty
what the opponent would have accepted for their particular exchange or indeed, what they have
historically accepted for similar exchanges. Finally, reliable measurements of actual negotiation outcomes
are difficult to obtain owing to the reluctance of real-world participants to reveal sensitive data (Graham,
1985; Adler & Graham, 1989). Given the above, negotiation satisfaction is used as a culture and response
bias-free proxy for negotiation outcomes.
As in the construct for hypothesis 2 relative to intercultural negotiation outcomes, intercultural
negotiation satisfaction is hypothesized to be positively influenced by the aggregate form of cultural
intelligence, CQ. Accordingly,
H2: Negotiators with higher levels of aggregate CQ including MetCQ, CogCQ, MotCQ and
BehCQ will have higher levels of ICNS than individuals with lower levels of aggregate CQ.
Figure 4: Schematic of H2 (Intercultural Negotiation Satisfaction)
Motivational CQ
MotCQ
Behavioral CQ
BehCQ
Metacognitive CQ
MetCQ
Cognitive CQ
CogCQ
Motivational CQ
MotCQ
Behavioral CQ
BehCQ
Aggregate
Cultural Quotient
CQ
Inter-cultural
Negotiation
Satisfaction
(ICNS)

SOBIE 2014
301
H3: Inter-cultural Negotiation Planning (ICNP)
As many negotiation scholars and practitioners have agreed, adherence to a systematic process including
goal setting, planning, and strategic execution leads to more successful negotiation outcomes (Halpert,
Stuhlmacher, Crenshaw, Licher, & Bortel, 2010; Lewicki, Barry, & Saunders, 2010). This is also
presumed to be true for intercultural negotiation exchanges (Benoliel, 2011; Thompson, 2009),
particularly those of an integrative nature (Adair W. , 2003; Weingart & Olekalns, 2004). Hence,
intercultural negotiation planning represents the level of planning that intercultural negotiators engage in
prior to the negotiation exchange.
Consistent with Ang, et al., (2007) relative to cultural judgment and decision-making (CJDM) on human
information processing, this hypothesis considers the relationship between metacognitive cultural
intelligence (MetCQ) and cognitive cultural intelligence (CogCQ) to be positively related to intercultural
negotiation planning (ICNP). Metacognitive cultural intelligence contributes to negotiation planning
since its processes involve maintaining heightened awareness of, and attention to, the intercultural
exchange including awareness of the assumptions, emotions, motivations, intentions, behaviors, and skills
of oneself and those of culturally different others (Thomas, 2006). The metacognitive cultural intelligence
component of cultural intelligence reflects an individual’s “control of cognition” or strategic approach to
task elements such as planning, monitoring, and adaptive, real-time selection and use of various cultural
exchange strategies. The cognitive cultural intelligence component of cultural intelligence reflects the
individual’s repertoire of existing cultural knowledge structures such as knowledge of norms, accepted
practices, cultural artifacts, and conventions used in a variety of cultures (Ang & Van Dyne, 2008).
Cognitive cultural intelligence forms the basis for comprehending and decoding the behavior of others
and ourselves. This declarative knowledge allows a better grasp of the internal logic and modal behavior
of another culture, which can serve as an initial estimation relative to the behavior of a culturally distinct
negotiating counterparty (Thomas, 2006). Since both sub-dimensions of cultural intelligence are mental
capabilities that require: (a) active thinking about people and their cultures, (b) culture-specific
declarative knowledge in order to understand cultural universals and cultural particulars, and (c) the
ability to consider and evaluate factors related to both context and goals, individuals who score high in
both sub-dimensions will have a clearer sense of direction on how to proceed during inter-cultural
negotiations (Lewicki, Barry, & Saunders, 2010). Therefore, it is hypothesized that:
H3: Negotiators with higher MetCQ and CogCQ will exhibit higher ICNP than individuals
with lower MetCQ and CogCQ.
Figure 5: Schematic of H3 (Intercultural Negotiation Planning)
H4: Intercultural Negotiation Performance-Satisfaction (ICNPS)
Metacognitive CQ
(MetCQ)
Cognitive CQ
(CogCQ)
Cultural Judgment
Decision Making
(CJDM)
Inter-cultural
Negotiation
Planning
(ICNP)

SOBIE 2014
302
Inter-cultural Negotiation Performance Satisfaction (ICNPS) has been constructed to examine the specific
relationship between cultural intelligence sub-dimensions motivational culture intelligence (MotCQ) and
behavioral cultural intelligence (BehCQ) to negotiator performance satisfaction (ICNPS). The premise is
consistent with determinants of task performance; namely, that task performance is the product of ability
and motivation (Whetton, 2011).
According to social cognitive theory, highly motivated individuals exhibit higher levels of interest and
persist in their efforts (Bandura, Social Cognitive Theory: An Agentic Perspective, 2001). Since
individuals with higher levels of motivational cultural intelligence are by definition expected to have an
intrinsic interest in cross-cultural exchanges and an enhanced drive to persist, motivational cultural
intelligence is projected to be positively related to intercultural negotiation performance-satisfaction
(Earley & Ang, 2003). As an example, individuals with higher levels of energy and persistence tend to
practice new behaviors and, through experience, increase their performance outcomes (Ang, et al., 2007).
Furthermore, since the appropriate ability to demonstrate cross-cultural behaviors also relates positively
to task performance, behavioral cultural intelligence should also be positively related to intercultural
negotiation performance-satisfaction. To illustrate, a study of expatriate outcomes demonstrated that
behavioral flexibility was positively related to inter-cultural task performance (Shaffer, Ferzandi,
Harrison, Gregersen, & Black, 2006). Finally, there is substantial empirical evidence that demonstrates a
strong positive link between job satisfaction and task performance (Judge, Thoresen, Bono, & Patton,
2001); hence, individuals who exhibit higher levels of job performance should also enjoy higher levels of
job performance-satisfaction.
Therefore, it is hypothesized that motivational cultural intelligence and behavioral cultural intelligence
are positively related to intercultural negotiation performance-satisfaction, accordingly:
H4: Negotiators with higher levels of MotCQ and BehCQ will have higher levels of ICNPS
than negotiators with lower levels of MotCQ and BehCQ.
Figure 6: Schematic of H4 (Intercultural Negotiation Performance-Satisfaction)
Motivational CQ
MotCQ
Behavioral CQ
BehCQ
IA
(MotCQ+BehCQ)
Inter-cultural
Negotiation
Performance-
Satisfaction
(ICNPS)

SOBIE 2014
303
Sample, Research Design, Methods, and Instrumentation The Taiwan External Trade Development Council (TAITRA) was chosen as the study site due to the
success of its members in international trade implementation and the contributions it has made to the
dynamic business economy that earned Taiwan the distinction of “Asian Tiger” (Kim, 1998). TAITRA is
the foremost non-profit trade organization in Taiwan sponsored in part by the Taiwan government,
several industry associations, and commercial and educational entities based in Taipei ,however, its
expertise is spread globally via a network of 600 trade specialists operating in 48 countries. By many
standards, TAITRA offers a rare, yet ideal site based on access to experienced international business
negotiators that have operated in a dynamic market for a substantial period of time.
Sampling Method and Participants
The study sample was based on a purposive selection method strategy. Purposive sampling is known for
being an efficient method to obtain meaningful responses from participants who are in the best position to
provide informed answers, which for the purposes of this study are experienced international
businesspersons (Sekaran, 2000).
Through the association with TAITRA, participants were identified and pre-qualified based on two
criteria: (a) a minimum of one year of international business experience, and (b) one year of membership
in the TAITRA organization. In exchange for their participation, respondents were offered a personalized
analysis of their own cultural quotient and a summary of results of the overall study.
In the TAITRA experienced negotiator sample, there were 102 responses. Forty-six percent of the
population was female with all but one of the respondents reporting Taiwanese citizenship; the other
reported being a citizen of the People’s Republic of China. The average age of the population was 36.04
years. The participants had an average of 10.84 years of work experience and an average of 5.14 years of
negotiation experience.
Instrument & Testing
A three-part, bi-lingual (English – Traditional Chinese) survey containing: (1) the four factor cultural
intelligence scale measurements, (2) negotiation outcomes, and (3) demographic information was
developed to examine the influence of cultural intelligence on intercultural negotiation outcomes.
Part I of the survey contained a bi-lingual version of the original 20-item Four Factor Cultural Intelligence
Scale developed by Ang, et al. (2007). Since the scale was only available in English and Simplified
Chinese, the scale was backward translated into traditional Chinese by faculty and staff experienced in
translation at Tunghai University.
The Four Factor Cultural Quotient Scale developed by Van Dyne and Ang corresponds with each of the
four sub-dimensions of the cultural intelligence construct: metacognitive cultural intelligence, cognitive
cultural intelligence, motivational cultural intelligence, and behavioral cultural intelligence, and consists
of 20 self-report items on a seven point Likert type scale. It was tested and validated across multiple
samples, methods, and longitudinally with N=1,759 respondents (Van Dyne, Ang, & Koh, 2008).

SOBIE 2014
304
Part II of the survey included the measures for evaluating inter-cultural negotiation outcomes:
intercultural negotiation planning, intercultural negotiation outcomes, intercultural negotiation
satisfaction, and intercultural negotiation performance-satisfaction.
Intercultural negotiation planning measurements were based on measures from original work by
Schneider at the Harvard Negotiation Law Review (Schneider, 2002). The items that measured planning
included: (a) “How much time do you spend on negotiation planning?”, (b) “Did you prepare a written
plan in advance of your negotiation interaction?”, (c) “Did you identify your negotiation goals in advance
of your negotiation interaction?”, and (d) “Did you identify your alternatives in advance of your
negotiation interaction?”.
Items that measured inter-cultural negotiation outcomes focused on satisfaction measures related to
individual negotiation expectation outcomes, individual negotiation performance outcomes, and
individual negotiation economic outcomes. Satisfaction measurements, recognized as a proxy for
measuring negotiation outcomes which are difficult to measure owing to broad variance (Gelfand & Brett,
2004) or where self-report reluctance factors are prone to influence, were adopted from Graham, Mintu,
and Rogers (1994) and were based partially on cross-cultural sales research by Graham (1985) and
subjective value research by Curhan (2006). These included: (a) "If an agreement was reached, how
satisfied were you with that agreement?”, (b) “How satisfied were you with the agreement relative to your
pre-negotiation expectations?”, (c) “How satisfied were you with your negotiation performance?”, and (d)
How satisfied were you with your individual gains (e.g. discount, margin, risk, terms, etc.)?” .
Part III of the survey instrument included demographic information such as the respondent’s age, gender,
education level, years of professional experience, and years of negotiation experience. Contextual
information was also collected that included the year that the reported negotiation occurred, the industry,
and the country of the counter-party in addition to optional contact information for respondents interested
in obtaining their personalized cultural intelligence report and the results of the survey
Testing
Since the three survey parts were all translated from English, pilot testing was necessary to identify
potential translation errors. This was conducted twice, initially under controlled conditions with
experienced professionals (N=7) participating in an EMBA program in the Department of International
Trade and subsequently with international business graduate students. Recognizing that the target
population was composed of experienced international business negotiators with varying and oftentimes
relatively robust levels of English fluency, the researcher decided to implement a bi-lingual version of the
survey as opposed to either an English only or Traditional Chinese only language version. Respondents
were consequently presented with each of the survey item questions in both Traditional Chinese and
American English on the same item response line in an attempt to further increase overall item
comprehension.
Testing on the final bilingual survey was accomplished with volunteer graduate students (N=21) and none
reported having any difficulty with survey item comprehension.
Research Variables
Tables 1 -3 present the variables collected in the three-part survey administered to the TAITRA
sample that included the following independent, derived, dependent, and demographic variables.

SOBIE 2014
305
Table 17: Independent Variables
Variable Measurement
METCQ
Metacognitive CQ
MetCQ is the process of how we strategically accumulate and
enhance our knowledge (Flavell, 1979; Ang, et al., 2007)
COGCQ
Cognitive CQ
CogCQ focuses on an individual’s knowledge bank of cultural
norms, practices, context, and conventions, which frequently
stem from culture specific value systems (Early, Ang, & Tan,
2006; Ang, et al., 2007).
MOTCQ
Motivational CQ
MotCQ refers to the level of interest and energy we devote to the
enhancement of our cultural knowledge and behavior. It is
conceptualized as ones intrinsic desire to engage in inter-cultural
exchanges based in part on ones self-growth objectives
(Templer, Tay, & Chandrasekar, 2006; Ang, et al., 2007)
BEHCQ
Behavioral CQ
BehCQ reflects an individual’s ability to behave or act
appropriately in culturally diverse situations through verbal or
non-verbal actions (Ang, et al., 2007)

SOBIE 2014
306
Table 18: Derived Variables
Variable Definition
Final_CQ
(MetCQ+CogCQ+MotCQ+Beh
CQ)
Aggregate Cultural Intelligence Score (Ang, et al., 2007).
Calculated as the average of all four sub-dimensions.
CJDM
(MetCQ + CogCQ)
Cultural Adjustment and Decision Making. Refers broadly to
human information processes for making decisions in culturally
diverse settings. CJDM tasks require deliberate reasoning,
evaluation of evidence, and a rational comparison of
alternatives. CJDM is limited to mental capabilities and is not
expected to predict inter-cultural motivational or behavioral
outcomes, consequently it is limited to the two cognitively
focused sub-dimensions of cultural intelligence: metacognitive
and cognitive (Ang & Van Dyne, 2008; Early, Ang, & Tan,
2006). Calculated as the average of the two sub-dimensions.
IA
(MotCQ + BehCQ)
Interactional Adjustment. Refers to an individual’s ability to
relate and adapt to culturally diverse others in both work and
non-work situations characterized by cultural diversity. IA tasks
rely on an individual’s intrinsic motivation and expanded
behavioral repertoire for success. IA skills include the two non-
mental sub-dimensions of cultural intelligence, namely
motivational CQ and behavioral CQ. While relying on existing
knowledge, Cognitive CQ and Meta-Cognitive CQ are expected
to pay a lesser role with respect to IA outcomes (Early, Ang, &
Tan, 2006; Shaffer & Miller, 2008). Calculated as the average of
the two sub-dimensions.
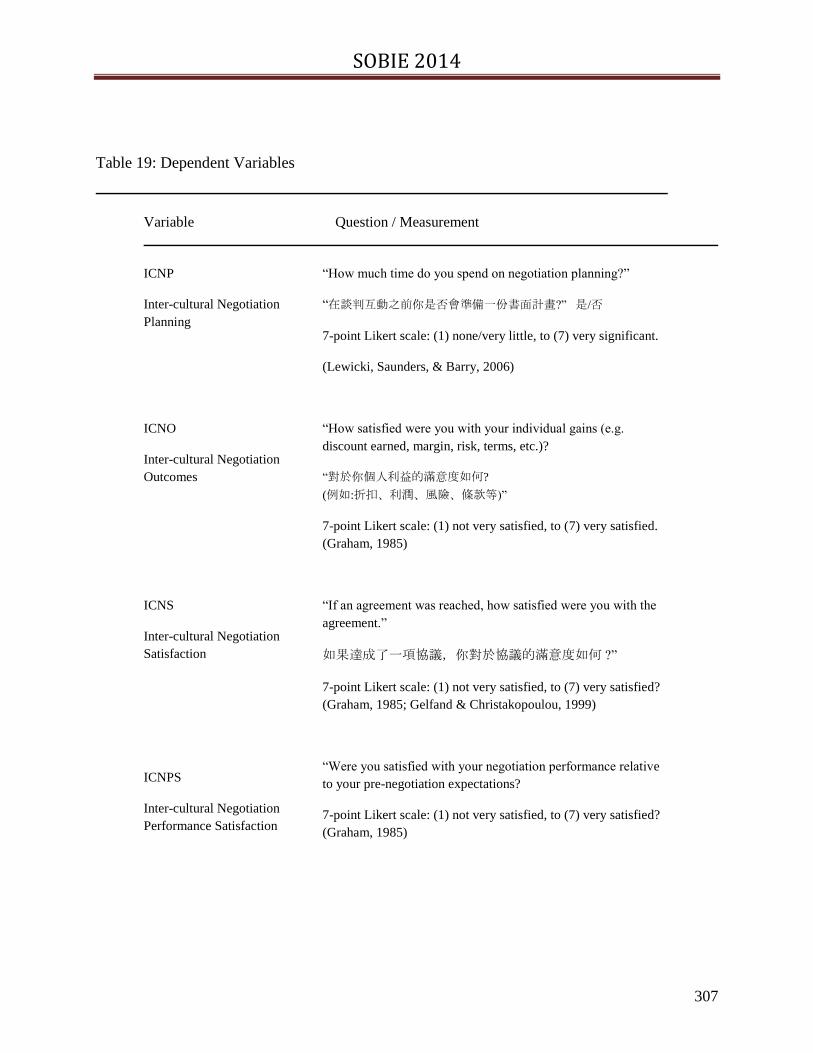
SOBIE 2014
307
Table 19: Dependent Variables
Variable Question / Measurement
ICNP
Inter-cultural Negotiation
Planning
“How much time do you spend on negotiation planning?”
“在談判互動之前你是否會準備一份書面計畫?” 是/否
7-point Likert scale: (1) none/very little, to (7) very significant.
(Lewicki, Saunders, & Barry, 2006)
ICNO
Inter-cultural Negotiation
Outcomes
“How satisfied were you with your individual gains (e.g.
discount earned, margin, risk, terms, etc.)?
“對於你個人利益的滿意度如何?
(例如:折扣、利潤、風險、條款等)”
7-point Likert scale: (1) not very satisfied, to (7) very satisfied.
(Graham, 1985)
ICNS
Inter-cultural Negotiation
Satisfaction
ICNPS
Inter-cultural Negotiation
Performance Satisfaction
“If an agreement was reached, how satisfied were you with the
agreement.”
如果達成了一項協議,你對於協議的滿意度如何 ?”
7-point Likert scale: (1) not very satisfied, to (7) very satisfied?
(Graham, 1985; Gelfand & Christakopoulou, 1999)
“Were you satisfied with your negotiation performance relative
to your pre-negotiation expectations?
7-point Likert scale: (1) not very satisfied, to (7) very satisfied?
(Graham, 1985)
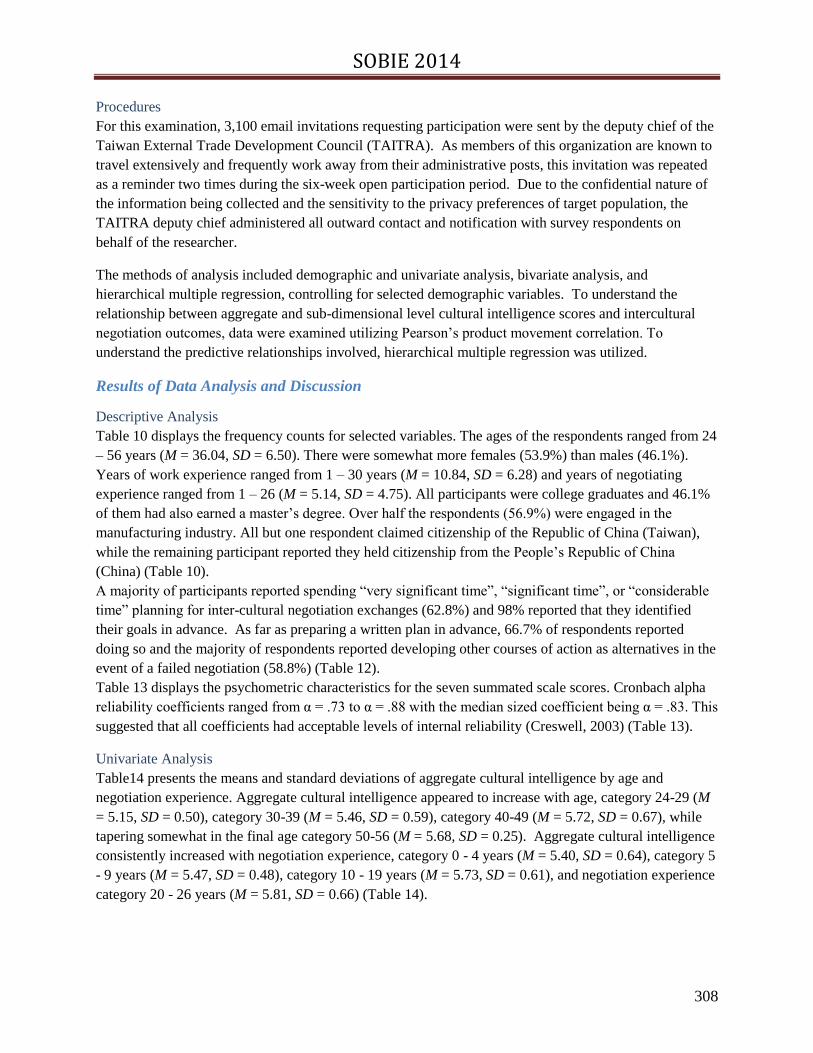
SOBIE 2014
308
Procedures
For this examination, 3,100 email invitations requesting participation were sent by the deputy chief of the
Taiwan External Trade Development Council (TAITRA). As members of this organization are known to
travel extensively and frequently work away from their administrative posts, this invitation was repeated
as a reminder two times during the six-week open participation period. Due to the confidential nature of
the information being collected and the sensitivity to the privacy preferences of target population, the
TAITRA deputy chief administered all outward contact and notification with survey respondents on
behalf of the researcher.
The methods of analysis included demographic and univariate analysis, bivariate analysis, and
hierarchical multiple regression, controlling for selected demographic variables. To understand the
relationship between aggregate and sub-dimensional level cultural intelligence scores and intercultural
negotiation outcomes, data were examined utilizing Pearson’s product movement correlation. To
understand the predictive relationships involved, hierarchical multiple regression was utilized.
Results of Data Analysis and Discussion
Descriptive Analysis
Table 10 displays the frequency counts for selected variables. The ages of the respondents ranged from 24
– 56 years (M = 36.04, SD = 6.50). There were somewhat more females (53.9%) than males (46.1%).
Years of work experience ranged from 1 – 30 years (M = 10.84, SD = 6.28) and years of negotiating
experience ranged from 1 – 26 (M = 5.14, SD = 4.75). All participants were college graduates and 46.1%
of them had also earned a master’s degree. Over half the respondents (56.9%) were engaged in the
manufacturing industry. All but one respondent claimed citizenship of the Republic of China (Taiwan),
while the remaining participant reported they held citizenship from the People’s Republic of China
(China) (Table 10).
A majority of participants reported spending “very significant time”, “significant time”, or “considerable
time” planning for inter-cultural negotiation exchanges (62.8%) and 98% reported that they identified
their goals in advance. As far as preparing a written plan in advance, 66.7% of respondents reported
doing so and the majority of respondents reported developing other courses of action as alternatives in the
event of a failed negotiation (58.8%) (Table 12).
Table 13 displays the psychometric characteristics for the seven summated scale scores. Cronbach alpha
reliability coefficients ranged from α = .73 to α = .88 with the median sized coefficient being α = .83. This
suggested that all coefficients had acceptable levels of internal reliability (Creswell, 2003) (Table 13).
Univariate Analysis
Table14 presents the means and standard deviations of aggregate cultural intelligence by age and
negotiation experience. Aggregate cultural intelligence appeared to increase with age, category 24-29 (M
= 5.15, SD = 0.50), category 30-39 (M = 5.46, SD = 0.59), category 40-49 (M = 5.72, SD = 0.67), while
tapering somewhat in the final age category 50-56 (M = 5.68, SD = 0.25). Aggregate cultural intelligence
consistently increased with negotiation experience, category 0 - 4 years (M = 5.40, SD = 0.64), category 5
- 9 years (M = 5.47, SD = 0.48), category 10 - 19 years (M = 5.73, SD = 0.61), and negotiation experience
category 20 - 26 years (M = 5.81, SD = 0.66) (Table 14).

SOBIE 2014
309
Multivariate Analysis
Table 16 displays the Pearson product-moment correlations between the seven independent variables and
the four dependent variables. For the resulting 28 correlations, all were positive and 24 of 28 were
statistically significant at the p <.05 level. The three largest correlations were: (a) intercultural negotiation
performance satisfaction with the final cultural quotient (r = .42, p <.001); (b) intercultural negotiation
performance satisfaction with the metacognitive average score (r = .38, p <.001); and (c) intercultural
negotiation satisfaction with the final cultural quotient (r = .39, p <.001) (Table 16).
Table 17 displays the Pearson product-moment correlations between the 11 independent variables and the
four control variables. The four control variables were negotiation experience, work experience, age, and
educational level. For the resulting 44 correlations, 23 of 44 were statistically significant at the p < .05
level. The four largest correlations were: (a) performance satisfaction with negotiation experience (r =
.45, p <.001); (b) performance satisfaction with work experience (r = .41, p <.001); (c) cultural judgment
decision-making with work experience (r = .40, p <.001); and (d) cultural judgment decision-making with
age (r = .40, p <.001) (Table 17).
Test of Hypotheses
Research Question 1 asked, “What is the relationship between aggregate cultural intelligence and inter-
cultural negotiation outcomes ?” and the related hypothesis predicted that, “H2: Negotiators with higher
levels of aggregate CQ will have higher levels of ICNO than negotiators with lower levels of aggregate
CQ.” To answer this question, Table 19 displays the relevant multiple regression model. The overall
model was significant (p = .003) and accounted for 16.7% of the variance of the dependent variable.
Inspection of the table found the final cultural quotient was moderately related to the intercultural
negotiation outcome (β = .30, p = .003) (Table 19).
Research Question 2 asked, “What is the relationship between cultural intelligence and inter-cultural
negotiation satisfaction?” and the related hypothesis predicted that, “H3: Negotiators with higher levels of
aggregate CQ including MetCQ, CogCQ, MotCQ and BehCQ will have higher levels of ICNS than
individuals with lower levels of CQ.” To answer this question, Table 20 displays the relevant multiple
regression model. The overall model was significant (p = .001) and accounted for 23.9% of the variance
of the dependent variable. Inspection of the table found the final cultural quotient was related to the
intercultural negotiation satisfaction score (β = .34, p = .001) (Table 20).
Research Question 3 asked, “What is the relationship between cultural metacognition and cultural
knowledge (Cultural Judgment and Decision Making) to inter-cultural negotiation planning?” and the
related hypothesis predicted that, “H1: Negotiators with higher MetCQ and CogCQ will exhibit higher
ICNP than individuals with lower MetCQ and CogCQ.” To answer this question, Table 18 displays the
relevant multiple regression model. The overall model was not significant (p = .11) and accounted for
8.9% of the variance of the dependent variable. Inspection of the table found cultural judgment decision-
making not to be related to intercultural negotiation planning (β = .17, p = .12) (Table 18).
Research Question 4 asked, “What is the relationship between cultural motivation and cultural behavior to
inter-cultural negotiation performance satisfaction?” and the related hypothesis predicted that, “H4:
Negotiators with higher levels of MotCQ and BehCQ will have higher levels of ICNPS than negotiators
with lower levels of CQ.” To answer this question, Table 21 displays the relevant multiple regression
model. The overall model was significant (p = .001) and accounted for 32.9% of the variance of the
dependent variable. Inspection of the table found the interactional adjustment quotient was moderately
related to the intercultural negotiation performance satisfaction score (β = .29, p = .001) (Table 21).

SOBIE 2014
310
Interpretation of results
It is well established that the interpretation of research in the social sciences varies; hence, this study
follows the interpretive guidelines established by Cohen, et al., (2003) relative to evaluating the strength
of linear correlations. According to Cohen, et al., a “strong correlation” generally had an absolute value of
r = .50 (reflecting the explanatory power of about twenty-five percent of the variance), a “moderate
correlation” typically had an absolute value of r = .30 (reflecting the explanatory power of about nine
percent of the variance), and a “weak correlation” generally had an absolute value of r = .10 (explaining
about one percent of the variance). Each of the following correlations described represent “moderate”
correlations reflecting the desire to interpret the results with a minimal potential for reporting data
containing Type I errors and the avoidance of misdirected conclusions.
Inspection of the table found that the intercultural negotiation planning had no significant partial
correlations with any of the seven independent variables. Intercultural negotiation outcome had
significant partial correlations with five of seven independent variables with the largest partial correlation
being with metacognitive average (rab.cdef = .32, p <.005). Intercultural negotiation satisfaction had
significant partial correlations with six of seven independent variables with the largest partial correlation
being with final cultural quotient (rab.cdef = .35, p <.001). Intercultural negotiation performance satisfaction
had significant partial correlations with five of seven independent variables with the largest partial
correlation being with motivational average (rab.cdef = .35, p <.001) (Table 16).
To sum up, this study examined the usefulness of the cultural intelligence theory as a performance
predictor in inter-cultural business negotiations based on the data from 102 respondents. The results of
this analysis suggests that aggregate cultural intelligence among experienced international negotiators can
be used to predict the outcomes, satisfaction, and behavior of inter-cultural negotiations even when
controlling for age, experience, and education.
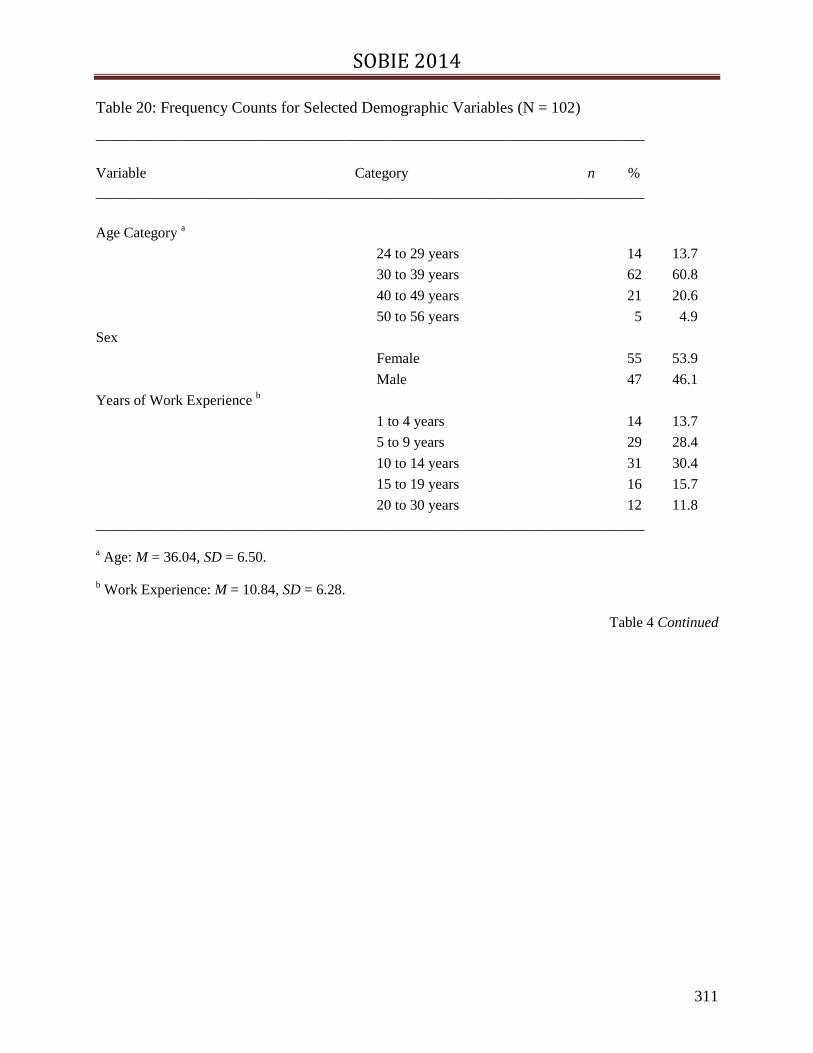
SOBIE 2014
311
Table 20: Frequency Counts for Selected Demographic Variables (N = 102)
___________________________________________________________________________
Variable Category n %
___________________________________________________________________________
Age Category a
24 to 29 years 14 13.7
30 to 39 years 62 60.8
40 to 49 years 21 20.6
50 to 56 years 5 4.9
Sex
Female 55 53.9
Male 47 46.1
Years of Work Experience b
1 to 4 years 14 13.7
5 to 9 years 29 28.4
10 to 14 years 31 30.4
15 to 19 years 16 15.7
20 to 30 years 12 11.8
___________________________________________________________________________
a Age: M = 36.04, SD = 6.50.
b Work Experience: M = 10.84, SD = 6.28.
Table 4 Continued
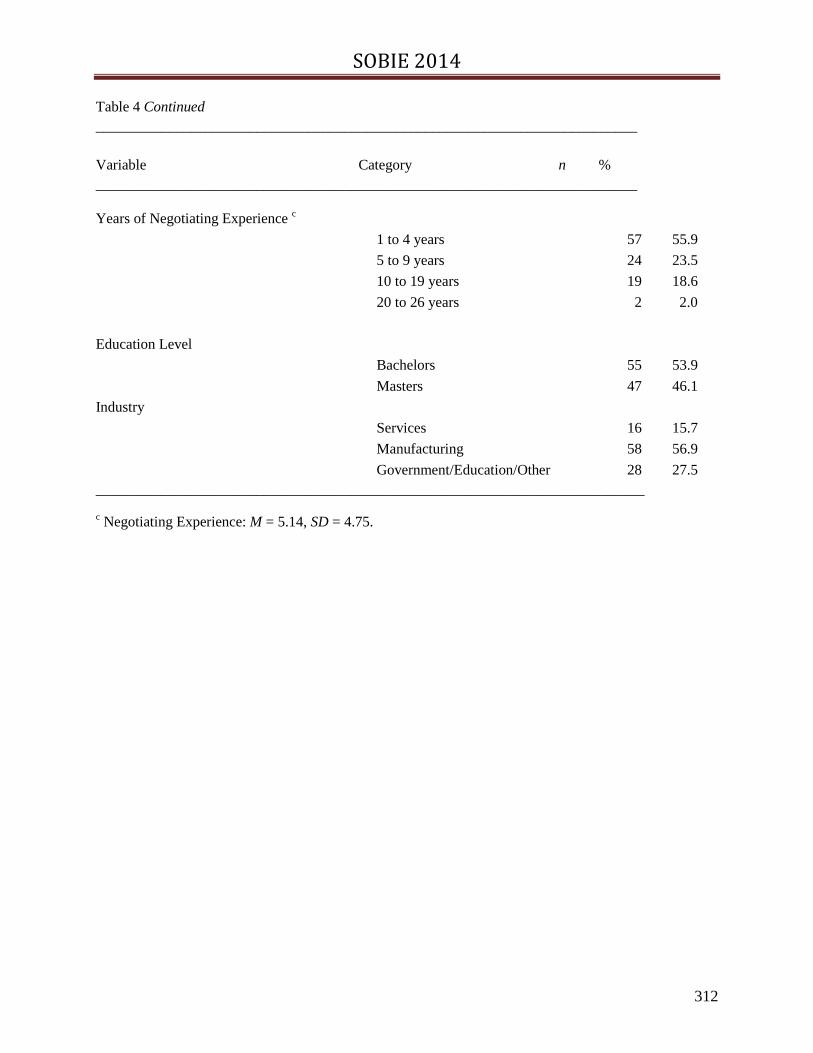
SOBIE 2014
312
Table 4 Continued
__________________________________________________________________________
Variable Category n %
__________________________________________________________________________
Years of Negotiating Experience c
1 to 4 years 57 55.9
5 to 9 years 24 23.5
10 to 19 years 19 18.6
20 to 26 years 2 2.0
Education Level
Bachelors 55 53.9
Masters 47 46.1
Industry
Services 16 15.7
Manufacturing 58 56.9
Government/Education/Other 28 27.5
___________________________________________________________________________
c Negotiating Experience: M = 5.14, SD = 4.75.

SOBIE 2014
313
Table 21: Psychometric Characteristics for Summated Scale Scores (N = 102)
__________________________________________________________________________
Number
Scale of Items M SD Low High α
__________________________________________________________________________
Metacognitive Average 4 5.72 0.72 3.50 7.00 .73
Cognitive Average 6 4.89 0.84 2.50 7.00 .81
Motivational Average 5 5.81 0.87 2.80 7.00 .87
Behavioral Average 5 5.54 0.88 2.80 7.00 .80
Cultural Judgment Decision Making 10 5.30 0.68 3.50 7.00 .83
Interactional Adjustment Quotient 10 5.67 0.75 3.60 7.00 .86
Final Cultural Quotient 20 5.49 0.61 3.70 6.65 .88
___________________________________________________________________________
Note. Scale scores were based on a seven-point metric: 1 = Strongly Disagree to 7 = Strongly Agree.

SOBIE 2014
314
Table 22: Comparison of means of aggregate cultural intelligence by age and negotiation experience (N =
102)
_______________________________________________________________ __________
Variable Category M SD Low High n
__________________________________________________________________________
___________________________________________________________________________
Note. Scale scores were based on a seven-point metric: 1 = Strongly Disagree to 7 = Strongly Agree.
Age
24 to 29 years 5.15 .50 4.48 6.22 14
30 to 39 years 5.46 .59 3.70 6.57 62
40 to 49 years 5.72 .67 4.55 6.65 21
50 to 56 years 5.72 .25 5.35 6.02 5
Negotiation experience
1 to 4 years 5.40 .64 3.70 6.65 57
5 to 9 years 5.47 .48 4.56 6.29 24
10 to 19 years 5.73 .61 4.55 6.65 19
20 to 26 years 5.81 .66 5.35 6.28 2
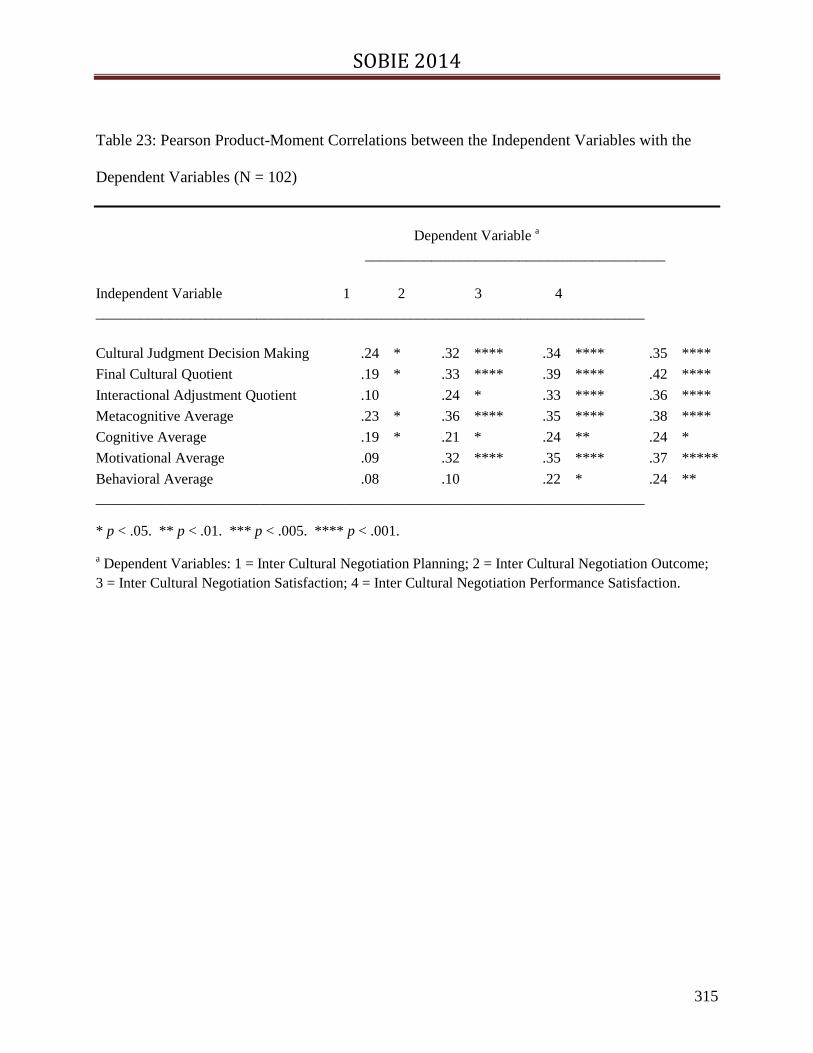
SOBIE 2014
315
Table 23: Pearson Product-Moment Correlations between the Independent Variables with the
Dependent Variables (N = 102)
Dependent Variable a
_________________________________________
Independent Variable 1 2 3 4
___________________________________________________________________________
Cultural Judgment Decision Making .24 * .32 **** .34 **** .35 ****
Final Cultural Quotient .19 * .33 **** .39 **** .42 ****
Interactional Adjustment Quotient .10
.24 * .33 **** .36 ****
Metacognitive Average .23 * .36 **** .35 **** .38 ****
Cognitive Average .19 * .21 * .24 ** .24 *
Motivational Average .09
.32 **** .35 **** .37 *****
Behavioral Average .08
.10
.22 * .24 **
___________________________________________________________________________
* p < .05. ** p < .01. *** p < .005. **** p < .001.
a Dependent Variables: 1 = Inter Cultural Negotiation Planning; 2 = Inter Cultural Negotiation Outcome;
3 = Inter Cultural Negotiation Satisfaction; 4 = Inter Cultural Negotiation Performance Satisfaction.

SOBIE 2014
316
Table 24: Pearson Product-Moment Correlations between the Scale Scores with the Control
Variables (N = 102)
__________________________________________________________________________
Control Variables a
____________________________________________
Scale Scores 1 2 3 4
__________________________________________________________________________
Cultural Judgment Decision Making .34 **** .40 **** .40 **** .27 **
Final Cultural Quotient .27 ** .32 **** .30 *** .14
Interactional Adjustment Quotient .13
.16
.12
-.01
Metacognitive Average .30 *** .34 **** .31 **** .20 *
Cognitive Average .29 *** .36 **** .39 **** .26 **
Motivational Average .12
.12
.09
.02
Behavioral Average .10
.15
.12
-.03
Planning Time .23 * .18
.16
.13
Outcome Satisfaction .26 ** .14
.08
.05
Negotiation Satisfaction .30 *** .16
.14
.20 *
Performance Satisfaction .45 **** .41 **** .36 **** .21 *
_____________________________________________________________________
* p < .05. ** p < .01. *** p < .005. **** p < .001.
a Control Variables: 1 = Negotiation Experience; 2 = Work Experience; 3 = Age; 4 = Education Level.
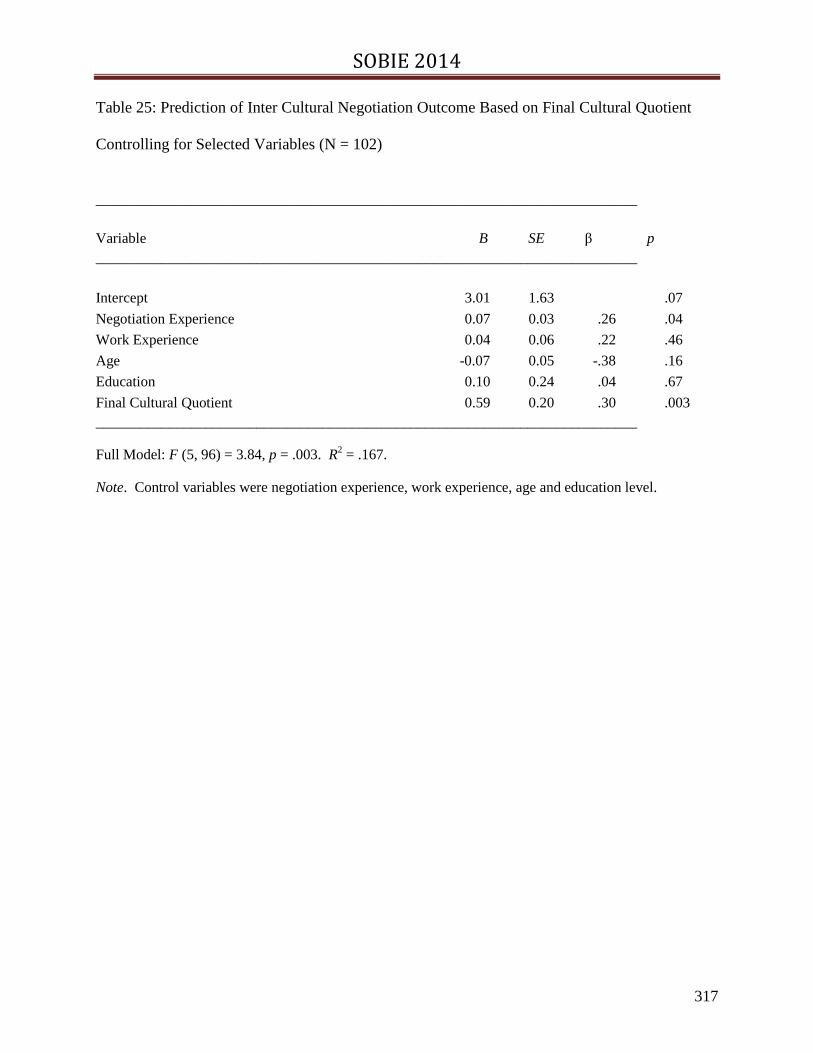
SOBIE 2014
317
Table 25: Prediction of Inter Cultural Negotiation Outcome Based on Final Cultural Quotient
Controlling for Selected Variables (N = 102)
__________________________________________________________________________
Variable B SE β p
__________________________________________________________________________
Intercept 3.01 1.63
.07
Negotiation Experience 0.07 0.03 .26
.04
Work Experience 0.04 0.06 .22
.46
Age -0.07 0.05 -.38
.16
Education 0.10 0.24 .04
.67
Final Cultural Quotient 0.59 0.20 .30
.003
__________________________________________________________________________
Full Model: F (5, 96) = 3.84, p = .003. R2 = .167.
Note. Control variables were negotiation experience, work experience, age and education level.

SOBIE 2014
318
Table 26: Prediction of Inter Cultural Negotiation Satisfaction Based on Final Cultural Quotient
Controlling for Selected Variables (N = 102)
___________________________________________________________________________
Variable B SE β p
___________________________________________________________________________
Intercept 0.53 1.84
.77
Negotiation Experience 0.10 0.04 .34
.007
Work Experience -0.02 0.06 -.07
.79
Age -0.04 0.06 -.16
.54
Education 0.54 0.27 .19
.05
Final Cultural Quotient 0.81 0.22 .34
.001
___________________________________________________________________________
Full Model: F (5, 96) = 6.02, p = .001. R2 = .239.
Note. Control variables were negotiation experience, work experience, age and education level.

SOBIE 2014
319
Table 27: Prediction of Inter Cultural Negotiation Planning Based on Cultural Judgment and
Decision Making Controlling for Selected Variables (N = 102)
__________________________________________________________________________
Variable B SE β p
__________________________________________________________________________
Intercept 2.94 1.57
.06
Negotiation Experience 0.05 0.03 .19
.16
Work Experience 0.01 0.06 .04
.89
Age -0.02 0.05 -.09
.76
Education 0.20 0.26 .08
.44
Cultural Judgment Decision Making 0.31 0.19 .17
.12
___________________________________________________________________________
Full Model: F (5, 96) = 1.87, p = .11. R2 = .089.
Note. Control variables were negotiation experience, work experience, age and education level.
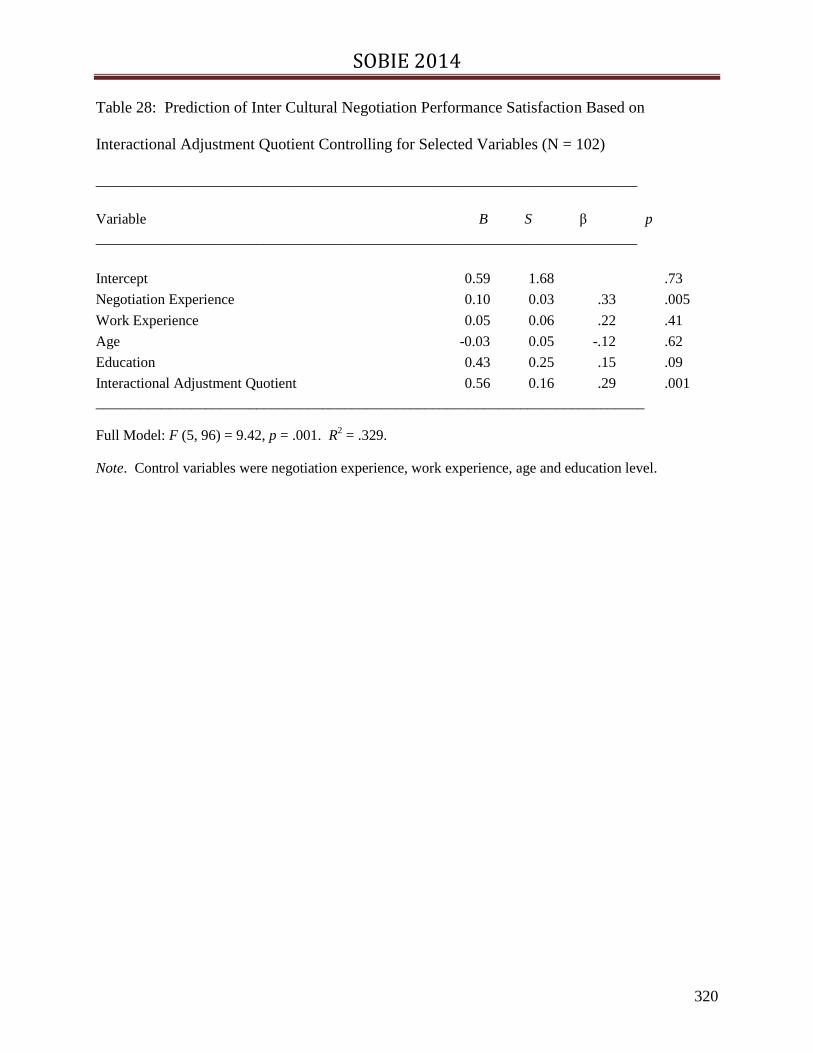
SOBIE 2014
320
Table 28: Prediction of Inter Cultural Negotiation Performance Satisfaction Based on
Interactional Adjustment Quotient Controlling for Selected Variables (N = 102)
__________________________________________________________________________
Variable B S β p
__________________________________________________________________________
Intercept 0.59 1.68
.73
Negotiation Experience 0.10 0.03 .33
.005
Work Experience 0.05 0.06 .22
.41
Age -0.03 0.05 -.12
.62
Education 0.43 0.25 .15
.09
Interactional Adjustment Quotient 0.56 0.16 .29
.001
___________________________________________________________________________
Full Model: F (5, 96) = 9.42, p = .001. R2 = .329.
Note. Control variables were negotiation experience, work experience, age and education level.

SOBIE 2014
321
Table 29: Partial Correlations between the Independent Variables and the Dependent Variables
Controlling for Selected Variables (N = 102)
___________________________________________________________________________
Dependent Variable a
_______________________________________
Independent Variable 1 2 3 4
Cultural Judgment Decision Making .16 .29 *** .26 ** 19
Final Cultural Quotient .13 .29 *** .35 **** .32 ****
Interactional Adjustment Quotient .07 .22 * .33 **** .33 ****
Metacognitive Average .16 .32 *** .28 *** .26 **
Cognitive Average .11 .18
.17
.08
Motivational Average .06 .29 *** .34 **** .35 ****
Behavioral Average .06 .08
.22 * .22 *
___________________________________________________________________________
* p < .05. ** p < .01. *** p < .005. **** p < .001.
a Dependent Variables: 1 = Inter Cultural Negotiation Planning; 2 = Inter Cultural Negotiation Outcome;
3 = Inter Cultural Negotiation Satisfaction; 4 = Inter Cultural Negotiation Performance Satisfaction.
Note. Control variables for these partial correlations were negotiation experience, work experience, age
and education level.
Discussion of the Research Findings The significance of this research is the evidence that cultural intelligence has been found to explain
significant variance in intercultural business negotiation outcomes. Furthermore, to the best of this
researcher’s knowledge, this is the only known study that examined the relationships between cultural
intelligence and intercultural business negotiation outcomes with actual international business negotiators
engaged in the regular conduct of their business, as compared to laboratory simulations. Additionally, it
contributes to the intelligence literature as the results suggested that very specific forms of intelligence
can be identified and measured, and are furthermore demonstrated to be malleable in nature in such a way
that we can expect future gains from efforts expended on improving performance.
The Relationship Between Aggregate Cultural Intelligence and Intercultural Negotiation Outcomes
There is general agreement among scholars that intracultural negotiations have long been known to reach
outcomes of higher value compared to intercultural negotiations (Adair & Bret, 2004; Thompson, 2009).
While many scholars have examined the influence of culture on intercultural negotiation outcomes under
controlled conditions (Imai & Gelfand, 2009; Simintiras & Thomas, 1997; Thompson, 2009; Miles, 2003;
Leung, Bhagat, Buchan, Erez, & Gibson, 2005), a lesser number of scholars have focused on culture and

SOBIE 2014
322
its influence on specific aspects of intercultural outcomes in uncontrolled conditions (Thomas, 2009;
Shaffer & Miller, 2008; Chua, Morris, & Mor, 2012). To date, very few have concentrated their efforts on
examining cultural intelligence and intercultural negotiation outcomes in uncontrolled conditions (Imai &
Gelfand, 2010).
As predicted in Hypothesis 1, aggregate cultural intelligence had a positive, significant, and direct
correlation with intercultural negotiation outcomes (r = .33, p < .005). Negotiators who have a greater
ability to understand and adapt to the cultural situation, shape the context to meet their goals, and modify
their behavior during intercultural negotiation exchanges tend to outperform negotiators who have a lesser
ability to understand and adapt to situations characterized by cultural diversity. Notably, at the sub-
dimension level, metacognitive cultural intelligence had the strongest positive correlation with
intercultural outcomes (r = .32, p < .001).
The results of this hypothesis support and are consistent with previous studies that have measured the
predictive ability of cultural intelligence on intercultural negotiations and have extended that research in
two ways. First, the predictive ability was established by directly measuring the predictive relationship
between cultural intelligence and negotiation outcomes, and second, by measuring the results of actual
intercultural business negotiations as compared to examining the results of simulated negotiation
exchanges.
In a related study examining the differences between intracultural and intercultural negotiations, scholars
have examined the influence of ‘cultural moderators’ or the use of an individual from the target culture as
part of a seller’s negotiating team in order to reduce the cultural distance between negotiating parties in
attempts to positively influence economic outcomes (Wilken, Jacob, & Prime, 2013). Presumably, the
more similar the negotiator’s cultures, the better chance they have at understanding the behaviors and
values of each other and hence reach outcomes of higher value. Wilken, Jacob, and Prime (2013) found
that the use of cultural moderators in these instances always help negotiators reach better economic
outcomes, regardless of the specific cultural backgrounds involved. Indeed, the presence of a cultural
moderator on the negotiating team was found to increase the use of cooperative, information sharing, and
problem-solving strategies, which stimulated the increased use of integrative strategies, and for that
reason have confirmed prior research that demonstrated the increase in joint gains through the reduction
of cultural distance (Vochita, 2008). The results of Hypothesis 2 imply that relying on cultural
intelligence as a proxy to reduce the negative effects of cultural distance between intercultural negotiators
leads to improved integrative outcomes.
Furthermore, related research suggests that the use of a cultural moderator in competitive or distributive
negotiation situations was also shown to benefit the economic gains of the team to which they were a
member. This was due to the ability of the cultural moderator to exploit their cultural proximity to their
negotiating opponent. Hence, cultural moderators, along with their native command of the cultural
context of their negotiating counterpart, as well as the ability to effectively incorporate such behaviors
into their negotiating repertoire, have resulted in situations in which they tend to reach higher outcomes
(Wilken, Jacob, & Prime, 2013).
In sum, the results from hypothesis 1 support the existing research on intercultural effectiveness and
extend that research by illustrating the beneficial utility outcomes derived by individuals who possess
higher levels of aggregate cultural intelligence when engaged in non-simulated intercultural negotiations.

SOBIE 2014
323
The Relationship Between Aggregate Cultural Intelligence
and Intercultural Negotiation Satisfaction
The relationships between negotiation satisfaction and outcomes are well established in the
literature and illustrate both positive (Curhan, Elfenbein, & Xu, 2006; Halpert, Stuhlmacher, Crenshaw,
Licher, & Bortel, 2010) and negative (Galinsky, Seiden, Kim, & Medvec, 2002; Lewicki, Barry, &
Saunders, 2010) associations. It is well established that individuals evaluate the satisfaction of their
negotiation exchanges based on both objective outcomes, as well as the behaviorally focused, subjective
outcomes of the exchange (Halpert, Stuhlmacher, Crenshaw, Licher, & Bortel, 2010). Objective outcomes
are generally established through the comparisons of standards; for example, comparison of outcomes
with pre-negotiation expectations, referred to as one’s aspiration level in negotiation terms, and a
comparison of objective outcomes relative to one’s available alternatives, known as BATNA, or Best
Alternative to a Negotiated Agreement in negotiation parlance (Fisher, Ury, & Patton, 1991). However,
each of these two comparative standards suffers from a lack of situational reality. This is because
negotiators largely do not know the value of the outcome to their negotiating opponent. They also do not
know the opponent's specific alternatives, nor do they know with any certainty what the opponent would
have accepted for their particular exchange, or indeed, what they have historically accepted for similar
situations. Hence, the inherent shortcomings of objective outcome measurement in real-world negotiation
exchanges buttress the argument for also examining subjective measurements of negotiation outcomes
such as negotiator satisfaction.
While satisfaction outcomes may be influenced by variations in culture, evidence suggests that behavioral
outcomes are influenced by culture more so than objective outcomes. As predicted in Hypothesis 2,
aggregate cultural intelligence had a positive and direct correlation with intercultural negotiation
satisfaction (r = .39, p < .0005). Negotiators who have a greater ability to understand and adapt to the
cultural situation, shape the context to meet their goals, and modify their behavior during intercultural
negotiation exchanges tend to achieve more personal satisfaction with negotiation exchanges than those
who have a lesser ability. Notably, the correlation between aggregate cultural intelligence and negotiation
satisfaction was higher than the correlation between aggregate cultural intelligence and negotiation
outcomes (Hypothesis 1). This difference is perhaps best explained by observing that negotiators derive
satisfaction from two sources: the extrinsic objective outcomes resulting from the exchange, as well as the
satisfaction from the intrinsic relationship developed (or maintained) between the parties. Negotiators
who succeed at meeting their extrinsic objectives earn satisfaction from the exchange, while negotiators
who also are satisfied with the intrinsic elements, such as a continuing relationship, derive additional
satisfaction which is additive to the overall levels of satisfaction.
The Relationship between CJDM and Intercultural Negotiation Planning
Of the four hypotheses contained within the study, this hypothesis is the only relationship that failed to
reach statistical significance. To review, the results of the present study indicated that managers who
have higher levels of metacognitive cultural intelligence and cognitive cultural intelligence, referred to as
cultural judgment and decision-making, were not more likely to engage in planning activities associated
with an upcoming intercultural negotiation. The results were not consistent with the results of a similar
study conducted by Ang, et. al (2007) whom previously found evidence to the contrary. In particular, they
did not agree with previous results that cultural judgment and decision making positively influenced the
use of deliberate reasoning, evaluation of evidence, and objective comparisons, which collectively imply
the reliance on specific data amassed based on planning efforts prior to and during the negotiation
SOBIE 2014
324
exchange. The lack of empirical support from the present study suggests that culture specific intelligence
competency bears no influence on the active pre-planning of intercultural exchanges..
The Relationship between Aggregate Cultural Intelligence
and Intercultural Negotiation Performance-Satisfaction
There exists a strong research tradition relative to cross-cultural performance adjustment that
focuses on converging constructs of expatriate assignments; namely, the assimilation, performance,
satisfaction, and the return and re-assignment of expatriate workers after cross-cultural assignments
(Zhang, 2012; Shaffer, Ferzandi, Harrison, Gregersen, & Black, 2006; Cole N. D., 2011). Supporting this
convergence of research are motivational elements of Ryan and Deci’s Self-Determination Theory (Ryan
& Deci, 2000) as well as the intrinsic motivational aspects of Bandura’s Self-Efficacy Theory (Bandura,
1997). As the field was expanded, this body of research focused on measures of individual differences
such as the Big Five (Shaffer, Ferzandi, Harrison, Gregersen, & Black, 2006), gender (Cole & McNulty,
2011) and relevant stakeholders (Takeuchi, 2010), among others. The literature on intercultural
effectiveness illustrates significant positive relationships between increased cultural sensitivity and
understanding, and performance outcomes (Pedersen, 2009). Indeed, some research more narrowly
examines the predictive qualities of cultural intelligence on expatriate worker effectiveness (Malek &
Budhwar, 2012) and cross-cultural adjustment (Lin, Chen, & Song, 2012), and hence, individual
satisfaction (Halpert, Stuhlmacher, Crenshaw, Licher, & Bortel, 2010).
Reviewing the results of the present study, the combination of motivational cultural intelligence
and behavioral cultural intelligence, referred to as interactional adjustment accounted for 32.9% of the
variance in performance-satisfaction. As predicted in Hypothesis 4, interactional adjustment had a
positive and direct correlation with intercultural performance-satisfaction (r = .29, p < .001) which
suggests that negotiators who have the desire to engage in intercultural exchanges, as well as the
behavioral capability to display those behaviors appropriately, experienced greater satisfaction with their
personal performance. Although not included in the composite sub-dimension of interactional adjustment,
metacognitive cultural intelligence was markedly demonstrated to be the sub-dimension with the strongest
correlation to intercultural negotiation performance-satisfaction (r = .38) with motivational cultural
intelligence following just behind (r = .37).
The results of Hypothesis 4 are in alignment with the original interactional adjustment findings of
Ang et al. (2007) which examined intercultural performance satisfaction with university students and
extend those results to the real-world realm of intercultural negotiators. These findings may also serve to
extend the work on cross-cultural adjustment by suggesting that higher interactional adjustment among
intercultural negotiators reduces the level of performance uncertainty when operating in a foreign context.
An individual’s heightened interactional adjustment also serves to increase an intercultural negotiators
self-efficacy and thereby psychologically expand one’s confidence in their use of a broader repertoire of
available behaviors during the exchange.
In sum, three of the four hypotheses were found to be significant and either support or extend the
extant literature on cultural intelligence and intercultural exchange outcomes. The next section presents
limitations and opportunities for future research.

SOBIE 2014
325
Theoretical and Research Implications
The results of this research offer a number of contributions to the field. First, this study of the influence of
aggregate and sub-dimensional facets of cultural intelligence is the first to examine the outcomes of real-
world intercultural negotiation outcomes involved in the normal course of business. While self-report
studies are susceptible to certain individual response biases, the use of laboratory simulations under
artificial conditions also suffer from the rigor of study under situations where meaningful outcomes are
less prevalent. As a result, these findings may help to corroborate or refute the work of related
examinations or provide a basis for others to disembark.
Second, and not surprising, is that metacognitive cultural intelligence had the most influence on all
measured intercultural negotiation outcomes. Indeed, the general theory of cultural intelligence suggests
that individuals with higher levels of cultural intelligence are enabled to ‘make sense’ of culturally
distinct situations to a greater extent than individuals with lower levels of cultural intelligence. This work
found that cultural metacognition equipped individuals with a heightened ability to ‘make sense’ of
foreign contextual cues above and beyond other known intercultural negotiation outcome influencers
such as age, level of education, or negotiation experience
Finally, these research findings add a new perspective to the existing literature by suggesting that
metacognitive cultural intelligence and motivational cognitive intelligence work together to enhance
outcomes. Imai and Gelfand (2010) found that motivational cultural intelligence is strongly related to
cooperative negotiation motives and the present study found that metacognitive cultural intelligence
predicts satisfaction and outcomes. Taken together, it is conceivable that high metacognitive individuals
build upon their heightened motivational cultural intelligence abilities in such a way that the shaping
characteristics of cultural metacognition permit negotiators to respond in kind to their counterparties’
strategies and tactics with greater levels of persistence, energy, and skill, thereby further increasing
outcomes.
The combination of cultural metacognition and cultural motivation shaping intercultural exchanges also
serves to contradict earlier work by Imai and Gelfand (2010) whose research suggested that higher
outcomes arising from sequences of integrative behaviors were limited to a ‘weakest link’ among the
dyad. The present study suggests that while optimal outcomes may not be reached when one member of
the negotiating dyad suffers from weak cultural intelligence, the other member of the exchange may be
able to fill part of the gap through the correct appraisal and active shaping of the negotiation context.
Managerial Considerations
The practical utility of this research highlights the importance of efforts that more closely relate to the
complex aspects of intercultural negotiation by first defining, and then focusing on specific aspects of the
problem. This is particularly beneficial for the present study as the cultural intelligence model offers the
benefit of “theoretical precision” (Gelfand, Imai, & Fehr, 2008, p. 376), a concept that identifies and
defines specific cultural intelligence dimensions for practitioners to manipulate while attempting to
improve an individual’s intercultural exchange outcomes. This approach to examining intercultural
negotiation outcomes differs from practitioners’ traditional focus on issuing prescriptive advice often
centered on the development of logic driven game theory, which suffer from the incorrect assumption that
negotiators exclusively engage in a rational decision making processes designed to maximize their
expected utility outcomes. Moreover, this work highlights the influence of the behavioral, motivational,

SOBIE 2014
326
and affective factors on negotiation outcomes consistent with the growing interest in individual judgment
research.
One final practical benefit of increased cultural intelligence on intercultural negotiation exchanges
involves the ability to produce agreements that benefit from cross cultural perspective taking and the
constructing of mutually beneficial solutions that reach higher joint value. As negotiation is in essence a
communication activity, increasing an individual’s ability to communicate (both speaking and listening)
and appreciate the perspective, position, and environmental context of their culturally distinct
counterparty enables individuals to suspend judgment and foster the creative dynamics necessary to
develop mutually beneficial and higher valued solutions.
Conclusion The importance of intercultural exchanges, particularly business negotiations continues to play a role in
our increasingly interrelated global economy. This paper has attempted to extend the literature on the
influence of cultural intelligence on intercultural effectiveness by examining the international business
negotiation outcomes of experienced international negotiators involved in the actual conduct of their
business. In summary, the cultural intelligence construct and related sub-dimension scores are an ideal
point at which to launch more sophisticated intercultural assignment programs as well as explore cultural
capacity-enhancement training initiatives customized to the particular needs of individual negotiators may
equip them to produce agreements/solutions of high value.
Bibliography
Actuary, O. o. (2009, November 12). Disability Insurance Trust Fund. Retrieved January 20,
2014, from Social Security Online Trust Fund Data:
http://www.ssa.gov/oact/ProgData/describedi.html
Adair, W. (2003). Integrative sequences and negotiation outcome in same and mixed culture
negotiations. The International Journal of Conflict Management, 14(3), 273-296.
Adair, W., & Bret, J. M. (2004). Culture and Negotiation Process. In M. J. Gelfand, & J. M.Bret,
The Handbook on Negotiation and Culture (pp. 158-176). Stanford: Stanford Business
Books.

SOBIE 2014
327
Adair, W., Brett, J. M., & Okumura, T. (2001). Negotiation behavior when cultures collide: The
United States and Japan. Journal of Applied Psychology, 86(3), 371-385.
Adler, N. J., & Graham, J. L. (1989). Cross-Cultural Interaction: The International Comparison
Fallacy? Journal of International Business Studies, 515-537.
Administration, S. S. (n.d.). Disability Evaluation Under Social Security. Retrieved January 20,
2014, from Social Security.
Ang, S., & Van Dyne, L. (2008). Conceptualization of Cultural Intelligence. In S. Ang, & L. V.
Dyne, Handbook of Cultural Intelligence (pp. 3-15). Armonk: M.E. Sharpe.
Ang, S., Van Dyne, L., & Tan, M. L. (2011). Cultural Intelligence. In R. J. Sternberg, & S. B.
Kaufman, Cambridge Handbook on Intelligence (pp. 582-601). Cambridge: Cambridge
University Press.
Ang, S., Van Dyne, L., Koh, C., Ng, .. Y., Templer, K. J., Tay, C., et al. (2007). Cultural
Intelligence: Its Measurement and Effects on Cultural Judgment and Decision Making,
Cultural Adaptation, and Task Performance. Management and Organization Review,
3(03), 335-371.
Ang, S., Van Dyne, L., Koh, C., Ng, K. Y., Telpler, K. J., Tay, C., et al. (2007). Cultural
Intelligence: It's measurement and Effects on Cultural Judgement and Decision Making,
Cultural Adaption and Task Performance. Management and Organization, 3(3), 335-371.
Audit, T. O. (2013). The Social Security Administration's Reporting of High-dollar
Overpayments Under Executive Order 13520 in Fiscal Year 2013. Baltimore, MD:
Office of the Inspector General.
Autor, D., & Duggan, M. (2003). The Rise in the Disability Rolls and the Decline in
Unemployment. Quarterly Journal of Economics, 157-206.
Baker, D. (2013, October 6). CBS News 60 MInutes Joins the Disabilty Bashing Bandwagon.
Retrieved January 20, 2014, from Center for Economic and Policy Research:
http://www.cepr.net/index.php/blogs/beat-the-press/cbs-news-60-minutes-joins-the-
disability-bashing-bandwagon
Bandura, A. (1997). Self-efficacy: the exercise of control. New York: W.H.Freeman.
Bandura, A. (2001). Social Cognitive Theory: An Agentic Perspective. Annual Review of
Psychology, 52, 1-26.
Benoliel, M. (2011). Negotiation Excellence: Successful Deal Making. Singapore: World
Scientific Publishing.
Brislin, R., Worthley, R., & MacNab, B. (2006). Cultural Intelligence: Understanding Behaviors
That Serve People's Goals. Group Organizational Management, 31(1), 40-55.
Burkhouser, R., & Daly, M. (2011). The Declining Work and Welfare of People with
Disabilities: What Went Wrong and a Strategy for Change. Washington, DC: AEI Press.
CBS/AP. (2014, January 7). Cops, firefighters among 100 former NYC workers charged in
disability scam. Retrieved January 18, 2014, from CBSNews.com:
http://www.cbsnews.com/news/100-nyc-workers-charged-in-disability-scam/
Christensen, K., Doblhammer, G., Rau, R., & Vaupel, J. W. (2009). Ageing Populations: The
Challenges Ahead. Laucet, 1196-208.

SOBIE 2014
328
Chua, R. Y., Morris, M. W., & Mor, S. (2012). Collaborating across Cultures: Cultural
Metacognition & Affect-Based Trust in Creative Collaboration. Organizational Behavior
and Human Decision Processes, In press.
Chung, M., & Ingleby, R. (2011). The applicability of Western socio-legal frameworks to the
study of negotiation in Chinese society. Journal of Higher Education Policy and
Management, 169-177.
Cohen, J., Cohen, P., West, S. G., & Aiken, L. S. (2003). Applied Multiple
Regression/Correlation Analysis for the Behavorial Sciences (3rd ed.). New Jersey:
Erlbaum.
Cole, N. D. (2011). Managing global talent: solving the spousal adjustment problem. The
International Journal of Human Resourse Management, 1504-1530.
Cole, N., & McNulty, Y. (2011). Why do female expatriates "fit-in" better than males? Cross
Cultural Management: An International Journal, 144-164.
Creswell, J. (2003). Research Design: Qualitative, Quantitative and Mixed Methods Approaches
(2 ed.). Thousand Oaks: Sage.
Curhan, J. R., Elfenbein, H. A., & Xu, H. (2006). What Do Peopple Value When They
Negotiate? Mapping the Domain of Subjective Value in Negotiation. Journal of
Personality and Social Psychology, 493-512.
DeDreu, C., Weingart, L., & Kwon, S. (2000). Influence of social motives on integrative
negotiation: A meta-analytic review and test of two theories. Journal of Personality and
Social Psychology, 78, 889-905.
Earley, P., & Ang, S. (2003). Cultural Intelligence: Individual interactions across cultures. Palo
Alto: Oxford University Press.
Early, P. C., Ang, S., & Tan, J. (2006). Developing Cultural Intelligence at Work. Stanford, CA:
Stanford Business Books.
Fisher, R., Ury, W., & Patton, B. (1991). Getting to Yes: Negotiating agreement without giving
in (2nd ed.). New York: Penguin.
Flavell, J. (1979). Metacognition and cognitive monitoring: A new era of cognitive-
developmental inquiry. American Psychologist, 34(10), 906-911.
Galinsky, A. D., Seiden, V. L., Kim, P. H., & Medvec, V. H. (2002). The Dissatisfaction of
Having Your First Offer Accepted: The Role of Counterfactual Thinking in Negotiations.
Personality and Social Psychology Bulletin, 271-283.
Gelfand, M. J., & Brett, J. M. (2004). The Handbook of Negotiation and Culture. Stanford:
Stanford University Press.
Gelfand, M. J., & Christakopoulou, S. (1999). Culture and Negotiator Cognition: Judgment
Accuracy and Negotiation Processes in Individualistic and Collectivistic Cultures.
Organizational Behavior and Human Decision Processes, 79, 248-269.
Gelfand, M., Imai, L., & Fehr, R. (2008). Thinking Intelligently About Cultrural Intelligence. In
S. Ang, & L. V. Dyne, Handbook of Cultural Intelligence: Theory, Measurement, and
Applications (pp. 375-387). Armonk: M.E. Sharpe.
Graham, J. L. (1985). Cross-Cultural Marketing Negotiations. Marketing Science, 130-146.

SOBIE 2014
329
Graham, J. L. (1985). Cross-Cultural Marketing Negotiations. Marketing Science, 130-146.
Graham, J. L., Mintu, A. T., & Rodgers, W. (1994). Explorations of Negotiation Behaviors in
Ten Foreign Cultures Using a Model Developed in the United States. Management
Science, 72-95.
Hall, E. T. (1959). The Silent Language. New York: Doubleday.
Halpert, J. A., Stuhlmacher, A. F., Crenshaw, J. L., Licher, C. D., & Bortel, R. (2010). Paths to
Negotiation Success. Negotiation and Conflict Management Research, 91-116.
Hart, P. (2013, October 7). What Did 60 Minutes Get Wrong About Disability. Retrieved January
20, 2014, from Fairness & Accuracy In Reporting:
http://www.fair.org/blog/2013/10/07/what-did-60-minutes-get-wrong-about-disability/
Imai, L., & Gelfand, M. (2009). Culture, conflict, and negotiation. In R. S. Bhagat, & R. M.
Steers, Cambridge Handbook of culture, organizations, and work (pp. 339-372).
Cambridge: Cambridge University Press.
Imai, L., & Gelfand, M. J. (2009). Culture, conflict, and negotiation. In R. S. Bhagat, & R. M.
Steers., Cambridge Handbook of culture, organizations, and work (pp. 334-372).
Cambridge: University Press.
Imai, L., & Gelfand, M. J. (2010). The culturally intelligent negotiator: The influence on Cultural
Intelligence (CQ) on negotiation sequences and outcomes. Organizational Behavior and
Human Decision Processes, In press.
Judge, T. A., Thoresen, C. J., Bono, J. E., & Patton, G. K. (2001). The job satisfaction–job
performance relationship: A qualitative and quantitative review." Psychological bulletin
127, no. 3 (2001): 376. Psychological Bulletin, 376-407.
Kim, E.-M. (1998). The four Asian tigers: economic development and the global political
economy. San Diego: Academic Press.
Koneya, M., & Barbour, A. (1976). Louder than words...Nonverbal communications. Columbus:
Merrill.
Kroft, S. (2013, October 10). 60 Minutes. Retrieved January 20, 2014, from CBSNews.com:
http://www.cbsnews.com/news/disability-usa/
Law, K. S., Wong, C.-S., & Song, L. J. (2004). The Construct and Criterion Validity of
Emotional Intelligence and Its Potential Utility for Management Studies. Journal of
Applied Psychology, 89(3), 483-496.
Leung, K., Bhagat, R. S., Buchan, n. R., Erez, M., & Gibson, C. B. (2005). Culture and
International Business: Recent Advances and Their Implications for Future Research.
Journal of International Business Studies, 357-378.
Lewicki, R., Barry, B., & Saunders, D. M. (2010). Negotiation. New York: McGraw Hill.
Lewicki, R., Saunders, D., & Barry, B. (2006). Negotiation. Singapore: McGraw Hill.
Lin, Y.-c., Chen, A. S.-y., & Song, Y.-c. (2012). Does your intelligence help to survive in a
foreign jungle? The effects of cultural intelligence and emotional intelligence on cross-
cultural adjustment. International Journal of Intercultural Relations, 541-552.

SOBIE 2014
330
Luo, Y., & Shenkar, O. (2002). An empirical inquiry of negotiation effects in cross-cultural joint
ventures (Vol. 8). Journal of International Management.
Maestas, N., Mullen, K., & Strand, A. (2012, August). Does Disabilty Insurance Receipt
Discourage Work? Using Examiner Assignment to Estimate Causal Effects of SSDI
Receipt. Michigan Retirement Research Center. Ann Arbor, Michigan: University of
Michigan.
Malek, M. A., & Budhwar, P. (2012). Cultural intelligence as a predictor of expatriate
adjustment and performance in Malaysia. Journal of World Business, in press.
Malhotra, D., & Bazerman, M. (2008). Psychological Influence in Negotiation: An Introduction
Long Overdue. Journal of Management, 34(3), 509-531.
Miles, M. (2003). Negotiating with the Chinese: Lessons from the Field. Journal of Applied
Behavioral Science, 453-472.
Morris, M. W., & Gelfand, M. J. (2004). Cultural Differences and Cognitive Dynamics:
Expanding The Cognitive Perspective on Negotiation. In M. J. Gelfand, & J. M. Bret,
The Handbook of Negotiation anf Culture (pp. 45-70). Stanford: Stanford University
Press.
Nadler, J., Thompson, L., & Van Boven, L. (2003). Learning Negotiation Skills: Four Models of
Knowledge Creation and Transfer. Management Science, 529-540.
Pedersen, P. J. (2009). Assessing intercultural effectiveness outcomes in a year-long study
abroad program. Internatinal Journal of Intercultural Relatinos, 70-80.
Robbins, S. P., & Judge, T. A. (2009). Organizational Behavior. Upper Saddle River: Pearson.
Ryan, R. M., & Deci, E. L. (2000). Self-Determination Theory and the Facilitation of Intrinsic
Motivation, Social Develoment, and Well-Being. American Psychologist, 68-78.
Salacuse, J. (1988). Making Deals in Strange Places. Negotiation Journal, 4(1), 5-13.
Schneider, A. K. (2002). Shattering Negotiation Myths. Harvard Negotiation Law Review, 142-
233.
Sekaran, U. (2000). Research Methods for Business (3rd ed.). New York, NY: John Wiley and
Sons.
Shaffer, M. A., Ferzandi, L. A., Harrison, D. A., Gregersen, H., & Black, J. S. (2006). You can
take it with you: Individual differences and expatriate effectiveness. Journal of Applied
Psychology, 91, 109-125.
Shaffer, M., & Miller, G. (2008). Cultural Intelligence: A Key Success Factor for Expatriates. In
S. Ang, & L. V. Dyne, Handbook of Cultural Intelligence: Theory, Measurement and
Applications (pp. 107-125). Armonk: M.E. Sharpe.
Simintiras, A., & Thomas, A. (1997). Cross Cultural Sales Negotiations. International Marketing
Review, 10-28.
Sternberg, R. J. (1999). Successfull Intelligence: finding a balance. Trends in Cognitive Science,
3(11), 436-442.
Sternberg, R. J., & Detterman, D. J. (1986). What is intelligence: Contemporary viewpoints on
its nature and definition. Norwood, NJ: Ablex.

SOBIE 2014
331
Takeuchi, R. (2010). A Critical Review of Expatriate Adjustment Research Through a Multiple
Stakeholder View: Progress, Emerging Trends, and Prospects. Journal of Management,
1040-1064.
Templer, K. J., Tay, C., & Chandrasekar, N. A. (2006). Motivational Cultural Intelligence,
Realistic Job Preview, Realistic Living Conditions Preview, and Cross Cultural
Adjustment. Group and Organizational Management, 31(1).
Thomas, D. C. (2006). Domain and Development of Cultural Intelligence: The Importance of
Mindfulness. Group and Organization Management, 78-99.
Thomas, D. C. (2009). Cultural Intelligence living and working globally. San Francisco: Berrett-
Koehler.
Thompson, L. L. (2009). The Mind and Heart of the Negotiator. Upper Saddle River: Prentice
Hall.
Triandis, H. (2006). Cultural Intelligence in Organizations. Group and Organization
Management, 31(1), 20-26.
United States Department of Agriculture. (2012, December 31). International Macroeconomic
Data Set. Retrieved April 7, 2013, from USDA: http://www.ers.usda.gov/data-
products/international-macroeconomic-data-set.aspx
Van Dyne, L., Ang, S., & Koh, C. (2008). Development and Validation of the CQS. In S. Ang, &
L. V. Dyne, Handbook of Cultural Intelligence: Theory, Measurement, and Applications
(pp. 16-40). Armonk, NY: M.E.Sharpe.
Vochita, L. (2008). The Role of Culture on International Negotiations. Annals of the University
of Petrosani, 297-302.
Weingart, L. R., & Olekalns, M. (2004). Communication Process in Negotiation. In M. J.
Gelfand, & J. M. Brett, The Handbook of Negotiation and Culture: Frequencies,
Sequences, and Phases (pp. 143-176). Stanford: Stanford University Press.
Whetton, D. (2011). Developing Management Skills. NJ: Pearson.
Wigfield, A., & Eccles, J. (2000). Expectancy-Value Theory of Achievement Motivation.
Contemporary Educational Psychology, 25, 68-81.
Wilken, R., Jacob, F., & Prime, N. (2013). The ambiguous role of cultural moderators in
intercultural business negotiations. International Business Review, 736-753.
Zhang, Y. (2012). Expatriate Development for Cross-Cultural Adjustment: Effects of Cultural
Distance and Cultural Intelligence. Human Resource Deveopment Review, 177-199.

SOBIE 2014
332
Rankings, Spreads, and Winning BCS College Football Games
Evan Moore
Solomiya Lyshenyuk
Auburn University at Montgomery
Abstract
We investigate predictors for the outcomes of Bowl Championship Series (BCS) college
football games. We evaluate whether the differences in rankings between teams and the point
spread are good predictors for outcomes of Bowl Championship Series games, which involve top
ranked teams in the NCAA Division I Football Bowl Subdivision. We use probit regressions
with the differences in ranking, differences in the log rankings, and the point spread as the
predictors of the outcomes of the games.
Introduction
We investigate predictors for the outcomes of Bowl Championship Series (BCS) college
football games. We test whether ranking differences, using rankings from the Associated Press
(AP) and the USA Today polls, are good predictors for Bowl Championship Series (BCS) game
victories for the 1998-1999 through 2013-2014 college football seasons.1 This testing also allows
for a comparison of the rankings by these polls. We also test whether the point spread, or line, is
a good predictor for BCS game victories.
Interest in rankings of athletic competitors is growing. Lebovic and Sigelman (2001) note
that college football rankings, “…have by no means escaped the notice of social scientists and
statisticians, who have probed the predictive accuracy of various ranking and rating schemes.”
Their work uses AP poll data to show weekly changes in rankings. These authors also provide a
concise overview of works from the 1980s and 1990s on college football rankings. However,
none of these works uses differences in rankings to predict college football victories. Differences
in rankings have been found to be good predictors of winning other various sporting contests.
Boulier et al (1999) find ranking differences are useful predictors in NCAA basketball games
and professional tennis matches. Rankings differences were also found to be useful predictors for
Grand Slam tennis matches by del Corral and Prieto-Rodriguez (2010).
A priori, we anticipate the point spread to serve as the best predictor for BCS game
victories. This is due to the fact that the rankings are established following the last regular season
or conference championship game for each team participating in a BCS game, and these rankings
are given weeks prior to the bowl games actually being played.2 However, the point spread
1 The USA Today poll is also known as the Amway Coaches poll.
2 In some cases there is more than a month between a team’s last regular season game and their BCS game.

SOBIE 2014
333
reflects information available to bettors up to the start of the game. In this sense, the bettors are
able to incorporate the rankings that are available along with additional information, e.g. player
injuries or suspensions, coaching changes, etc., which would not have been available to pollsters
at the time their rankings were announced. Due to the informational advantage available to
bettors we expect the point spread to best predict victory.
We chose the BCS bowl games as the focus of the study for three primary reasons:
(1) Virtually all of the games involve two ranked teams.3
(2) These are the most watched college football games according to Nielson ratings.
(3) For a given year, the rankings prior to the bowl games better reflect that season’s actual
performance relative to preseason or earlier in the season rankings.
We find that rankings differences may be useful predictors for BCS bowl game victories.
However, this finding pertains to the USA Today poll and the best predictive power with
differences in log ranks, suggesting that quality differences grow at an increasing rate at higher
rankings.
Data
The Associate Press poll consists of weekly voting from a panel of sports writers and
broadcasters from around the country; currently the panel consists of 60 voters. The USA Today
poll consists of weekly voting from a panel of head coaches at Bowl Subdivision schools; this
panel currently consists of 62 head coaches. These polls provide rankings for the top 25 teams.
The rankings data was collected from www.espn.com and The New York Times. The rankings
data used in this analysis consists of the final rankings of the BCS teams prior to their bowl
games, i.e. the rankings following the last regular season or conference championship game for
each team participating in a BCS game. The point spread and totals, i.e. over/under, data was
collected from www.covers.com.
There were 72 BCS games played from the 1998 -1999 through 2013-2014 seasons, with
1998-1999 being the introduction of the BCS. From the 1998-1999 through 2005-2006 seasons
there were 4 BCS games per season. This changed to 5 BCS games per season in 2006-2007.
Thus, the data used in the analysis below reflects all BCS games to date.
3 The two exceptions being the 2011 Fiesta Bowl involving a team from the University of Connecticut, which was
unranked in the USA Today poll, and the 2013 Rose Bowl involving a team from Stanford University, which was unranked in the AP Poll.

SOBIE 2014
334
Table 1. Descriptive statistics
AP
USA
Today Point spread
Higher ranked/favored team wins 46 40 44
Number of games 72 72 71
Predicted win percentage 63.89% 55.56% 61.97%
Mean rank difference/mean point spread -4.68 -4.44 -7.09
Standard deviation 4.72 4.29 4.19
Table 1 presents an overview of the number of wins and winning percentages for higher
ranked teams by poll and for favored teams by point spread. The winning percentages of the AP
poll and point spread are similar and exceed 60 percent, while the higher ranked teams according
to the USA Today poll won just under 56 percent. In the 6 fewer wins by higher ranked teams
with the USA Today poll, the differences in ranks were just 1 position in 4 instances and 2
positions in the remaining 2 instances. These “upsets” could be viewed as not particularly
surprising given the closeness in rankings by the teams playing in these matchups.
Methodology and results
We use two approaches for the differences in rankings. We use the difference s1-s2, where
s1 is the ranking of the higher ranked team and s2 is the ranking of the lower ranked team in a
manner similar to Boulier et al (1999). We also use the difference between the natural logarithms
of the rankings, i.e. log (s1) – log (s2), similar to that of del Corral et al (2010). The first approach
provides a simple linear difference between the ranks. The second approach provides a nonlinear
measure that allows for greater differences between teams as they move up the rankings. This
method suggests that a one position difference in rankings is more substantial for higher ranked
teams than for lower ranked teams.
The dependent variable takes a value of 1 if the higher ranked or favored team wins in the
probit models to follow. The independent variables for the differences in rankings are negative
values; a higher ranked team has a lower number than a lower ranked team.4 The point spread
independent variable is non-positive; the spread is reported as a negative number for the favored
team or as zero if the point spread does not indicate a favorite.5
Table 2 presents the estimated coefficients of the probit equations for the linear
differences in ranking by each poll and the point spread.
4 For example, a team ranked #3 is higher ranked than a team ranked #7.
5 A point spread of zero only occurred in one instance, the 2001 Rose bowl.

SOBIE 2014
335
Table 2. Probit results for poll differences and point spread
AP Top 25
USA Today
Point Spread
Coeff.
St.
dev.
Coeff.
St.
dev.
Coeff. St. dev.
Constant 0.204 0.217
-0.248 0.224
0.170 0.297
Rank difference/point spread -0.030 0.034 -0.088** 0.041 -0.019 0.036
Brier Score 0.2297
0.2308
0.2347
N 71
71
71
LR Test 0.78
5.23
0.28
Pseudo R2 0.008
0.054
0.003
Log likelihood -46.24 -46.25 -47.02 Notes: * is significance at 10 percent, ** is significance at 5 percent, and *** is significance at 1 percent.
The signs of the coefficients are as expected. Negative values indicate that higher ranked
and favored teams are more likely to win. However, only the Rank difference coefficient from
the USA Today poll model indicates a statistically significant result at the usual levels.
Table 3 presents the estimated coefficients of the probit equations for the log differences
in ranking by each poll and, for the sake of comparison, the point spread once again.6
Table 3. Probit results for log differences in polls and point spread
AP Top 25
USA Today
Point Spread
Coeff.
St.
dev.
Coeff. St. dev.
Coeff.
St.
dev.
Constant -0.020 0.304
-0.598* 0.328
0.170 0.297
Rank difference/point spread -0.508 0.374 -1.030** 0.42 -0.019 0.036
Brier Score
0.226
1
0.2261
0.2347
N 71
71
71
LR Test 1.91
6.55
0.28
Pseudo R2 0.021
0.067
0.003
Log likelihood -45.68 -45.59 -47.02 Notes: * is significance at 10 percent, ** is significance at 5 percent, and *** is significance at 1 percent.
The negative and significant coefficients on the rankings differences for the USA Today
poll models indicate that the probability of winning a BCS bowl game is a function of the
difference in rankings of the teams. Note that the Brier scores for the log difference models
indicate that these are the best fitting of the results presented in tables 3 and 4. This suggests that
there are quality differences at higher ranks relative to lower ranked teams.
6 We also used the squared rankings differences, s1
2-s2
2, as the independent variable in models that are available
upon request. This difference in rankings indicates that lower ranked teams would have greater quality differences than higher ranked teams. This would not be expected and the results from these models were not statistically significant and resulted in the worst fitting Brier scores relative to the models presented in tables 3 and 4.

SOBIE 2014
336
Conclusions
This study presents results concerning the usefulness of rankings differences and point
spreads in predicting winners of BCS games. Our results suggest the rankings of a subset of the
coaches of the Bowl Subdivision Schools, i.e. those polled by USA Today, are useful in that the
difference in these rankings better indicate the likelihood of a higher ranked team winning. This
is not the case for the rankings provided by sportswriters and broadcasters around the country,
i.e. those polled for the AP poll. Additionally, we were surprised to find that the size of the point
spread was not useful in predicting the likelihood of the favored team winning. Our prior was
that the difference in the point spread would best predict victory due to the informational
advantage available to bettors.
References
Boulier, B.L and H.O. Stekler. “Are sports seeding good predictors?: an evaluation”
International Journal of Forecasting, 1999, Vol. 15, 83-91.
del Corral, J. and J. Prieto-Rodriguez. “Are differences in ranks good predictors for Grand Slam
tennis matches?” International Journal of Forecasting, 2010, Vol. 26, 551-63.
Lebovic, J. H.and L. Sigelman. “The forecasting accuracy and determinants of football
rankings.” International Journal of Forecasting, 2001, Vol. 17, 105-20.
SOBIE 2014
337
Fraud and the Bankrupting of the
Social Security Disability Trust Fund
Rita C. Jones, PhD., CMA
Troy University
Teresa K. Lang, PhD., CPA, CISA
Auburn University Montgomery
Keith E. Atkinson, PhD., CPA
University of Central Arkansas
Abstract There have been significant increases in the number of individuals applying for Social
Security Disability Insurance (DI) benefits over the past ten years, especially during 2007-2012.
The impact this is having on the Social Security Disability Insurance Trust Fund (the Fund) is
devastating. Although the Fund has experienced years of increases and decreases since its
inception in 1956, no single change is as significant as in 2009 when the Fund’s disbursements
were $12,223 million more than its receipts. If drastic measures are not taken very soon, the
Fund could very well be bankrupt by as early as 2018. With this in mind, this paper focuses on
the DI Program, including the establishment of the program; the process of qualifying for
benefits; receipts by and payments from the Fund; suspicion of fraud; as well as steps taken to
detect and prevent fraud.
Introduction Causes are debatable for the increase in the number of individuals covered by Social
Security Disability Insurance (DI) over the past ten years, especially focusing on the period from
2007–2012, but the state of the Social Security Disability Insurance Trust Fund (the Fund) is not.
Although the Fund has experienced years of increases and decreases since its inception in 1956,
no change is as significant as in 2009 when the Fund’s disbursements were $12,223 million more
than its receipts. Prior to this, the single largest shortfall was $3,361 million in 1993, just before
the legislature reallocated a larger portion of the OASI (Old Age Security Insurance) taxes to the
Fund to increase its Receipts. The single largest increase in the Fund balance was $22,534
million in 2001, when as history has shown, the market was inflated.
This paper focuses on the DI Program, including the establishment of the program; the
process of qualifying for benefits—both regular and fast track; receipts by and payments from
the Fund; citations regarding fraud perpetrated on the Fund; procedures developed for the
detection of fraud as well as the steps that are taken to prevent fraud in the future.

SOBIE 2014
338
Background
Old-Age, Survivors and Disability Insurance
Before the Social Security System (SSS), individuals provided for their own well-being
after retirement. Families took care of their aged parents, and if a family member became
disabled, often they were cared for by family members until they recovered. After recovery, they
returned to work, either in the same occupation or perhaps, because of limitations caused by the
disability, they changed occupations to accommodate their disability and still be able to earn a
living. If returning to the workforce was not an option, the burden fell to the families, friends, or
government assistance programs to help with long-term care.
The Social Security Act was passed in 1935 and is commonly referred to as FICA (the
Federal Insurance Contributions Act). Two decades later in 1956, an Amendment passed which
provided for the Social Security Disability Insurance Program, and in turn the Disability
Insurance Trust Fund was created. The Fund became effective on January 1, 1957, and it is
funded by taxes collected via FICA and the Self-Employment Contributions Act. A portion of
collections received under FICA are used to pay monthly benefits to disabled-worker
beneficiaries and their spouses and children (Actuary, 2009). This system has evolved over the
years and is currently referred to as the Old-Age, Survivors and Disability Insurance (OASDI)
program. DI is a component of the OASDI, and this paper will focus on fraud in the DI program
(Audit, 2014).
Qualifying For Disability Insurance Benefits
DI Definition and Application
The DI program defines disability as the “inability to engage in substantial, gainful
activity by reason of any medically determinable physical or mental impairment(s) which can be
expected to result in death or which has lasted or can be expected to last for a continuous period
of not less than 12 months.” The recipient must also fall below a specific earnings level, which
as of 2013 is just over $1000 per month. This earnings level affects both entry into and
continuation in the program (Social Security Administration, 2014). In order to qualify for
benefits, individuals must have earned 40 work credits (covered quarters), and 20 of the credits
must have been earned in the last 10 years. Younger individuals have a reduced credit
requirement.
Individuals apply for benefits at the local Social Security field office. The field office
reviews applications for nonmedical eligibility requirements such as age, employment, marital
status, and Social Security coverage and issues a “technical denial” (no further review) or
forwards the application to the state Disability Determination Services (DDS) office.
Normal Claims Processing or Fast Track Once at the DDS, the application is assigned to a disability examiner who evaluates the
applicant’s own sources of medical and other information and renders the initial determination.
If there is not enough evidence for that determination, the DDS will arrange for a consultative
examination. In cases where it is clear to the disability examiner that the applicant has a severe
disability, is blind or terminally ill and is likely to receive a favorable DI determination, Fast
Track (FT) procedures are used to continue processing the application FT procedures were
developed to deal with the large population of Baby Boomer’s to give a quick determination of
SOBIE 2014
339
the application for DI benefits. Under the FT guidelines, the examiner follows a five-step
sequential evaluation process to determine eligibility including (Rajnes, 2012):
1) a work test;
2) an impairment severity test;
3) a medical listing test;
4) a test for the ability to perform previous work; and
5) a test for the ability to perform any type of work
DI Application Approved or Denied and
Subject to Appeal
If the DDS finds that the applicant is disabled, the SSA computes the benefit amount and
begins paying benefits. If there is an unfavorable determination, the order of appeals is: 1)
reconsideration by the DDS, 2) a hearing in front of a federal administrative law judge (ALJ) in
SSA’s Office of Disability Adjudication and Review, 3) a request that the Appeals Council
review the ALJ’s decision, and finally, 4) an appeal to the federal court system (Rajnes, 2012).
The timing during the appeals process gives applicants 60 days to file their initial appeal. If
denied again by the original DDS office, the applicant has 60 additional days to appeal to an ALJ
(Maestas, Mullen, & Strand, 2012). The Maestas study found that almost two-thirds of the
applicants in their sample ultimately received benefits within six years of their initial
determination.
To more efficiently process DI applications, the DDS began shifting to a fully electronic
system in 2004, and by 2008, all DI claims are processed electronically via folders. This system
has made it possible for field offices and other case-processing agencies to share information
more quickly, flag cases as information becomes available, and be used as a predictive model for
identifying claims that are likely to receive approval. This electronic modeling system is now
widely used by the DDS and has resulted in expedited determination of DI benefits and claims
processing (Rajnes, 2012).
Link Between Unemployment Rates and DI Applications
From early 2007 to late 2009, the U.S. unemployment rate rose from 4.4% to 10% before
retreating to about 7.6% in July 2013. Likewise, during 2007 to 2011, the number of DI
applications increased 34% according to a recent report from the OIG (oig.ssa.gov, 2014). In
reference to these increases, Inspector General O’Carroll, Senators Tom Coburn and Orrin Hatch
wrote, “Given the looming collapse of [Social Security] DI, it is imperative that disability claims
are properly examined to ensure that only those who are lawfully entitled to benefits receive
them.” (oig.ssa.gov, p.2). They also proclaimed that exploiting the DI system and transforming
it into a supplemental source of unemployment income could not be allowed.
The focus of the OIG appears to be on the rate of approval of claims during the
recessionary period 2007-2011 compared with non-recessionary times. Perhaps the more serious
issue to bring into question should be whether there really has been a significant increase in the
number of truly disabled, former workers. Logic would tell one that if the number of
applications increased, and the percent of approvals held constant, then the number of approvals
increased. The impact of this increase in the number of beneficiaries is significant as is shown
very clearly in Table 1.
In spite of the increase in DI applications, it was determined that applicants waited longer
than normal after stopping work to file an application. This delay most likely was caused by

SOBIE 2014
340
extensions to unemployment insurance benefits. To investigate that train of reasoning, a study
was conducted by the White House (2011) which confirms this and also finds that unemployed
persons aged 50 – 65, without access to at least $5,000, are much more likely to apply for DI as
their unemployment benefits are about to expire.
Costs To Provide Disability Insurance Benefits
As noted earlier, the Social Security Act, currently referred to as FICA, was amended in
1956 to create the Disability Insurance (DI) Trust Fund¸ so the first year of reporting for the
Fund was 1957. The most recent year of data available is 2012. A summary of the Disability
Insurance Trust Fund summarized by decade is presented in Table 1. The rates of withholding
for FICA increased periodically from the inception of the program until 2000, when the rate
became fixed at 6.2%. Likewise, the portion of the 6.2% that was deposited into the DI Fund
varied, reaching a high of .94% from 1994-1996, then being reduced to a fixed .9% since 2000
(H.R. 4277, 1994). Of course the salary on which the FICA tax is based has increased each year
and as of 2014 is $117,000 (Schreiber, 2013).
As is clearly indicated by the Net Change column in Table 1, each decade saw Receipts
in excess of Disbursements in varying amounts until the 2010’s when there was a significant
increase in Disbursements relative to Receipts. In order to investigate this in more detail, Table
2 was prepared on a year-by-year basis for the years 2007–2012. This includes the period
mentioned earlier when the rate of DI applications increased by up to 32% in some states and
27% over all states.

SOBIE 2014
341
Table 1
Disability Insurance Trust Fund by Decade (millions)
Decade Receipts Disbursements Net Change Asset Balance
1950’s* $2,630 $805 $1,825 $1,825
1960’s 18,615 16,340 2,275 4,100
1970’s 84,960 83,430 1,530 5,630
1980’s 198,192 195,917 2,275 7,905
1990’s 487,556 398,140 89,416 97,321
2000’s 957,691 851,472 106,229 203,550
2010’s** 319,408 400,292 -80,884 122,666
*1950’s includes 1957-1959
**2010’s includes 2010-2012
<link href=”/framework/css/noscript.css” rel=”stylesheet” media=”all/>

SOBIE 2014
342
Per Table 2, Disbursements in excess of Receipts began in 2009, and the negative spread
between the two continues to increase each year. This appears to be due to the impact of two
major events—the lingering recession in which unemployment benefits ran out for many former
workers and the implementation of electronic claims processing as well as DI benefit modeling
by the DDS. The loss of unemployment benefits in a lingering recession and a potential link of
that loss of benefits to DI fraud will be discussed in the next section of this paper.

SOBIE 2014
343
Table 2
Disability Insurance Trust Fund 2007-2012 (millions)
Decade Receipts Disbursements Net Change Asset Balance
2007 $109,854 $98,778 $11,076 $214,884
2008 109,840 108,951 889 215,773
2009 109,283 121,506 -12,223 203,550
2010 104,017 127,660 -23,643 179,907
2011 106,276 132,333 -26,057 153,850
2012 109,115 140,299 -31,184 122,666
(link href=”/framework/css/noscript.css”rel=”stylesheet”media=”all=/) at January 2014.
SOBIE 2014
344
Per Table 2, the Fund Disbursements increased 10% from 2007 to 2008 and another 12%
from 2008 to 2009. These increases would have been difficult enough for the Fund to absorb
with no other impacts, but because of the extended recessionary period in which there were
fewer workers paying FICA tax, the Fund Receipts decreased at the same time. This compound
effect on the Fund is devastating, causing the Asset Balance to drop by 42.9% in just 6 years
from 2007 to 2012. Although 2012 shows a slight upturn in Receipts, the increase in
Disbursements is substantially greater, causing the largest single year deficit, $31,184 million, to
date. At this rate, the Asset Balance of the Fund could be exhausted within the next 4 years.
Suspicion of Fraud in the Disability Insurance Program
Perhaps some people, such as auditors and fraud examiners, are more suspicious because of
their professional training, while others may become suspicious when what they see happening
around them is not in agreement with what they are told by their government. For example, have
you ever personally known a person who is receiving DI benefits, but when you observe that
person’s behavior, they do not truly seem to be disabled? Do you think your impressions are an
anomaly? One of the authors put this scenario to the test. She conducted an unscientific survey
recently by asking friends, students, and acquaintances about this, and thus, confirming her
opinion that it is a hot topic. Everyone has an opinion—more negative than positive. A point of
common agreement is that those who truly deserve DI benefits should receive them. Beyond
that, feedback ranged from distrust with the way the current system is managed to outright anger
that individuals who were “fully able to work like the rest of us,” were living off DI benefits,
costing taxpayers, and committing fraud while doing so.
Lawyers Specializing in Disability Insurance Claims It is an everyday thing that when watching TV and it’s time for a commercial, there is an
advertisement by an attorney or a law firm who claims to specialize in Social Security Disability
law. A bi-line from just such an ad by a law firm in the local viewing area of one of the authors
is, “Social Security Disability—it’s what we do, and all we do.” Another law firm who claims to
only deal with DI cases cites credentials such as being a “Registered Nurse and an Attorney—let
us help you.” One does not have to listen too long to hear similar examples in other television
viewing areas. One thing is a certainty, if attorneys were not earning sufficient profits to make
their practices worthwhile by dealing solely in DI cases, they would change their specialty.
60 Minutes Show on October 6, 2013
In October of 2013, 60 Minutes, a popular news show, reported concerns about suspected
and alleged abuses of the Social Security DI program. The broadcast reported that there has been
a 20 percent increase in beneficiaries over the past six years, and it is a “secret welfare system”
(Kroft, 2013). The show also questioned the involvement of attorneys to obtain disability
payments, and quoted Marilyn Zahm, “In 1971, fewer than 20 percent of claimants were

SOBIE 2014
345
represented. Now, over 80 percent of claimants are represented by attorneys or representatives.”
Additionally, a suspected scam was described where an attorney and doctors worked together to
qualify clients for disability payments. Specialists who were well-versed in the DI approval
process were hired to “coach” their clients on how to respond to tests and questions during the
qualification process. The Social Security Administration was quoted as responding that “the
explosive surge is due to gaining Baby Boomers and lingering effects of a bad economy.” This
lends support to the rationale in this paper. Those two facts alone to not cause people to become
disabled.
NYC Public Workers Television, as well as electronic and print news reported in early 2014, that New York
City police officers, firefighters and prison guards were charged with faking psychiatric and
other medical problems to get DI benefits. Workers were coached on how to describe symptoms
that allowed them to get payouts as high as $500,000. The ringleaders made tens of thousands of
dollars in kickbacks. Those arrested included 72 city police officers, eight firefighters, and five
corrections officers. The scam was reported to have started more than twenty years ago.
According to reports, many of those involved did have disabilities that entitled them to state
disability pensions, but not DI. Over 100 defendants were charged with crimes including grand
larceny (CBS/AP, 2014).
Defense of the SSA Regarding Disability Insurance
Not everyone believes that fraud is to blame for the state of the Fund. Economist Dean
Baker challenges these claims of rampant fraud saying, “Close to three quarters of applicants are
turned down initially and even after appeal, 70 percent of applicants are denied benefits” (Baker,
2013). Further, the Consortium for Citizens with Disabilities wrote a letter to CBS (Hart, 2013):
“The Social Security disability standard is incredibly strict, and just four in 10
applicants are awarded benefits. Award rates have further declined during the
recent economic downturn. Demonstrating eligibility requires extensive medical
evidence, and even people with life-threatening illnesses can wait months if not
years to receive benefits. Many individuals are denied despite significant
disabilities and chronic illnesses.”
According to a 2012 study by University of Michigan researchers, the Social
Security Disability Insurance (SSDI) case load has tripled over the past twenty years
while the employment rate of disabled workers has decreased by 50 percent (Maestas,
Mullen, & Strand, 2012). During this same time frame, life expectancy increased
(Christensen, Doblhammer, Rau, & Vaupel, 2009), the working-age populations’ health
remained constant (Burkhouser & Daly, 2011) , and physical demands of jobs has
decreased (Autor & Duggan, 2003).
Deterrents to Fraud
Detection
In their January, 2014, Audit Report Summary, the Office of the Inspector General (OIG)
found that there were approximately 2,747 Social Security Administration (SSA) beneficiaries
who were paid amounts in excess of what Federal limits indicate they should have been paid.
SOBIE 2014
346
These findings were reported to the SSA on September 27, 2013. Included were 152 concurrent
beneficiaries who were previously reported to the SSA as having been overpaid. The SSA
reported that they had taken care of the errors in 2011; however, the overpayments continue to be
made through the date of this citation in September, 2013. Although this is a single month’s
audit report, it is an example of a broken system. An audit system is in place as it should be.
Formal audits are conducted and reported, but many of the problems are not fixed, so taxpayer
monies are wasted.
Prevention
Sec. 1632. [42 U.S.C. 1383a] of the SSA sets forth Penalties for Fraud against the Social
Security System. In essence, if anyone “knowingly and willfully” provides, or causes to be
provided, false information of a material fact to the SSA in order to receive benefits, they are to
be fined under title 18, United States Code, imprisoned not more than 5 years, or both. In
addition, anyone convicted of this violation may not be certified as a representative payee under
section 1631(a)(2), meaning that they cannot be designated to be paid SS benefits on behalf of
anyone else.
Perhaps a new tool should be made available to SSA auditors under the authority of the
OIG—the “electronic modeling system” used by the DDS to determine DI applicants who are
likely to be approved for benefits. Auditors should be allowed to audit inside the electronic
system. With the plethora of personal information there, an opportunity exists for identity theft
and any number of violations of privacy or misuse of the information. It is also clear that by
placing the modeling criteria within reach of those interested in perpetrating a fraud, the level of
risk increases significantly.
References
Actuary, O. o. (2009, November 12). Disability Insurance Trust Fund. Retrieved January 20,
2014, from Social Security Online Trust Fund Data:
http://www.ssa.gov/oact/ProgData/describedi.html
Adair, W. (2003). Integrative sequences and negotiation outcome in same and mixed culture
negotiations. The International Journal of Conflict Management, 14(3), 273-296.
Adair, W., & Bret, J. M. (2004). Culture and Negotiation Process. In M. J. Gelfand, & J. M.Bret,
The Handbook on Negotiation and Culture (pp. 158-176). Stanford: Stanford Business
Books.
Adair, W., Brett, J. M., & Okumura, T. (2001). Negotiation behavior when cultures collide: The
United States and Japan. Journal of Applied Psychology, 86(3), 371-385.
Adler, N. J., & Graham, J. L. (1989). Cross-Cultural Interaction: The International Comparison
Fallacy? Journal of International Business Studies, 515-537.
Administration, S. S. (n.d.). Disability Evaluation Under Social Security. Retrieved January 20,
2014, from Social Security.
Ang, S., & Van Dyne, L. (2008). Conceptualization of Cultural Intelligence. In S. Ang, & L. V.
Dyne, Handbook of Cultural Intelligence (pp. 3-15). Armonk: M.E. Sharpe.
SOBIE 2014
347
Ang, S., Van Dyne, L., & Tan, M. L. (2011). Cultural Intelligence. In R. J. Sternberg, & S. B.
Kaufman, Cambridge Handbook on Intelligence (pp. 582-601). Cambridge: Cambridge
University Press.
Ang, S., Van Dyne, L., Koh, C., Ng, .. Y., Templer, K. J., Tay, C., et al. (2007). Cultural
Intelligence: Its Measurement and Effects on Cultural Judgment and Decision Making,
Cultural Adaptation, and Task Performance. Management and Organization Review,
3(03), 335-371.
Ang, S., Van Dyne, L., Koh, C., Ng, K. Y., Telpler, K. J., Tay, C., et al. (2007). Cultural
Intelligence: It's measurement and Effects on Cultural Judgement and Decision Making,
Cultural Adaption and Task Performance. Management and Organization, 3(3), 335-371.
Audit, T. O. (2013). The Social Security Administration's Reporting of High-dollar
Overpayments Under Executive Order 13520 in Fiscal Year 2013. Baltimore, MD:
Office of the Inspector General.
Autor, D., & Duggan, M. (2003). The Rise in the Disability Rolls and the Decline in
Unemployment. Quarterly Journal of Economics, 157-206.
Baker, D. (2013, October 6). CBS News 60 MInutes Joins the Disabilty Bashing Bandwagon.
Retrieved January 20, 2014, from Center for Economic and Policy Research:
http://www.cepr.net/index.php/blogs/beat-the-press/cbs-news-60-minutes-joins-the-
disability-bashing-bandwagon
Bandura, A. (1997). Self-efficacy: the exercise of control. New York: W.H.Freeman.
Bandura, A. (2001). Social Cognitive Theory: An Agentic Perspective. Annual Review of
Psychology, 52, 1-26.
Benoliel, M. (2011). Negotiation Excellence: Successful Deal Making. Singapore: World
Scientific Publishing.
Brislin, R., Worthley, R., & MacNab, B. (2006). Cultural Intelligence: Understanding Behaviors
That Serve People's Goals. Group Organizational Management, 31(1), 40-55.
Burkhouser, R., & Daly, M. (2011). The Declining Work and Welfare of People with
Disabilities: What Went Wrong and a Strategy for Change. Washington, DC: AEI Press.
CBS/AP. (2014, January 7). Cops, firefighters among 100 former NYC workers charged in
disability scam. Retrieved January 18, 2014, from CBSNews.com:
http://www.cbsnews.com/news/100-nyc-workers-charged-in-disability-scam/
Christensen, K., Doblhammer, G., Rau, R., & Vaupel, J. W. (2009). Ageing Populations: The
Challenges Ahead. Laucet, 1196-208.
Chua, R. Y., Morris, M. W., & Mor, S. (2012). Collaborating across Cultures: Cultural
Metacognition & Affect-Based Trust in Creative Collaboration. Organizational Behavior
and Human Decision Processes, In press.
Chung, M., & Ingleby, R. (2011). The applicability of Western socio-legal frameworks to the
study of negotiation in Chinese society. Journal of Higher Education Policy and
Management, 169-177.

SOBIE 2014
348
Cohen, J., Cohen, P., West, S. G., & Aiken, L. S. (2003). Applied Multiple
Regression/Correlation Analysis for the Behavorial Sciences (3rd ed.). New Jersey:
Erlbaum.
Cole, N. D. (2011). Managing global talent: solving the spousal adjustment problem. The
International Journal of Human Resourse Management, 1504-1530.
Cole, N., & McNulty, Y. (2011). Why do female expatriates "fit-in" better than males? Cross
Cultural Management: An International Journal, 144-164.
Creswell, J. (2003). Research Design: Qualitative, Quantitative and Mixed Methods Approaches
(2 ed.). Thousand Oaks: Sage.
Curhan, J. R., Elfenbein, H. A., & Xu, H. (2006). What Do Peopple Value When They
Negotiate? Mapping the Domain of Subjective Value in Negotiation. Journal of
Personality and Social Psychology, 493-512.
DeDreu, C., Weingart, L., & Kwon, S. (2000). Influence of social motives on integrative
negotiation: A meta-analytic review and test of two theories. Journal of Personality and
Social Psychology, 78, 889-905.
Earley, P., & Ang, S. (2003). Cultural Intelligence: Individual interactions across cultures. Palo
Alto: Oxford University Press.
Early, P. C., Ang, S., & Tan, J. (2006). Developing Cultural Intelligence at Work. Stanford, CA:
Stanford Business Books.
Fisher, R., Ury, W., & Patton, B. (1991). Getting to Yes: Negotiating agreement without giving
in (2nd ed.). New York: Penguin.
Flavell, J. (1979). Metacognition and cognitive monitoring: A new era of cognitive-
developmental inquiry. American Psychologist, 34(10), 906-911.
Galinsky, A. D., Seiden, V. L., Kim, P. H., & Medvec, V. H. (2002). The Dissatisfaction of
Having Your First Offer Accepted: The Role of Counterfactual Thinking in Negotiations.
Personality and Social Psychology Bulletin, 271-283.
Gelfand, M. J., & Brett, J. M. (2004). The Handbook of Negotiation and Culture. Stanford:
Stanford University Press.
Gelfand, M. J., & Christakopoulou, S. (1999). Culture and Negotiator Cognition: Judgment
Accuracy and Negotiation Processes in Individualistic and Collectivistic Cultures.
Organizational Behavior and Human Decision Processes, 79, 248-269.
Gelfand, M., Imai, L., & Fehr, R. (2008). Thinking Intelligently About Cultrural Intelligence. In
S. Ang, & L. V. Dyne, Handbook of Cultural Intelligence: Theory, Measurement, and
Applications (pp. 375-387). Armonk: M.E. Sharpe.
Graham, J. L. (1985). Cross-Cultural Marketing Negotiations. Marketing Science, 130-146.
Graham, J. L. (1985). Cross-Cultural Marketing Negotiations. Marketing Science, 130-146.
Graham, J. L., Mintu, A. T., & Rodgers, W. (1994). Explorations of Negotiation Behaviors in
Ten Foreign Cultures Using a Model Developed in the United States. Management
Science, 72-95.
Hall, E. T. (1959). The Silent Language. New York: Doubleday.

SOBIE 2014
349
Halpert, J. A., Stuhlmacher, A. F., Crenshaw, J. L., Licher, C. D., & Bortel, R. (2010). Paths to
Negotiation Success. Negotiation and Conflict Management Research, 91-116.
Hart, P. (2013, October 7). What Did 60 Minutes Get Wrong About Disability. Retrieved January
20, 2014, from Fairness & Accuracy In Reporting:
http://www.fair.org/blog/2013/10/07/what-did-60-minutes-get-wrong-about-disability/
Imai, L., & Gelfand, M. (2009). Culture, conflict, and negotiation. In R. S. Bhagat, & R. M.
Steers, Cambridge Handbook of culture, organizations, and work (pp. 339-372).
Cambridge: Cambridge University Press.
Imai, L., & Gelfand, M. J. (2009). Culture, conflict, and negotiation. In R. S. Bhagat, & R. M.
Steers., Cambridge Handbook of culture, organizations, and work (pp. 334-372).
Cambridge: University Press.
Imai, L., & Gelfand, M. J. (2010). The culturally intelligent negotiator: The influence on Cultural
Intelligence (CQ) on negotiation sequences and outcomes. Organizational Behavior and
Human Decision Processes, In press.
Judge, T. A., Thoresen, C. J., Bono, J. E., & Patton, G. K. (2001). The job satisfaction–job
performance relationship: A qualitative and quantitative review." Psychological bulletin
127, no. 3 (2001): 376. Psychological Bulletin, 376-407.
Kim, E.-M. (1998). The four Asian tigers: economic development and the global political
economy. San Diego: Academic Press.
Koneya, M., & Barbour, A. (1976). Louder than words...Nonverbal communications. Columbus:
Merrill.
Kroft, S. (2013, October 10). 60 Minutes. Retrieved January 20, 2014, from CBSNews.com:
http://www.cbsnews.com/news/disability-usa/
Law, K. S., Wong, C.-S., & Song, L. J. (2004). The Construct and Criterion Validity of
Emotional Intelligence and Its Potential Utility for Management Studies. Journal of
Applied Psychology, 89(3), 483-496.
Leung, K., Bhagat, R. S., Buchan, n. R., Erez, M., & Gibson, C. B. (2005). Culture and
International Business: Recent Advances and Their Implications for Future Research.
Journal of International Business Studies, 357-378.
Lewicki, R., Barry, B., & Saunders, D. M. (2010). Negotiation. New York: McGraw Hill.
Lewicki, R., Saunders, D., & Barry, B. (2006). Negotiation. Singapore: McGraw Hill.
Lin, Y.-c., Chen, A. S.-y., & Song, Y.-c. (2012). Does your intelligence help to survive in a
foreign jungle? The effects of cultural intelligence and emotional intelligence on cross-
cultural adjustment. International Journal of Intercultural Relations, 541-552.
Luo, Y., & Shenkar, O. (2002). An empirical inquiry of negotiation effects in cross-cultural joint
ventures (Vol. 8). Journal of International Management.
Maestas, N., Mullen, K., & Strand, A. (2012, August). Does Disabilty Insurance Receipt
Discourage Work? Using Examiner Assignment to Estimate Causal Effects of SSDI
Receipt. Michigan Retirement Research Center. Ann Arbor, Michigan: University of
Michigan.

SOBIE 2014
350
Malek, M. A., & Budhwar, P. (2012). Cultural intelligence as a predictor of expatriate
adjustment and performance in Malaysia. Journal of World Business, in press.
Malhotra, D., & Bazerman, M. (2008). Psychological Influence in Negotiation: An Introduction
Long Overdue. Journal of Management, 34(3), 509-531.
Miles, M. (2003). Negotiating with the Chinese: Lessons from the Field. Journal of Applied
Behavioral Science, 453-472.
Morris, M. W., & Gelfand, M. J. (2004). Cultural Differences and Cognitive Dynamics:
Expanding The Cognitive Perspective on Negotiation. In M. J. Gelfand, & J. M. Bret,
The Handbook of Negotiation anf Culture (pp. 45-70). Stanford: Stanford University
Press.
Nadler, J., Thompson, L., & Van Boven, L. (2003). Learning Negotiation Skills: Four Models of
Knowledge Creation and Transfer. Management Science, 529-540.
Pedersen, P. J. (2009). Assessing intercultural effectiveness outcomes in a year-long study
abroad program. Internatinal Journal of Intercultural Relatinos, 70-80.
Robbins, S. P., & Judge, T. A. (2009). Organizational Behavior. Upper Saddle River: Pearson.
Ryan, R. M., & Deci, E. L. (2000). Self-Determination Theory and the Facilitation of Intrinsic
Motivation, Social Develoment, and Well-Being. American Psychologist, 68-78.
Salacuse, J. (1988). Making Deals in Strange Places. Negotiation Journal, 4(1), 5-13.
Schneider, A. K. (2002). Shattering Negotiation Myths. Harvard Negotiation Law Review, 142-
233.
Sekaran, U. (2000). Research Methods for Business (3rd ed.). New York, NY: John Wiley and
Sons.
Shaffer, M. A., Ferzandi, L. A., Harrison, D. A., Gregersen, H., & Black, J. S. (2006). You can
take it with you: Individual differences and expatriate effectiveness. Journal of Applied
Psychology, 91, 109-125.
Shaffer, M., & Miller, G. (2008). Cultural Intelligence: A Key Success Factor for Expatriates. In
S. Ang, & L. V. Dyne, Handbook of Cultural Intelligence: Theory, Measurement and
Applications (pp. 107-125). Armonk: M.E. Sharpe.
Simintiras, A., & Thomas, A. (1997). Cross Cultural Sales Negotiations. International Marketing
Review, 10-28.
Sternberg, R. J. (1999). Successfull Intelligence: finding a balance. Trends in Cognitive Science,
3(11), 436-442.
Sternberg, R. J., & Detterman, D. J. (1986). What is intelligence: Contemporary viewpoints on
its nature and definition. Norwood, NJ: Ablex.
Takeuchi, R. (2010). A Critical Review of Expatriate Adjustment Research Through a Multiple
Stakeholder View: Progress, Emerging Trends, and Prospects. Journal of Management,
1040-1064.
Templer, K. J., Tay, C., & Chandrasekar, N. A. (2006). Motivational Cultural Intelligence,
Realistic Job Preview, Realistic Living Conditions Preview, and Cross Cultural
Adjustment. Group and Organizational Management, 31(1).

SOBIE 2014
351
Thomas, D. C. (2006). Domain and Development of Cultural Intelligence: The Importance of
Mindfulness. Group and Organization Management, 78-99.
Thomas, D. C. (2009). Cultural Intelligence living and working globally. San Francisco: Berrett-
Koehler.
Thompson, L. L. (2009). The Mind and Heart of the Negotiator. Upper Saddle River: Prentice
Hall.
Triandis, H. (2006). Cultural Intelligence in Organizations. Group and Organization
Management, 31(1), 20-26.
United States Department of Agriculture. (2012, December 31). International Macroeconomic
Data Set. Retrieved April 7, 2013, from USDA: http://www.ers.usda.gov/data-
products/international-macroeconomic-data-set.aspx
Van Dyne, L., Ang, S., & Koh, C. (2008). Development and Validation of the CQS. In S. Ang, &
L. V. Dyne, Handbook of Cultural Intelligence: Theory, Measurement, and Applications
(pp. 16-40). Armonk, NY: M.E.Sharpe.
Vochita, L. (2008). The Role of Culture on International Negotiations. Annals of the University
of Petrosani, 297-302.
Weingart, L. R., & Olekalns, M. (2004). Communication Process in Negotiation. In M. J.
Gelfand, & J. M. Brett, The Handbook of Negotiation and Culture: Frequencies,
Sequences, and Phases (pp. 143-176). Stanford: Stanford University Press.
Whetton, D. (2011). Developing Management Skills. NJ: Pearson.
Wigfield, A., & Eccles, J. (2000). Expectancy-Value Theory of Achievement Motivation.
Contemporary Educational Psychology, 25, 68-81.
Wilken, R., Jacob, F., & Prime, N. (2013). The ambiguous role of cultural moderators in
intercultural business negotiations. International Business Review, 736-753.
Zhang, Y. (2012). Expatriate Development for Cross-Cultural Adjustment: Effects of Cultural
Distance and Cultural Intelligence. Human Resource Deveopment Review, 177-199.

SOBIE 2014
352
THE CFO’S ROLE IN THE NORTH AMERICAN DIVISION:
A CRITICAL EXAMINATION OF PERCEIVED DIFFERENCES AMONG
SDA LOCAL CONFERENCE LEADERSHI
ABSTRACT
The basis of this study was incited by the sentiment that Seventh-day Adventist (SDA)
Conference leaders perceptions of the Chief Financial Officer significantly impacts how CFOs’
function in their role. Data were collected from a purposeful sample of N=399 at fifty-seven
SDA Local Conferences in the North American Division territory comprising the countries of
Bermuda, Canada and The United States of America. A Mixed-Methods sequential exploratory
research design utilizing Descriptive Statistics reflected significant differences among the
conference leaders consisting of presidents {CEOs}, treasurers {CFO}, and board members
{BM}, concerning their understanding and working knowledge of the CFO’s role. Discussion
and Conclusions include potential conflicting leadership expectations of the CFO’s role, and
possible organizational inefficiency. Implications are applicable to organizations where
leadership expectations of the CFO’s role are not clearly defined, communicated or understood.
Some practical implications are also identified and discussed.
KEYWORDS: Board Members {BM}, CEO (Chief Executive Officer/President {P}), CFO
(Chief Financial Officer/Treasurer {T}), communication, congruence, expectations, leadership,
North American Division (NAD), perceptions, role, Seventh-day Adventists (SDA),
understanding, working knowledge
INTRODUCTION and LITERATURE
The emergence of the Seventh-day Adventist Church as a global financial organization
operating in multiple countries, industries and business sectors has necessitated the emergence
and development of skilled financial leadership that add substantial value to the organization
(Adventist World – NAD 2013; Corson and Miyagawa, 2012; Menkes, 2011; Witzel, 2010;
Voogt, 2010; Shepherd, 2010). As reflected in the changing structure of the SDA church to
accommodate its services in a changing world, so the role of the SDA treasurer as CFO has
appeared to change. However, it is not clear whether the expectations (Buckingham and
Coffman, 1999) and perceptions of the treasurer’s role as the CFO in Seventh-day Adventist
Church local conferences are understood by conference leadership (executive officers and board
SOBIE 2014
353
members) to the extent of leadership counterparts in the business and non-business sector. The
treasurer’s role does not seem to be as clearly defined or understood among the leadership team.
The CFO represents the highest level of fiscal leadership and financial management service in
the business sector (Witzel, 2010). Treasurers in Adventist local conferences occupy positions
that function in a similar capacity to CFOs in other not-for-profit and for-profit organizations.
The SDA Accounting Manual (2011) states, pertaining to the CFO, “various job title, such as
Treasurer, Controller, or Vice-president for Finance are used throughout the world to refer to the
individual who has been given primary responsibility for the financial affairs of an entity” (p.4).
Adventist local conferences are directly impacted by the changes in our global societies, and
treasurers are expected to navigate their organization financially during these changing times
((Hollein, M. 2013; Vallario, 2011; Quinn, 2011). Additionally, the expectations and perceptions
of the treasurer’s role serving in the Seventh-day Adventist Church is changing as a result of re-
engineering in organizational designs; a re-focusing of mission and purpose; the accumulation of
assets in properties, plant and equipment; and the allocation and management of fiscal resources.
In spite of these changes, there appears to be a significant lag in responding to the changes
associated with the treasurer’s role in comparison to the corporate sector as it relates to
establishing defined expectations and policies. For example, the Adventist system continues to
define the function for the conference treasurer with policy statements emphasizing accounting,
managing, and reporting of funds (SDA Accounting Manual, 2011). In lieu of the evidence of
evolving CFO roles in non-Adventist organizations, this research explores and answers the
questions of has the treasurer’s role in Adventist local conferences changed? Is there a “tacit”
knowledge about how treasurers do their work? Are the perceived expectations of the treasurer’s
role congruent among the leadership (president, treasurer and board members)?
The CFO’s role facilitates and necessitates a wide spectrum of relationships within the context
of internal and external stakeholders comprising the financial community that are impacted by
the organization’s financial resources (de Jongh and Wielinga, 2011; Drucker, 1974;
PricewaterhouseCoopers, 1999). A crucial component to the fulfillment of the organization’s
mission is the CFO’s relationship with the chief executive officer and executive board as
members of the organization’s leadership team (Menkes, 2011; Carver, 1997; Gray, 1998). In
many organizations CFOs and CEOs serve together as executive officers and business partners
providing each other leadership and support to ensure the organization fulfills its mission and
achieves its strategic goals and objectives (MacManus, 2011; Cardillo, 1998; Hartman, 2000).
While expectations and perceptions of leadership may differ in some cases, it is vital to the
organization’s climate for CEOs and CFOs to communicate and work together, avoiding adverse
relationships, to maximize the business operationalization of shareholder’s value and
stakeholder’s interest (Shepherd, 2010; Krell, 2003; Millman, 2001). CFO’s have also
encountered a number of complex challenges as financial leaders due to multiple internal and
external environmental factors (Corson and Miyagawa, 2012; Spanyl, 2011) such as changes to
business structure (Tenkate, 2006), regulatory laws and Sarbanes-Oxley Act of 2002 (Linden,

SOBIE 2014
354
2012; Ehrenhalt and Ryan, 2007; Tenkate, 2006; Swanson, 2007; Couto and Neilson, 2004;
Strategic Direction, 2004), transitions in technology (Tenkate, 2006), domino effect of
unemployment (Heffes, 2009), and organizational resources (Cunningham, 2005).
Witzel (2010) identified a comprehensive global study that was released by IBM involving a
survey and interview of more than 1,900 of chief financial officers measuring CFO’s attitudes
and practices. According to Zorn (2004), studies such as the one conducted by IBM in 2010
expands on prior studies of 400 large organization between 1964 and 2000 which laid the
foundation for two primary theories on the transformation of financial controls which propelled
the rise of treasurers to the rank of a CFO in the business sector. Zorn’s research on the rise of
the CFO in the American firm noted that several existing studies offered explanations pertaining
to the evolution of the CFO position, but the theories of “The Capital-Dependence Thesis” and
“Fligstein’s Theory of Conceptions of Control” represented the most significant models (Zorn,
2004).
Zorn (2004), stated that “The Capital-dependence theory, thus post that conditions in the
firms’ environment that determine access to capital, together with firm-specific capitalization
characteristic, account for changes in organizational form in general and for adaptations in
financial control systems in particular”. Prechel (2000, 1991) building on the Capital-
dependence theory “presented a theory of change in the corporate form that centered on the
political economy concept of capital and capital accumulation….It follows from this theoretical
perspective that firms experiencing a capital crisis should be particularly susceptible to elevating
the finance manager to the rank of a CFO.” In Fligstein’s theory of conceptions of control
examines, his model denotes “corporate structures and strategies are the products of firms’
institutional environments and the power struggle among different management factors each
seeking to gain control of the large corporation” (Zorn, 2004). In each situation, the CFO is
challenged to provide financial leaderships and regulate controls pertaining to the function of the
position.
METHODOLOGY
Research Design
This study uses a mixed methods research design (Creswell, 2014). Creswell (2003) “defines
mixed methods research by incorporating the definition that focuses on collecting and analyzing
both quantitative and qualitative data in a single study” (p. 210). Thus, a sequential exploratory
design involving qualitative (Eriksson and Kovalainen, 2008; Nardi, 2003) and quantitative
(Elsbach and Bechky, 2009) methods was utilized in the collection and analysis of the data.
Sampling
SOBIE 2014
355
The qualitative phase of this study consisted of two phases. First, an "Exemplary Local
Conference Form" was developed and distributed to those serving as "experts" (Presidents and
Treasurers) in the Division and Union levels of the Seventh-day Adventist Church representing
higher governing organizations in the Adventist system. The purpose of this form was to gather
opinions from the "experts" on the identification of "exemplary" local conferences in their
division and union territories consisting of Bermuda, Canada and The United States of America.
These higher level organizations (Division and Union) represents the local conference governing
entities in which they are reportable to in their operations and evaluations.
The "experts" were asked to establish and report their own criteria for an "exemplary
conference" on the form. The "experts" consisted of 10 presidents (CEOs) and 10 treasurers
(CFOs). Ninety percent (90%) of the presidents, and one-hundred percent (100%) of the
treasurers responded to the instrument form pertaining to exemplary conferences. The selection
procedure of the division, union, and conference participants resulted in a non-probability
sampling approach which, according to Chien (as cited by Merriam, 1998, p. 61), is called
“purposive,” and Patton (as cited by Merriam, 1998, p. 61) calls it “purposeful.” In-depth, face-
to-face interviews pertaining to the role of the treasurer were conducted with the presidents and
treasurers in the exemplary conferences on-site.
Secondly, an "interview questionnaire instrument" was developed for local conferences
participants’ that were identified by the "experts" as an "exemplary conference". Four local
conferences were purposefully selected from the list of exemplary local conferences identified by
the "experts". Four presidents and four treasurers of the exemplary local conferences selected for
the study were interviewed with the purpose of capturing the “lived experience” (Eisner, 1998)
of individuals working in the area of this study as participants.
In the quantitative phase of the study, a survey questionnaire was developed from the
qualitative research interview data collected and analyzed from the presidents and treasurers of
four conferences that were identified as an "exemplary conference" by the "experts". The survey
questionnaire was developed to determine the level of agreement or disagreement the other
presidents, treasurers and board members had pertaining from the qualitative data collected from
the "exemplary conference" presidents and treasurers which was used to formulate the survey
questions. Surveys were mailed to a total population of 399 individuals in local conferences
throughout the North American Division territory (Bermuda, Canada, and The United States of
America) consisting of 57 presidents, 57 treasurers and 285 board members. Two hundred and
eighteen (218) participants (55 percent of the total sample) completed and returned the research
instruments. These respondents included 35 (61%) presidents, 39 (68%) treasurers, and 144
(50%) board members.
Data Collections
SOBIE 2014
356
Data was collected in three phases: first, mailing of "Exemplary Conference Form"; second,
interviewing of participants (qualitative); and third, mailing of survey questionnaires
(quantitative) to the sample population, using a sequential exploratory strategy model as part of
the mixed methods research design. Strategies to collect data, such as extensive interviews of
participant’s phenomenon, observations and surveys were identified as well as factors that could
influence data collection (Creswell, 2014 and 2003; Elsbach and Bechky, 2009; Eriksson and
Kovalainen, 2008; Nardi, 2003; McMillian and Schumacher, 2001; Posavac and Carey, 1997;
Sternberg, 1981).
Statistical Techniques
In this study both qualitative and quantitative data were collected and analyzed. Pertaining to
the qualitative technique, some of the major challenges resulting from the data collected involved
analyzing the data to identify emerging categories and patterns, and seeking to understand the
data (Creswell, 2014; McMillan and Schumacher, 2001; Rudestam and Newton, 1992). To
facilitate the process of inductive data analysis, a system of organization was developed to
manage the data collected from interview transcripts. After completing the interview transcripts,
each response to each question was carefully read, analyzed, coded and categorized. Wide
categories and patterns were developed, and then narrowed into emerging themes that
corresponded to the research study questions.
Pertaining to the quantitative technique; Analysis of Variance (ANOVA) and Chi-Square
statistical data analysis were used to process and interpret the survey questionnaires. The Likert
Scale (Tharenou, Donohue and Cooper, 2007) was used as a survey response from the
participants to measure the degree of agreement from strongly disagree (1) to strongly agree (5).
Descriptive statistics were used to analyze the survey data. Student-Newman-Keuls Post-Hoc
Test were used to analyze and denote pairs and reflect significant differences among the groups.
In quantitative research, random selectivity from a sample to a population to generalize was the
critical factor (Tharenou, Donohue and Cooper, 2007; Nardi, 2003; Drisko, 1997; Eisner, 1998;
Patten, 2000). The random selection of the executive board members from each local conference
in the North American Division enhanced generalization of the results of this research to the
population.
RESULTS
Qualitative Analysis
The interview results from the presidents and treasurers from the four exemplary conferences
selected in this study indicate that they had some differing perspectives on the past roles of the
treasurer. The results indicate that all four of the treasurers and two of the presidents shared the
same perspective that the current role of the treasurer is to “manage the accounting and finances”

SOBIE 2014
357
of the organization. An analysis of the results of future roles indicated that presidents and
treasurers, as individual groups, did not share any of the same perspectives in future roles.
Quantitative Analysis
The results and analysis of this research highlights that significant perspective differences
exist among NAD local conference leadership pertaining to presidents, treasurers and board
members concerning their level of understanding and working knowledge of the nature and work
performed by treasurers in their local conferences. These significant differences existed in their
perception of the role of the treasurer being clearly defined and documented in their conference.
A segment of the research question is expressed in the following manner pertaining to this topic:
Is there congruence between the perceptions of the presidents, treasurers, and board members as
they relate to the roles, responsibilities, and relationships of the treasurer are understood? The
level of congruence is expressed in the mean (M) between the three groups.
The three groups tended not to agree on whether the treasurer’s role (presidents, M=3.71;
treasurers, M=3.10; and board members, M=3.55) are clearly defined in the organization’s
policies and job descriptions. Pertaining to the role of the treasurer, the Student-Newman-Keuls
Post-Hoc Test (Table 1) indicated that the treasurers responded to this expectation significantly
lower than the board members and the presidents, but there was no significant difference
between the responses of the board members and presidents.
Table 1
Student-Newman-Keuls Test for Clearly Defined Role in Conference
Position N M Treasurer Board President
Treasurer 39 3.10
Board 143 3.55 *
President 35 3.71 *
* Denotes pairs of groups significant difference at the 0.5 level
The three groups tended not to agree on whether they understood and have a working
knowledge of the roles (president, M=4.38; treasurers, M=4.18; board members M=3.74) in their
local conference. Pertaining to the role of the treasurer, the Student-Newman-Keuls Post-Hoc
Test (Table 2) indicated that the board members responded to this expectation significantly lower

SOBIE 2014
358
than the treasurers’ and presidents’, but there is no significant difference between the responses
of the treasurers and presidents
Table 2
Student-Newman-Keuls Test for Understanding and Working Knowledge of Role
Position N M Board Treasurer President
Board 144 3.74
Treasurer 39 4.18 *
President 34 4.38 *
* Denotes pairs of groups significant difference at the 0.5 level
In spite of the significant differences between the presidents, treasurers, and board members
pertaining to their level of understanding, and having a working knowledge of the treasurer’s
role in their local conference; all of the groups believed that the expected roles of the treasurer
are clearly defined in the Seventh-day Adventist North American Division (NAD) and General
Conference (GC) policy books.
IMPLICATIONS and CONCLUSIONS
Striking significant implications emerge in light of the findings of this study. Pertaining to
the quantitative survey questionnaires that were distributed to the NAD local conference
presidents, treasurers and board members, the presidents’ response appears to reflect their having
a higher level of understanding and working knowledge of the treasurer’s role than the treasurers
who “actually occupy the position and do the work”. The treasurers clearly did not perceive
their roles (M=3.10) as clearly as presidents (M=3.71) as indicated by lower means. This lack of
agreement could create misunderstandings between the two (presidents and treasurers) as well as
conflict in the leadership team. If the expectation of the treasurer are not clearly defined and
understood by presidents, treasurers, and board members; then there is a potential for confusion
of expectations, loss productivity, and inter-relational conflicts between the treasurer, president
and governing board members in the organization.
Because the board members (M=3.74) are less confident than the presidents (M=4.38) and
treasurers (M=4.38) of their understanding of the treasurers’ role it may be helpful to have

SOBIE 2014
359
training sessions to orientate and provide a clearer understanding of the treasurer’s work. These
strategies may enhance and promote organizational effectiveness in ensuring that the leadership
team fulfills the organization’s mission while fostering greater accountability and corporate
governance.
Overall, the study showed that the presidents and treasurers in the Adventist system were
more in agreement than the treasurers and board members regarding the work. This seems to
indicate that the closer the groups work together, the more in agreement their perceptions and
expectations may be. Failure to clarify expectations can potentially result in problems that may
hinder the achievement of organizational goals and objectives, and create conflicting
partnerships and relationships between presidents, treasurers, and board members. Similar
outcomes and impact of expectations may exist in other organizations, regardless of industry or
sector, where expectations of the CFOs’ role are not clearly defined, communicated or
understood leading to potential leadership conflict, declining CFO performance and
organizational operational inefficiency.
Therefore, the role of the treasurer as the CFO should be clearly defined, documented, and
communicated in the policies of the governing organizations on all levels of the SDA church
system. Policies regarding the treasurer’s work should be updated to reflect the current
understanding of presidents, treasurers, and board members and other key leaders in the
organization. Change is to be expected and implemented to ensure that best practices among
treasurers are realized in local conferences. Treasurers may consider, and explore the
possibilities of discussing their role with presidents and board members to clarify expectations,
definitions and understanding before assuming the position as a potentially new hire in the
organization
REFERENCES
Adventist World – NAD (2013, June). “Treasurer says north American tithe up 1
percent, 4.4 percent in other regions. p. 5.
Buckingham, M. and Coffman, C. (1999). First break all the rules: What the world’s
greatest managers do differently. New York: Simon & Schuster.
Cardillo, R.C. (1998, January/February). The triangle at the top: When the CFO gets
stuck between the CEO and the president, who wins. Financial Executive, 14, 49-
50.
Carver, J. (1997). Boards that make a difference. San Francisco, CA: Jossey-Bass.
Couto, V and Neilson, G. (2004, December). Financial Executive. 20.9: 40-42.
SOBIE 2014
360
Creswell, J. (2003). Research design: Qualitative, quantitative, and mixed methods
approaches (2nd
ed.). Thousand Oaks, CA: Sage.
Creswell, J. (2014). Research design: Qualitative, quantitative, and mixed methods
approaches (4th ed.). Thousand Oaks, CA: Sage.
Corson, M. and Miyagawa, T. (2012). Global cfo from scorekeeper to strategist.
Financial Executive, 28.9.
Cunningham, C. (2005). CFO authenticity and the skills of leadership. Financial
Executive. 21.3: 6.
de Jongh, M. and Wielinga, C. (2011). Value creation and the dilemma of the cfo. Credit
Control. 32.1/2: 33-36.
Drisko, G. (1997). Strengthening qualitative studies and reports: Standards to promote
academic integrity. Journal of Social Work Education, 33, 185-198.
Drucker, P. (1974). Management: Tasks, responsibilities, practices. New York:
HarperCollins.
Ehrenhalt, S. and Ryan, D. (2007, July and August). CFO’s mastering the four key
roles. Financial Executive. 23.6: 56-58.
Eisner, E.W. (1998). The enlightened eye: Qualitative inquiry and the enhancement of
educational practice. Upper Saddle River, NJ: Prentice-Hall.
Elsbach, K.D. and Bechky, B.A. (2009). Qualitative Organizational Research (Vol. 2).
Charlotte, NC. Information Age Publishing, Inc.
Eriksson P. and Kovalainen, A. (2008). Qualitative Methods in Business Research.
Thousand Oaks, CA: Sage.
Gray, C.L. (1998, November/December). The CFO and the board. Financial Executive,
14(6). 48-49.
Hartman, L. (2000, November/December). Group process in executive leadership
teams [Electronic version]. Strategy & Leadership, 28(6). 34-35.
Heffes, E. (2009, April). Uncertain economy: what’s a cfo to do? Financial Executive.
25.3: 18-21.
Hollein, M. (2013, May). Leadership and the cfo. Financial Executive. 29.4.
Krell, E. (2003, April). Finance executive: Career & compensation survey. Business
Finance., 14, 16, 24.
SOBIE 2014
361
Linden, M. (2012, October). The modern-day CFO: Down to business. Financial
Executive. 28.8: 49-51.
MacManus, E. (2011, June). Ten questions for the aspiring cfo. Accountancy Ireland.
43.3: 29-31.
McMillan, J.H., & Schumacher, S. (2001). Research in education: A conceptual
introduction (5th
ed.). New York: Addison Wesley Longhorn.
Menkes, J. (2011, June). Learning how to lead as cfo. Financial Executive. 27.5:52-55.
Merriam, S.B. (1998). Qualitative research and case study applications in education:
Revised and expanded from case study research in education. San Francisco, CA:
Jossey-Bass.
Millman, G.J. (2001, December). Managing up: The CFO & board. Financial Executive,
17(9), 24-26.
Nardi, P.M. (2003). Doing Survey Research: A Guide to Quantitative Methods. Boston,
MA. Allyn and Bacon.
Patten, M.L. (2000). Understanding research methods: An overview of the essentials
(2nd
ed.). Los Angeles, CA: Pyrczak Publishing.
Posavac, E.J., & Carey, R.G. (1997). Program evaluation: Methods and case studies
(5th
ed.). Upper Saddle River, NJ: Prentice-Hall.
Prechel, Harland. (1991). Irrationality and contradiction in organizational change:
Transformation in the corporate form of a u.s. steel corporation, 1930 – 1987.
Sociological Quarterly. 32: 423-45.
Prechel, Harland. (2000). Big business and the state: Historical transitions and
corporate transformation, 1880s -1990s. Albany: State University of New York Press.
PricewaterhouseCoopers. (1999). CFO: Architect of the corporation’s future. New York:
John Wiley & Sons.
Quinn, M. (2011, June 27). CFO Network (A Special Report) ---What the CFOs: Their
highest priorities involve giving themselves more strategic ---and more powerful---
roles. Wall Street Journal, Eastern edition. New York, NY. C.6.
Rudestam, K.E., & Newton, R.R. (1992). Surviving your dissertation: A comprehensive
guide to content and process. Newbury Park, CA: Sage.
Seventh-day Adventist Accounting Manual, (2011 Edition/January). General Conference

SOBIE 2014
362
of Seventh-day Adventists. Silver Spring, Maryland. p.4 -7.
Shepherd, N. (2010, May/June). The cfo as a business partner. Cost Management.
24.3: 30-38.
Spanyl, A. (2011, December). How to be a transformational cfo. Strategic Finance. 93.6:
29-33.
Sternberg, D. (1981). How to complete and survive a doctoral dissertation. New York,
NY: St. Martin’s Press.
Strategic Directions. (2004, March). The evolving role of the cfo. 20:3: 26-28.
Swanson, C. (2007, August). The cfo: Strategist or scorekeeper? Oil and Gas Investor.
27.8: 97-98.
Tenkate, S. (2006, October). What's to become of the cfo? Intheblack. 76.9: 13.
Tharenou, P, Donohue, R. and Cooper, B. (2007). Management Research Methods.
New York, NY. Cambridge University Press.
Vallario, C.W. (2011, July/August). Path to the cfo suite. Financial Executive. 27.6: 26-
29.
Voogt, T. (2010, September). The global financial crisis and top 40 company cfos.
Accountancy SA. 14-16
Witzel, M. (2010, March/April). Time for change: The new role of the cfo. Corporate
Finance Review. 14.5: 26-34.
Zorn, D. M. (2004, June). Here a chief, there a chief: The rise of the cfo in the american
firm. American Sociological Review. 69.3:345-364.

SOBIE 2014
363
Table 1
Student-Newman-Keuls Test for Clearly Defined Role in Conference
Position N M Treasurer Board President
Treasurer 39 3.10
Board 143 3.55 *
President 35 3.71 *
* Denotes pairs of groups significant difference at the 0.5 level
Table 2
Student-Newman-Keuls Test for Understanding and Working Knowledge of Role
Position N M Board Treasurer President
Board 144 3.74
Treasurer 39 4.18 *
President 34 4.38 *
* Denotes pairs of groups significant difference at the 0.5 level

SOBIE 2014
364
Study Abroad: Who goes, who stays and why
David Deviney, Tarleton State University
Tony Vrba, Regis University
LaVelle Mills, West Texas A&M University
Elizabeth Ball, Tarleton State University
Abstract
In a partial response to the increased emphasis by business schools to integrate multicultural
studies into their curriculums, faculty-led study abroad programs have grown in both frequency and
duration. The research has shown that study abroad programs do show measurable gains in a student’s
intellectual development. However, while the number of students participating in study abroad programs
is increasing, the majority of the student population will not take advantage of these opportunities. The
purpose of this research is to determine some of the factors that influence, both positively and negatively,
a student’s participation decision. Students at two universities participated in the research.
Introduction
In the academic year 2011-2012 a little over 280,000 out of approximately 20,000,000 American
college and university students participated in study abroad trips each year (NAFSA, n.d.). On the
average, participation in study abroad is increasing at about two percent per year (Department of
Education, n.d). The Institute of International Education (IIE) ( 2014) recently reports reported that the
growth rate has increased to three percent in the most recent year. Table1 gives the growth rates since
1990 as reported by the Institute of International Education (2014).
Table 1
U. S. Students Studying Abroad for Academic Credit
Year 89-90 95-96 99-00 03-04 07-08 11-12
Students
Studying
Abroad
71K 89K 144K 191K 262K 283K
"Institute of International Education. (2013).Open Doors Report on International Educational Exchange.
Retrieved from http://www.iie.org/opendoors"
While the numbers are increasing, the percentage of students that study abroad in long-term or
short-term programs is relatively low. Colleges and universities continue to emphasize the importance of
international studies (Relyea, Cocchiara & Studdard, 2008); however, Americans lag in international
exposure (Bollag, 2003). The importance of study abroad as a key factor in affecting international
understanding has been supported since the early 1930s (Meras, 1932). As noted by Spiering and
Erickson, “Students can develop new perspectives on academic subjects and real-world issues, achieve
proficiency in a foreign language, experience personal growth, and develop valuable career skills” (2006).

SOBIE 2014
365
Study abroad offers the ability to learn by doing, interact actively through a trial and error approach and
deal with lots of information; all factors that have appeal to Millennial students (Williams, 2013).
The decision to study abroad can depend on the country selected. The IIE Open Doors Report
(2014) indicated that the United Kingdom, Italy and Spain were host to 32% of American students. Table
2 provides a more comprehensive look at destinations of U. S. study abroad programs.
Table 2
Leading Destinations of U. S. Study Abroad Students
Country Percentage
United Kingdom 12%
Italy 11%
Spain 9%
France 6%
China 5%
Australia 3%
Ireland 3%
Germany 3%
Costa Rica 3%
Japan 2%
Other 43%
"Institute of International Education. (2013).Open Doors Report on International Educational Exchange.
Retrieved from http://www.iie.org/opendoors"
The report also suggests that 53% of all study abroad destinations are in Europe. The same report
indicates that in the 2011-2012 academic year, American students traveling abroad comprised of 60%
juniors and seniors, 64% were female and 76% were white. Hispanics and African-Americans accounted
for approximately 13% of students studying abroad.
Factors influencing student decisions to study abroad are varied and have not been widely studied
in the international business and study abroad literature. The limited research on this topic suggests that a
student’s intent to study abroad can be influenced by a number of factors, either real or perceived.
Examples of factors influencing a student’s decision regarding participation in study abroad include
difficulty of transfer of credits, lack of faculty/campus support, lack of foreign language proficiency,
students with certain majors, age of the student, students with disability, and cost (Stroud, 2010). One
study of European students suggested that the potential impact on family and personal relationships was a
significant component in a student’s intention to study abroad (Souto-Otero, et al, 2013). Future job
prospects, family expectations and administrative support are all significant factors in study abroad
intentions (Schnusenberg, de Jong, & Goel, 2012).
The research on why students decide not to travel abroad is limited. The same factors that can
influence one student to study abroad can influence another student not to study abroad. What causes one
potential student to overcome either real or perceived factors related to study abroad and pursue an
opportunity to study internationally may cause another potential study abroad student to view the same
factors as insurmountable and choose not to participate.

SOBIE 2014
366
A student’s personality characteristics can have an impact on decisions to study abroad. While
the research on personality characteristics as a predictor of a student propensity to study abroad is
somewhat limited, one study found that extraversion was a factor in how beneficial study abroad was as a
learning experience Miao & Harris (2012). Bakalis and Joiner (2004) identified students with a high
tolerance for ambiguity and a high degree of openness as more likely to participate in study abroad
activities while the opposite is true for students that scored low on these characteristics. Another research
effort reported that extroverted-task oriented and introverted-relational students preferred study abroad
more than introverted-task oriented and extroverted-relational students (Vrba, Mills, Deviney, & Ball,
2011).
The contribution to the literature of this paper is to look at personality and behavior
characteristics of students in a selected group and explore how these similarities or differences may have
impacted their decisions not to study abroad. The remainder of this study is organized as follows. The
following section describes the instrument that was used to measure behavior tendencies of participants.
The methodology is presented after that. Then we provide results of the study with related discussion.
Measurement of Behavioral Tendencies
The Excellence for Learning – Student Version (DISC) was used to measure each student’s
behavioral tendencies. This instrument was derived from William Marston and published in The
Emotions of Normal People (1928). Bill Bonnstetter (Bonnstetter & Suiter, 2007) has completed
considerable research and developed the DISC used in this research. The DISC report uses a four
quadrant matrix with polar opposites: Task-Relational and Introvert-Extravert. The four quadrants are
labeled D – Dominance, I – Influence, S – Steadiness and C – Compliance. The computer generated
report categorizes students into 384 different behavioral styles (Bonnstetter & Suiter, 2007).
The four quadrants are defined as follows (Bonnstetter & Suiter, 2007):
Dominance. Dominance style of behavior is direct and decisive. This individual feels
that it is important to achieve goals, they do not need to be told what to do, and they set
high standards. When projects take too long they grow impatient: they enjoy competition
and want to win. They are sometimes blunt and come to the point directly. “D”
individuals tend to be direct, controlling, risk-taking, pessimistic, judging, extroverted,
change-oriented, and fight-oriented.
Influencing. The Influencing behavior style reflects outgoing, optimistic individuals who
love to communicate, and are people persons. These individuals tend to participate in
team and group activities; they like the limelight though may not want to lead. “I”
individuals prefer to be direct, accepting, risk-taking, optimistic, perceiving, extroverted,
change-oriented and flight-oriented.
Steadiness. The Steadiness behavior style shows sympathetic, cooperative behavior.
Helping others and fitting in are important to these individuals though they are hesitant
to implement change and do not like to be in the limelight. “S” individuals tend to be
indirect, accepting, risk-assessing, optimistic, perceiving, introverted, continuity-
oriented, and flight-oriented.

SOBIE 2014
367
Compliance. Compliance behavior style tends to be reliable and trustworthy. These
individuals will plan out a strategy considering all the facts and possible malfunctions,
and they prefer to work alone. “C” individuals prefer to be indirect, controlling, risk-
assessing, pessimistic, judging, introverted, continuity-oriented, and fight-oriented.
The reports students receive contains two graphs indicating his or her natural style and adapted
style. Adapted style reflects how students are responding to his or her environment while the natural style
reflects how they respond when the environment is not influencing behavior. It also reflects how they
will respond when there is significant stress. As noted in Figure 1, the two graphs are labeled Graph 1
Adaptive and Graph 2 Natural. Also note that at the 50% mark there is a bold line called the Energy Line
(Bonnstetter & Suiter, 2007). Students scoring above the Energy Line are considered to be high in that
area. For example, refer to Figure 1. This particular student scored an 83 on the S component and 81 on
the C component. The other two are below 50 therefore would not be considered as high. The S and C
component both have a substantial influence on behavioral tendencies. It is important to note that a
person is a combination of all four components. For purposes of this research, only the “high”
components were observed since they are markedly impact behavior.
Figure 1: Adapted and Natural Style Graphs
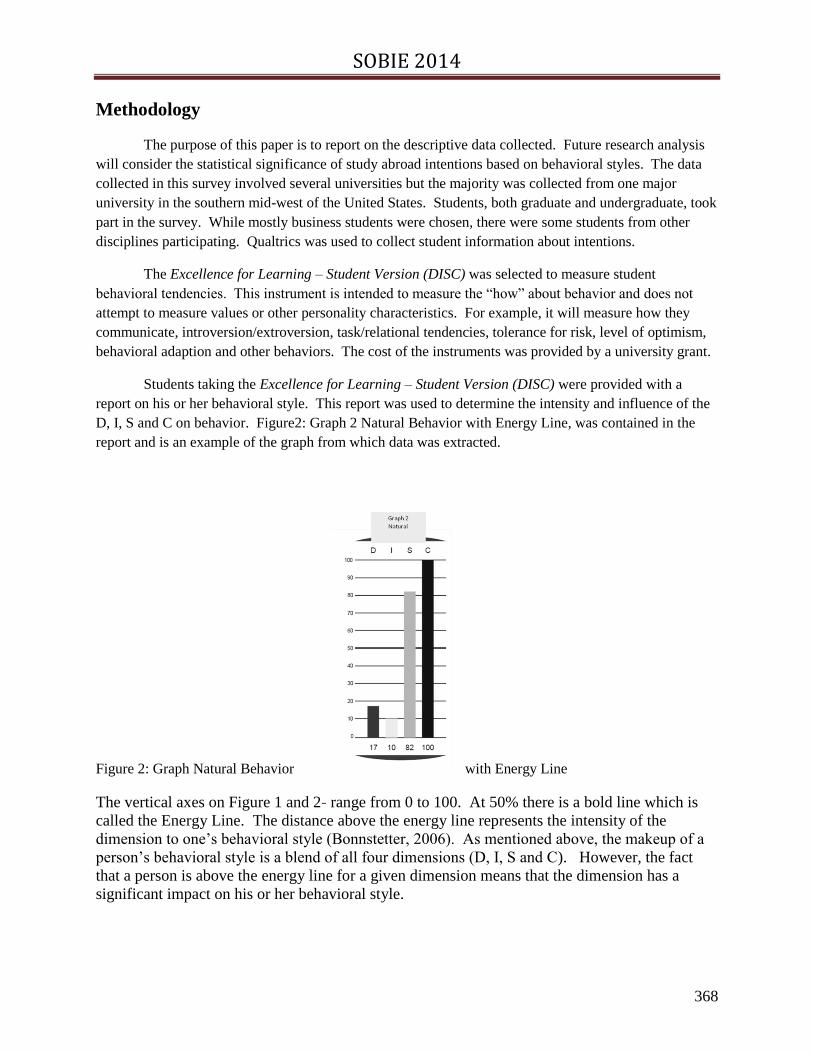
SOBIE 2014
368
Methodology
The purpose of this paper is to report on the descriptive data collected. Future research analysis
will consider the statistical significance of study abroad intentions based on behavioral styles. The data
collected in this survey involved several universities but the majority was collected from one major
university in the southern mid-west of the United States. Students, both graduate and undergraduate, took
part in the survey. While mostly business students were chosen, there were some students from other
disciplines participating. Qualtrics was used to collect student information about intentions.
The Excellence for Learning – Student Version (DISC) was selected to measure student
behavioral tendencies. This instrument is intended to measure the “how” about behavior and does not
attempt to measure values or other personality characteristics. For example, it will measure how they
communicate, introversion/extroversion, task/relational tendencies, tolerance for risk, level of optimism,
behavioral adaption and other behaviors. The cost of the instruments was provided by a university grant.
Students taking the Excellence for Learning – Student Version (DISC) were provided with a
report on his or her behavioral style. This report was used to determine the intensity and influence of the
D, I, S and C on behavior. Figure2: Graph 2 Natural Behavior with Energy Line, was contained in the
report and is an example of the graph from which data was extracted.
Figure 2: Graph Natural Behavior with Energy Line
The vertical axes on Figure 1 and 2- range from 0 to 100. At 50% there is a bold line which is
called the Energy Line. The distance above the energy line represents the intensity of the
dimension to one’s behavioral style (Bonnstetter, 2006). As mentioned above, the makeup of a
person’s behavioral style is a blend of all four dimensions (D, I, S and C). However, the fact
that a person is above the energy line for a given dimension means that the dimension has a
significant impact on his or her behavioral style.
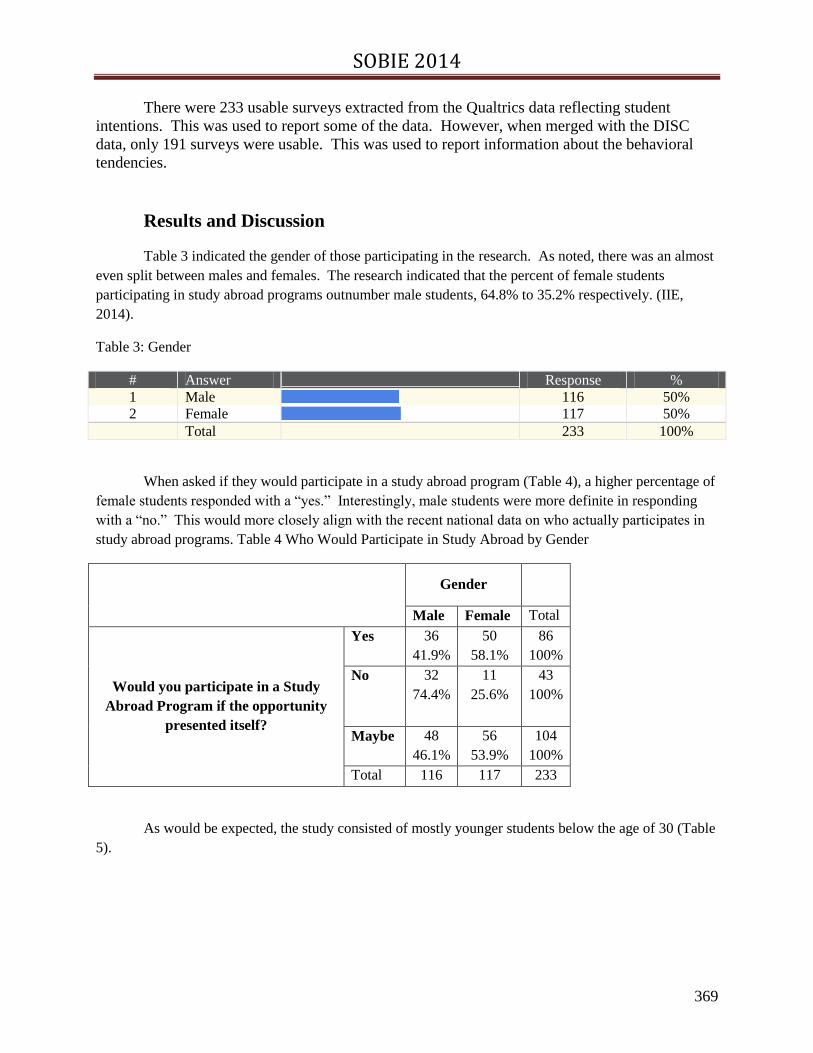
SOBIE 2014
369
There were 233 usable surveys extracted from the Qualtrics data reflecting student
intentions. This was used to report some of the data. However, when merged with the DISC
data, only 191 surveys were usable. This was used to report information about the behavioral
tendencies.
Results and Discussion
Table 3 indicated the gender of those participating in the research. As noted, there was an almost
even split between males and females. The research indicated that the percent of female students
participating in study abroad programs outnumber male students, 64.8% to 35.2% respectively. (IIE,
2014).
Table 3: Gender
# Answer
Response %
1 Male
116 50%
2 Female
117 50%
Total 233 100%
When asked if they would participate in a study abroad program (Table 4), a higher percentage of
female students responded with a “yes.” Interestingly, male students were more definite in responding
with a “no.” This would more closely align with the recent national data on who actually participates in
study abroad programs. Table 4 Who Would Participate in Study Abroad by Gender
Gender
Male Female Total
Would you participate in a Study
Abroad Program if the opportunity
presented itself?
Yes 36
41.9%
50
58.1%
86
100%
No 32
74.4%
11
25.6%
43
100%
Maybe 48
46.1%
56
53.9%
104
100%
Total 116 117 233
As would be expected, the study consisted of mostly younger students below the age of 30 (Table
5).
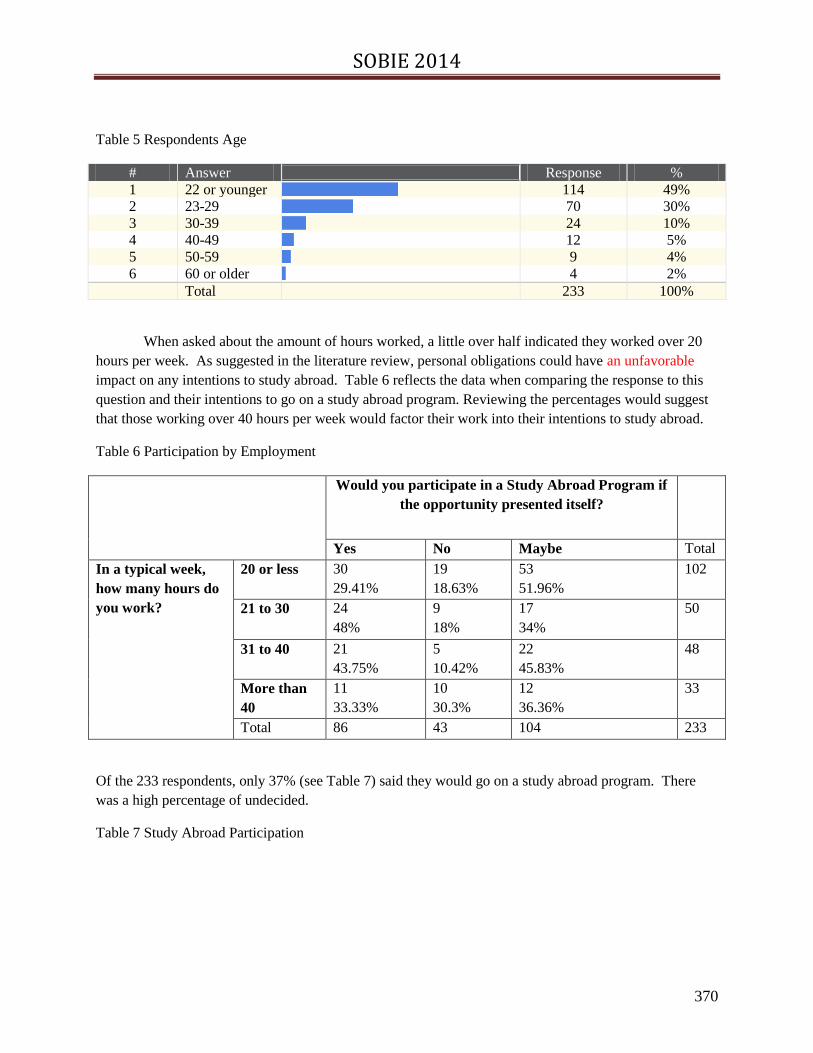
SOBIE 2014
370
Table 5 Respondents Age
# Answer
Response %
1 22 or younger
114 49%
2 23-29
70 30%
3 30-39
24 10%
4 40-49
12 5%
5 50-59
9 4%
6 60 or older
4 2%
Total 233 100%
When asked about the amount of hours worked, a little over half indicated they worked over 20
hours per week. As suggested in the literature review, personal obligations could have an unfavorable
impact on any intentions to study abroad. Table 6 reflects the data when comparing the response to this
question and their intentions to go on a study abroad program. Reviewing the percentages would suggest
that those working over 40 hours per week would factor their work into their intentions to study abroad.
Table 6 Participation by Employment
Would you participate in a Study Abroad Program if
the opportunity presented itself?
Yes No Maybe Total
In a typical week,
how many hours do
you work?
20 or less 30
29.41%
19
18.63%
53
51.96%
102
21 to 30 24
48%
9
18%
17
34%
50
31 to 40 21
43.75%
5
10.42%
22
45.83%
48
More than
40
11
33.33%
10
30.3%
12
36.36%
33
Total 86 43 104 233
Of the 233 respondents, only 37% (see Table 7) said they would go on a study abroad program. There
was a high percentage of undecided.
Table 7 Study Abroad Participation

SOBIE 2014
371
# Answer
Response %
1 Yes
86 37%
2 No
43 18%
3 Maybe
104 45%
Total 233 100%
When questioned about their apprehensions to participanting in a study abroad program, the top
three were cost; language differences; and safety/security. Table 8 reflects the complete list.
Table 8 Study Abroad Concerns
# Answer
Response %
1 Cost of the trip
188 81%
2 Distance from
home
49 21%
3 Safety/Security
101 43%
4 Customs of the
host country
48 21%
5
Traveling with
people I don't
know
43 18%
6 Flying on an
airplane
23 10%
7 Language
differences
114 49%
8 Other (please
specify)
17 7%
Students were asked, “Assuming cost was not a limiting factor, in which of the following
countries/locations would you be interested in doing a Study Abroad?” They could check all that would
apply. The most popular destination was Australia 78% while only about 3% actually go there. Students
indicated that Europe was another popular destination and this result aligns with the recent national data
on destinations. Specifically, England was a popular destination as a student choice. Student data
indicated that Brazil aligned with the national data. New Zealand was also a popular student choice.
While the cost (Mercer, 2013) and flight time to Australia and New Zealand could be limiting to some
students, it is a destination with strong student interest.
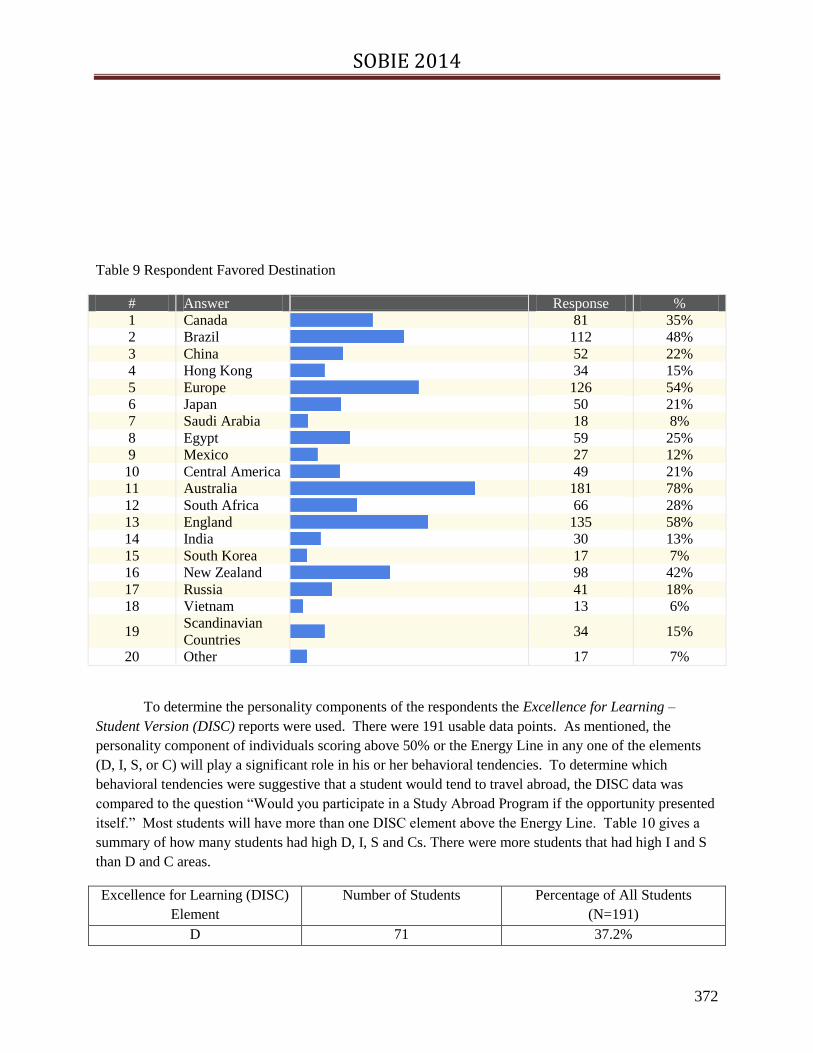
SOBIE 2014
372
Table 9 Respondent Favored Destination
# Answer
Response %
1 Canada
81 35%
2 Brazil
112 48%
3 China
52 22%
4 Hong Kong
34 15%
5 Europe
126 54%
6 Japan
50 21%
7 Saudi Arabia
18 8%
8 Egypt
59 25%
9 Mexico
27 12%
10 Central America
49 21%
11 Australia
181 78%
12 South Africa
66 28%
13 England
135 58%
14 India
30 13%
15 South Korea
17 7%
16 New Zealand
98 42%
17 Russia
41 18%
18 Vietnam
13 6%
19 Scandinavian
Countries
34 15%
20 Other
17 7%
To determine the personality components of the respondents the Excellence for Learning –
Student Version (DISC) reports were used. There were 191 usable data points. As mentioned, the
personality component of individuals scoring above 50% or the Energy Line in any one of the elements
(D, I, S, or C) will play a significant role in his or her behavioral tendencies. To determine which
behavioral tendencies were suggestive that a student would tend to travel abroad, the DISC data was
compared to the question “Would you participate in a Study Abroad Program if the opportunity presented
itself.” Most students will have more than one DISC element above the Energy Line. Table 10 gives a
summary of how many students had high D, I, S and Cs. There were more students that had high I and S
than D and C areas.
Excellence for Learning (DISC)
Element
Number of Students Percentage of All Students
(N=191)
D 71 37.2%
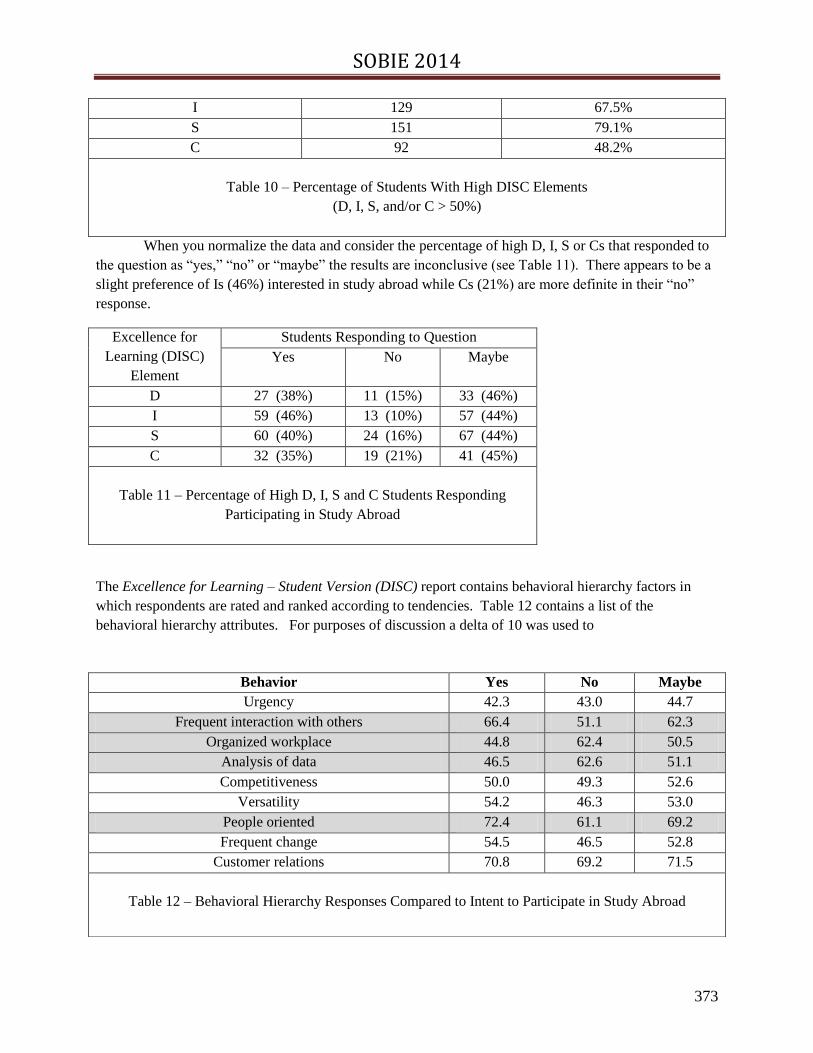
SOBIE 2014
373
I 129 67.5%
S 151 79.1%
C 92 48.2%
Table 10 – Percentage of Students With High DISC Elements
(D, I, S, and/or C > 50%)
When you normalize the data and consider the percentage of high D, I, S or Cs that responded to
the question as “yes,” “no” or “maybe” the results are inconclusive (see Table 11). There appears to be a
slight preference of Is (46%) interested in study abroad while Cs (21%) are more definite in their “no”
response.
Excellence for
Learning (DISC)
Element
Students Responding to Question
Yes No Maybe
D 27 (38%) 11 (15%) 33 (46%)
I 59 (46%) 13 (10%) 57 (44%)
S 60 (40%) 24 (16%) 67 (44%)
C 32 (35%) 19 (21%) 41 (45%)
Table 11 – Percentage of High D, I, S and C Students Responding
Participating in Study Abroad
The Excellence for Learning – Student Version (DISC) report contains behavioral hierarchy factors in
which respondents are rated and ranked according to tendencies. Table 12 contains a list of the
behavioral hierarchy attributes. For purposes of discussion a delta of 10 was used to
Behavior Yes No Maybe
Urgency 42.3 43.0 44.7
Frequent interaction with others 66.4 51.1 62.3
Organized workplace 44.8 62.4 50.5
Analysis of data 46.5 62.6 51.1
Competitiveness 50.0 49.3 52.6
Versatility 54.2 46.3 53.0
People oriented 72.4 61.1 69.2
Frequent change 54.5 46.5 52.8
Customer relations 70.8 69.2 71.5
Table 12 – Behavioral Hierarchy Responses Compared to Intent to Participate in Study Abroad
SOBIE 2014
374
compare respondents that answered the question about participating in a study abroad. Deltas greater than
10 are shaded. It appears that students indicating they would participate in study abroad as compared to
those indicating they would not, like frequent interaction with others, have a preference for less of an
organized work space, are less drawn to data and are people oriented (Table 12). These factors are
defined as follows:
Frequent interaction with others - A strong people orientation, versus a task orientation. Dealing
with multiple interruptions on a continual basis, always maintaining a friendly interface with
others.
Organized workplace - Systems and procedures followed for success. Careful organization of
activities, tasks and projects that require accuracy. Record keeping and planning for success.
Analysis of data - Analyzing and challenging details, data and facts prior to decision making and
is viewed as an important part of decision making. Information is maintained accurately for
repeated examination as required.
People Oriented – Spending a high percentage of time successfully working with a wide range of
people from diverse backgrounds to achieve a “win-win” outcome.
Source: Target Training International, Anne Klink (personal communication, November 24,
2009)
According to Bakalis and Joiner (2004), students that participate in study abroad programs tend to
have a high degree of openness and a high tolerance for ambiguity. This research provides some support
for their conclusions. Students that answered “yes” to participating in study abroad rated organized
workplace and analysis of data lower than those answering “no” (Table 12). This would suggest that
these students have a higher tolerance to ambiguity. Additionally, students that answered “yes,” appear to
have a stronger preference for frequent interaction with others and are people oriented which suggest they
have a higher degree of openness. Perhaps those answering “no” need more detail and assurance to lessen
the ambiguity of study abroad.
Conclusion
Over 200,000 more students participated in study abroad programs in 2012 than in 1989, and yet
this continues to represent a relatively small number of the overall 20,000,000 American college and
university students who are enrolled in undergraduate and graduate programs. There is a wealth of
information describing validated benefits for American students who study abroad. These benefits range
from positive career impact upon graduation to benefits in the classroom based on learning that took place
during the study abroad program to increased maturity that can result due to study abroad experiences.
Yet there are barriers that would appear to be preventing students from electing to participate in study
abroad opportunities. These can vary from costs for the program, possible lack of family support,
SOBIE 2014
375
difficulty in transferring courses back to a curriculum that has little room for variation in courses, and
personal relationships.
There is some evidence from the current study that students who elected to study abroad tended to
be stronger in people orientations, have a higher tolerance for ambiguity, a stronger preference for
frequent interaction with others and a higher degree of openness. It is likely that the current approaches to
study abroad appeal to students with these characteristics and meet needs for study abroad opportunities.
If we are to better meet the needs of all students in the area of study abroad, it may be necessary
to re-examine the model being used for study abroad. There was a time when study abroad represented a
full year of studying abroad in another country and was only available to the wealthier students. As
globalization has become more widespread and the numbers of students pursuing degrees in higher
education has increased, the concept of a year for study abroad has evolved through several stages: a
semester, a summer or even one summer session to the popular 10 – 14 day study abroad programs.
One question that might need to be considered is how Colleges and Universities can find ways to
make short term study abroad participation more widespread regardless of students’ behavior preferences.
Colleges and Universities are aware of the potential value to all students of participating in study abroad
opportunities. Businesses are aware of the increasing impact of globalization in their customer base and
their need for employees who are comfortable interacting with employees from varied backgrounds.
Perhaps there could be opportunities for partnerships between businesses and universities to help with
matching funds to encourage growth in participation of a broader group of students in short term study
abroad programs, especially when the areas being visited were related to areas where the companies have
an established base of clients. It appears unlikely that globalization will decline in the near future so
further research to find ways to increase participation of a broader base of students in study abroad is
needed.
Further Research
As Colleges and Universities look for ways to increase student participation in study abroad
programs, it is as important to know why students currently choose not to participate in study abroad
programs as it is to know why students do make the choice to participate. Becoming aware of barriers,
whether perceived or real, is a step toward learning how to help students eliminate those barriers and help
increasing numbers of students realize that the benefits of study abroad opportunities are within their
reach.
As mentioned earlier in this paper, one possibility could be as simple as providing information in
a more detailed format that would appeal to students who are detail oriented more than people oriented.
Finding a way to help students plan in advance to be prepared for the costs of a study abroad program
could help with one of the major concerns identified by a number of potential study abroad students. If
students are contacted as freshmen and educated about the value and potential benefits of study abroad
opportunities and educated about the options that could be available at the end of their junior year, maybe
they could be encouraged to start saving with that goal in mind. In some Colleges, there are planned

SOBIE 2014
376
rotations for study abroad programs where students could know well in advance what would be available
and be encouraged to plan early to make that part of their University experience.
Learning more about the students who choose not to study abroad and those who do choose to
study abroad and why they make that decision can be the basis for learning how to make study abroad fit
the needs and goals of more students. Further research into this area is certainly a real need for today’s
graduates and those who are just beginning their journey into higher education.

SOBIE 2014
377
References
Bakalis, S. & Joiner, T (2004). Participation in tertiary study abroad programs. International Journal of
Educational Management. V 18 n4 286-291.
Bollag, B. (2003) Report urges federal effort to triple number of students studying abroad. Chronicle of
Higher Education. 50(13). pA33
Bonnstetter, B. & Suiter, J. (2007) The Universal Language DISC: A Reference Manual. Phoenix, AZ:
Target Training International, Ltd.
Bonnstetter, B. (2006). Groundbreaking research: What’s inside of top sales performers in the United
States and Europe. Phoenix, AZ: Target Training International, Ltd. Retrieved November 28, 2008 from
http://ttied.com/images/b/b0/TTIMAG_GroundbreakingResearch.pdf
Collins & Davison (2002). From the margin to the mainstream. Change. 34(5) 50-59
Fugate, D. L., & Jefferson, R. W. (2001). Preparing for globalization; Do we need structural change for
our academic programs? Journal of Education and Business. 76(3), 160-171
Institute of International Education (IIE) (2014). Opendoors 2013: A quick look at U.S. students studying
abroad. Retrived from http://www.iie.org/Research-and-Publications/Open-Doors/Data/US-Study-
Abroad/Infographic.
Marston, W. M. (1928). Emotions of normal people. New York: Harcourt Brace.
Meras, E. (1932). World-mindedness. The Journal of Higher Education, 3(5), 246-252.
Mercer (2013). 2013 Cost of Living Rankings: African, European, and Asian cities dominate the top 10
most expensive locations for expatriates. Retrieved from http://www.mercer.com/press-releases/cost-of-
living-rankings.
Miao, S & Harris, R (2012). Learning and personality on study tours abroad, Research in Post-
Compulsory Education, 17:4, 435-452.
NAFSA (n.d.). Trends in U. S. study abroad. Retrieved from
http://www.nafsa.org/Explore_International_Education/Advocacy_And_Public_Policy/Study_Abroad/Tr
ends_in_U_S__Study_Abroad/ .
Relyea, C., Cocchiara, F. K., & Studdard, N. L. (2008) The effect of perceived value in the decision to
participate in study abroad programs. Journal of Teaching In International Business, 19(4) 346-361
Schnusenberg, O, de Jong, P, & Goel, L (2012). Predicting study abroad intentions based on the theory of
planned behavior. Journal of Innovative Education. V10 N3 337-361.
Souto-Otero, M, Huisman, J, Beerkens, M, de Wit, H, Vujic, S (March, 2013). Barriers to international
student mobility: Evidence from the Erasmus program. Educational Research. 42: 70-77.
SOBIE 2014
378
Spiering, K. & Erickson, S. (2006). Study abroad as innovation: Applying the diffusion model to
international education. International Education Journal, 7(4) 314-322.
Stoud, A.H. (November, 2010). Who plans (not) to study abroad? An examination of U.S. student intent.
Journal of Studies in International Education. Volume 14: 491
U. S. Department of Education (n.d.). U. S. Study Abroad Programs. Retrieved from
http://www2.ed.gov/about/offices/list/ous/international/usnei/international/edlite-study-abroad.html.
Vrba, A., Mills, L, Deviney, D., & Ball, E. (2011). The Relationship of Student Behavioral Style and
Interest in Study Abroad Programs. Western Journal of Human Resource Management, Winter, 6, 6-15.
Williams, T. (2013). Examine your LENS: A tool for interpreting cultural differences. Frontiers: The
Interdisciplinary Journal of Study Abroad. Vol. XXII, Winter 2012 – Spring 2013. 148-165.

SOBIE 2014
379
ABSTRACTS

SOBIE 2014
380
An Interview-Based Approach to Assess Readiness for IFRS
Noema “Amy” Santos
State College of Florida
William C. Quilliam
Florida Southern College
As the United States mores toward the eventual adoption of International Financial
Reporting Standards (IFRS), various entities are interested in the current state of accounting
education and how to best facilitate efforts to improve educational programs––the SEC is one of
them. One milestone the SEC considers to be vital in making a decision regarding whether to
require all public companies in the United States to adopt IFRS is the progress on IFRS-related
education and training of investors, preparers, and auditors, as well as the progress made in
incorporating IFRS content into accounting curricula. This study uses an interview-based
approach to identify some of the issues facing accounting educators and the profession.
Information about the current state of IFRS-related education is equally important for
employers. This has an impact on planning Continuing Professional Education (CPE) programs
for future accounting graduates when they join the labor force. Accounting practitioners should
not be expected to understand the challenges involved in the adoption of an entirely new
accounting framework. Key stakeholders must provide input so that preparers of financial
statements can elect policies that best reflect the underlying business. IFRS knowledge is limited
in the United States, so each conversion project needs to start with internal education.
Accounting professionals will need to understand local GAAP and IFRS and the
situations in which each applies. Major accounting firms must continue to offer training and
publications as well as advice based on their experience in specific areas. There are unique
international audit issues that present challenges in audits of foreign companies and divisions;
accounting professionals will benefit from additional training in these areas. They include
“financial statement presentation, consolidations, combinations, inventory, intangibles, long-term
assets, leases, taxes, revenue, employment benefits” and many more.
The impact of an IFRS implementation on the professor pipeline must also be considered.
A fear factor among professors regarding acquiring IFRS proficiency and adapting course work
at the same time has already been identified. It has been suggested that some academics may opt
to retire early rather than having to learn principles-based accounting––this will intensify the
shortage of qualified educators. On the other hand, some argue that professors might feel more
comfortable teaching a principles-based framework in which students will be encouraged to
search for the facts and there will be more reliance on underlying economic constructs. If
educators have the materials they need, teaching IFRS can actually be more exciting and more
consistent than teaching GAAP standards.

SOBIE 2014
381
A Gold Price Anomaly
Laurence E. Blose
Vijay Gondhalekar
Abstract
This study examines returns on the COMEX front month gold contract over the period 1985
through 2012. The results (presented in Table 1) show that average overnight gold returns are
significantly greater than average day returns. The cause of the anomaly is not known, but it is
consistent with a high opening price that adjusts during the day. The result suggests that
investors should not enter market buy orders when the market is closed to be executed at the
price of the first trade. Enter the buy orders later in the morning after prices have adjusted.
Similarly, investors selling gold are likely to get a higher price if the order is executed at the
opening price.
Table 1
Overnight and Day COMEX Gold Returns 1985-2012
The overnight return (closet-1-to-opent) and day return (opent-to-closet) on gold is calculated for
the COMEX front contract over the twenty-eight years 1985-2012. Parametric t-test and non-
parametric sign-rank test is used for assessing whether the average difference across the twenty-
eight years is different from zero.
Night Day Night – Day Difference
Return
(%)
Return
(%)
Parametric
p-value
Wilcoxon
p-value
Mean 0.096*** -0.066*** 0.000*** 0.000***
Std. Dev. 0.593 0.913 0.000*** 0.000***
Skewness 2.227*** -0.194***
Kurtosis 27.931*** 9.189***
Sample size 6988 6988
Kilmogorov-Smirnov Two Sample Test: p-value = .0001***
*, **, and *** represent significance at the .05, .01 and .001 levels respectively (all tests are one
sided).

SOBIE 2014
382
Corporate Lobbying – The Tradeoff Between Payback,
Accountability/Responsibility and Democracy
Bruce A. Kibler, PhD.
Gannon University
Abstract
Lobbying has become an integral part of everyday corporate business. Strategic political management, as
it is euphemistically called, has changed its demeanor over time. This is due to changing social, economic
and political landscapes, influence opportunities and the overall payback on lobbying efforts. The U.S.
has perfected a legal system of what is considered corruption in other countries of the world, thereby
giving corporations an excellent avenue for revenue enhancement. This phenomenon is also a result of
continued degradation of corporate governance, the principle–agent accountability and a dissolution of
the boundaries between corporations and their political pendants, those elected to be agents of the people
in regulating economic activity for the good of the population, i.e. democracy
This paper attempts to lay out a general framework of democracy and the role of economic actors within
this framework drawing on the principles of corporate governance and the checks and balances of the
principle agency theory. The discussion necessarily encompasses the concept of externalities, i.e., costs
encompassed by the license to operate and the developmental path of how these have been handled by the
economic and political spheres over time.
Keywords
Corporate Governance, Corporate Social Responsibility, Democracy, Lobbying, Agency Capture

SOBIE 2014
383
Experiential Learning in a Liberal Arts Business Program
Carolyn Garrity, Rick Lester, Sara Robicheaux
Birmingham-Southern College
ABSTRACT
An experiential learning component is a critical part of a business educational experience. While
in college, students need to have the opportunity to explore their passions through courses in a
variety of disciplines. Then students should have the opportunity to gain experience through
experiential learning such as internships, service learning, or student and faculty collaboration in
research.
Often business schools focus on taking bright students and have them undergo rigorous academic
training in specific areas of business. Business schools should embrace a philosophical shift
which allow students to do training in the field of business administration within a broader
liberal arts context, which requires them to be able to go beyond mastering a single subject. In
this case, students must also demonstrate that they can think critically, communicate well, and
connect ideas from across disciplines. That means that they are intellectually agile, have creative
insights, and are ready to learn from you when they exit the classroom and enter the work force.
Of course we understand that classroom learning is critical but also insufficient. To truly become
the business professionals of tomorrow, our students must have the opportunity to apply what
they have learned in a real-time business context. All business students need to participate in
experiential learning to become more ethically aware and strive to be professionals who want to
have an impact on society. This objective requires that learners continually enhance: their ability
to apply and critically examine academic knowledge in light of evidence and experiences; their
knowledge of themselves as learners and as members of their chosen communities; and, their
capacity for democratic, civic, and ethical action. In learning initiatives related to experiences,
student learning needs to examine academic knowledge, personal growth, and civic awareness.
To assess the learning in experiential initiatives, critical reflection is an integral component.
Critical reflection is defined as the process by which individuals and groups make sense of
experiences through inductive, deductive, and adductive reasoning. A common model for critical
reflection is the DEAL (Describe, Examine, and Articulate Learning) model (Ash and Clayton,

SOBIE 2014
384
2009). The DEAL provides a shared strategy for aligning experiential learning projects with
student learning outcomes.
This paper will present ways in which to provide valuable experiential opportunities for business students
in internships, service-learning, and faculty student collaborative research within a liberal arts
environment.
WORKS CITED
Ash, Sarah L., and Patti H. Clayton. "Generating, deepening, and documenting learning: The power of critical reflection in applied
learning."Journal of Applied Learning in Higher Education 1.1 (2009): 25-48.
SOBIE 2014
385
Comparing the Tax Effects of the Indirect Foreign Tax Credit and
the Dividends Received Deduction
Cynthia Sneed
Jacksonville State University
John Sneed
Jacksonville State University
Abstract:
When U.S. corporations invest in other corporations, they frequently receive taxable income in
the form of dividends. Since corporate entities are already facing double taxation on their earned
income, as it is taxed when they earn it and again as dividends when they distribute earnings to
their stockholders, dividends received from other corporations are subject to triple taxation when
the income is eventually distributed to stockholders. To address this issue, the tax code allows
the dividends received deduction (DRD) that is available only for corporations. This deduction
allows corporations to deduct most or all dividends received from other corporations from
income to remove the third layer of taxation on most dividends.
However, the DRD is only available on dividends received from domestic corporations.
Dividends received from foreign corporations are still subject to triple taxation. However, the
tax code also includes an indirect foreign tax credit that helps to alleviate the issue of triple
taxation. The United States is one of a few countries that taxes the worldwide income of its
citizens. Most countries tax income that is earned within the country. Under the U.S. system,
foreign source income is also subject to tax in other countries. To address this issue, the tax code
allows the direct foreign tax credit for taxes paid to a foreign government, reducing U.S taxes
owed. The direct foreign tax credit is available to all taxpayers with foreign source income.
The tax code also includes an indirect foreign tax credit that only applies to dividends received
from foreign corporations. It is argued in the literature that the indirect foreign tax credit is a
credit for the taxes paid by the foreign corporation on the income before it is distributed to the
U.S. taxpayer. Unlike the direct foreign tax credit which is available to all U.S. taxpayers, the
indirect credit is only available for U.S. corporations. This limitation suggests that the primary
objective is to eliminate the triple taxation when dividends are paid from one corporation to
another. The purpose of this paper is to compare the tax impact of the indirect foreign tax credit
as opposed to the DRD. If, as expected, the results are similar the DRD could be made available
for dividends received from foreign corporations. This would allow for the elimination of the
indirect foreign tax credit which would help simplify the tax code.

SOBIE 2014
386
Student Satisfaction, Commitment, and perceptions of learning in
online, hybrid vs. web-enhanced course delivery: a measurement
invariance model
Jennifer Pitts, Ph.D., Columbus State University
Robin L. Snipes, Ph.D., Columbus State University
Lei Li, Ph.D., Southern Polytechnic State University
Abstract
A growing body of research comparing traditional, hybrid, and fully online courses in
higher education along a myriad of dimensions suggests minimal differences in student
perceptions of learning, commitment, and satisfaction among course delivery modes. Although
several studies have found that online education can be as effective and satisfying as traditional
and web-enhanced classroom delivery, there is limited research that examines the equivalence of
these factors when comparing subgroups of traditional vs. online students. In this study, a
structural model comparing student perceptions in an online course with an equivalent traditional
web-enhanced course is examined. Data were collected from students enrolled in multiple
sections of an introductory Management Information Systems course and analyzed using
multiple group invariance analysis to assess the equivalence of the scales across the two
subgroups.
SOBIE 2014
387
Improving Student Financial Behaviors using Financial
Literacy Training and Coaching
Jennifer Collins & Michael Campbell
Florida A&M University
Recent research shows that student loan debt is on the rise across the country. In 2013, student
loan debt totaled 1.08 trillion dollars a 300% increase since 2003. This is an alarming fact given
that many students are graduating and joining the ranks of the unemployed and under-employed.
The United States’ consumer debt rate rose by 241 billion dollars in the fourth quarter of 2013,
the largest increase in one quarter since 2007. Some states are exploring the inclusion of
financial literacy in high school curriculum. In an effort to ward off the negative impacts of
student debt and lack of financial literacy, one mid-sized university in the southeast received a
three-year grant to implement a financial literacy program includes training graduate students as
trainers and coaches for the general study body. In addition, the program uses the FDIC
MoneySmart financial literacy curriculum to educate students, faculty, staff and the larger
community. The project includes graduate student and faculty mentor research projects that
examine the relationship between financial literacy and student financial behaviors. The goal of
the program is to improve student financial literacy and change student behaviors towards
money, debt and savings. This paper puts forth the model deployed by this university to enhance
student financial literacy.
Key Words: Financial Literacy, Student Financial Behavior, Financial Training & Coaching

SOBIE 2014
388
Strategic Perspectives on Social Media Driven Entrepreneurship
Dr. Tamela D. Ferguson, University of Louisiana at Lafayette
Dr. Ron G. Cheek, University of Louisiana at Lafayette
Abstract
Social media is a key strategic component in the development of entrepreneurial pursuits.
Innovative entrepreneurial knowledge and skill development is a critical component in today’s
technology laden business environment. This may be especially true of smaller organizations,
which often initially lack significant resources or networked connections. We outline how an
entrepreneur’s hands-on development and use of technology mediated social processes can be
useful in creating a competitive advantage. Of additional importance is the understanding of best
practices for social media usage in the bigger picture context of an organization’s stakeholder
interactions. An approach to leverage social media usage from a strategic perspective was
developed for use by entrepreneurial firms, especially by startups or those first engaging in social
media usage.