snowshoe hare pellet counts
TRANSCRIPT
Snowshoe Hare Pellet Counts Tetlin National Wildlife Refuge, eastern Alaska
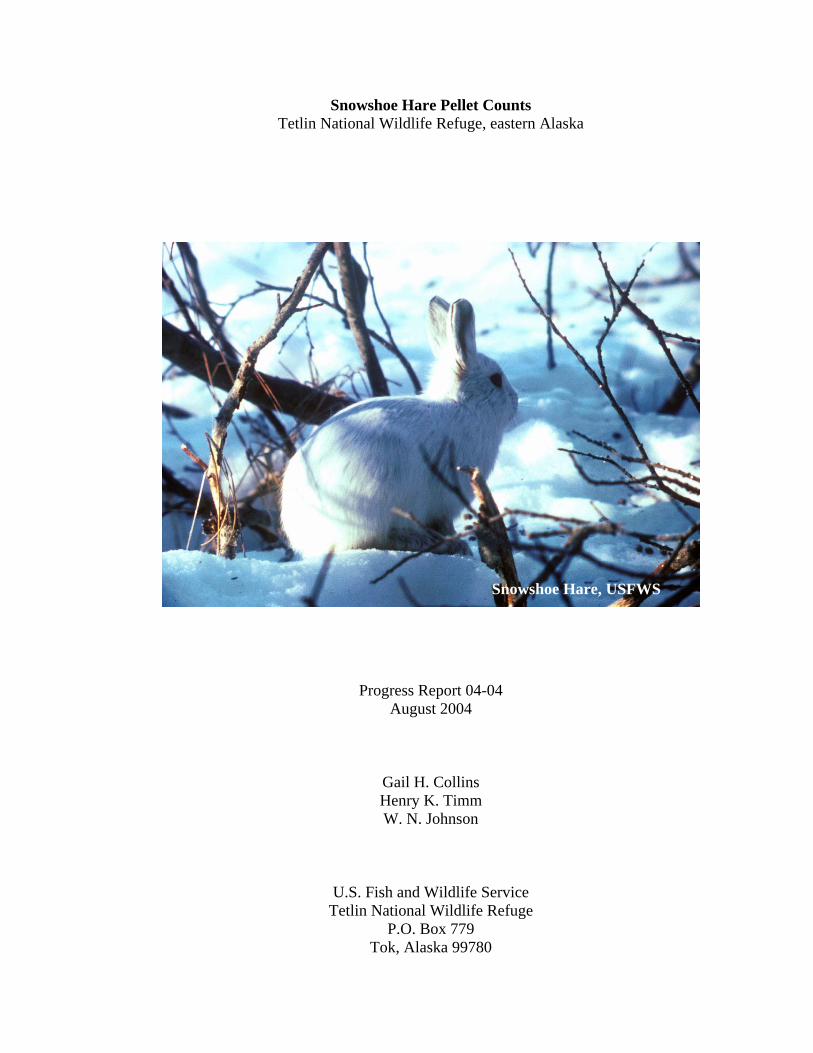
Snowshoe Hare, USFWS
Progress Report 04-04 August 2004
Gail H. Collins Henry K. Timm W. N. Johnson
U.S. Fish and Wildlife Service Tetlin National Wildlife Refuge
P.O. Box 779 Tok, Alaska 99780
Table of Contents Abstract .............................................................................................................................. 3 Introduction ........................................................................................................................ 3 Study Area ......................................................................................................................... 4 Methods .............................................................................................................................. 4 Results ................................................................................................................................ 5 Discussion .......................................................................................................................... 6 Recommendations .............................................................................................................. 7 Acknowledgements ............................................................................................................ 7 Literature Cited .................................................................................................................. 7 Table 1. Permanent snowshoe hare pellet transect descriptions, Tetlin National Wildlife Refuge, Alaska .................................................................................... 12 Table 2. Calculated hare densities (hares/ha) for snowshoe hare study sites, Tetlin National Wildlife Refuge, Alaska, 1990-1994 and 2000-2004 ............................. 12 Figure 1. Snowshoe hare pellet transect locations, Tetlin National Wildlife Refuge, Alaska ................................................................................................................. 13 Figure 2. Average number of pellets/site counted at snowshoe hare study site, Tetlin National Wildlife Refuge, Alaska, 1990-1994 ..................................... 14 Figure 2a. Average number of pellets/site counted at snowshoe hare study sites by community, Tetlin National Wildlife Refuge, Alaska, 1990-1994 ........... 14 Figure 3. Average number of pellets/site counted at snowshoe hare study sites, Tetlin National Wildlife Refuge, Alaska, 2000-2004 ................................... 15 Figure 3a. Average number of pellets/site counted at snowshoe hare study sites by community, Tetlin National Wildlife Refuge, Alaska, 2000-2004 ........... 15 Figure 4. Average number of snowshoe hare pellets/site counted at Takomahto Lake, Tetlin National Wildlife Refuge, Alaska, 1990-1994 and 2000-2004 ................................................................................................................... 16 Figure 5. Averaged snowshoe hare density (hares/ha) across study sites, Tetlin National Wildlife Refuge, Alaska, 1990-1994 and 2000-2004 ............................... 17
2
Abstract Snowshoe hares (Lepus americanus) are a keystone herbivore in the boreal forests of Canada and Alaska, and are cyclical over an approximately 8 to 11 year period. Monitoring hare populations can provide predictive information for other species. We monitored snowshoe hare abundance and trend during two time periods (1990-1994 and 2000-2004) at permanent pellet transects within the Tetlin National Wildlife Refuge (Tetlin Refuge) in eastern Alaska. Data gathered during 1990-1994 coincided with other information suggesting the population density peaked in 1990-1991; results from the 2000-2004 time period did not demonstrate a similar pattern. Recommendations are made for future survey efforts. Introduction Snowshoe hares are an integral part of the boreal ecosystem. Hare population densities are cyclical across boreal North America over an 8-11 year period (Keith 1963, Krebs et al. 1986, Keith 1990), with amplitudes of 5-25 fold (Hodges 2000). The amplitude of the cycle decreases at lower latitudes; southern populations can show either variable periodicity or none at all (Sinclair and Gosline 1997). Hares are an important food item for a wide variety of terrestrial and avian predators (Keith 1990, Hodges 2000) and hare densities can greatly influence production and recruitment of a variety of species. Hare densities are also positively correlated with other species such as spruce grouse (Dendragapus obscurus), willow ptarmigan (Lagopus lagopus), and arctic ground squirrel (Spermophilus parryi) (Boutin et al. 1995). Great-horned owl (Bubo virginianus) and northern goshawk (Accipiter genitilis) production and densities are also strongly influenced by hare density (McInnaville and Keith 1974, Keith et al. 1977, Boutin et al. 1995, McIntyre 1995). Other species such as wolves (Canis lupus), red fox (Vulpes vulpes), marten (Martes americana), and red-tailed hawks (Buteo jamaicenis) may be less dependent on hares, but use likely increases during cyclic highs (Wolff 1980, Todd et al. 1981, Carbyn 1987). Finally, hares can have significant impacts on vegetation during portions of their cycle, and may affect plant survival and composition on a local level (see summary by Hodges 2000). The close correlation between population densities of hares and other boreal forest fauna, and the predictable hare cycle, suggests that monitoring hare populations can provide predictive information for other species, especially lynx (Lynx canadensis) (Nellis et al. 1972, Poole 1994, Mowat et al. 1996, Slough and Mowat 1996) and coyotes (C. latrans) (Prugh 2004). Lynx rely heavily on snowshoe hares for food and lynx populations cycle along with those of its cyclic prey (Keith 1963, Brand and Keith 1979). Estimating snowshoe hare density is labor intensive using conventional mark-recapture techniques (Keith et al. 1984, Krebs et al. 1986). Since hares produce large numbers of fecal pellets and drop them as they move about, it should be possible to count fecal pellets to estimate absolute density of hares (Krebs et al. 1987). Krebs et al. (1987, 2001b) developed and tested an efficient method of estimating hare density by counting fecal pellets; hare density was linearly correlated with fecal pellet counts. During the last 4 decades, the snowshoe hare cycle has been largely synchronous across Canada and into Alaska (see summary by Hodges 2000). It has been suggested that hare populations are out of phase throughout Alaska (i.e., populations do not cycle at the same time) which would
3
allow predators to travel the state in search of locally abundant hares. Available data suggest this is not the case and that with the exception of the Kenai Peninsula, hares cycle in synchrony in Alaska (Hodges 2000). Cyclic peaks occurred roughly at the turn of each decade, 1960-1961, 1970-1971, 1980-1981, 1990-1991, with lowest densities typically occurring 3 years later (1963-1964, 1973-1974, 1983-1984, 1993-1994) (Hodges 2000). Stephenson (1986) concluded that the 1981-1983 snowshoe hare peak in interior Alaska was significantly lower than the previous peak in the 1970s. In 1990, Tetlin Refuge, Wrangell-St. Elias National Park and Preserve, and the Alaska Department of Fish and Game initiated a 4-year study to gather baseline data on lynx and snowshoe hare (Perham 1995; Route 1995; Mitchell 1997, 1998). Tetlin Refuge reinstated annual surveys in 2000. Study Area The study area was within Tetlin Refuge in east-central Alaska and was bordered to the northeast by the Alaska Highway, to the west and south by the Mentasta and Nutzotin Mountains of the Alaska Range, and to the east by Yukon Territories, Canada (Fig. 1). The landscape within the survey area was characterized by large tracts of boreal forest (taiga) interspersed with wetlands typical of much of interior Alaska. As elevation increased, dense spruce gave way to open spruce woodlands mixed with tall shrubs, then dwarf-shrub communities, and finally alpine tundra. Shrubs were most common along streams and water bodies, within recently burned areas, and along gullies that drain subalpine tundra. The boreal forest consisted primarily of black spruce (Picea mariana) in wet and poorly drained areas and white spruce (P. glauca) on drier sites. Quaking aspen (Populus tremuloides) often occurred in pure stands on recently burned south-facing slopes. Paper birch (Betula papyrifera) and balsam poplar (P. balsamifera) occasionally occurred in pure stands or are mixed with spruce. The shrub component was primarily willow (Salix spp.), alder (Alnus spp.), and dwarf birch (B. spp.). Methods Thirteen permanently marked transects were located at: Bataan Lake (n = 2), Burnt Lake (n = 2), Hidden Lake (n = 1), Jatahmund Lake (n = 1), Pucker Lake (n = 2), Stuver Creek (n = 2), Stuver Lake (n = 1), and Takomahto Lake (n = 2) (Fig. 1). Initial attempts were made to subjectively locate transects across cover types and seral stages (i.e., burned vs. unburned): Black Spruce/Burned (n = 1), Black Spruce/Unburned (n = 2), Deciduous Forest/Burned (n = 2), Mixed Forest/Burned (n = 1), Mixed Forest/Unburned (n = 5), Tundra/Burned (n = 1), and Tundra/Unburned (n = 1) (Table 1). Not all transects were surveyed every year (Figs. 2 and 3). Following methods outlined by Krebs et al. (1987, 2001b), we estimated hare abundance by counting fecal pellets in June 1990-1994 and 2000-2004. We placed 5.1 x 305 cm (2 inch x 10 feet; 0.155 m2) quadrants aligned perpendicular to the transect (Krebs et al. 1987) at approximately 30 meter intervals (Perham 1995, Route 1995). Long, thin quadrants were used to mitigate plot-to-plot variance associated with clumped pellet distribution and were effectively sampled by one or two persons (Krebs et al. 1987). With the exception of one of the early Bataan Lake transects (1990-1992, n = 30), each transect contained 50 quadrates; this sample size was suggested to produce estimates within ±20% of the mean (Krebs et al. 1987). Each quadrant was marked with metal or wooden stakes at both ends and the middle. An elastic band was stretched around both end stakes with a 2-inch wooden spacer to visually define the
4
quadrant. All hare pellets observed within the bounds of the band were counted. Pellets found to be at least 50% within the quadrant were also included in the count. Any pellets determined to be ‘old’ were not counted; they were distinguished by their uniform dark grey color and lack of light brown material in the center when broken open (Krebs et al. 1987). Each quadrant was cleared of all pellets following the survey. Moose and grouse pellets, and hare carcasses were also recorded. Predicted hare density per hectare was calculated using the equation presented by Krebs et al. (1987, 2001b) in an Excel spreadsheet. Hare density = 1.567*EXP((0.888962* (LN(mean no. of pellets per quadrant)))-1.203391). Density estimates were calculated for the year preceding the pellet survey (i.e., June to June). All statistical analyses were performed using Systat (SPSS 1998). Results Time Period 1: 1990-1994 Between 1990 and 1994, a total of 3,502 snowshoe hare pellets were counted (0 = 1.56 pellets/quadrant/year, sd = 4.08). The most productive transects were those located in the deciduous forest community (e.g., Bataan Lake; n = 2,456 total pellets; 70% of the total) (Fig 2a). Generally, the average number of pellets counted was highest in 1991 and 1992, followed by a decline in 1993 – 1994 (Fig. 2). Average calculated hare densities were highest in 1990/1991 (0 = 0.98 hare/ha, sd = 1.39) and lowest in 1989/1990 (0 = 0.41 hares/ha, sd = 0.60) (Table 2). Time Period 2: 2000-2004 Between 2000 and 2004, a total of 267 snowshoe hare pellets were counted (0 = 0.281 pellets/quadrant/year, sd = 1.13). In general, a declining trend was observed between 2000 and 2003, however there was an apparent increase in the average number of pellets counted in 2004 (Fig. 3). Both the black spruce and mixed forest communities were similar in the number of pellets observed, although they appeared to be opposite in their patterns over time (Fig. 3a). Average calculated hare densities were highest in 2003/2004 (0 = 0.21 hares/ha, sd = 0.08) and lowest in 2002/2003 (0 = 0.11 hares/ha, sd = 0.09) (Table 2). Takomahto Lake The Takomahto Lake study site was the only site consistently surveyed during both time periods. Comparisons between the two time periods indicate a similar pattern in the number of pellets observed over time (Fig. 4). Although there were on average more pellets observed during 1990-1994 than 2000-2004, the difference was not significant (ANOVA; F = 0.471, P = 0.493). Both time periods showed a declining trend during the first part of each decade (1990-1992 and 2000-2002), followed by an increase. Discussion The mean number of pellets/site was highly variable between transects, areas, and years. However, our trend data supports other information that the snowshoe hare cycle in interior Alaska peaked in 1989-1991 (Perham 1995, Route 1995), in synchronicity with the adjacent Yukon Territories (Mowat et al. 1996).
5
When pellet counts are used for density estimation, plot size and shape are important (McKelvey et al. 2002). Long thin rectangular plots (e.g., Krebs et al. 1987, 2001b) can produce estimates approximately twice as high as those calculated using circular plots (McKelvey et al. 2002). Consequently, comparing pellet densities between studies can be unreliable unless similar plot designs were used. Further, it appears that plot geometry rather than site-specific factors, such as crew training or pellet density, can be the primary cause of differences between studies (McKelvey et al. 2002). Our 1990s data and the Yukon displayed similar patterns (Stefan and Krebs 2001); numbers peaked in 1990-1991, and then declined (Fig. 5). However, during the 1990-1991 peak, the Yukon reported both the lowest (1.4 hares/ha at Kluane Lake; Krebs et al. 1995) and the second-highest (7.3 hares/ha at Snafu Lake; Slough and Mowat 1996) recorded peak hare densities (Hodges 2000). This demonstrates the difficulties in measuring densities because of the array of field and statistical methodologies used, and the problem of determining what area of land was sampled (Hodges 2000). Hare densities also vary within different habitat types, so estimates may also reflect sampling efforts in different habitats (Hodges 2000). Estimates of low density range from <0.1 to 1.0 hares/ha (Hodges 2000); our average hare density estimates peaked at 0.98 hares/ha in 1990/1991. Hare densities then peaked again in 1997-1999 during the most recent cycle across most of Canada and Alaska (Krebs et al. 2001a). Our 2000-2004 snowshoe hare density estimates varied little between the years (Fig. 5); there was no evident trend. Reasons for this may be: (1) our survey was in concurrence with the low phase of the cycle following a high prior to 2000 when the survey was reinstated; or (2) we did not adequately sample all the habitats important to snowshoe hares in this area. Snowshoe hares typically use dense early to mid-successional coniferous forests and deciduous regeneration that provide cover and browse (Wolff 1980; Orr and Dodds 1982; Parker 1984, 1986; Thompson et al. 1989; Keith 1990; Hik 1994; St-Georges et al. 1995; Paragi et al. 1997). Hare use of different stand types is based mainly on the cover afforded by the stand, which varies with species composition and age, and secondarily on the palatability of the species present in the stand (Wolff 1980, Hik 1994). Hare essentially avoid clear-cuts, young stands of regrowth, and open areas; hares are also more likely to use regenerating stands with lots of understory cover than uncut or even-aged stands with little understory cover (Monthey 1986; Thompson 1988; Thomspon et al. 1989; Koehler 1990a, 1990b). As hare density changes during the population cycle, browse and interactions with lynx cause habitat abandonment and reoccupation (Paragi et al. 1997). It has been suggested that during the low phase of their cycle, hares may be found in refugia of dense cover that afford them protection from avian and terrestrial predators (Keith 1966, Wolff 1982, Hik 1994, Mowat et al. 1996, Paragi et al. 1997). Then, as the population grows, individuals disperse from refugia into marginal habitats with less cover (Paragi et al. 1997). However, Hodges (2000) argued that there is no clear shift of habitat use or selection through the cycle, counter to the suggestion that hares may concentrate in refugia during the low phase. During both time periods we surveyed, we observed an apparent shift from the black spruce community to the mixed forest community as the hare density decreased. It is possible, therefore, that the mixed forest community may act as a refugia for snowshoe hare during the decline phase. Further, we may only see significant hare sign in the black spruce community during the high phase of the cycle. Unfortunately, the deciduous forest community was only surveyed in 1990-1994, but given the comparatively high number of pellets observed, it
6
would appear that this community is important hare habitat and should be included in future surveys. Generally, good quality hare habitat will occur 15 to 30 years post-fire in interior Alaska, although suitable habitat may be found in older or younger burns depending on fire characteristics and subsequent regeneration rates (Foote 1983). However, suitable habitat quality for snowshoe hare declines as the forest matures, resulting in a decline in hare densities (Keith et al. 1984). We did not have a significant number of transects in each of the community/seral classes for comparison. Further, of the transects currently being surveyed, one is within a 22-yr-old burn, three are designated as unburned, and one which was previously unburned was partially burned in 2003 (Table 1). Pellet decay can also be a source of variance if plots are not cleared completely; pellet-aging is inaccurate and prone to observer bias (Prugh and Krebs 2004). However, annual trends observed were consistent for methods counting only new pellets in cleared plots and counting all pellets in cleared plots, and it is recommended that researchers use total counts from cleared plots where information on pellet decay rates are not available (Prugh and Krebs 2004), such as in our survey area. Recommendations 1. Continue conducting annual pellet counts through at least the current population cycle (~2012). 2. Discontinue attempts at pellet aging, and instead use the total count technique with cleared plots suggested by Prugh and Krebs (2004). 3. Reinstate transects at Bataan Lake or an equivalent deciduous forest site. 4. Define community and seral stage definitions of transects. Also re-evaluate permanent transects in relation to changes in community/seral stages over time (i.e., become less or more suitable hare habitat). 5. Coordinate our efforts with other long-term monitoring efforts conducted in the Yukon and Wrangell-St. Elias National Park and Preserve. Acknowledgements Many individuals have contributed to this long term monitoring effort including: B. Bohman, S. Breeser, E. Butteri, P. Butteri, D. Carlson, T. Doyle, B. Frey, C. Marunde, E. Merritt, P. Pakkala, C. Perham, J. Sanchez, J. Smith, C. Stemler, K. Strigel, J. Timm, C. Villa, and R. Wilson. For the 2004 field season, we would also like to thank M. Cebrian for his field assistance, and J. Ellis for flying us safely to the study sites. Literature Cited Boutin, S., C. J. Krebs, R. Boonstra, M. R. T. Dak, S. J. Hannon, K. Martin, A. R. E.
Sinclair, J. N. M. Smith, R. Turkington, M. Blower, A. Byron, F. I. Doyle, C. Doyle, D. Hik, L. Hofer, T. Karels, D. L. Murray, V. Nams, M. O’Donohue, C.
7
Rohner, and S. Schwieger. 1995. Population changes of the vertebrate community during a Snowshoe Hare cycle in Canada’s boreal forest. Oikos 74:69-80.
Brand, C. J., and L. B. Keith. 1979. Lynx demography during a snowshoe hare decline in Alberta. Journal of Wildlife Management 43:827-849. Carbyn, L. N. 1987. Gray wolf and red wolf. Pages 359-376 in M. Novak, J. A. Baker, M. E. Obbard, and B. Mallock, editors. Wildlife Furbearer Management and Conservation in North America. Ontario Trappers Association, Toronto, Canada. Foote, M. J. 1983. Classification, description, and dynamics of plant communities after fire in the taiga of interior Alaska. Research Paper PNW-307. USDA, Forest Service Pacific Northwest Research Station, Portland, Oregon, USA. Hik, D. S. 1994. Predation risk and the 10-year snowshoe hare cycle. Dissertation. University of British Columbia, Vancouver, Canada. Hodges, K. E. 2000. The ecology of snowshoe hares in northern boreal forests. Pages 117-
161 in L. F. Ruggeiro, K. B. Aubry, S. W. Buskirk, G. M. Koehler, C. J. Krebs, K. S. McKelvey, and J. R. Squires, editors. Ecology and conservation of lynx in the United States. University Press of Colorado, Denver, Colorado, USA.
Keith, L. B. 1963. Wildlife’s ten year cycle. University Wisconsin Press, Madison, Wisconsin, USA. _____. 1966. Habitat vacancy during a snowshoe hare decline. Journal of Wildlife Management 30:828-832. _____. 1990. Dynamics of snowshoe hare populations. Pages 119-195 in H. H.
Genoways, editor. Current Mammalogy. Plenum Press, New York, New York, USA. _____., J. R. Cary, O. J. Rongstad, and M. C. Brittingham. 1984. Demography and ecology of a declining snowshoe hare population. Wildlife Monograph 90. _____., A. W. Todd, C. J. Brand, R. S. Adamcik, and D. H. Rusch. 1977. An analysis of predation during a cyclic fluctuation of snowshoe hares. International
Congress of Game Biology 13:151-175. Koehler, G. M. 1990a. Population and habitat characteristics of lynx and snowshoe hares
in north central Washington. Canadian Journal of Zoology 68:845-851. _____. 1990b. Snowshoe hare, Lepus americanus, use of forest successional stages and population changes during 1985-1989 in north-central Washington. Canadian Field Naturalist 105:291-293.
8
Krebs, C. J., R. Boonstra, S. Boutin, and A. R. E. Sinclair. 2001a. What drives the 10- year cycle of snowshoe hares? Bioscience 51:25-35. _____., _____, V. Nams, M. O’Donoghue, K. E. Hodges, and S. Boutin. 2001b. Estimating snowshoe hare population density from pellet plots: a further evaluation. Canadian Journal of Zoology 79:1-4. _____, S. Boutin, R. Boonstra, A. R. E. Sinclair, J. N. M. Smith, M. R. T. Dale, K.
Martin, and R. Turkington. 1995. Impact of food and predation on the snowshoe hare cycle. Science 269:1112-1115.
_____., B. S. Gilbert, S. Boutin, and R. Boonstra. 1987. Estimation of Snowshoe hare density from turd transects. Canadian Journal of Zoology 65:565-567. _____., _____, _____, A. R. E. Sinclair, and J. N. M. Smith. 1986. Population biology of snowshoe hares: Demography of food-supplemented populations in the southern Yukon, 1976-1984. Journal of Animal Ecology 55:963-982. McInnavile, W. B., Jr., and L. B. Keith. 1974. Ecology of red-tailed hawk and great- horned owl, Alberta. Canadian Field Naturalist 88:1-20. McIntyre, C. L. 1995. Nesting ecology of migratory golden eagles (Aquila chrysaetos) in Denali National Park, Alaska. Thesis. University of Alaska, Fairbanks, Alaska, USA. McKelvey, K. S., G. W. McDaniel, L. S. Mills, and P. C. Griffin. 2002. Effects of plot size and shape on pellet density estimates for snowshoe hares. Wildlife Society Bulletin 30:751-755. Mitchell, C. D. 1997. 1997 snowshoe hare pellet transect summary. Progress Report. Wrangell-St. Elias National Park and Preserve. Glennallen, Alaska, USA. _____. 1998. Snowshoe hare pellet transect summary, 1998. Progress Report. Wrangell-St. Elias National Park and Preserve. Glennallen, Alaska, USA. Monthey, R. W. 1986. Responses of snowshoe hares, Lepus americanus, to timber harvesting in northern Maine. Canadian Field Naturalist 100:568-570. Mowat, G., B. G. Slough, and S. Boutin. 1996. Lynx recruitment during a snowshoe hare population peak and decline in southwest Yukon. Journal of Wildlife Management 60:441-452. Nellis, C. H., S. P. Wetmore, and L. B. Keith. 1972. Lynx-prey interactions in central Alberta. Journal of Wildlife Management 63:320-329. Orr, C. D., and D. G. Dodds. 1982. Snowshoe hare habitat preferences in Nova Scotia
9
spruce-fir forests. Wildlife Society Bulletin 10:147-150. Paragi, T. F., W. N. Johnson, D. D. Katnik, and A. J. Magoun. 1997. Selection of post- fire seres by lynx and snowshoe hares in the Alaskan taiga. Northwestern Naturalist 78:77-86. Parker, G. R. 1984. Use of spruce plantations by snowshoe hares in New Brunswick. Forestry Chronicle 60:162-166. _____. 1986. The importance of cover on use of conifer plantations by snowshoe hares in northern New Brunswick. Forestry Chronicle 62:159-163. Perham, C. J. 1995. Home range, habitat selection, and movements of lynx (Lynx canadensis) in eastern interior Alaska. Thesis. University of Alaska, Fairbanks, Alaska, USA. Pool, K. G. 1994. Characteristics of an unharvested Lynx population during a snowshoe hare decline. Journal of Wildlife Management 58:608-618. Prugh, L. R. 2004. Foraging ecology of coyotes in the Alaska Range. Dissertation. University of British Columbia, Vancouver, British Columbia, Canada. _____, and C. J. Krebs. 2004. Snowshoe hare pellet-decay rates and aging in different habitats. Wildlife Society Bulletin 32:386-393. Route, B. 1995. Preliminary analysis: Baseline inventory and the development of methods for long-term monitoring of snowshoe hare in Wrangell-St. Elias National Park and Preserve, Alaska. Draft Management Report. Wrangell-St. Elias National Park and Preserve. Glennallen, Alaska, USA Sinclair, A. R. E., and J. M. Gosline. 1997. Solar activity and mammal cycles in the northern hemisphere. The American Naturalist 149:776-784. Slough, B. G., and G. Mowat. 1996. Lynx population dynamics in an untrapped refugium. Journal of Wildlife Management 60:946-961. St-Georges, M., S. Nadeau, D. Lambert, and R. Décarie. 1995. Winter habitat use by ptarmigan, snowshoe hares, red foxes, and river otters in the boreal forest – tundra transition zone of western Quebec. Canadian Journal of Zoology 73:755-764. Stefan, C. I., and C. J. Krebs. 2001. Reproductive changes in a cyclic population of snowshoe hares. Canadian Journal of Zoology 79:2101-2108. Stephenson, R. O. 1986. Development of lynx population estimation techniques. Alaska
Department of Fish and game. Federal Aid in Wildlife Restoration. Final Project Report W-22-2, W-22-3, W-22-4, and W-22-5. Job 7.12R. Juneau, Alaska, USA.
10
SPSS. 1998. Systat 9.0. SPSS, Inc., Chicago, Illinois, USA. Thompson, I. D. 1988. Habitat needs of furbearers in relation to logging in boreal Ontario. Forestry Chronicle 64:251-261. _____., I. J. Davidson, S. O’Donnell, and F. Brazeau. 1989. Use of track
transects to measure the relative occurrence of some boreal mammals in uncut forest and regeneration stands. Canadian Journal of Zoology 67:1816-1823.
Todd, A. W., L. B. Keith, and C. A. Fischer. 1981. Population ecology of coyotes
during a fluctuation of snowshoe hares. Journal of Wildlife Management 45:629- 640.
Wolff, J. O. 1980. The role of habitat patchiness in the population dynamics of snowshoe hares. Ecological Monograph 50:111-130. _____. 1982. Refugia, dispersal, predation, and geographic variation in snowshoe
hare cycles. Pages 441-449 in K. Meyers and C. D. MacInnes, editors. Proceedings of the world lagomorph conference, August 1979, University of Guelph, Guelph, ON.
11
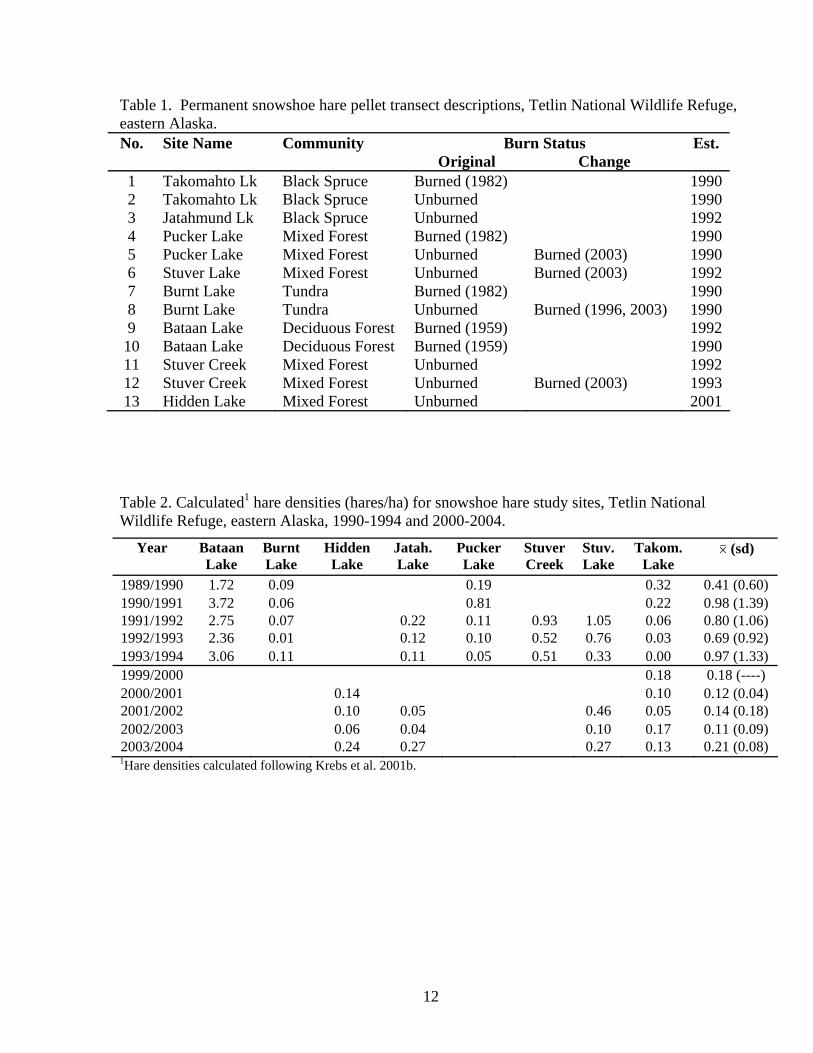
Table 1. Permanent snowshoe hare pellet transect descriptions, Tetlin National Wildlife Refuge, eastern Alaska. No. Site Name Community Burn Status Est.
Original Change 1 Takomahto Lk Black Spruce Burned (1982) 1990 2 Takomahto Lk Black Spruce Unburned 1990 3 Jatahmund Lk Black Spruce Unburned 1992 4 Pucker Lake Mixed Forest Burned (1982) 1990 5 Pucker Lake Mixed Forest Unburned Burned (2003) 1990 6 Stuver Lake Mixed Forest Unburned Burned (2003) 1992 7 Burnt Lake Tundra Burned (1982) 1990 8 Burnt Lake Tundra Unburned Burned (1996, 2003) 1990 9 Bataan Lake Deciduous Forest Burned (1959) 1992
10 Bataan Lake Deciduous Forest Burned (1959) 1990 11 Stuver Creek Mixed Forest Unburned 1992 12 Stuver Creek Mixed Forest Unburned Burned (2003) 1993 13 Hidden Lake Mixed Forest Unburned 2001
Table 2. Calculated1 hare densities (hares/ha) for snowshoe hare study sites, Tetlin National Wildlife Refuge, eastern Alaska, 1990-1994 and 2000-2004.
Year Bataan Lake
Burnt Lake
Hidden Lake
Jatah. Lake
Pucker Lake
Stuver Creek
Stuv. Lake
Takom. Lake
0 (sd)
1989/1990 1.72 0.09 0.19 0.32 0.41 (0.60) 1990/1991 3.72 0.06 0.81 0.22 0.98 (1.39) 1991/1992 2.75 0.07 0.22 0.11 0.93 1.05 0.06 0.80 (1.06) 1992/1993 2.36 0.01 0.12 0.10 0.52 0.76 0.03 0.69 (0.92) 1993/1994 3.06 0.11 0.11 0.05 0.51 0.33 0.00 0.97 (1.33) 1999/2000 0.18 0.18 (----) 2000/2001 0.14 0.10 0.12 (0.04) 2001/2002 0.10 0.05 0.46 0.05 0.14 (0.18) 2002/2003 0.06 0.04 0.10 0.17 0.11 (0.09) 2003/2004 0.24 0.27 0.27 0.13 0.21 (0.08) 1Hare densities calculated following Krebs et al. 2001b.
12
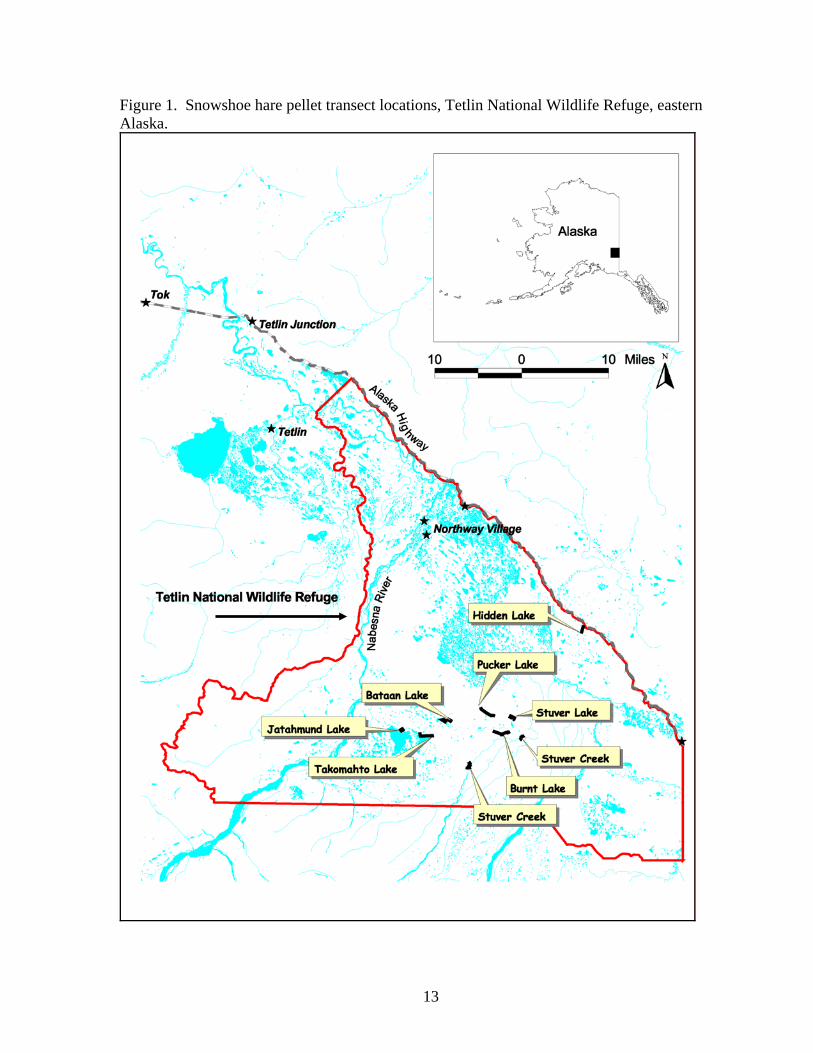
Figure 1. Snowshoe hare pellet transect locations, Tetlin National Wildlife Refuge, eastern Alaska.
13
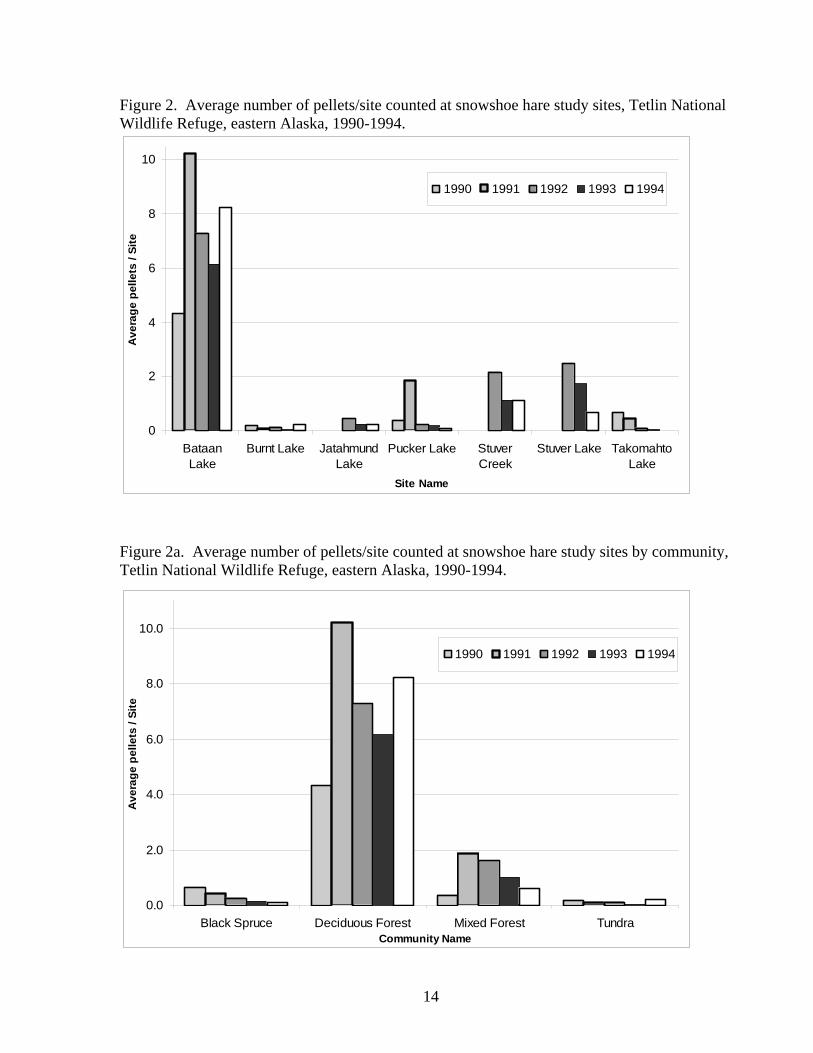
Figure 2. Average number of pellets/site counted at snowshoe hare study sites, Tetlin National Wildlife Refuge, eastern Alaska, 1990-1994.
0
2
4
6
8
10
BataanLake
Burnt Lake JatahmundLake
Pucker Lake StuverCreek
Stuver Lake TakomahtoLake
Site Name
Ave
rage
pel
lets
/ Si
te
1990 1991 1992 1993 1994
Figure 2a. Average number of pellets/site counted at snowshoe hare study sites by community, Tetlin National Wildlife Refuge, eastern Alaska, 1990-1994.
0.0
2.0
4.0
6.0
8.0
10.0
Black Spruce Deciduous Forest Mixed Forest TundraCommunity Name
Ave
rage
pel
lets
/ Si
te
1990 1991 1992 1993 1994
14
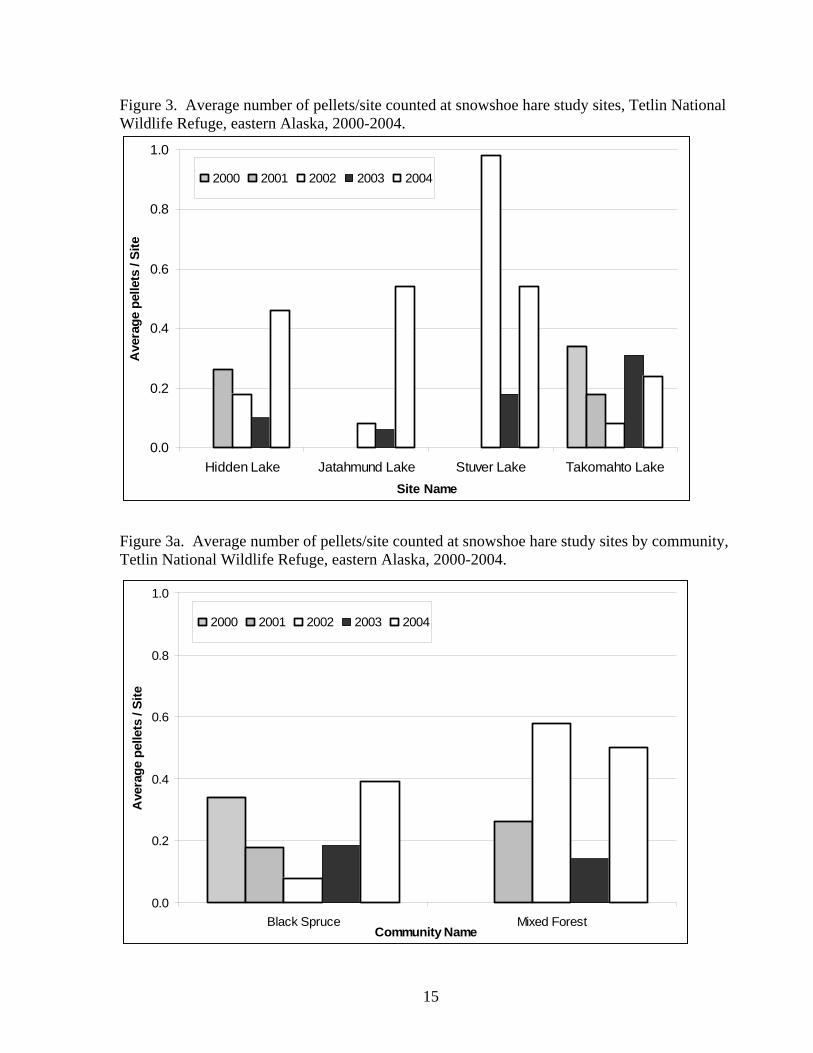
Figure 3. Average number of pellets/site counted at snowshoe hare study sites, Tetlin National Wildlife Refuge, eastern Alaska, 2000-2004.
0.0
0.2
0.4
0.6
0.8
1.0
Hidden Lake Jatahmund Lake Stuver Lake Takomahto LakeSite Name
Ave
rage
pel
lets
/ Si
te
2000 2001 2002 2003 2004
Figure 3a. Average number of pellets/site counted at snowshoe hare study sites by community, Tetlin National Wildlife Refuge, eastern Alaska, 2000-2004.
0.0
0.2
0.4
0.6
0.8
1.0
Black Spruce Mixed ForestCommunity Name
Ave
rage
pel
lets
/ Si
te
2000 2001 2002 2003 2004
15

Figure 4. Average number of snowshoe hare pellets/site counted at Takomahto Lake, Tetlin National Wildlife Refuge, eastern Alaska, 1990-1994 and 2000-2004.
0.65
0.420.40
0.340.31
0.24
0.00
0.09 0.08
0.18
0
0.2
0.4
0.6
0.8
1 2 3 4 5Year Number
Ave
rage
pel
lets
/ si
te
1990-1994 2000-2004
16
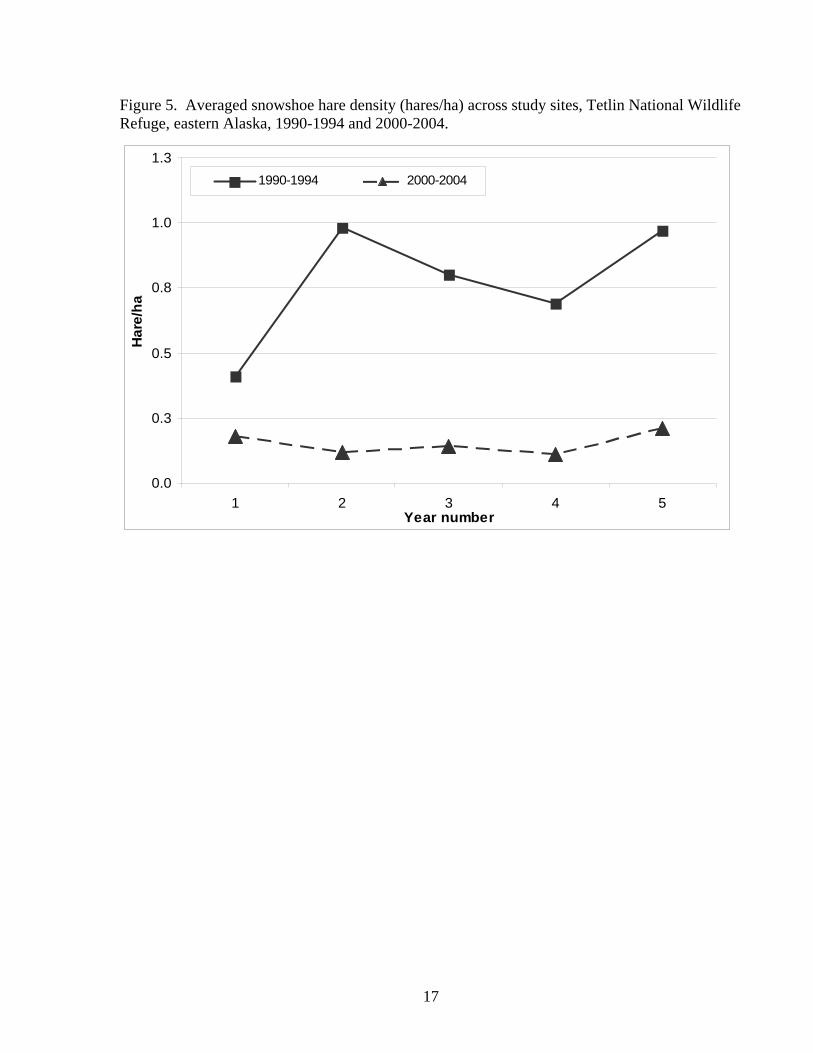
Figure 5. Averaged snowshoe hare density (hares/ha) across study sites, Tetlin National Wildlife Refuge, eastern Alaska, 1990-1994 and 2000-2004.
0.0
0.3
0.5
0.8
1.0
1.3
1 2 3 4 5Year number
Har
e/ha
1990-1994 2000-2004
17