conservation implications of the evolutionary history and ... · pdf filegene flow in...
TRANSCRIPT
Conservation implications of the evolutionary historyand genetic diversity hotspots of the snowshoe hare
ELLEN CHENG,* KAREN E. HODGES,† JOS �E MELO-FERREIRA,‡ PAULO C. ALVES*§ and
L. SCOTT MILLS*¶*Wildlife Biology Program, Department of Ecosystem and Conservation Sciences, University of Montana, 32 Campus Drive,
Missoula, MT 59812, USA, †Department of Biology, University of British Columbia Okanagan, 3333 University Way, Kelowna,
BC V1V 1V7, Canada, ‡CIBIO, Centro de Investigac�~ao em Biodiversidade e Recursos Gen�eticos, Universidade do Porto, InBIO -
Laboratorio Associado, Campus Agrario de Vair~ao, 4485-661 Vairao, Portugal, §Departamento de Biologia, Faculdade de
Ciencias da, Universidade do Porto, Rua do Campo Alegre s/n, 4169-007 Porto, Portugal, ¶Fisheries, Wildlife and Conservation
Biology Program, Department of Forestry and Environmental Resources, North Carolina State University, Raleigh, NC 27695,
USA
Abstract
With climate warming, the ranges of many boreal species are expected to shift north-
ward and to fragment in southern peripheral ranges. To understand the conservation
implications of losing southern populations, we examined range-wide genetic diversity
of the snowshoe hare (Lepus americanus), an important prey species that drives boreal
ecosystem dynamics. We analysed microsatellite (8 loci) and mitochondrial DNA
sequence (cytochrome b and control region) variation in almost 1000 snowshoe hares.
A hierarchical structure analysis of the microsatellite data suggests initial subdivision
in two groups, Boreal and southwestern. The southwestern group further splits into
Greater Pacific Northwest and U.S. Rockies. The genealogical information retrieved
from mtDNA is congruent with the three highly differentiated and divergent groups
of snowshoe hares. These groups can correspond with evolutionarily significant units
that might have evolved in separate refugia south and east of the Pleistocene ice
sheets. Genetic diversity was highest at mid-latitudes of the species’ range, and genetic
uniqueness was greatest in southern populations, consistent with substructuring
inferred from both mtDNA and microsatellite analyses at finer levels of analysis.
Surprisingly, snowshoe hares in the Greater Pacific Northwest mtDNA lineage were
more closely related to black-tailed jackrabbits (Lepus californicus) than to other snow-
shoe hares, which may result from secondary introgression or shared ancestral poly-
morphism. Given the genetic distinctiveness of southern populations and minimal
gene flow with their northern neighbours, fragmentation and loss of southern boreal
habitats could mean loss of many unique alleles and reduced evolutionary potential.
Keywords: climate change, core-periphery, evolutionarily significant units, landscape genetics,
Lepus americanus, phylogeography
Received 23 May 2013; revision received 5 May 2014; accepted 5 May 2014
Introduction
Over the next century, North America’s southern boreal
forests are predicted to undergo rapid fragmentation
and loss due to climate change and human activities
(IPCC 2007). Understanding the conservation implica-
tions of southern habitat loss for boreal species requires
evaluating range-wide genetic structure of individual
species and assessing the generality of these patterns
across taxa. Specifically, insights into large-scale genetic
diversity and population differentiation would clarify
the relative importance of southern boreal populations
as hotspots of diversity and evolutionarily significantCorrespondence: L. Scott Mills,
E-mail: [email protected]
© 2014 John Wiley & Sons Ltd
Molecular Ecology (2014) 23, 2929–2942 doi: 10.1111/mec.12790

units (ESUs; Moritz 1994), with implications for adap-
tive potential.
Distribution of genetic diversity and structure across
a species’ range reflects historical range contraction and
recolonization from glacial refugia as well as current
habitat fragmentation and dispersal. During the Quater-
nary ice ages (approximately 2.6 mya–present), the
alternation of glacial and interglacial periods caused
repeated changes in species’ distributions. A frequently
invoked ‘southern refugia’ model in phylogeography
suggests that when ice sheets advanced, many boreal
species persisted primarily in refugia in southern lati-
tudes (Hewitt 1996). Interglacial periods enabled north-
ward range expansion, with leading-edge populations
carrying a subset of the genetic diversity of refugial
populations. Simultaneously, range contraction to
higher elevations in southern populations may have
reduced connectivity and increased local diversification
(Moritz et al. 2008). For some species in North America
and Europe, a pattern of decreasing genetic diversity
with increasing latitude (‘southern richness, northern
purity’) may reflect a dominant influence of historical
southern refugia on patterns of diversity (Pielou 1991;
Hewitt 1996; Soltis et al. 1997).
The generality of the southern refugia model has
been challenged for species with high dispersal and
large contemporary ranges (Hewitt 2000; Provan & Ben-
nett 2008). For many North American species, fossil evi-
dence and phylogeographic studies have identified
additional glacial refugia in eastern Beringia, the Cana-
dian Arctic, coastal British Columbia, the Maritimes,
and other northern locations (Soltis et al. 2006; Provan
& Bennett 2008; Godbout et al. 2010). When expanding
populations from separate refugia met in zones of sec-
ondary contact, they often created hotspots of genetic
diversity (Provan & Bennett 2008). Geographic and
genetic subdivision within major refugia further compli-
cate genetic patterns (Gomez & Lunt 2007).
Contemporary gene flow also impacts genetic struc-
ture and diversity. Many boreal species have popula-
tions occupying peninsular habitat extensions into
montane forests of the USA (Shugart et al. 2005). In
addition to natural habitat fragmentation, these south-
ern boreal forests are heavily impacted by logging and
habitat conversion (Hansen et al. 2010; Powers et al.
2012), which could lead to differentiation in remnant
habitats. The core-periphery hypothesis suggests that
connected populations in the boreal range core should
have higher genetic diversity than the fragmented pop-
ulations of the southern periphery (Eckert et al. 2008).
But while low gene flow and chronic genetic drift may
reduce genetic diversity in peripheral populations, these
processes may simultaneously facilitate genetic differen-
tiation and preserve unique alleles (Eckert et al. 2008).
Given the complex interplay of forces that shape
intraspecific distribution of genetic diversity, what are
the consequences of losing southern boreal populations?
In this study we examined range-wide genetic diversity
of the snowshoe hare (Lepus americanus) to address this
question.
Snowshoe hares are important prey for most boreal
carnivores, structuring food web dynamics as strong in-
teractors (Krebs et al. 2001). Fossil evidence suggests the
persistence of snowshoe hares in extensive refugia
south of the ice sheets and in the northern refugium of
Beringia during the Last Glacial Maximum (LGM;
FAUNMAP Working Group 1994). Snowshoe hare pop-
ulations near historical Beringia and in Montana har-
bour high genetic diversity and are genetically
differentiated from each other (Burton et al. 2002). Mor-
phological differences among snowshoe hare popula-
tions in and around the Pacific Northwest suggest
genetically differentiated populations (Dalquest 1942).
We analysed mtDNA and microsatellite data
throughout the contemporary range of snowshoe hares
to test the hypotheses that: (i) extant snowshoe hare
populations derive from Beringia and southern refugia;
and (ii) snowshoe hare populations near the core of the
range exhibit higher genetic diversity than populations
near the periphery. We predict highest genetic diversity
and uniqueness in the species’ southern range and near
the Alaska-Yukon border, that is, in likely refugia, with
reduced diversity in range-edge populations outside of
these areas.
We then discuss how anticipated loss of southern bor-
eal habitats might affect snowshoe hare genetic diversity.
First, we determine whether multiple snowshoe hare
ESUs (sensu Moritz 1994) are warranted. Second, we
examine genetic diversity and uniqueness across a latitu-
dinal gradient, with particular focus on populations
below 49°N, the approximate southernmost extent of the
LGM. Many scenarios of climate change predict the cli-
mate envelope for North America’s boreal ecosystem will
shift north of 49°N within a century (Koven 2013).
Finally, we discuss similarities in findings between snow-
shoe hares and other North American hare species.
Materials and methods
We analysed 975 snowshoe hare samples from 16 U.S.
states and 12 Canadian provinces and territories
(Appendix S1, Supporting information). Nearly all sam-
ples were ear tissue collected from road kill, game har-
vests, and live-trapping during 1989–2010. Ten samples
were faecal pellets collected in Isle Royale, Michigan, in
2009. Eleven samples were tissue from specimens col-
lected near Vancouver, British Columbia, from 1929 to
1970, held at the University of British Columbia Cowan
© 2014 John Wiley & Sons Ltd
2930 E. CHENG ET AL.

Museum. For phylogenetic analyses, we additionally
analysed one white-tailed jackrabbit (Lepus townsendii)
tissue sample obtained from GenBank (Accession no.
AY292729; Matthee et al. 2004) and seven black-tailed
jackrabbit (L. californicus) tissue samples collected from
three U.S. states (California, New Mexico, Nevada).
Microsatellite analysis
Samples were grouped into populations on the basis of
two geographic criteria: (i) no potential genetic barriers
such as large lakes or rivers, mountain ranges, or non-
forested regions bisecting populations (Burton et al.
2002; Shafer et al. 2010b); and (ii) a maximum of
260 km between any two samples in a population. The
second criterion represents a coarse spatial scale much
greater than the distance hares disperse (up to ~20 km,
Gillis & Krebs 1999) but within the scale of reported
gene flow in northern snowshoe hare populations
(~600 km, Burton et al. 2002). After grouping samples,
we limited genetic analyses to groups with at least
seven samples. This minimum threshold was arbitrary,
but has precedence in other population genetic studies
(Schwartz et al. 2003; Tracy & Jamieson 2011).
We selected eight polymorphic microsatellite markers
developed in the European rabbit, Oryctolagus cuniculus,
and successfully used with snowshoe hares (Burton
et al. 2002; Schwartz et al. 2007): 7L1D3 (Korstanje et al.
2003); SAT02, SAT12, SAT13, SAT16 (Mougel et al.
1997); SOL08, SOL30 (with ‘GTGTCTT’ tail added) (Rico
et al. 1994); and SOL33 (Surridge et al. 1997) (Appendix
S2, Supporting information). DNA extraction and geno-
typing methods are detailed in Appendix S3 (Support-
ing information).
Allelic dropout and false allele rates were calculated
with 10 000 search iterations in Pedant version 1.0.
(Johnson & Haydon 2007). For each population, we used
Genepop version 4.0.11 (Rousset 2008) to test for Hardy-
Weinberg Equilibrium (HWE) and linkage disequilib-
rium. Markov chain parameters for exact tests were set
at 10 000 dememorizations, 100 batches, and 5000 itera-
tions per batch (Raymond & Rousset 1995). We used the
false discovery rate approach (FDR; Benjamini & Hoch-
berg 1995) in the R software package ‘fdrtool’ (Strimmer
2008; http://cran.r-project.org/) to correct for multiple
significance testing type I error. Potential null alleles
and scoring errors due to stuttering and allelic drop-out
were identified by Monte Carlo simulation in Micro-
Checker version .2.2.3 (van Oosterhout et al. 2004).
We performed Bayesian analyses in STRUCTURE
version 2.3.3 (Pritchard et al. 2000) and Geneland
version 4.0.3 (Guillot et al. 2005) to partition microsat-
ellite data into genetic clusters, and to assign individu-
als to their likely cluster of origin. In STRUCTURE, we
applied an admixture model with the ‘locprior’ option,
using a burn-in period of 20 000 generations and
100 000 MCMC iterations after burn-in. We compared
results from correlated vs. uncorrelated allele fre-
quency models. To check for MCMC consistency, we
performed 20 replicates for each K (number of clus-
ters) from 1 to 40. The most likely K value was deter-
mined in Structure Harvester version 0.6.93 (Earl &
vonHoldt 2011) as the likelihood model with the high-
est DK (Evanno et al. 2005), unless the maximum lnP
(D) was for K = 1 (which would indicate no substruc-
ture). In the presence of substructure, the DK method
detects the highest hierarchical structure (Evanno et al.
2005). We assigned each individual to its most proba-
ble cluster and repeated the analysis for each cluster
separately, until further substructure could not be
detected. Cluster assignment was based on outcomes
from the run with highest lnP(D) among 20 replicates.
Following Coulon et al. (2008), only individuals with at
least 60% membership in a cluster were included in
subsequent analyses. For each subsequent analysis,
model parameters remained the same, but maximum
K was set at one greater than the number of sampled
populations in that cluster.
In Geneland, we evaluated results from three spa-
tially explicit model combinations. We examined both
correlated and uncorrelated allele frequency models
without filtering null alleles. We additionally examined
an uncorrelated frequency model while filtering null
alleles. For each of the three model combinations we
ran 20 independent replicates of 1 000 000 MCMC itera-
tions with a thinning of 1000 and burn-in of 200 000
iterations. K was allowed to vary from 1 to 40. Follow-
ing program recommendations for our sample size, we
set maximum rate of Poisson process = 853 and maxi-
mum number of nuclei in the Poisson-Voronoi tessella-
tion = 2559. We allowed a 15-km uncertainty in spatial
coordinates. MCMC convergence was assessed for each
model combination by comparing estimated K and clus-
ter assignments across replicate runs.
GENALEX version 6.3 (Peakall & Smouse 2006) was
used to calculate number of alleles and expected hetero-
zygosity (Nei 1978) for each population. For all pairs of
populations, we estimated Nei’s D (Nei 1972) and Weir
& Cockerham’s (1984) FST, with the latter calculated in
ARLEQUIN version 3.5.1.2 (Excoffier et al. 2005). Signif-
icance was determined with 1000 permutations of
samples among populations and FDR correction for
multiple comparisons.
We used rarefaction, implemented in HP-RARE ver-
sion 1.0 (Kalinowski 2005), to calculate private allelic
richness (PAR) for each population, standardized to
the smallest sample size (seven individuals) in this
study. To minimize biases due to uneven sampling
© 2014 John Wiley & Sons Ltd
SNOWSHOE HARE LANDSCAPE GENETICS AND CONSERVATION 2931

density, all populations within a 350 km radius were
excluded from the calculation of PAR for each sam-
pled population (we also tested 500 km and results
were similar; data not shown). We examined scatter-
plots of genetic metrics against latitude and longitude
to identify signatures of genetic drift at the current
range periphery and to understand geographic pat-
terns of diversity.
Mitochondrial DNA analysis
We amplified a 468 bp fragment of the mitochondrial
control region (CR) with primers LCRSEQ (Melo-Ferre-
ira et al. 2007) and LepD2H (Pierpaoli et al. 1999) in all
snowshoe hare samples. A fragment with 633 bp of the
cytochrome b (Cytb) gene was also sequenced in a sub-
set of 80 snowshoe hare and seven black-tailed jackrab-
bit samples, using primers LGCYF (Alves et al. 2003)
and LCYTBR (Melo-Ferreira et al. 2005), as detailed in
Appendix S3 (Supporting information). The Cytb subset
comprised at least one snowshoe hare sample from each
population and additional samples from regions of high
CR genetic structure. We visually aligned sequences in
CodonCode Aligner version 3.5.4 (CodonCode Corpora-
tion, Dedham, MA, USA).
Phylogenetic trees were constructed in BEAST ver-
sion 1.7.4 (Drummond et al. 2012) based on the Cytb
gene, which has a slower mutation rate and thus lower
tendency than CR for homoplasy over long timescales
(Baker & Marshall 1997). We used jModelTest version
2.1.3 (Darriba et al. 2012) and the Bayesian information
criterion to assess the best-fit model of sequence evolu-
tion. Posterior probabilities were determined from three
independent runs of 250 million generations, using the
selected mutation model, the Yule tree prior and a ran-
dom local clock (Drummond & Suchard 2010), exclud-
ing the initial 10% of each run as burn-in. The stability
of the runs and convergence of the MCMC were
assessed with Tracer version 1.5 (http://beast.bio.ed.ac.
uk/Tracer). Results from the three runs were concate-
nated in LogCombiner version 1.7.4 and trees anno-
tated using TreeAnnotator version 1.7.4. The annotated
phylogenetic tree and posterior probability estimates
were visualized in FigTree version 1.4.0 (http://tree.
bio.ed.ac.uk/software/figtree/). To estimate lineage
divergence times, we used a mutation rate of 0.02 sub-
stitutions per site per million years (Brown et al. 1979),
which has been used to estimate divergence in other
hare studies (Pierpaoli et al. 1999; Melo-Ferreira et al.
2007).
The demographic history of the major mtDNA lineages
was inferred from control region sequences using the
Bayesian Skyline Plot (BSP) (Drummond et al. 2005)
implemented in BEAST. Three replicate runs of 100
million generations were performed using the appropri-
ate mutation models (for Boreal, TrN+I+G; for Greater
Pacific Northwest and U.S. Rockies, HKY+G) selected
using the procedure described above and a random local
clock (Drummond & Suchard 2010). Tracer version 1.5
was used to assess stability of the MCMC and the initial
10% of each run was discarded as burn-in. We used Log-
Combiner version 1.7.4 to concatenate results of the three
replicate runs. A CR mutation rate of 0.156 substitutions
per site per million years (derived from Melo-Ferreira
et al. 2007) was used to calibrate the BSP.
We examined within-lineage structure with the CR
gene, because its fast rate of evolution makes it suitable
for intraspecific studies (Vigilant et al. 1991). An unroot-
ed median-joining network (NETWORK version 4.5.1.6,
http://www.fluxus-engineering.com/) was generated
from CR haplotypes identified in DnaSP version 5.10
(Librado & Rozas 2009). Transversions were weighted
three times as high as transitions, following software
recommendations. For K = 1–10, SAMOVA version 1.0
(Dupanloup et al. 2002) identified the partitioning of CR
haplotype variance due to differences among groups.
We ran SAMOVA with 500 initial population partitions
and 10 000 iterations for each K. Significance of vari-
ance components was evaluated by 1000 permutations
of populations among groups.
We used ARLEQUIN v.3.5.1.2 (Excoffier et al. 2005) to
calculate haplotype and nucleotide diversities. As with
microsatellite data, scatterplots were used to assess lati-
tudinal and longitudinal patterns in genetic diversity.
To evaluate genetic differentiation, we calculated pair-
wise control region FST. ARLEQUIN v.3.5.1.2 was used
to determine significance of tests with 10 000 bootstraps
and FDR control for multiple comparisons.
Results
Microsatellite analysis
With an average of 2.2 PCR replicates per sample, we
successfully genotyped eight microsatellite loci for 922
snowshoe hares. The mean allelic dropout rate per allele
was 0.0070 and mean false allele rate was 0.0035, for all
loci combined. After excluding populations with <7 indi-
viduals, 853 samples in 39 populations remained for
analyses (Fig. 1). Only 4% of 312 population-loci combi-
nations significantly deviated from Hardy-Weinberg
Equilibrium, generally due to heterozygote deficit.
Slightly over 5% of 1026 tests for linkage disequilibrium
were significant. Micro-checker identified potential null
alleles in 8% of 312 population-loci tests. However,
null alleles and deviations from HWE were not associ-
ated more frequently with any particular locus, and
genotypic disequilibrium was not consistently attributed
© 2014 John Wiley & Sons Ltd
2932 E. CHENG ET AL.

to a particular locus pair. Therefore we retained all loci
for subsequent analyses.
STRUCTURE analyses identified hierarchical popula-
tion division (Fig. 1 and Appendix S4, Supporting infor-
mation). In the first round of STRUCTURE runs, the
highest likelihood model (K = 2) identified a Boreal
cluster comprising the entire northern and eastern
range of the species, and a southwestern cluster com-
prising remaining populations. The second round of
STRUCTURE further splits the Boreal cluster into two
subclusters. However, proportion membership in the
subclusters transitioned from west to east (Appendix
S5, Supporting information), suggesting an effect of iso-
lation by distance rather than historical isolation (Meir-
mans 2012). A Mantel test (Mantel 1967), following
Rousset’s (1997) method, confirmed a significant corre-
lation between geographic and genetic distance in the
Boreal cluster (P < 0.001). Because other analyses and
markers also supported a single Boreal cluster, we did
not continue STRUCTURE analyses to further subset
the Boreal cluster. In contrast to the Boreal cluster, the
second round of STRUCTURE clearly divided the
southwestern group into two genetic clusters, corre-
sponding to the Greater Pacific Northwest region and
to the U.S. Rockies. Further rounds of the hierarchical
STRUCTURE analysis subdivided the Greater Pacific
Northwest and U.S. Rockies groups into many subclus-
ters. Ultimately, by the fifth round of analysis, all
southwestern populations were identified as distinct
subclusters except for WA1 and WA4 in Washington.
For these two populations, some individuals could not
be assigned to a cluster with at least 60% probability,
and other individuals grouped with other populations.
Hierarchical cluster patterns were identical for the
correlated and uncorrelated allele frequency models.
Using Geneland, all replicates of the uncorrelated fre-
quency models (with and without filtering null alleles)
consistently identified a single Boreal cluster and 4–7
distinct clusters in the species’ southwestern range.
With the uncorrelated model and null alleles filtered,
the highest mean posterior density across 20 replicates
was obtained for K = 5, with clusters almost identical to
those identified from the first three rounds of STRUC-
TURE hierarchical analysis (Appendix S6, Supporting
information). All replicates of the correlated frequency
model in Geneland inferred 39–40 genetic clusters,
likely due to known instabilities of this model in the
presence of isolation by distance (Guillot 2008).
Measures of FST and Nei’s D were highly correlated
across populations (r = 0.93, P < 0.001). We found high
FST pairwise estimates (>0.20) between the three genetic
clusters identified in the first two rounds of STRUC-
TURE. These clusters were the most congruent across
markers (microsatellite and mtDNA) and analyses. Pair-
wise FST was high within the Greater Pacific Northwest
and U.S. Rockies clusters, but was usually below 0.20
within the Boreal cluster (Appendix S7, Supporting
information).
Most snowshoe hare populations were characterized
by high genetic diversity (Table 1). On average, popula-
tions in the Boreal cluster exhibited the highest allelic
richness and heterozygosity, but the lowest uniqueness
SouthwesternBoreal
STRUCTURE ROUND ONE
WA3
WA1
OR1
CA1
CA2 UT1
STRUCTURE ROUND TWO
BC1
OR2
WA4
MT1
WY1
CO1
AK4
AK2
AK6
BC4
BC2AB2
YK2
NWT1
NWT2
AB1 SK1 MB1
MN2MN1
IR1MI1
ON3 ON1
PA1
WV1
PA2
NY1
ME2ME1
QC4
NB1
QC3
Greater Pacific NorthwestU.S. Rockies
STRUCTURE ROUND THREE
Boreal
Fig. 1 Sampling locations and geographic
distribution of major snowshoe hare mi-
crosatellite clusters, as defined by
STRUCTURE version 2.3.3 hierarchical
analysis (Pritchard et al. 2000). The first
run of STRUCTURE distinguished Boreal
(circles) from southwestern (triangles)
populations. The second run further split
the southwestern cluster (grey shades).
By the third run, five distinct genetic
clusters were identified (dotted ovals).
The approximate southernmost latitude
of the LGM is marked with a grey
dashed line. Study results suggest extant
snowshoe hare populations likely
expanded from refugia south of this lati-
tude and from the current eastern hare
range.
© 2014 John Wiley & Sons Ltd
SNOWSHOE HARE LANDSCAPE GENETICS AND CONSERVATION 2933
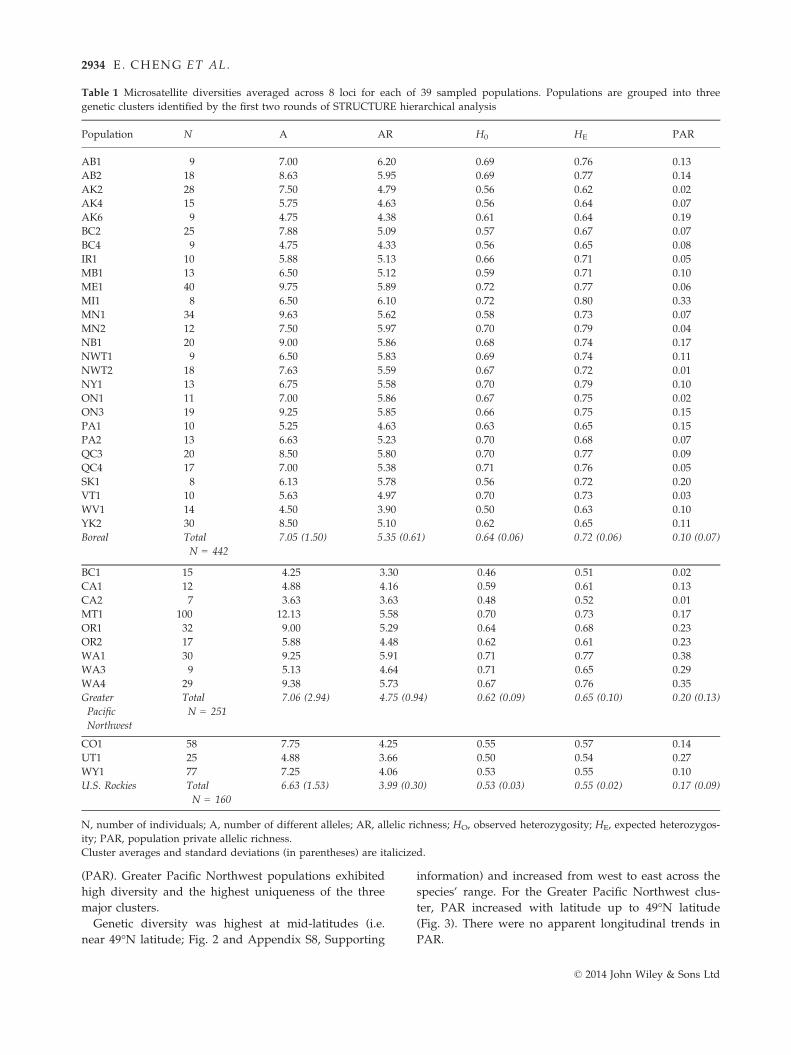
(PAR). Greater Pacific Northwest populations exhibited
high diversity and the highest uniqueness of the three
major clusters.
Genetic diversity was highest at mid-latitudes (i.e.
near 49°N latitude; Fig. 2 and Appendix S8, Supporting
information) and increased from west to east across the
species’ range. For the Greater Pacific Northwest clus-
ter, PAR increased with latitude up to 49°N latitude
(Fig. 3). There were no apparent longitudinal trends in
PAR.
Table 1 Microsatellite diversities averaged across 8 loci for each of 39 sampled populations. Populations are grouped into three
genetic clusters identified by the first two rounds of STRUCTURE hierarchical analysis
Population N A AR H0 HE PAR
AB1 9 7.00 6.20 0.69 0.76 0.13
AB2 18 8.63 5.95 0.69 0.77 0.14
AK2 28 7.50 4.79 0.56 0.62 0.02
AK4 15 5.75 4.63 0.56 0.64 0.07
AK6 9 4.75 4.38 0.61 0.64 0.19
BC2 25 7.88 5.09 0.57 0.67 0.07
BC4 9 4.75 4.33 0.56 0.65 0.08
IR1 10 5.88 5.13 0.66 0.71 0.05
MB1 13 6.50 5.12 0.59 0.71 0.10
ME1 40 9.75 5.89 0.72 0.77 0.06
MI1 8 6.50 6.10 0.72 0.80 0.33
MN1 34 9.63 5.62 0.58 0.73 0.07
MN2 12 7.50 5.97 0.70 0.79 0.04
NB1 20 9.00 5.86 0.68 0.74 0.17
NWT1 9 6.50 5.83 0.69 0.74 0.11
NWT2 18 7.63 5.59 0.67 0.72 0.01
NY1 13 6.75 5.58 0.70 0.79 0.10
ON1 11 7.00 5.86 0.67 0.75 0.02
ON3 19 9.25 5.85 0.66 0.75 0.15
PA1 10 5.25 4.63 0.63 0.65 0.15
PA2 13 6.63 5.23 0.70 0.68 0.07
QC3 20 8.50 5.80 0.70 0.77 0.09
QC4 17 7.00 5.38 0.71 0.76 0.05
SK1 8 6.13 5.78 0.56 0.72 0.20
VT1 10 5.63 4.97 0.70 0.73 0.03
WV1 14 4.50 3.90 0.50 0.63 0.10
YK2 30 8.50 5.10 0.62 0.65 0.11
Boreal Total
N = 442
7.05 (1.50) 5.35 (0.61) 0.64 (0.06) 0.72 (0.06) 0.10 (0.07)
BC1 15 4.25 3.30 0.46 0.51 0.02
CA1 12 4.88 4.16 0.59 0.61 0.13
CA2 7 3.63 3.63 0.48 0.52 0.01
MT1 100 12.13 5.58 0.70 0.73 0.17
OR1 32 9.00 5.29 0.64 0.68 0.23
OR2 17 5.88 4.48 0.62 0.61 0.23
WA1 30 9.25 5.91 0.71 0.77 0.38
WA3 9 5.13 4.64 0.71 0.65 0.29
WA4 29 9.38 5.73 0.67 0.76 0.35
Greater
Pacific
Northwest
Total
N = 251
7.06 (2.94) 4.75 (0.94) 0.62 (0.09) 0.65 (0.10) 0.20 (0.13)
CO1 58 7.75 4.25 0.55 0.57 0.14
UT1 25 4.88 3.66 0.50 0.54 0.27
WY1 77 7.25 4.06 0.53 0.55 0.10
U.S. Rockies Total
N = 160
6.63 (1.53) 3.99 (0.30) 0.53 (0.03) 0.55 (0.02) 0.17 (0.09)
N, number of individuals; A, number of different alleles; AR, allelic richness; HO, observed heterozygosity; HE, expected heterozygos-
ity; PAR, population private allelic richness.
Cluster averages and standard deviations (in parentheses) are italicized.
© 2014 John Wiley & Sons Ltd
2934 E. CHENG ET AL.

Mitochondrial DNA analysis
The final data set for CR analyses comprised 893 snow-
shoe hare samples represented by 365 haplotypes. For
phylogenetic tree construction, the subset of 80 snow-
shoe hare Cytb sequences comprised 43 haplotypes.
The best-fit model of nucleotide substitution for Cytb
phylogeny was HKY+G. Three highly divergent lin-
eages were identified (Fig. 4), broadly corresponding
with the major genetic clusters identified in the first
two rounds of STRUCTURE analysis of microsatellites
(Fig. 1 and Appendix S4, Supporting information).
MtDNA analysis also identified two sublineages (with
>95% posterior probability) that corresponded with the
finer scale splitting of southwestern populations from
hierarchical STRUCTURE analysis: (i) WA3 in Olympic
National Park, Washington, was a sublineage of the
Greater Pacific Northwest lineage; and (ii) CO1 in
Gunnison, Colorado, was a sublineage of the U.S. Rock-
ies lineage. Within the Boreal lineage, a basal group
comprised samples from populations near the lineage’s
southern range (MT1, Montana; MB1, Manitoba; ON1,
Ontario; Fig. 4). The Cytb topology indicated that
snowshoe hares in the Greater Pacific Northwest line-
age are more closely related to black-tailed jackrabbits
than to other snowshoe hare populations.
Divergence estimation between the Boreal and U.S.
Rockies snowshoe hare lineages is 1.30 mya (95% CI
0.88–1.74 mya). The CO1 sublineage split off from the
U.S. Rockies major lineage more recently (0.78 mya;
95% CI 0.42–1.18 mya). The clade comprising most of
the snowshoe hares in the Greater Pacific Northwest
lineage diverged from BTJR about 0.59 mya (95% CI
0.34–0.90 mya; Fig. 4). The Bayesian skyline plot pro-
vided strong evidence of a recent demographic expan-
sion of the Boreal lineage (Fig. 5), whereas expansion of
the Greater Pacific Northwest and U.S. Rockies groups
was not supported.
NETWORK and SAMOVA analyses, based on the CR
gene, accorded with the Cytb phylogeny. In an unroot-
ed median-joining network, the Cytb lineages and sub-
lineages were reciprocally monophyletic and separated
from each other by ≥10 CR base pair substitutions
(Appendix S9, Supporting information). By these crite-
ria, the OR2 population of Malheur National Forest,
35 40 45 50 55 60 65 70
0.5
0.6
0.7
0.8
0.9
Exp
ecte
d he
tero
zygo
sity
Latitude (°N)
Boreal Greater Pacific Northwest U.S. Rockies
−180 −160 −140 −120 −100 −80 −60 −40
0.5
0.6
0.7
0.8
0.9
Exp
ecte
d he
tero
zygo
sity
Longitude (°W)
Fig. 2 For each sampled population, expected heterozygosity
plotted against latitude (top) and longitude (bottom). The grey
vertical bar marks the approximate southernmost latitude of
the LGM.
35 40 45 50 55 60 65 70
0.0
0.1
0.2
0.3
0.4
Priv
ate
alle
lic ri
chne
ss
Latitude (°N)
−180 −160 −140 −120 −100 −80 −60 −40
0.0
0.1
0.2
0.3
0.4
Priv
ate
alle
lic ri
chne
ss
Longitude (°W)
Boreal Greater Pacific Northwest U.S. Rockies
Fig. 3 For each sampled population, private allelic richness
(PAR) plotted against latitude (top) and longitude (bottom).
The grey vertical bar marks the approximate southernmost lati-
tude of the LGM.
© 2014 John Wiley & Sons Ltd
SNOWSHOE HARE LANDSCAPE GENETICS AND CONSERVATION 2935

Oregon, was also identified as a distinct sublineage of
the U.S. Rockies lineage.
Differences between the Greater Pacific Northwest
lineage and all other snowshoe hare lineages explained
77% of total genetic variation in the CR gene (SAM-
OVA; Dupanloup et al. 2002). If the Greater Pacific
Northwest snowshoe hare lineage is introgressed from
black-tailed jackrabbits, this deep genetic division when
K = 2 is an artefact of interspecific hybridization rather
than snowshoe hare demographic history. Therefore,
we also analysed the data with the Greater Pacific
Northwest lineage excluded. In this analysis, 66% of
variation was explained by differences between four
groups (K = 4, P < 0.001): the Boreal lineage, U.S. Rock-
ies lineage, and the sublineages CO1 and OR2. Control
region pairwise FST was high between and within all
lineages except within the Boreal lineage (Appendix
S10, Supporting information).
Only two populations (MT1 and WA4; Fig. 1) con-
tained haplotypes that could be ascribed to more than
one lineage, with both showing ties to Boreal and
Greater Pacific Northwest lineages. Most populations
were characterized by high haplotype and nucleotide
diversities, with exceptions in British Columbia (BC1,
near Vancouver) and in southern populations (CA1 and
CA2 in California; UT1 in Utah; WV1 in West Virginia;
Appendix S11, Supporting information). Haplotype and
nucleotide diversities increased with latitude up to
~49°N latitude (Appendices S12 and S13, Supporting
information). MtDNA diversity did not exhibit any
clear longitudinal pattern.
Discussion
In this range-wide study of a species distributed across
boreal North America, we found that snowshoe hares
formed three major genetic groups with well-defined
distributions, coincident with patterns observed in other
North American boreal species (Arbogast 1999; van Els
et al. 2012). The entire northern and eastern range of the
Fig. 4 Snowshoe hare phylogenetic relationships, as constructed in BEAST version 1.7.4 (Drummond et al. 2012), based on the Cytb
gene. Asterisks (*) indicate lineages and sublineage divisions with ≥95% posterior probability support. Map shows the geographic
distribution of the three major Cytb lineages. Filled symbols identify sublineages.
© 2014 John Wiley & Sons Ltd
2936 E. CHENG ET AL.

snowshoe hare, spanning 6000 km across Canada and
the eastern U.S., constituted a single Boreal group char-
acterized by high genetic diversity and gene flow. Two
geographically confined groups―in the Greater Pacific
Northwest and U.S. Rockies―exhibited lower gene flow
and high genetic uniqueness. The three major groups
are coherent from microsatellite and mtDNA analyses.
Both markers further identified genetic subdivision
within the Greater Pacific Northwest and U.S. Rockies,
of which the separation of CO1 (Colorado) from the
U.S. Rockies group was congruent across all markers
and analyses. Modern populations of snowshoe hares
likely derived from refugial populations that persisted
through the Quaternary ice ages in eastern and south-
ern refugia.
We found high genetic diversity in most sampled
populations, but reduced diversity at current range
edges, especially for populations at the species’ frag-
mented southern edge. Southern range populations
below 49°N had high genetic uniqueness with minimal
gene flow with their northern neighbours, suggesting
snowshoe hares could lose considerable genetic diver-
sity if southern boreal habitats are lost.
Evolutionary history and refugial origin
This work revealed strong genetic structure at different
hierarchical levels and a remarkable coincidence of the
inference of three major geographically explicit groups
of snowshoe hares based on mtDNA sequences and mi-
crosatellite data. Further, these markers also coincide in
the suggestion of additional genetic fragmentation in
the species’ southwestern range. Based on the mtDNA
phylogeny, we estimated divergence of the three major
groups to be 1.30–0.78 mya, long before the height of
the LGM ~18 kya. Regional mixing among groups was
sufficiently low during subsequent interglacial warm
periods, including the current one, that deep genetic
divisions are still maintained in the mtDNA and micro-
satellite data.
Many co-occurring forest species for which continent-
wide genetic data are available share this phylogeo-
graphic pattern―a large genetic cluster across Canada
and the eastern U.S. and one or more smaller genetic
clusters in the western USA. Examples include the gray
jay (Perisoreus canadensis, van Els et al. 2012), northern
flying squirrel (Glaucomys spp., Arbogast 1999), black
bear (Ursus americanus, Wooding & Ward 1997) and
hairy woodpecker (Picoides villosus, Klicka et al. 2011).
Genetic groups in these species diverged an estimated
2.97–0.69 mya, a range that encompasses our diver-
gence estimates for the snowshoe hare.
Boreal snowshoe hare lineage. The height of the LGM in
North America occurred ~18 kya, and by 6 kya, the gla-
ciers had largely disappeared (Pielou 1991). Given the
Boreal lineage diverged from other snowshoe hare lin-
eages an estimated 1.30 mya, colonization of newly
available boreal habitats after the LGM must have
occurred primarily from refugial populations within the
Boreal lineage. We had hypothesized a Beringian refu-
gium for snowshoe hares, as reported for several other
North American boreal species (Shafer et al. 2010b), but
we did not find genetic diversity or uniqueness patterns
indicative of a major Beringian refugium for snowshoe
hares. A few snowshoe hare fossils are documented
from Alaska and Yukon from 20 to 10 kya, but the
majority of hare fossils from this period are from the
lower 48 U.S. states (FAUNMAP Working Group 1994).
Thus, any relict snowshoe hare populations that sur-
vived the LGM in Beringia may have been too small or
isolated to be heavily represented in contemporary
snowshoe hare genetic structure.
Instead, genetic patterns suggest that the Boreal line-
age primarily expanded from refugia near the southern
0 20 40 60 80
0.0
0.5
1.0
1.5
2.0
2.5
Pop
ulat
ion
size
BOREAL
0 20 40 60 80
0.0
0.5
1.0
1.5
2.0
2.5
Pop
ulat
ion
size
GREATER PACIFIC NORTHWEST
0 20 40 60 80
0.0
0.5
1.0
1.5
2.0
2.5
Pop
ulat
ion
size
U.S. ROCKIES
Time from present (kya)
Fig. 5 Bayesian skyline plots (BEAST version 1.7.4; Drummond
et al. 2012) for three snowshoe hare genetic lineages. Relative
population sizes are in units of Ne x mutation rate. Grey lines
represent the 95% CI.
© 2014 John Wiley & Sons Ltd
SNOWSHOE HARE LANDSCAPE GENETICS AND CONSERVATION 2937

edge of the ice sheets and from eastern refugia. This
idea is supported by the basal position of snowshoe
hare Cytb haplotypes sampled from locations close to
current southern limits of the Boreal lineage. In addi-
tion, microsatellite diversity was highest in eastern pop-
ulations of the Boreal lineage. Results are consistent
with fossil pollen data, which indicate that at the LGM,
boreal forests in North America persisted in at least
two major pockets—the Pacific Northwest and the
southeastern USA (Williams et al. 1993).
The overall high genetic diversity through much of
the Boreal lineage, and the significant pattern of IBD
across the Boreal lineage range, suggests cross-continen-
tal expansion may have proceeded slowly or from a
broad refugial front (Hewitt 1996). Signals of demo-
graphic expansion revealed in the Bayesian skyline plot
indicate Boreal lineage expansion may have begun
~48 000 years ago.
Greater Pacific Northwest and U.S. Rockies snowshoe hare
lineages. The Greater Pacific Northwest and U.S. Rock-
ies lineages occur in the species’ southwest range,
which was largely ice free during the Pleistocene. The
high genetic uniqueness and strong genetic subdivisions
in mtDNA of these lineages indicate that they arose
from at least two discrete refugia. Comparative phylog-
eographic studies have identified the northwestern USA
as an area of exceptionally high genetic differentiation
for boreal and temperate species, due to the complex
physiography of the region and its relative stability as a
glacial refugium (Soltis et al. 1997; Swenson & Howard
2005; Shafer et al. 2010b). Our Bayesian estimates of
temporal fluctuations of effective population size sug-
gested these evolutionary groups remained relatively
stable through evolutionary time (Fig. 5).
The mtDNA analyses indicate the Greater Pacific
Northwest snowshoe hares are more closely related to
black-tailed jackrabbits than to other snowshoe hares.
Two competing hypotheses may explain this result: (i)
mitochondrial DNA introgression (through hybridiza-
tion) from Lepus californicus into Lepus americanus in the
southwestern range of the latter or (ii) retention of an
ancestral polymorphism shared between the two spe-
cies (Moore 1995). Extensive mtDNA introgression
occurs among other species of hares, resulting from
ancient or current contacts among species and some-
times causing extensive replacements of lineages (Alves
et al. 2008). Even though the geographic restriction of
the shared variants and the remarkably close phyloge-
netic relationship with current L. californicus variants
support the introgression hypothesis, the inference of
such phenomena would require reconstruction of the
speciation history of the taxa, using genealogical infor-
mation from nuclear loci (Melo-Ferreira et al. 2012). It is
nevertheless important to note that if introgression
caused this interspecific sharing of lineages, it was
remarkably pervasive and may have completely
replaced the mtDNA variation in the Greater Pacific
Northwest evolutionary group identified using micro-
satellites.
Genetic diversity of core vs. peripheral populations
Genetic diversity of snowshoe hares was highest in
mid-latitude populations, near the southernmost edge
of the LGM. From here, diversity clearly decreased
towards the south and less dramatically towards the
north. The southern range edge for snowshoe hares is
highly impacted by natural and anthropogenic habitat
fragmentation (Hansen et al. 2010). The observed
genetic pattern is consistent with the core-periphery
hypothesis, with populations in the fragmented south-
ern periphery exhibiting the lowest genetic diversity
and gene flow. Further, high amplitude population fluc-
tuations may promote gene flow and genetic diversity
(Ehrich et al. 2009). Snowshoe hare populations across
their northern range undergo large population cycles,
whereas southern populations may have reduced cyclic-
ity (Hodges 2000).
Anticipated genetic consequences of southernpopulation loss
Our study provides important insights on how potential
loss of southern hare populations (below 49°N) may
affect genetic diversity. The strong genetic subdivisions
and uniqueness of snowshoe hare populations suggest
that anticipated fragmentation and loss of these habitats
due to climate change and human activities may greatly
reduce overall species genetic diversity, with possible
negative implications for future adaptive potential. For
example, we identified at least three snowshoe hare
evolutionarily significant units (ESUs), using Moritz’s
(1994) criteria of reciprocal monophyly for mtDNA and
significant divergence in the frequencies of nuclear
alleles. Two ESUs occurred wholly in the species’
southern range. Three snowshoe hare sublineages,
reciprocally monophyletic and separated from each
other by ≥10 CR base pair substitutions, were also
found in the southern range. Additional ESUs may
occur in parts of the southern range not sampled in this
study: for example, we did not sample hares in New
Mexico or in northern Idaho, an area with high ende-
mism hypothesized to be the ‘Clearwater refugium’
(Daubenmire 1975; Soltis et al. 1997).
A limitation of this study is its reliance on neutral
genetic variation, without complementary information
on adaptive potential, for identifying ESUs (Funk et al.
© 2014 John Wiley & Sons Ltd
2938 E. CHENG ET AL.

2012). We identified ESUs on the basis of Moritz’s defi-
nition because it can be operationally applied from neu-
tral genetic markers (de Guia & Saitoh 2007). Other
definitions of ESU emphasize conserving adaptive vari-
ation, by incorporating adaptive genetic variation, life
history traits, morphology and species distribution
(Ryder 1986; Vogler & DeSalle 1994). An additional
question that should be addressed is, ‘How much
would loss of southern populations impact the species’
ability to adapt to global warming?’ Such studies would
require evaluation of quantitative genetic trait variations
directly linked to traits with adaptive value under
altered climate regimes. For snowshoe hares, adaptive
variation may include phenology of seasonal coat col-
our moult confronting decreased snow pack, especially
in the southern part of the range (Mills et al. 2013).
Concomitant with the predominantly southern distri-
bution of ESUs and sublineages, a large proportion of
snowshoe hares’ neutral private allelic richness (PAR)
occurs in the U.S. Rockies and Greater Pacific North-
west, where isolation and relative stability over
evolutionary time were likely responsible for their accu-
mulation of mutations and unique genetic structure. On
average, populations in the U.S. Rockies and Greater
Pacific Northwest lineages had almost twice the PAR of
populations in the Boreal lineage. In contrast to the
highly connected Boreal populations, loss of a popula-
tion in the U.S. Rockies and Greater Pacific Northwest
lineages could mean complete loss of many unique
alleles. At neutral markers, this loss would not be a
major conservation concern, but it portends an analo-
gous loss of diversity at evolutionarily significant loci.
The high genetic structure and uniqueness in the
southern range of the snowshoe hare reflect a common
phylogeographic pattern among North American spe-
cies. Regional comparative studies emphasize that the
Pacific Northwest and U.S. Rockies are hotspots of
genetic diversity for many species (Soltis et al. 1997;
Swenson & Howard 2005; Shafer et al. 2010a). Although
there are few rangewide studies for boreal species, they
typically corroborate the cryptic genetic distinctiveness
of these southern populations in the context of the spe-
cies’ entire North American range (Wooding & Ward
1997; Arbogast 1999; Arbogast & Kenagy 2001; Klicka
et al. 2011; van Els et al. 2012). Collectively, these find-
ings support Hampe and Petit’s (2005) call for prioritiz-
ing conservation of southern edge populations of boreal
species.
For snowshoe hares and many other boreal species in
North America, southern populations may already be
losing genetic diversity due to anthropogenic change
such as habitat fragmentation (desert bighorn sheep,
Ovis canadensis nelsoni; Epps et al. 2005) and climate
change (alpine chipmunk, Tamias alpinus; Rubidge et al.
2012). The range of snowshoe hares has contracted
northward throughout the previous century, primarily
related to habitat loss and conversion, with potential
contributions from harvest and climate change (Hodges
2000; NatureServe 2014). Populations in West Virginia,
North Carolina, Tennessee and Virginia have declined.
Snowshoe hares are extirpated from Ohio, New Jersey
and North Carolina and possibly extirpated from Mary-
land (NatureServe 2014). They are listed as critically
imperilled (S1) in Virginia, imperilled (S2) in New Mex-
ico and vulnerable (S3) in Pennsylvania, Utah and
Nevada. In California, the subspecies L. a. tahoensis is a
state-listed Species of Special Concern.
In the face of certain climate change with uncertain
impacts, it is difficult to predict how species conserva-
tion efforts can best be prioritized to maximize long-
term persistence. Although we cannot anticipate the
unforeseen, we can use our understanding of the pres-
ent to heed the advice of geneticist Otto Frankel (1974)
that ‘at this point of decision-making it may be our evo-
lutionary responsibility to keep evolutionary options
open so far as we can’. Using historical processes as a
guide, an emphasis on conserving southern edge popu-
lations seems prudent for this strongly interacting prey
species.
Acknowledgements
We thank the Canadian and U.S. hunting and trapping com-
munity, agency biologists, university researchers and private
citizens for donating more than 1000 snowshoe hare and black-
tailed jackrabbit genetic samples for this study. We are espe-
cially grateful to N. Berg, S. Carriere, J. Ivan, H. Jolicoeur, J.
MacCracken, B. McIntosh and P. Zevit for their efforts to fill in
critical sampling gaps. Biologists with the U.S. Forest Service
and state agencies provided invaluable help with permitting
and field logistics. Special thanks to D. Wager, J. Wager, C.
Brown and M. Strauser for their dedicated assistance in the
field and laboratory. This work was funded by the National
Science Foundation Grant 0817078, Natural Sciences and Engi-
neering Research Council (Canada), U.S. National Park Service,
and University of Montana, the Portuguese Fundac~ao para a
Ciencia e a Tecnologia (FCT) and the FEDER European Social
Fund (PTDC/BIA-EVF/115069/2009). J.M.-F. and PCA were
funded by Portuguese Foundation for Science and Technology
grants (SFRH/BPD/43264/2008 and SFRH/BSAB/1278/2012,
respectively, cofunded by the European Social Fund) and
Luso-American Development Foundation (FLAD).
References
Alves PC, Ferrand N, Suchentrunk F, Harris DJ (2003) Ancient
introgression of Lepus timidus mtDNA into L. granatensis and
L. europaeus in the Iberian Peninsula. Molecular Phylogenetics
and Evolution, 27, 70–80.
Alves PC, Melo-Ferreira J, Branco M et al. (2008) Evidence for
genetic similarity of two allopatric European hares (Lepus
© 2014 John Wiley & Sons Ltd
SNOWSHOE HARE LANDSCAPE GENETICS AND CONSERVATION 2939

corsicanus and L-castroviejoi) inferred from nuclear DNA
sequences. Molecular Phylogenetics and Evolution, 46, 1191–1197.
Arbogast BS (1999) Mitochondrial DNA phylogeography of
the new world flying squirrels (Glaucomys): implications
for pleistocene biogeography. Journal of Mammalogy, 80, 142–155.
Arbogast BS, Kenagy GJ (2001) Comparative phylogeography
as an integrative approach to historical biogeography. Journal
of Biogeography, 28, 819–825.Baker AJ, Marshall HD (1997) Mitochondrial control region
sequences as tools for understanding evolution. In: Avian
Molecular Evolution and Systematics (ed. Mindell DP), pp. 51–
82. Academic Press, San Diego, California.
Benjamini Y, Hochberg Y (1995) Controlling the false discovery
rate: a practical and powerful approach to multiple testing.
Journal of the Royal Statistical Society, Series B, 57, 289–300.
Brown WM, George JM, Wilson AC (1979) Rapid evolution of
animal mitochondrial DNA. Proceedings of the National Acad-
emy of Sciences, USA, 76, 1967–1971.Burton C, Krebs CJ, Taylor EB (2002) Population genetic struc-
ture of the cyclic snowshoe hare (Lepus americanus) in south-
western Yukon, Canada. Molecular Ecology, 11, 1689–1701.
Coulon A, Fitzpatrick JW, Bowman R et al. (2008) Congruent
population structure inferred from dispersal behaviour and
intensive genetic surveys of the threatened Florida scrub-jay
(Aphelocoma coerulescens). Molecular Ecology, 17, 1685–1701.
Dalquest WW (1942) Geographic variation in northwestern
snowshoe hares. Journal of Mammalogy, 23, 166–183.Darriba D, Taboada GL, Doallo R, Posada D (2012) jModelTest
2: more models, new heuristics and parallel computing. Nat-
ure Methods, 9, 772.
Daubenmire R (1975) Floristic Plant Geography of Eastern Wash-
ington and Northern Idaho. Brigham Young University Press,
Provo, Utah.
Drummond AJ, Suchard MA (2010) Bayesian random local
clocks, or one rate to rule them all. BMC Biology, 8, 114.
Drummond AJ, Rambaut A, Shapiro B, Pybus OG (2005)
Bayesian coalescent inference of past population dynamics
from molecular sequences. Molecular Biology and Evolution,
22, 1185–1192.Drummond AJ, Suchard MA, Xie D, Rambaut A (2012) Bayes-
ian phylogenetics with BEAUti and the BEAST 1.7. Molecular
Biology and Evolution, 29, 1969–1973.
Dupanloup I, Schneider S, Excoffier L (2002) A simulated
annealing approach to define the genetic structure of popula-
tions. Molecular Ecology, 11, 2571–2581.Earl DA, vonHoldt BM (2011) STRUCTURE HARVESTER: a
website and program for visualizing STRUCTURE output
and implementing the Evanno method. Conservation Genetics
Resources, 4, 359–361.Eckert CG, Samis KE, Lougheed SC (2008) Genetic variation
across species’ geographical ranges: the central-marginal
hypothesis and beyond. Molecular Ecology, 17, 1170–1188.
Ehrich D, Yoccoz NG, Ims RA (2009) Multi-annual density
fluctuations and habitat size enhance genetic variability in
two northern voles. Oikos, 118, 1441–1452.van Els P, Cicero C, Klicka J (2012) High latitudes and high
genetic diversity: phylogeography of a widespread boreal
bird, the gray jay (Perisoreus canadensis). Molecular Phylogenet-
ics and Evolution, 63, 456–465.
Epps CW, Palsboll PJ, Wehausen JD et al. (2005) Highways
block gene flow and cause a rapid decline in genetic diver-
sity of desert bighorn sheep. Ecology Letters, 8, 1029–1038.
Evanno G, Regnaut S, Goudet J (2005) Detecting the number of
clusters of individuals using the software STRUCTURE: a
simulation study. Molecular Ecology, 14, 2611–2620.Excoffier L, Laval G, Schneider S (2005) Arlequin ver. 3.0: An
integrated software package for population genetics data
analysis. Evolutionary Bioinformatics Online, 1, 47–50.
FAUNMAP Working Group (1994) FAUNMAP: a database
documenting late Quaternary distributions of mammal spe-
cies in the United States. Illinois State Museum Scientific
Papers, 25, 1–690.
Frankel OH (1974) Genetic conservation: our evolutionary
responsibility. Genetics, 48, 53–65.
Funk WC, McKay JK, Hohenlohe PA, Allendorf FW (2012)
Harnessing genomics for delineating conservation units.
Trends in Ecology & Evolution, 27, 489–496.Gillis EA, Krebs CJ (1999) Natal dispersal of snowshoe hares
during a cyclic population increase. Journal of Mammalogy,
80, 933–939.
Godbout J, Beaulieu J, Bousquet J (2010) Phylogeographic
structure of jack pine (Pinus banksiana; Pinaceae) supports
the existence of a coastal glacial refugium in northeastern
North America. American Journal of Botany, 97, 1903–1912.
Gomez A, Lunt DH (2007) Refugia within refugia: patterns of
phylogeographic concordance in the Iberian Peninsula. In:
Phylogeography in Southern European Refugia: Evolutionary Per-
spectives on the Origins and Conservation of European Biodiver-
sity (eds Weiss S, Ferrand N), pp. 155–188. Kluwer Academic
Publishers, Dordrecht, The Netherlands.
de Guia APO, Saitoh T (2007) The gap between the concept
and definitions in the Evolutionarily Significant Unit: the
need to integrate neutral genetic variation and adaptive vari-
ation. Ecological Research, 22, 604–612.Guillot G (2008) Inference of structure in subdivided popula-
tions at low levels of genetic differentiation. The correlated
allele frequencies model revisited. Bioinformatics, 24, 2222–
2228.
Guillot G, Mortier F, Estoup A (2005) Geneland: a program for
landscape genetics. Molecular Ecology Notes, 5, 712–715.Hampe A, Petit RJ (2005) Conserving biodiversity under climate
change: the rear edge matters. Ecology Letters, 8, 461–467.Hansen MC, Stehman SV, Potapov PV (2010) Quantification of
global gross forest cover loss. Proceedings of the National Acad-
emy of Sciences, USA, 107, 8650–8655.
Hewitt GM (1996) Some genetic consequences of ice ages, and
their role in divergence and speciation. Biological Journal of
the Linnean Society, 58, 247–276.Hewitt GM (2000) The genetic legacy of the Quaternary ice
ages. Nature, 405, 907–913.Hodges KE (2000) Ecology of snowshoe hares in southern bor-
eal and montane forests. In: Ecology and Conservation of Lynx
in the United States (eds Ruggiero LF, Aubry KB, Buskirk SW
et al.), pp. 163–206. University Press of Colorado, Boulder.
IPCC (2007) Climate Change 2007: Impacts, Adaptation, and
Vulnerability. Cambridge University Press, Cambridge, UK.
Johnson PCD, Haydon DT (2007) Maximum-likelihood estima-
tion of allelic dropout and false allele error rates from
microsatellite genotypes in the absence of reference data.
Genetics, 175, 827–842.
© 2014 John Wiley & Sons Ltd
2940 E. CHENG ET AL.
Kalinowski ST (2005) HP-RARE 1.0: a computer program for
performing rarefaction on measures of allelic richness. Molec-
ular Ecology Notes, 5, 187–189.
Klicka J, Spellman GM, Winker K, Chua V, Smith BT (2011) A
phylogeographic and population genetic analysis of a wide-
spread, sedentary North American bird: the hairy wood-
pecker (Picoides villosus). The Auk, 128, 346–362.
Korstanje R, Gillissen GF, Versteeg SA et al. (2003) Mapping of
rabbit microsatellite markers using chromosome-specific
libraries. Journal of Heredity, 94, 161–169.Koven CD (2013) Boreal carbon loss due to poleward shift in
low-carbon ecosystems. Nature Geoscience, 6, 452–456.Krebs CJ, Boonstra R, Boutin S, Sinclair ARE (2001) What drives
the 10-year cycle of snowshoe hares? BioScience, 51, 25–35.Librado P, Rozas J (2009) DnaSP v5: a software for comprehen-
sive analysis of DNA polymorphism data. Bioinformatics, 25,
1451–1452.
Mantel N (1967) The detection of disease clustering and a gen-
eralized regression approach. Cancer Research, 27, 209–220.
Matthee CA, van Vuuren BJ, Bell D, Robinson TJ (2004) A
molecular supermatrix of the rabbits and hares (Leporidae)
allows for the identification of five intercontinental exchanges
during the Miocene. Systematic Biology, 53, 433–447.
Meirmans PG (2012) The trouble with isolation by distance.
Molecular Ecology, 21, 2839–2846.
Melo-Ferreira J, Boursot P, Suchentrunk F, Ferrand N, Alves
PC (2005) Invasion from the cold past: extensive introgres-
sion of mountain hare (Lepus timidus) mitochondrial DNA
into three other hare species in northern Iberia. Molecular
Ecology, 14, 2459–2464.
Melo-Ferreira J, Boursot P, Randi E et al. (2007) The rise and
fall of the mountain hare (Lepus timidus) during Pleistocene
glaciations: expansion and retreat with hybridization in the
Iberian Peninsula. Molecular Ecology, 16, 605–618.
Melo-Ferreira J, Boursot P, Carneiro M et al. (2012) Recurrent
introgression of mitochondrial DNA among hares (Lepus
spp.) reveated by species-tree inference and coalescent simu-
lations. Systematic Biology, 61, 367–381.
Mills LS, Zimova M, Oyler J et al. (2013) Camouflage mismatch
in seasonal coat color due to decreased snow duration. Pro-
ceedings of the National Academy of Sciences, USA, 110, 7360–7365.
Moore WS (1995) Inferring phylogenies from mtDNA variation:
mitochondrial-gene trees versus nuclear-gene trees. Evolution,
49, 718–726.Moritz C (1994) Defining evolutionarily significant units for
conservation. Trends in Ecology & Evolution, 9, 373–375.Moritz C, Patton JL, Conroy CJ et al. (2008) Impact of a century
of climate change on small-mammal communities in Yosem-
ite National Park, USA. Science, 322, 261–322.
Mougel F, Mounolou JC, Monnerot M (1997) Nine polymorphic
microsatellite loci in the rabbit, Oryctolagus cuniculus. Animal
Genetics, 28, 58–71.NatureServe (2014) NatureServe Explorer: An Online Encyclopedia
of Life [web Application[. Version 7.1. NatureServe, Arlington,
Virginia. http://explorer.natureserve.org
Nei M (1972) Genetic distance between populations. The Ameri-
can Naturalist, 106, 283–292.
Nei M (1978) Estimation of average heterozygosity and genetic
distance from a small number of individuals. Genetics, 89,
583–590.
van Oosterhout C, Hutchinson WP, Wills DPM, Shipley P
(2004) MICRO-CHECKER: software for identifying and cor-
recting genotyping errors in microsatellite data. Molecular
Ecology Notes, 4, 535–538.Peakall R, Smouse PE (2006) GENALEX 6: genetic analysis in
Excel. Population genetic software for teaching and research.
Molecular Ecology Notes, 6, 288–295.
Pielou EC (1991) After the Ice Age: The Return of Life to Glaci-
ated North America. University of Chicago Press, Chicago,
Illinois.
Pierpaoli M, Riga F, Trocchi V, Randi E (1999) Species distinc-
tion and evolutionary relationships of the Italian hare (Lepus
corsicanus) as described by mitochondrial DNA sequencing.
Molecular Ecology, 8, 1805–1817.Powers RP, Coops NC, Morgan JL et al. (2012) A remote sens-
ing approach to biodiversity assessment and regionalization
of the Canadian boreal forest. Progress in Physical Geography,
37, 36–62.Pritchard JK, Stephens M, Donnelly P (2000) Inference of popu-
lation structure using multilocus genotype data. Genetics,
155, 945–959.
Provan J, Bennett KD (2008) Phylogeographic insights into cryp-
tic glacial refugia. Trends in Ecology & Evolution, 23, 564–571.
Raymond M, Rousset F (1995) An exact test for population dif-
ferentiation. Evolution, 49, 1283–1286.
Rico C, Rico I, Webb N, Smith DB, Hewitt G (1994) Four poly-
morphic microsatellite loci for the European wild rabbit,
Oryctolagus cuniculus. Animal Genetics, 25, 367.
Rousset F (1997) Genetic differentiation and estimation of gene
flow from F-statistics under isolation by distance. Genetics,
145, 1219–1228.Rousset F (2008) Genepop’007: a complete reimplementation of
the Genepop software for Windows and Linux. Molecular
Ecology Resources, 8, 103–106.
Rubidge EM, Patton JL, Lim M et al. (2012) Climate-induced
range contraction drives genetic erosion in an alpine mam-
mal. Nature Climate Change, 2, 285–288.Ryder OA (1986) Species conservation and systematics: the
dilemma of the subspecies. Trends in Ecology & Evolution, 1,
9–10.
Schwartz MK, Mills LM, Ortega Y, Ruggiero LF, Allendorf FW
(2003) Landscape location affects genetic variation of Canada
lynx (Lynx canadensis). Molecular Ecology, 12, 1807–1816.Schwartz MK, Pilgrim KL, McKelvey KS, Rivera PT, Ruggiero
LF (2007) DNA markers for identifying individual snowshoe
hares using field-collected pellets. Northwest Science, 81, 316–
322.
Shafer ABA, Cote SD, Coltman DW (2010a) Hot spots of
genetic diversity descended from multiple Pleistocene refu-
gia in an alpine ungulate. Evolution, 65, 125–138.
Shafer ABA, Cullingham CI, Cote SD, Coltman DW (2010b) Of
glaciers and refugia: a decade of study sheds new light on
the phylogeography of northwestern North America. Molecu-
lar Ecology, 19, 4589–4621.
Shugart HH, Leemans R, Bonan GB (2005) A Systems Analysis
of the Global Boreal Forest, pp. 565. Cambridge University
Press, Cambridge.
Soltis DE, Gitzendanner MA, Strenge DD, Soltis PS (1997)
Chloroplast DNA intraspecific phylogeography of plants
from the Pacific Northwest of North America. Plant Systemat-
ics and Evolution, 206, 353–373.
© 2014 John Wiley & Sons Ltd
SNOWSHOE HARE LANDSCAPE GENETICS AND CONSERVATION 2941

Soltis DE, Morris AB, McLachlan JS, Manos PS, Soltis PS (2006)
Comparative phylogeography of unglaciated eastern North
America. Molecular Ecology, 15, 4261–4293.
Strimmer K (2008) fdrtool: a versatile R package for estimating
local and tail area-based false discovery rates. Bioinformatics,
24, 1461–1462.Surridge AK, Bell DJ, Rico C, Hewitt GM (1997) Polymorphic
microsatellite loci in the European rabbit (Oryctolagus cunicu-
lus) are also amplified in other lagomorph species. Animal
Genetics, 28, 302–305.Swenson NG, Howard DJ (2005) Clustering of contact zones,
hybrid zones, and phylogeographic breaks in North Amer-
ica. American Naturalist, 166, 581–591.
Tracy LN, Jamieson IG (2011) Historic DNA reveals contempo-
rary population structure results from anthropogenic effects,
not pre-fragmentation patterns. Conservation Genetics, 12,
517–526.
Vigilant L, Stoneking M, Harpending H, Hawkes K, Wilson
AC (1991) African populations and the evolution of human
mitochondrial DNA. Science, 253, 1503–1507.Vogler AP, DeSalle R (1994) Diagnosing units of conservation
management. Conservation Biology, 8, 354–363.Weir BS, Cockerham CC (1984) Estimating F-statistics for the
analysis population structure. Evolution, 38, 1358–1370.Williams MAJ, Dunkerley DL, De DP, Kershaw AP, Stokes T
(1993) Quaternary Environments. Edward Arnold, New York.
Wooding S, Ward R (1997) Phylogeography and Pleistocene
evolution in the North American black bear. Molecular Biol-
ogy and Evolution, 14, 1096–1105.
E.C., L.S.M. and K.E.H. designed the research; E.C. con-
ducted field sampling and laboratory work; L.S.M. and
K.E.H. contributed some hare genetic samples; P.C.A.
and J.M.F. provided laboratory training and assistance;
E.C. and J.M.F. analysed data and wrote this work with
direction, assistance and editorial review from L.S.M.,
K.E.H. and P.C.A.
Data accessibility
All Cytb and CR sequences from this project have been
deposited in GenBank (Accession nos KF781351–
KF781437; KF804153–KF805042; HM771306–HM771308).
Sample details, sequence alignments, microsatellite geno-
types, and input files have been deposited in the Dryad
DigitalRepository (Conservation implicationsof theevolu-
tionary history and genetic diversity hotspots of the snow-
shoehare.http://dx.doi.org/10.5061/dryad.dh63p).
Supporting information
Additional supporting information may be found in the online
version of this article.
Appendix S1 Sources of genetic samples analysed in this
study.
Appendix S2 Microsatellite loci diversity.
Appendix S3 DNA extraction and genotyping methods.
Appendix S4 STRUCTURE hierarchical analysis results under
a model of admixture and uncorrelated allele frequencies.
Appendix S5 Analysis of the Boreal cluster in the second
round of STRUCTURE hierarchical analysis.
Appendix S6 Highest mean posterior density Geneland results
for a model with uncorrelated allele frequencies and null
alleles filtered.
Appendix S7 Pairwise FST and Nei’s D calculated across eight
microsatellite loci.
Appendix S8 Population allelic richness plotted against lati-
tude and longitude.
Appendix S9 Mitochondrial control region median-joining net-
work.
Appendix S10 Mitochondrial control region pairwise FST.
Appendix S11 Mitochondrial control region diversity statistics.
Appendix S12 Haplotype diversity plotted against latitude and
longitude.
Appendix S13 Nucleotide diversity plotted against latitude
and longitude.
© 2014 John Wiley & Sons Ltd
2942 E. CHENG ET AL.