smoky hill/saline river basin total maximum daily load · 2012-02-07 · neosho river basin total...
TRANSCRIPT

NEOSHO RIVER BASIN TOTAL MAXIMUM DAILY LOAD
Water Body/Assessment Unit: Spring River Watershed, including Shoal Creek, Short Creek, Shawnee Creek, Turkey Creek and Center Creek
Water Quality Impairment: Metals (Lead, Zinc, Copper & Cadmium) 1. INTRODUCTION AND PROBLEM IDENTIFICATION Subbasin: Spring County: Cherokee HUC 8: 11070207 Ecoregion: Ozark Highlands; Springfield Plateau (39a) Drainage Area: Approximately 2830 square miles from Oklahoma Stateline, of which about 520
square miles lie in Kansas and balance is in Missouri. Drainage between Baxter Springs and Crestline is about 1100 square miles.
Water Quality Limited Segments on Spring River: 1, 3, 4, 19 Water Quality Limited Segments on Tributaries: 2, 881, 17, 22, 18, 23 Watershed Hierarchy of Main Stem and Tributary Segments Monitored by KDHE Stations (Figure 1)
HUC 8 11070207 – Spring River Watershed: Spring River at Baxter Springs Station 213 Spring River (1) Willow Creek (20) Brush Creek (23) Station 212 Shoal Creek (2) Unnamed Trib (886) Spring River (3)
Station 569 Shawnee Creek (17) Little Shawnee Creek (22) Station 570 Short Creek (881) Spring River (4) Station 211 Turkey Creek (18) Spring River (19) Station 210 Center Creek Station 568 Spring River nr Crestline (6)
1

Designated Uses of Impaired Streams: Spring River Exceptional State Water, Special Aquatic Life
Support, Primary C Recreation, Domestic Water Supply, Food Procurement; Groundwater Recharge, Industrial Water Supply, Irrigation; Livestock Watering. Shoal Creek same; Turkey Creek same, except General Purpose Water instead of Exceptional State Water
Expected Aquatic Life Support, Secondary b Recreation & Food Procurement on Shawnee Creek, Little Shawnee Creek, Willow Creek & Brush Creek and Short Creek same, except no Food Procurement
1998 & 2002 303(d) Listings: Neosho River Basin Streams and Biological Impairment Impaired Use: Chronic and Acute Aquatic Life Support Water Quality Standard: Agricultural water supply use. The water quality criteria for irrigation and
livestock watering set forth in table 1a …shall not be exceeded outside of mixing zones due to artificial sources of pollution. (K.A.R.28-16-28e(c)(1)).
(Table 1) Domestic water supply use. …criteria listed in table 1a …for domestic water
supply use shall not be exceeded at any point of domestic water supply diversion. (K.A.R. 28-16-28e(c)(3)(A)). (Table 1)
Food procurement use. Criteria listed in table 1a …for food procurement use
shall not be exceeded outside of a mixing zone due to any artificial source of pollution. (K.A.R. 28-16-28e( c)(4)(A). (Table 1)
Aquatic life support use. Acute criteria for the aquatic life support use
specified in tables 1a, 1b … shall apply beyond the zone of initial dilution. Chronic criteria for the aquatic life support use given in tables 1a, 1b, … shall apply beyond the mixing zone. (K.A.R. 28-16-28e( c)(2)(F)(ii). (Table 2)
Table 1: Metal Criteria from Table 1a of Kansas Surface Water Quality Standards
Metal Livestock Irrigation Food Procurement Domestic Water Supply
Total Cadmium 0.020 mg/l 0.01 mg/l 0.17 mg/l 0.005 mg/l Total Copper 0.50 mg/l 0.20 mg/l NA 1.3 mg/l Total Lead 0.10 mg/l 5.0 mg/l NA 0.015 mg/l Total Zinc 25.0 mg/l 2.0 mg/l NA NA
2
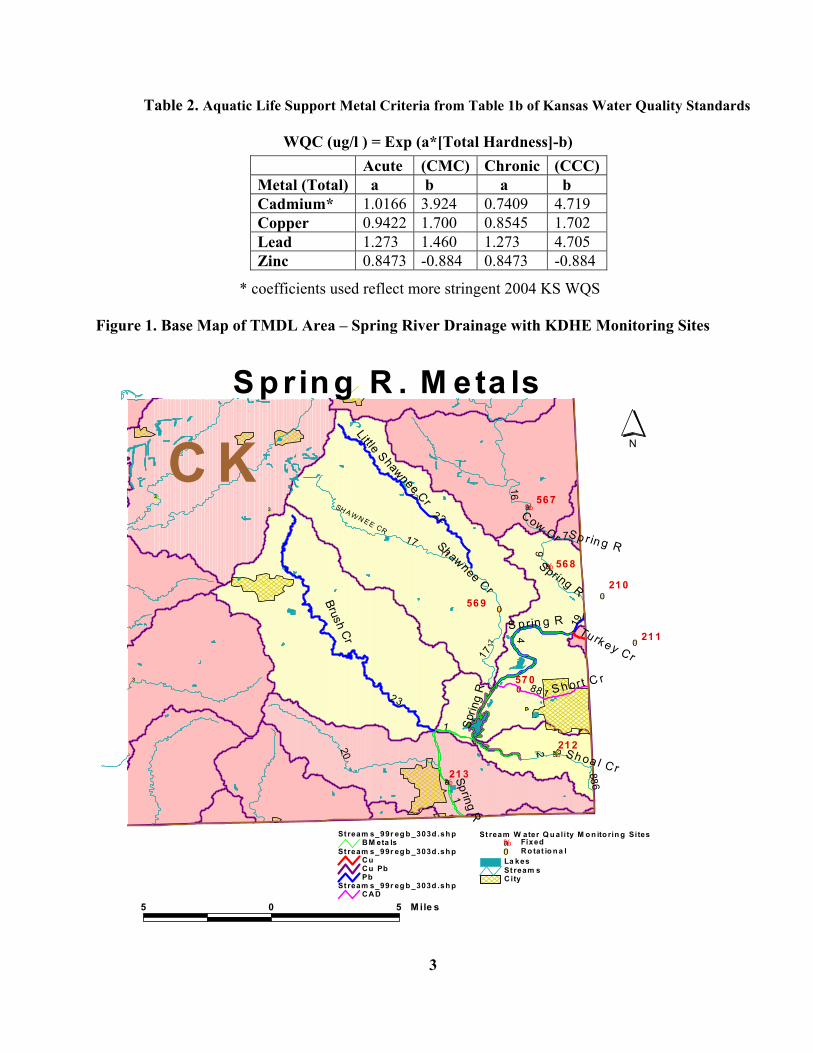
Table 2. Aquatic Life Support Metal Criteria from Table 1b of Kansas Water Quality Standards WQC (ug/l ) = Exp (a*[Total Hardness]-b) Acute (CMC) Chronic (CCC)
Metal (Total) a b a b Cadmium* 1.0166 3.924 0.7409 4.719 Copper 0.9422 1.700 0.8545 1.702 Lead 1.273 1.460 1.273 4.705 Zinc 0.8473 -0.884 0.8473 -0.884
* coefficients used reflect more stringent 2004 KS WQS
Figure 1. Base Map of TMDL Area – Spring River Drainage with KDHE Monitoring Sites
#0
#0
%a
%a
%a
#0
#0
#³
#³
#³
#³
#³
C K
S h or t C r
SH A W N E E CR
22
17
17
Lit tle S haw nee C rSh aw nee C r
Brus h Cr
Sp rin g R
Spr
i ng
R
S p r in g RTu rk e y C r
C ow C r
Spring R
Sp r in g R
Sh oa l C r
1
1
23
2
6
16
17
22
1 720
7
19
4
88 1
88 6
5 0 5 M ile s
N
S pring R . M eta ls
CitySt ream sLa kes
St ream W ater Q u ali ty M o n ito rin g Sites%a Fixed#0 Ro tat io n a l
St ream s_99r eg b _303d .sh pCAD
St ream s_99r eg b _303d .sh pCuCu PbPb
St ream s_99r eg b _303d .sh pBM eta ls
%a
56 7
21 0
21 1
56 8
56 9
57 0
21 2
21 3
3

2. CURRENT WATER QUALITY CONDITION AND DESIRED ENDPOINT Level of Support for Designated Use under 2002 303(d): Not Supporting Domestic Water and Partially Supporting Aquatic Life Streamflow: Table 3 indicates the estimated flows at selected exceedance percentages as provided by a USGS study (Perry, et al, 2004). Two USGS stream gaging stations exist in the drainage at Quapaw, Oklahoma and Waco, Missouri. Current and historic stations also exist on a number of the tributaries. Some of these tributaries provide ample water to the flow seen in the Baxter Springs area, while others have little contribution. The Center Creek estimates were made from the estimated flows on reaches of the Spring River on either side of their confluence. Most of the flow at Baxter Springs comes from river’s drainage above Crestline. Major tributary flow contributors include Shoal Creek and Center Creek. Smaller amounts of flow emanate from Willow, Brush, Shawnee, Short and Turkey Creeks. Table 3. Selected Hydrology for the Spring River TMDL Area and Certain Tributaries Percent of Time Flow Exceeded Stream Drainage
Area Mean Flow
90% 75% 50% 25% 10%
Spring River at Baxter Springs
2830 sq.mi. 2060 cfs 195 cfs 348 cfs 789 cfs 1813 cfs 4112 cfs
Willow Creek 27 sq.mi. 22 cfs 0.01 cfs 0.02 cfs 1.63 cfs 7.6 cfs 10.6 cfs Brush Creek 54 sq.mi. 48 cfs 0.06 cfs 0.48 cfs 4.7 cfs 19.5 cfs 27 cfs Shoal Creek 578 sq.mi. 452 cfs 89 cfs 132 cfs 244 cfs 468 cfs 920 cfs Shawnee Creek 62 sq.mi. 54 cfs 0.09 cfs 0.89 cfs 5.7 cfs 22 cfs 31 cfs Short Creek 13.5 sq.mi. 15 cfs 0.001 cfs 0.01 cfs 1.28 cfs 6.1 cfs 8.4 cfs Turkey Creek 75 sq.mi. 70 cfs 0.11 cfs 1.1 cfs 7.2 cfs 30 cfs 41 cfs Center Creek 260 sq.mi. 230 cfs 25 cfs 45 cfs 99 cfs 220 cfs 450 cfs Spring River near Crestline
1700 sq.mi. 1125 cfs 92 cfs 168 cfs 390 cfs 911 cfs 2228 cfs
Ambient Chemistry: Long-term data are available from seven stations located within the Spring River TMDL area. Table 4 lists the stations and Tables 5-8 indicate the estimated prevailing concentrations of each metal seen at these stations under the five flow regimes. Historic data are also available at Waco and there are numerous data from Cow Creek near Lawton, both stations lying above Crestline. Table 4. KDHE Water Quality Monitoring Stations in the Spring River Drainage
4
Station Location Period of Record 213 Spring River near Baxter Springs Nov 85 to Apr 04 568 Spring River near Crestline Apr 90 to June 04 212 Shoal Creek near Galena Nov 85 to June 04 210 Center Creek near Smithfield, MO Nov 85 to Dec 90;
1994, 1998 & 2002 211 Turkey Creek near Joplin, MO Nov 85 to Dec 90;
1994, 1998 & 2002 569 Shawnee Creek near Crestline 1990; 1994; 1998; 2002570 Short Creek near Galena 1990; 1994; 1998; 2002

Table 5. Prevailing Total Lead Concentrations at Varied Flows in Spring River Drainage Flow Condition at Quapaw, OK Station Very Low Low Normal High Very High
Baxter Springs 0.0055 mg/l 0.0060 mg/l 0.0092 mg/l 0.0177 mg/l 0.1013 mg/lCrestline 0.0029 mg/l 0.0031 mg/l 0.0079 mg/l 0.0080 mg/l 0.0189 mg/lShoal Creek 0.0047 mg/l 0.0059 mg/l 0.0078 mg/l 0.0060 mg/l 0.0640 mg/lCenter Creek 0.0023 mg/l ND 0.0231 mg/l 0.0153 mg/l 0.0509 mg/lTurkey Creek 0.0028 mg/l ND 0.0110 mg/l 0.0075 mg/l 0.0626 mg/lShort Creek 0.0026 mg/l ND 0.0124 mg/l 0.0121 mg/l 0.0430 mg/lShawnee Creek ND ND 0.0099 mg/l 0.0042 mg/l 0.0122 mg/l
Station Very Low Low Normal High Very High Baxter Springs 0.0055 mg/l 0.0060 mg/l 0.0083 mg/l 0.0177 mg/l 0.1013 mg/lCrestline 0.0029 mg/l 0.0031 mg/l 0.0079 mg/l 0.0080 mg/l 0.0189 mg/lShoal Creek 0.0047 mg/l 0.0059 mg/l 0.0078 mg/l 0.0060 mg/l 0.0640 mg/lCenter Creek 0.0023 mg/l ND 0.0231 mg/l 0.0153 mg/l 0.0509 mg/lTurkey Creek 0.0028 mg/l ND 0.0110 mg/l 0.0075 mg/l 0.0626 mg/lShort Creek 0.0026 mg/l ND 0.0124 mg/l 0.0121 mg/l 0.0430 mg/lShawnee Creek ND ND 0.0099 mg/l 0.0042 mg/l 0.0122 mg/l
Table 6. Prevailing Total Zinc Concentrations at Varied Flows in Spring River Drainage Flow Condition at Quapaw, OK
Station Very Low Low Normal High Very HighBaxter Springs 0.153 mg/l 0.233 mg/l 0.230 mg/l 0.262 mg/l 0.654 mg/l Crestline 0.044 mg/l 0.055 mg/l 0.070 mg/l 0.061 mg/l 0.180 mg/l Shoal Creek 0.110 mg/l 0.126 mg/l 0.131 mg/l 0.239 mg/l 0.440 mg/l Center Creek 0.204 mg/l ND 0.495 mg/l 0.485 mg/l 0.850 mg/l Turkey Creek 0.374 mg/l ND 0.525 mg/l 0.689 mg/l 0.917 mg/l Short Creek 12.10 mg/l ND 10.93 mg/l 8.281 mg/l 2.642 mg/l Shawnee Creek ND ND 0.086 mg/l 0.065 mg/l 0.116 mg/l
Table 7. Prevailing Total Copper Concentrations at Varied Flows in Spring River Drainage Flow Condition at Quapaw, OK Station Very Low Low Normal High Very High
Baxter Springs 0.0071 mg/l 0.0105 mg/l 0.0128 mg/l 0.0120 mg/l 0.0300 mg/lCrestline 0.0149 mg/l 0.0085 mg/l 0.0140 mg/l 0.0130 mg/l 0.0285 mg/lShoal Creek 0.0055 mg/l 0.0133 mg/l 0.0108 mg/l 0.0140 mg/l 0.0126 mg/lCenter Creek 0.0014 mg/l ND 0.0149 mg/l 0.0150 mg/l 0.0180 mg/lTurkey Creek 0.0029 mg/l ND 0.0180 mg/l 0.0150 mg/l 0.0159 mg/lShort Creek 0.0055 mg/l ND 0.0150 mg/l 0.0185 mg/l 0.0220 mg/lShawnee Creek ND ND 0.0110 mg/l 0.0140 mg/l 0.0174 mg/l
5

Table 8. Prevailing Total Cadmium Concentrations at Varied Flows in Spring River Drainage Flow Condition at Quapaw, OK Station Very Low Low Normal High Very High
Baxter Springs 0.0001 mg/l 0.0008 mg/l 0.0007 mg/l 0.0004 mg/l 0.0043 mg/lCrestline 0.0001 mg/l 0.0001 mg/l 0.0002 mg/l 0.0002 mg/l 0.0008 mg/lShoal Creek 0.0001 mg/l 0.0001 mg/l 0.0003 mg/l 0.0003 mg/l 0.0028 mg/lCenter Creek 0.0001 mg/l ND 0.0020 mg/l 0.0030 mg/l 0.0071 mg/lTurkey Creek 0.0026 mg/l ND 0.0025 mg/l 0.0036 mg/l 0.0073 mg/lShort Creek 0.0685 mg/l ND 0.0595 mg/l 0.0442 mg/l 0.0210 mg/lShawnee Creek ND ND 0.0001 mg/l 0.0001 mg/l 0.0005 mg/l
Prevailing concentrations were determined from the data at each station segregated by the flow conditions seen on that date at the Spring River near Quapaw, OK USGS gaging station. The five flow classes encompassed a range of flow conditions: Very Low: 99-90% Exceedance flows represented by the 90% flow Low: 89-70% Exceedance flows represented by the 75% flow Normal: 69-30% Exceedance flows represented by the 50% flow High: 29-11% Exceedance flows represented by the 25% flow Very High: 10-1% Exceedance flows represented by the 10% flow Using this classification method accounted for any modest divergence in flow condition between streams. The prevailing concentration was defined as the upper quartile (75%) value of the station metal data with 5 or more samples. This statistic indicates the value that exceeds 75% of the data set. This accounts for the samples that had values below detection limits, but does not allow those samples to affect the calculation of the prevailing concentration. For data sets with less than 5 samples, the arithmetic average defined the prevailing concentration for the small sample sizes. This calculation was made for Center, Turkey and Short Creeks for the concentrations occurring during the very low and very high flow conditions and for Shawnee Creek for the very high flow condition. There were no water chemistry data collected for low flow conditions on Center, Turkey, Short and Shawnee Creeks, nor for very low flow conditions on Shawnee Creek. Exceedance of Criteria: Because the criteria for these metals are a function of total hardness, and because total hardness changes with flow condition, the pattern of exceedance is a function of flow. Tables 9 –12 display the total number of samples and the number of digressions for each metal at each station under each of the five flow conditions. Appendix A shows the graphs of concentrations and criteria over flow conditions at the seven stations. Note the criteria concentrations drop dramatically at the highest flows, indicating the lack of hardness in the water under runoff conditions. Generally, digressions occur at higher flows, whereas they are rare under baseflow conditions. The highest flows are typically the most impaired throughout the drainage, with a high proportion of samples exceeding the chronic criteria. Additionally, exceedances over established acute criteria are prevalent at flows exceeded less than 10% of the time.
6

Table 9. Number of Lead Digressions at Spring River Stations at Various Flow Conditions
Flow # of Samples
Spring R. at Baxter Springs
Spring R. at Crestline
Shoal Cr
Center Cr Turkey Cr Short Cr Shawnee Cr
V. Low Total 10 9 9 2 2 2 0 99-90% >Chronic 2 0 2 0 0 0 0 Exceed >Acute 0 0 0 0 0 0 0 Low Total 22 16 16 0 0 0 0 89-70% >Chronic 5 1 4 0 0 0 0 Exceed >Acute 0 0 0 0 0 0 0 Normal Total 26 23 32 13 13 10 10 69-30% >Chronic 14 4 13 11 4 5 6 Exceed >Acute 0 0 0 0 0 0 0 High Total 18 16 11 6 6 6 6 29-11% >Chronic 8 1 4 4 1 4 2 Exceed >Acute 0 0 0 0 0 0 0 V. High Total 6 5 8 2 2 1 2 10-1% >Chronic 6 5 6 2 2 1 2 Exceed >Acute 3 0 2 1 0 0 0
Table 10. Number of Zinc Digressions at Spring River Stations at Various Flow Conditions Flow # of
Samples Spring R. at Baxter Springs
Spring R. at Crestline
Shoal Cr
Center Cr Turkey Cr Short Cr Shawnee Cr
V. Low Total 11 10 10 2 2 2 0 99-90% Exceed
>Chronic /Acute
2 0 0 1 2 2 0
Low Total 22 17 16 0 0 0 0 89-70% Exceed
>Chronic/Acute
11 2 2 0 0 0 0
Normal Total 31 27 36 15 15 12 11 69-30% Exceed
>Chronic/Acute
14 3 4 14 15 12 2
High Total 19 17 15 7 7 7 7 29-11% Exceed
>Chronic/Acute
15 0 8 7 7 7 1
V. High Total 7 6 8 2 2 1 2 10-1% Exceed
>Chronic/Acute
7 5 6 2 2 1 2
7
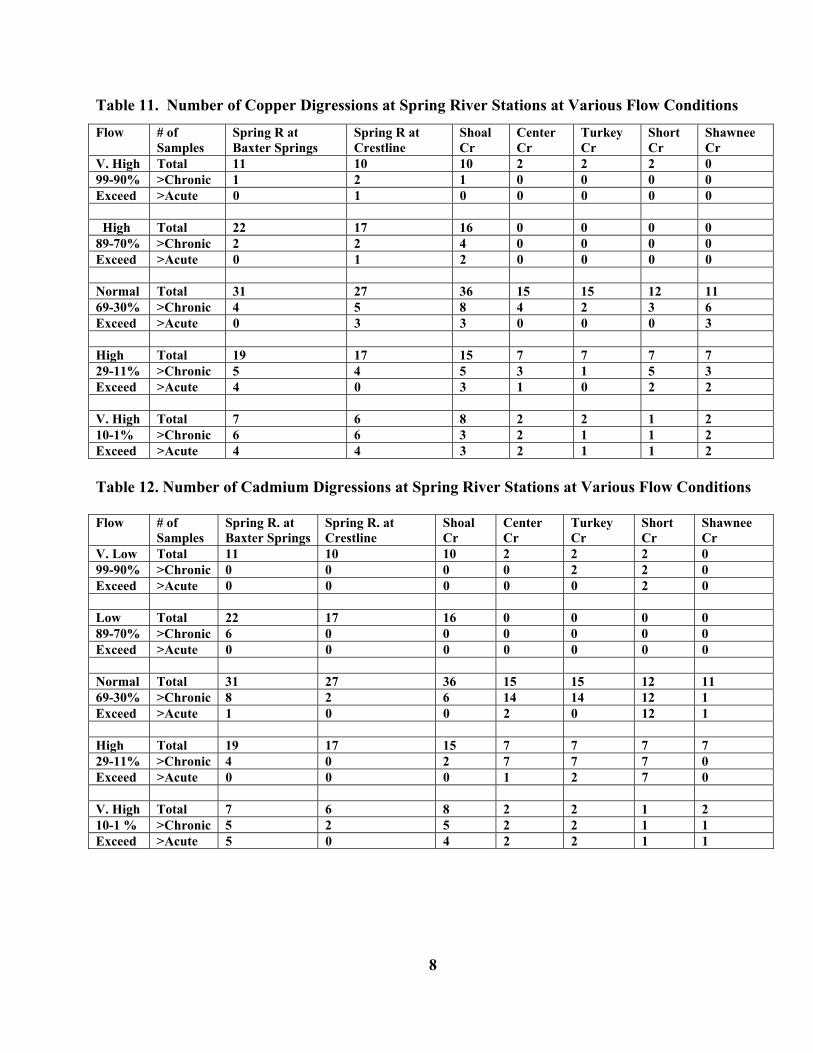
Table 11. Number of Copper Digressions at Spring River Stations at Various Flow Conditions
Flow # of Samples
Spring R at Baxter Springs
Spring R at Crestline
Shoal Cr
Center Cr
Turkey Cr
Short Cr
Shawnee Cr
V. High Total 11 10 10 2 2 2 0 99-90% >Chronic 1 2 1 0 0 0 0 Exceed >Acute 0 1 0 0 0 0 0 High Total 22 17 16 0 0 0 0 89-70% >Chronic 2 2 4 0 0 0 0 Exceed >Acute 0 1 2 0 0 0 0 Normal Total 31 27 36 15 15 12 11 69-30% >Chronic 4 5 8 4 2 3 6 Exceed >Acute 0 3 3 0 0 0 3 High Total 19 17 15 7 7 7 7 29-11% >Chronic 5 4 5 3 1 5 3 Exceed >Acute 4 0 3 1 0 2 2 V. High Total 7 6 8 2 2 1 2 10-1% >Chronic 6 6 3 2 1 1 2 Exceed >Acute 4 4 3 2 1 1 2
Table 12. Number of Cadmium Digressions at Spring River Stations at Various Flow Conditions Flow # of
Samples Spring R. at Baxter Springs
Spring R. at Crestline
Shoal Cr
Center Cr
Turkey Cr
Short Cr
Shawnee Cr
V. Low Total 11 10 10 2 2 2 0 99-90% >Chronic 0 0 0 0 2 2 0 Exceed >Acute 0 0 0 0 0 2 0 Low Total 22 17 16 0 0 0 0 89-70% >Chronic 6 0 0 0 0 0 0 Exceed >Acute 0 0 0 0 0 0 0 Normal Total 31 27 36 15 15 12 11 69-30% >Chronic 8 2 6 14 14 12 1 Exceed >Acute 1 0 0 2 0 12 1 High Total 19 17 15 7 7 7 7 29-11% >Chronic 4 0 2 7 7 7 0 Exceed >Acute 0 0 0 1 2 7 0 V. High Total 7 6 8 2 2 1 2 10-1 % >Chronic 5 2 5 2 2 1 1 Exceed >Acute 5 0 4 2 2 1 1
8

Shoal Creek, Center Creek, Short Creek and the Spring River near Baxter Springs show the most significant exceedances of lead criteria with acute violations occurring on all but Short Creek. Prevalent zinc exceedances are seen on Center Creek, Turkey Creek and Short Creek, across all flow conditions. The Baxter Springs station picks up zinc digressions at moderately low flows (75% exceedance). Copper digressions are noted for Shawnee Creek and the relatively clean site on the Spring River near Crestline. Acute copper exceedances are seen at both stations, because of low hardness. Shoal Creek and Short Creek have a high percentage of samples exceeding the copper criteria. Impairment by cadmium is significant on Center Creek, Turkey Creek and Short Creek, similar to zinc, across all flow conditions. The Spring River near Baxter Springs has at least 25% of its total samples over the chronic cadmium criteria. There were a number of samples taken from a station at Waco, Missouri over 1974-1989 before the Crestline station was established. Overall, total hardness increased between Waco and Crestline, although there was higher average hardness at Waco under very low and very high flow conditions. Of 29 samples taken at Waco, four exceeded chronic cadmium criteria (two of those exceeded acute criteria), eleven exceeded copper chronic criteria, four exceeded zinc criteria and seven exceeded lead chronic criteria. In most situations, digressions occurred at higher flows recorded at the USGS Waco gage. There were no exceedances during 2003 sampling at Waco. Biology: The macroinvertebrate community along the Spring River shows signs of impairment from the metal loading. KDHE has maintained two long-term macroinvertebrate monitoring stations on the river; one in the relatively unimpacted upstream river reach, first at Waco, then near Crestline after 1990 and the other located at Baxter Springs, monitoring the cumulative effects of upstream mine drainage. Table 13 displays the general statistics of biological indicators at the three biological monitoring stations. The Macroinvertebrate Biotic Index provides a measure of the aquatic life integrity through the composition and diversity of macroinvertebrates on the substrate of the stream. An index value of 4.5 or below is indicative of a fully supported aquatic life community, whereas, a value of 5.4 or greater indicates a condition of non-support (KDHE, 2003). Values between the two endpoints reflect partially supporting aquatic life conditions. An additional indicator, EPT, is the proportion of total species that comprise the Orders Ephemeroptera (mayflies), Plecoptera (stoneflies) and Trichoptera (caddisflies). These taxa are indicative of good quality water and a high proportion of the sample population composed of these organisms is evidence of a biological community of high integrity. As seen in Table 13, the relatively unimpaired stations at Waco and Crestline show more taxa, better MBI scores and a higher proportion of EPT than the station at Baxter Springs. Therefore, the impacts of mine drainage of metals into the tributaries and river system seem to be reflected in the stream biology of the Spring River. Field observations corroborate this impact on the tributaries, where low diversity and numbers are seen on those streams with high levels of metal concentrations. The extreme case is Short Creek, which is nearly devoid of aquatic life (Ferrington, 2000). Biological indices values between Waco and Crestline and their two respective decades of data were compared. Crestline data show improved aquatic life support with lower MBI values (4.03 vs 4.33) and higher percentages of EPT taxa (55.5% vs 47%) than seen during the 1980’s at Waco. Whether this improvement is a function of location or temporal improvement via remediation activities is unknown. Regardless, both locations indicate a strong macroinvertebrate community above the mining impact areas leading into the Spring River.
9
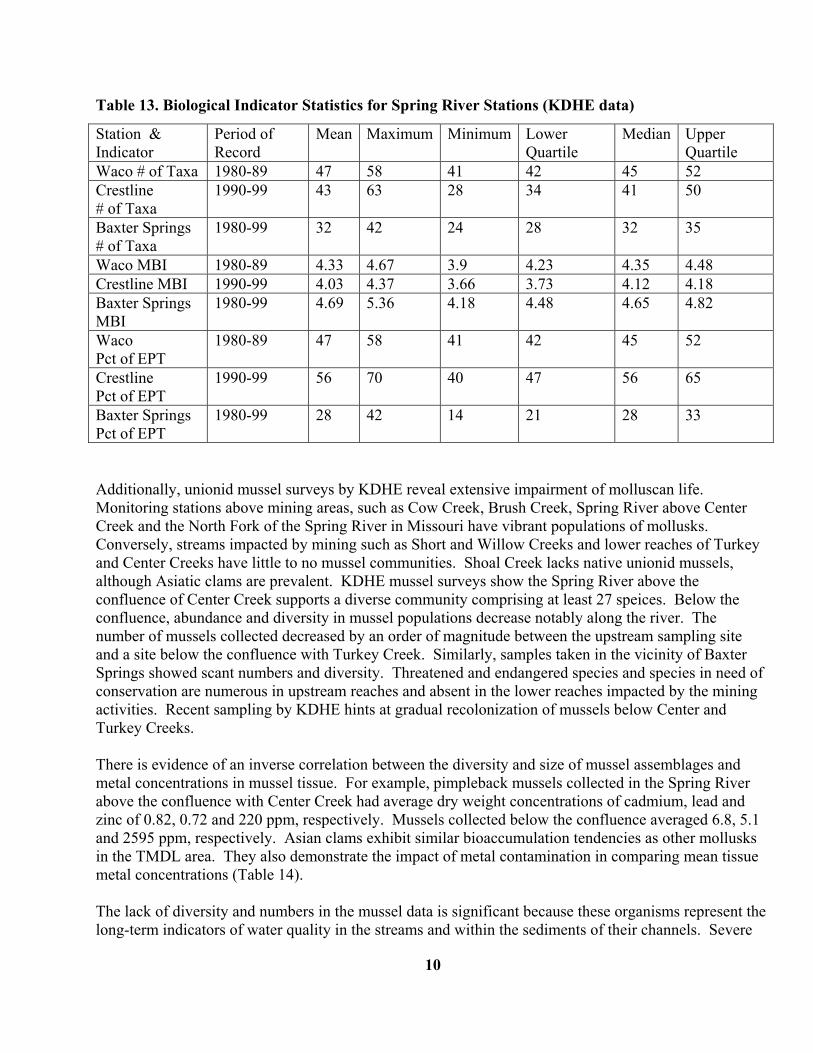
Table 13. Biological Indicator Statistics for Spring River Stations (KDHE data)
Station & Indicator
Period of Record
Mean Maximum Minimum Lower Quartile
Median Upper Quartile
Waco # of Taxa 1980-89 47 58 41 42 45 52 Crestline # of Taxa
1990-99 43 63 28 34 41 50
Baxter Springs # of Taxa
1980-99 32 42 24 28 32 35
Waco MBI 1980-89 4.33 4.67 3.9 4.23 4.35 4.48 Crestline MBI 1990-99 4.03 4.37 3.66 3.73 4.12 4.18 Baxter Springs MBI
1980-99 4.69 5.36 4.18 4.48 4.65 4.82
Waco Pct of EPT
1980-89 47 58 41 42 45 52
Crestline Pct of EPT
1990-99 56 70 40 47 56 65
Baxter Springs Pct of EPT
1980-99 28 42 14 21 28 33
Additionally, unionid mussel surveys by KDHE reveal extensive impairment of molluscan life. Monitoring stations above mining areas, such as Cow Creek, Brush Creek, Spring River above Center Creek and the North Fork of the Spring River in Missouri have vibrant populations of mollusks. Conversely, streams impacted by mining such as Short and Willow Creeks and lower reaches of Turkey and Center Creeks have little to no mussel communities. Shoal Creek lacks native unionid mussels, although Asiatic clams are prevalent. KDHE mussel surveys show the Spring River above the confluence of Center Creek supports a diverse community comprising at least 27 speices. Below the confluence, abundance and diversity in mussel populations decrease notably along the river. The number of mussels collected decreased by an order of magnitude between the upstream sampling site and a site below the confluence with Turkey Creek. Similarly, samples taken in the vicinity of Baxter Springs showed scant numbers and diversity. Threatened and endangered species and species in need of conservation are numerous in upstream reaches and absent in the lower reaches impacted by the mining activities. Recent sampling by KDHE hints at gradual recolonization of mussels below Center and Turkey Creeks. There is evidence of an inverse correlation between the diversity and size of mussel assemblages and metal concentrations in mussel tissue. For example, pimpleback mussels collected in the Spring River above the confluence with Center Creek had average dry weight concentrations of cadmium, lead and zinc of 0.82, 0.72 and 220 ppm, respectively. Mussels collected below the confluence averaged 6.8, 5.1 and 2595 ppm, respectively. Asian clams exhibit similar bioaccumulation tendencies as other mollusks in the TMDL area. They also demonstrate the impact of metal contamination in comparing mean tissue metal concentrations (Table 14). The lack of diversity and numbers in the mussel data is significant because these organisms represent the long-term indicators of water quality in the streams and within the sediments of their channels. Severe
10

impairment of aquatic life and food procurement is suggested by the depleted populations of mussels and the elevated metals in the tissues of those shellfish present in the streams. This impairment is present, in some cases, despite the lack of toxic metal concentrations in the water column. High levels of metals residing within the sediments are suspected. Ferrington (1989, 1993, 2000) has noted extremely high levels of metals within the sediments of the Spring River, Empire Lake and Short Creek. KDHE sampling of mussel tissue also indicates high metal contamination. A shellfish consumption advisory is slated to be issued by KDHE in 2005 warning of the hazards of excessive eating of mollusks collected from the Spring River and Shoal Creek drainages because of high cadmium and lead concentrations in tissues. Table 14. Mean Metal Concentrations in Composite Asian Clam Samples by Location
Location Cadmium Lead Zinc Shoal Creek Headwaters 3.9 ppm 1.4 ppm 290 ppm Shoal Creek at Schermerhorn Park 8.4 ppm 21 ppm 740 ppm Spring River below Turkey Creek 5.3 ppm ~20 ppm 1365 ppm Spring River at Baxter Springs 2.0 ppm 7.4 ppm 550 ppm
Table 15 verifies the degradation of biological integrity with the results from Analysis of Variance on the station data. Baxter Springs data were examined for the full 20 year period of record and the 1990-99 period. All biological indicators at Crestline show better quality than those at Baxter Springs, regardless of time period used. The indicators since 1990 at Baxter Springs seem to have better values than those taken on average across 1980-99, indicating that there might have been improvement in conditions in more recent times. Statistically comparing 1980-89 with 1990-99 shows no significant difference in average indicator value, except for percent of sample individuals coming from EPT (no difference in that indicator between recent Baxter Springs and Crestline), but the values are nominally improved in the more recent period, except for number of taxa. Table 15. Comparison of Average Biological Indicators at Crestline and Baxter Springs Bold Type indicates Significant ( alpha =0.10) Differences with Crestline
Indicator Crestline Baxter Springs (1980-99) Baxter Springs (1990-99)No. of Taxa 43 32 30 No. of Indiv 221 159 169 MBI 4.03 4.69 4.59 Pct of Taxa EPT 41 28 31 Pct of Indiv EPT 56 46 53
11

Figures 2 and 3 show the MBI and percent of taxa coming from EPT over time above and below the impacted areas along the river. Figure 2. MBI Values on Spring River Over Time (<4.5: Full Support; >5.4: Non-Support; 4.51-5.39: Partial Support)
MBI Scores on Spring River
3
3.5
4
4.5
5
5.5
1980
0616
1981
1012
1982
0421
1983
0727
1984
0926
1985
0417
1986
0626
1987
0923
1988
0517
1989
0807
1990
1016
1991
0417
1992
0902
1993
0825
1994
0713
1995
0810
1996
0924
1997
0509
1998
0608
1999
0812
Date
MB
I
Baxter Springs Crestline Waco
Figure 3. Percent of Taxa Belonging to Ephemeroptera, Plecoptera or Trichoptera on Spring River
EPT Taxa on Spring River
10203040506070
1980
0616
1981
1012
1982
0421
1983
0727
1984
0926
1985
0417
1986
0626
1987
0923
1988
0517
1989
0807
1990
1016
1991
0417
1992
0902
1993
0825
1994
0713
1995
0810
1996
0924
1997
0509
1998
0608
1999
0812
Date
Pct T
axa
as E
PT
Baxter Springs Crestline Waco
12

Results of Previous Synoptic Studies. The Spring River drainage has been subjected to spatially intensive, short-term monitoring on at least five occasions. KDHE conducted a high flow synoptic study in October 2001 (unpub data). Flow conditions were extremely high during the study, discharging at rates exceeded 3-4 percent of the time based on the historic records at the Waco and Quapaw gaging stations. Table 16 displays the concentrations of four metals and total hardness at various locations throughout the drainage area. Under these conditions, zinc concentrations throughout the TMDL area exceeded applicable criteria. Concentrations of lead, copper and cadmium generally surpassed chronic criteria. Exceedances of acute criteria for copper were seen on the Spring River above and below Baxter Springs, on the Spring River below Empire Lake, and on Shawnee Creek because of its low hardness. Acute criteria for cadmium were exceeded on an unnamed tributary to the Spring River in Baxter Springs, on the Spring River above Baxter Springs, below Empire Dam and on Short Creek and Center Creek. Lead concentrations did not exceed acute criteria throughout the TMDL area. KDHE also conducted a low flow synoptic study in October 2004 (unpub. data; Table 17). Flows recorded at Waco and Baxter Springs were generally exceeded 90 percent of the time. Total Hardness levels were substantially higher than those seen in the high flow study and metal concentrations were lower except zinc and cadmium on Short Creek. Concentrations did not exceed chronic criteria for the metals except on Short Creek and Turkey Creek, where zinc and cadmium levels were higher. Cadmium concentrations on the Spring Branch at Baxter Springs also exceeded chronic criteria. Otherwise, cadmium was not detected throughout the study area. The USGS conducted a synoptic sampling run throughout the Spring River drainage in August 1981 under moderate flow conditions that were exceeded 65-70 percent of the time (Spruill, 1987). Table 18 shows values of dissolved metals at selected locations that coincide with the existing KDHE network. Generally, there were low concentrations of the dissolved form of the metals in the streams, except for zinc and along Short Creek. This finding suggests that metals attached to sediments might be the primary form seen in the water column and corroborates the finding of higher concentrations at higher flows when sediment transport is significant. The National Water Quality Assessment (NAWQA) Study of the Ozark Plateau included analysis of sediment, lead and zinc in the water column, bed sediments, and fish and mussel tissue in Center Creek (Davis and Bell, 1998; Peterson, et al, 1998). Table 19 lists the concentrations of the two metals in the three media from Center Creek. Once again, there is evidence that a substantial source of metals lays within the bed sediment of the streams. Ferrington (2000, 2002) summarized findings of water quality and biological conditions on streams around Galena, including Short Creek, as the area underwent initial mining remediation efforts. Table 20 shows metal concentrations and biological metrics at three study sites around Galena. The first site is essentially a reference site located above historic mining activity. The second site is near the mouth of Short Creek and the third site is a tributary to the Shoal Creek arm of Empire Lake that was subjected to displacement of mining material during remediation activities. Sites impacted by mining activities had elevated metals and less diverse and abundant biology. Ferrington also determined there was some limited recovery of biological integrity of the surface waters after remediation and re-vegetation occurred. However, there were reported periods of transient water quality degradation during remediation activities.
13

In 1992, Ferrington (1993) analyzed the bed sediments of Short Creek at four locations. Table 21 displays the average metal concentrations found in the sediments and the corresponding biological abundance and diversity indicies at the four sites. Site One lies above the mining activity, whereas, Site Two is in Galena, Site Three lies just below Galena and Site Four is just above the confluence with the Spring River. The latter three sites show marked impacts from mining activities. In another study, Ferrington (1989) examined the occurrence of metals in sediments in and around Empire Lake. Sediments within the lake had average cadmium concentrations ranging from 6-52 ppm; average lead concentrations in the 67-284 ppm range and zinc concentrations averaging 670-4660 ppm. Table 16. Metal and Hardness Concentrations (mg/l) at KDHE Spring River Sites in October 2001 KDHE Monitoring Site Tot. Pb Tot.Zn Tot.Cu Tot.Cd Tot.Hd
Spring R. blw Baxter Springs 0.0162 0.227* 0.0082* 0.0012 55 Unnamed Trib at Baxter Springs 0.0044 7.521* 0.0068 0.0551* 215 Willow Creek 0.0123 0.551* 0.0078 BDL 92 Spring R. abv Baxter Springs 0.0204 0.254* 0.0088* 0.0014* 56 Brush Creek 0.0066 0.089* 0.0052 BDL 41 Spring below Empire Dam 0.0189 0.225* 0.0097* 0.0013* 55 Shoal Creek below Empire Dam 0.0157 0.268* 0.0072 0.0011 56 Shoal Creek below South Dam 0.0194 0.320* 0.0048 0.0013 61 Shoal Creek near Galena 0.0120 0.233* 0.0046 0.0012 97 Spring R. near Riverton 0.0122 0.207* 0.0062 BDL 51 Shawnee Creek 0.0062 0.055* 0.0050* BDL 33 Short Creek 0.0157 5.359* 0.0094 0.0240* 117 Turkey Creek 0.0176 0.518* 0.0049 0.0029 156 Center Creek 0.0308 0.770* 0.0054 0.0047* 107 Spring R. near Crestline 0.0090 0.064* 0.0076 BDL 46
KDHE Monitoring Site Tot. Pb Tot.Zn Tot.Cu Tot.Cd Tot.HdSpring R. blw Baxter Springs 0.0162 0.227* 0.0082* 0.0012 55 Unnamed Trib at Baxter Springs 0.0044 7.521* 0.0068 0.0551* 215 Willow Creek 0.0123 0.551* 0.0078 BDL 92 Spring R. abv Baxter Springs 0.0204 0.254* 0.0088* 0.0014* 56 Brush Creek 0.0066 0.089* 0.0052 BDL 41 Spring below Empire Dam 0.0189 0.225* 0.0097* 0.0013* 55 Shoal Creek below Empire Dam 0.0157 0.268* 0.0072 0.0011 56 Shoal Creek below South Dam 0.0194 0.320* 0.0048 0.0013 61 Shoal Creek near Galena 0.0120 0.233* 0.0046 0.0012 97 Spring R. near Riverton 0.0122 0.207* 0.0062 BDL 51 Shawnee Creek 0.0062 0.055* 0.0050* BDL 33 Short Creek 0.0157 5.359* 0.0094 0.0240* 117 Turkey Creek 0.0176 0.518* 0.0049 0.0029 156 Center Creek 0.0308 0.770* 0.0054 0.0047* 107 Spring R. near Crestline 0.0090 0.064* 0.0076 BDL 46
*concentration exceeds acute criterion; BDL: Below Detection Limit Table 17. Metal and Hardness Concentrations (mg/l) at KDHE Spring River Sites in October 2004 KDHE Monitoring Site Tot. Pb Tot.Zn Tot.Cu Tot.Cd Tot.Hd
Spring R. blw Baxter Springs 0.0042 0.0763 0.0031 BDL 180 Unnamed Trib at Baxter Springs 0.0029 0.2033 0.0025 0.0010* 410 Willow Creek BDL 0.0046 0.0017 BDL 897 Spring R. abv Baxter Springs 0.0045 0.0833 0.0047 BDL 180 Brush Creek No Q No Q No Q No Q No Q Spring below Empire Dam 0.0049 0.0970 0.0037 BDL 180 Shoal Creek below Empire Dam 0.0063 0.1233 0.0034 BDL 183 Shoal Creek below South Dam 0.0052 0.1100 0.0024 BDL 170 Shoal Creek near Galena 0.0013 0.0567 0.0026 BDL 170 Spring R. near Riverton 0.0031 0.657 0.0022 BDL 183 Shawnee Creek No Q No Q No Q No Q No Q Short Creek 0.0030 14.33* 0.0060 0.0753* 270 Turkey Creek 0.0031 0.263* 0.0066 0.0019* 240 Center Creek 0.0047 0.1800 0.0020 BDL 187 Spring R. near Crestline 0.0010 0.0116 0.0018 BDL 183
*concentration exceeds chronic criterion; BDL: Below Detection Limit
14

Table 18. Concentrations of Dissolved Metals at Selected Sites in Spring River Drainage in August 1981 USGS Site Pb Zn Cu Cd
Baxter Springs BDL 90 ppb 20 ppb BDL Short Creek BDL 25000 ppb 20 ppb 170 ppbTurkey Creek BDL 140 ppb BDL BDL Center Creek BDL 250 ppb BDL BDL Crestline BDL BDL BDL BDL
Table 19. Center Creek Lead and Zinc Concentrations in Various Media (USGS data,1992-1995)
Metal Water Bed Sediment Shorthead Redhorse Liver TissuePb BDL 370 ug/g 0.3 ug/g (dry weight) Zn 67-270 ppb 5600 ug/g 770 ug/g (dry weight)
Table 20. Short Creek and Shoal Creek Tributary Average (1992-2002) Metal and Biology Characteristics
Characteristic Short Crk Reference Site Mouth of Short Crk Trib to Shoal Creek ArmTot.Cadmium in water BDL 55.7 ppb 125.8 ppb Tot. Lead in water BDL BDL 524.3 ppb Tot. Zinc in water 326 ppb 8951 ppb 22236 ppb Species Richness 67 31 25 #Invertb/sq. meter 11557 2024 1548
Table 21. Sediment Metal Concentrations and Biological Characteristics on Short Creek, 1992
Characteristic Site 1-Ref Site 2 @ Galena Site 3 abv Galena Site 4 @ Spring R.Lead 164 ppb 1038 ppb 1257 ppb 1751 ppb Zinc 2843 ppb 9788 ppb 11836 ppb 28666 ppb Copper 10 ppb 156 ppb 146 ppb 203 ppb Cadmium 15 ppb 68 ppb 77 ppb 204 ppb Standing Crop 10398/m2 2364/m2 1596/m2 540/m2 Diversity Index 88 65 33 44
15

Stability of Chronic Conditions at 10% Exceedance Flows: The expected duration of the chronic criteria for metals is a four day average with a frequency of once every three years on average. Intuitively, the more stable the flow condition, the more likely that there will be stability in the metal levels seen over four consecutive days and increased likelihood that a single grab sample appropriately evaluates chronic conditions. Conversely, at high flows, there is some question whether a single sample is indicative of conditions occurring over a four-day period. This is pertinent since the majority of samples taken at flows exceeded 10 percent of the time or less were greater than the chronic criteria. In many cases, the acute criteria were exceeded as well. Over the 33 year period, 1970-2003, the desired frequency of incidents of exceedance would be 11 (11:33 ~ 1:3). If flow stability is defined as four day flows remaining within 15% of one another, there were seven stable periods around the occurrence of the upper decile (10%) flow at Quapaw; none at Waco. There were 85 stable periods around the mean annual flow, however at Quapaw; 31 at Waco. Therefore, there it may not be possible to use a grab sample taken under the very high flows exceeded 10% of the time or less to assess chronic compliance. Conversely, there is a strong suggestion that flows exceeded 20% of the time or more, such as mean annual flow, are sufficiently stable, and that a grab sample could assess chronic conditions with high confidence. While the very high flows show inherent instability, there is nothing to suggest that metal concentrations do not remain above chronic criteria for four consecutive days, either. Therefore, implementation of this TMDL will concentrate initially on achievement of acute criteria at high flows exceeded 10% of the time or less, while chronic criteria will be the focus of achievement at any lower flow conditions. Interim Endpoints for Metals on the Spring River and its Tributaries (Implied Load Capacity) The ultimate endpoint for this TMDL will be to achieve the established metals criteria for the Aquatic Life Use of the Spring River and its tributaries under the Kansas Water Quality Standards. However, because of the interdependency of the water quality criteria, total hardness and flow, the endpoints desired for the metal concentrations seen in the Spring River and tributaries will vary with flow condition. Table 22 lists the desired endpoint criteria for the four metals at the seven stream monitoring stations located in the Spring River drainage. These endpoints were determined using the 90% lower confidence limit of the mean total hardness seen at each station under the range of flows represented by the five flow categories. As noted in the above analysis of high flow stability, the acute criteria or Criterion Maximum Concentration endpoints will be the focus of achievement at flows exceeded 10% of the time or less, while the chronic criteria (Criterion Continuous Concentration) endpoints will be the focus at lower flow conditions. Additionally, because the primary designated use to be restored through implementation of this TMDL is for aquatic life support and because the best measure of the level of support for this use is the condition of the biological community, two additional initial endpoints will be used by this TMDL to determine achievement of the use. A MBI value of 4.5 or below will be expected at the Baxter Springs biological monitoring station and the percent of EPT taxa among the macroinvertebrates sampled at Baxter Springs will be 40% or more, similar to proportions seen at Waco and Crestline. Note, these biological endpoints do not assess protection to the intervening reaches of the Spring River, below the confluences of the tributaries contributing excessive loads of the metals, nor on the tributaries themselves, nor to other biological assemblages. Pending development of endpoints for mussel community recovery, the chemical criteria for chronic and acute metal concentrations on the tributaries
16

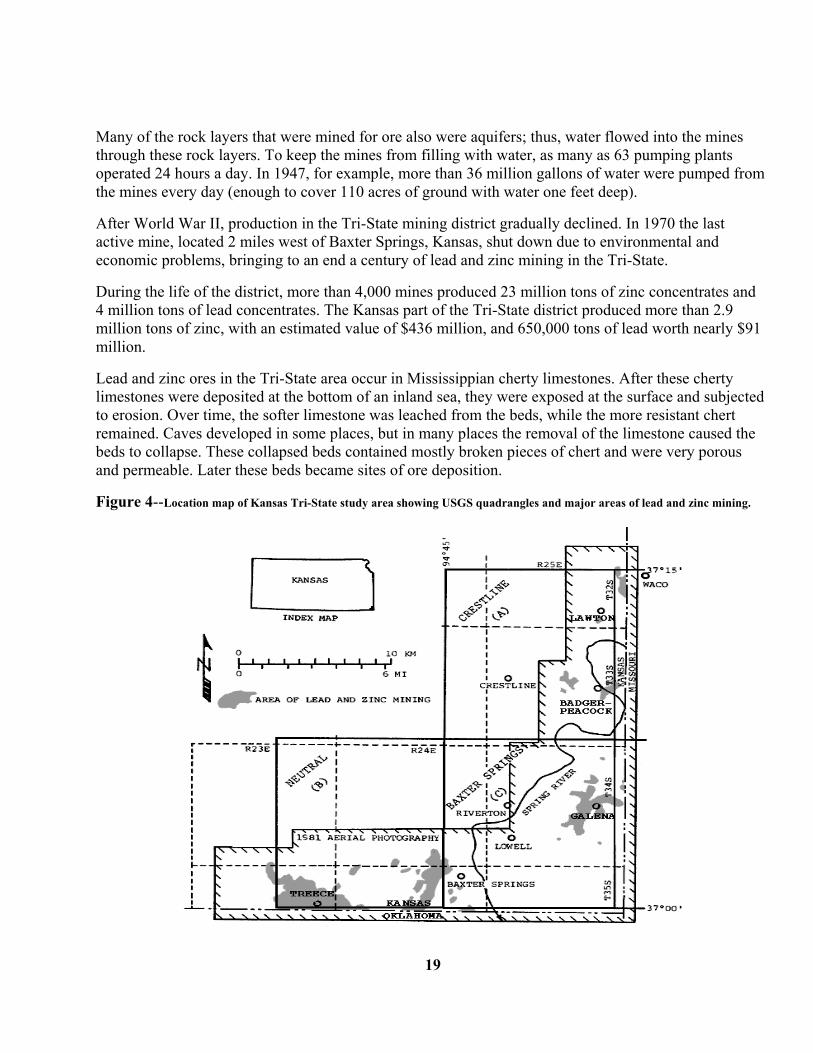
will serve as the first effort at restoring the biological integrity of these streams and the downstream reaches of the Spring River. Subsequent mussel and macroinvertebrate endpoints will be established during the next iteration of this TMDL. Achievement of the present and future endpoints of this TMDL indicates full support of the aquatic life use of the Spring River and its tributaries. Achievement of the metal criteria in the water column will be initial evidence of both existing and attainable aquatic life uses in the streams, while indications of fully supportive biological metrics will be evidence of re-establishing the existing uses in the stream system and account for the impacts of pollutants in the stream sediments. Seasonal variations are accounted by the persistent presence of elevated metal concentrations throughout the year. Furthermore, the biological data taken during the warm weather period of the macroinvertebrates’ life cycle reflect the carryover impact of previous loadings to the capacity of the stream habitat to support diverse populations of aquatic life, indicative of good water quality. Additionally, mussels live for extended number of years and serve as long-term indicators of the ecological conditions. The relationship of stream chemistry to flow conditions provides the basis for seasonal assessment through the seasonality of streamflow occurring in the Spring River and its tributaries. 3. SOURCE INVENTORY AND ASSESSMENT Geology (adapted from Kansas Geological Survey Public Information Circular 17): The 1870 discovery of zinc ore near Galena, Kansas, marked the beginning of a century of lead and zinc mining in the Kansas part of the Tri-State mining district (fig. 4). The Tri-State was one of the major lead and zinc mining areas in the world and included parts of southeastern Kansas, southwestern Missouri, and northeastern Oklahoma. Mining in the district has ceased, but for one hundred years (1850-1950), the Tri-State produced 50 percent of the zinc and 10 per-cent of the lead in the United States.
Lead and zinc deposits in Kansas occur within the region called the Ozark Plateau in extreme southeastern Cherokee County. This region is defined by outcrops of Mississippian rocks (the oldest surface rocks in the state), which formed about 345 million years ago. The Ozark Plateau covers about 55 square miles in Kansas and includes, at its western margin, the towns of Baxter Springs and Galena. Although zinc was much more common than lead throughout the Tri-State mining district, production up to 1869 was confined to lead, which could be easily smelted in homemade furnaces. Zinc production took off in the early 1870's, following the completion of railroad lines and the construction in 1873 of a coal-fired zinc smelter at Weir City, Kansas (fueled by coal from nearby mines). In much of the Tri-State, mining was done underground, using room-and-pillar methods, in which room-shaped areas are mined and similarly shaped areas are left for roof support, resulting in a checkboard-like arrangement of alternating rooms and pillars. Underground rooms had walls 25 to 100 feet high and pillars 20 to 50 feet thick. In the eastern part of the district, however, the ore was closer to the surface, and the shallow mining could be done using hand tools and a simple hoisting device that was either man- or animal-powered. Galena, Kansas, became known as a poor man's mining district because small claims could be worked by a few miners.
17

Table 22. Total Metal Criteria Endpoints (mg/l) for Spring River Stations at Various Flow Conditions Station Flow Hardness Pb CMC Pb CCC Cu CMC Cu CCC Cd CMC Cd CCC Zn Baxter Springs V.Low 167 ppm 0.1568 0.0061 0.0227 0.0145 0.0036 0.0004 0.1850Baxter Springs Low 164 ppm 0.1533 0.0060 0.0223 0.0142 0.0035 0.0004 0.1822Baxter Springs Normal 160 ppm 0.1485 0.0058 0.0218 0.0139 0.0034 0.0004 0.1784Baxter Springs High 141 ppm 0.1264 0.0049 0.0194 0.0125 0.0030 0.0003 0.1603Baxter Springs V.High 69 ppm 0.0509 0.0020 0.0099 0.0068 0.0015 0.0002 0.0875 Crestline V.Low 166 ppm 0.1556 0.0061 0.0226 0.0144 0.0036 0.0004 0.1841Crestline Low 182 ppm 0.1750 0.0068 0.0246 0.0156 0.0039 0.0004 0.1990Crestline Normal 161 ppm 0.1497 0.0058 0.0219 0.0140 0.0035 0.0004 0.1794Crestline High 138 ppm 0.1230 0.0048 0.0190 0.0123 0.0030 0.0003 0.1574Crestline V.High 58 ppm 0.0408 0.0016 0.0084 0.0059 0.0012 0.0002 0.0755 Shoal Creek V.Low 155 ppm 0.1426 0.0056 0.0212 0.0136 0.0033 0.0004 0.1737Shoal Creek Low 152 ppm 0.1391 0.0054 0.0208 0.0133 0.0033 0.0004 0.1708Shoal Creek Normal 141 ppm 0.1264 0.0049 0.0194 0.0125 0.0030 0.0003 0.1603Shoal Creek High 125 ppm 0.1085 0.0042 0.0173 0.0113 0.0027 0.0003 0.1448Shoal Creek V.High 85 ppm 0.0664 0.0026 0.0120 0.0081 0.0018 0.0002 0.1044 Center Creek V.Low 199 ppm 0.1961 0.0076 0.0268 0.0168 0.0043 0.0005 0.2147Center Creek Low 184 ppm 0.1780 0.0069 0.0249 0.0157 0.0040 0.0004 0.2013Center Creek Normal 181 ppm 0.1738 0.0068 0.0245 0.0155 0.0039 0.0004 0.1981Center Creek High 152 ppm 0.1391 0.0054 0.0208 0.0133 0.0033 0.0004 0.1708Center Creek V.High 84 ppm 0.0654 0.0025 0.0119 0.0080 0.0018 0.0002 0.1034 Turkey Creek V.Low 0.2396 0.0093 0.0311 0.0192 0.0050 0.0005 0.2453Turkey Creek Low 208 ppm 0.2074 0.0081 0.0279 0.0174 0.0045 0.0005 0.2228Turkey Creek Normal 221 ppm 0.2240 0.0087 0.0296 0.0184 0.0048 0.0005 0.2346Turkey Creek High 202 ppm 0.1998 0.0078 0.0272 0.0170 0.0044 0.0005 0.2174Turkey Creek V.High 146 ppm 0.1322 0.0052 0.0200 0.0129 0.0031 0.0005 0.1651 Short Creek V.Low 260 ppm 0.2755 0.0107 0.0344 0.0211 0.0056 0.0005 0.2692Short Creek Low 200 ppm* 0.1973 0.0077 0.0269 0.0169 0.0043 0.0005 0.2156Short Creek Normal 166 ppm 0.1556 0.0061 0.0226 0.0144 0.0036 0.0004 0.1841Short Creek High 123 ppm 0.1063 0.0041 0.0170 0.0111 0.0026 0.0003 0.1428Short Creek V.High 83 ppm 0.0644 0.0025 0.0117 0.0080 0.0018 0.0002 0.1023 Shawnee Creek V.Low 100 ppm* 0.0816 0.0032 0.0140 0.0093 0.0021 0.0003 0.1198Shawnee Creek Low 100 ppm* 0.0816 0.0032 0.0140 0.0093 0.0021 0.0003 0.1198Shawnee Creek Normal 66 ppm 0.0481 0.0019 0.0095 0.0065 0.0014 0.0002 0.0843Shawnee Creek High 68 ppm 0.0500 0.0019 0.0097 0.0067 0.0014 0.0002 0.0864Shawnee Creek V.High 40 ppm 0.0254 0.0010 0.0059 0.0043 0.0008 0.0001 0.0551
233 ppm
* Estimated Hardness Values and corresponding criteria endpoints
18
Many of the rock layers that were mined for ore also were aquifers; thus, water flowed into the mines through these rock layers. To keep the mines from filling with water, as many as 63 pumping plants operated 24 hours a day. In 1947, for example, more than 36 million gallons of water were pumped from the mines every day (enough to cover 110 acres of ground with water one feet deep).
After World War II, production in the Tri-State mining district gradually declined. In 1970 the last active mine, located 2 miles west of Baxter Springs, Kansas, shut down due to environmental and economic problems, bringing to an end a century of lead and zinc mining in the Tri-State.
During the life of the district, more than 4,000 mines produced 23 million tons of zinc concentrates and 4 million tons of lead concentrates. The Kansas part of the Tri-State district produced more than 2.9 million tons of zinc, with an estimated value of $436 million, and 650,000 tons of lead worth nearly $91 million.
Lead and zinc ores in the Tri-State area occur in Mississippian cherty limestones. After these cherty limestones were deposited at the bottom of an inland sea, they were exposed at the surface and subjected to erosion. Over time, the softer limestone was leached from the beds, while the more resistant chert remained. Caves developed in some places, but in many places the removal of the limestone caused the beds to collapse. These collapsed beds contained mostly broken pieces of chert and were very porous and permeable. Later these beds became sites of ore deposition.
Figure 4--Location map of Kansas Tri-State study area showing USGS quadrangles and major areas of lead and zinc mining.
19
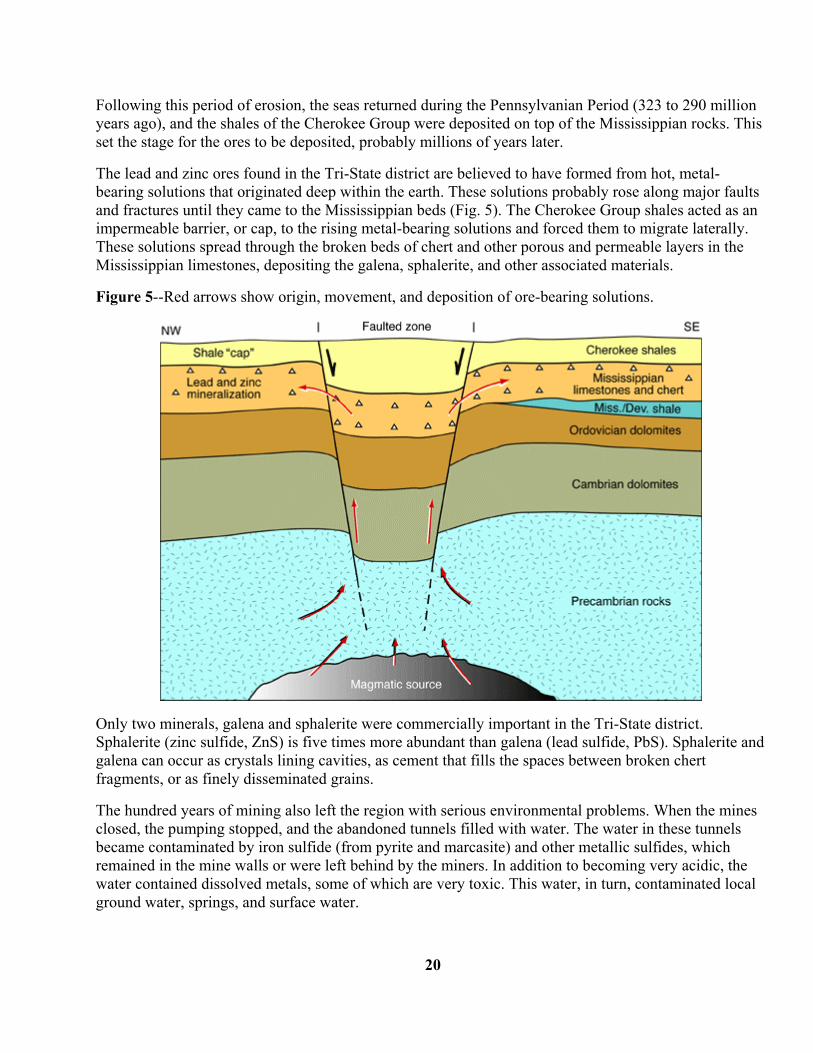
Following this period of erosion, the seas returned during the Pennsylvanian Period (323 to 290 million years ago), and the shales of the Cherokee Group were deposited on top of the Mississippian rocks. This set the stage for the ores to be deposited, probably millions of years later.
The lead and zinc ores found in the Tri-State district are believed to have formed from hot, metal-bearing solutions that originated deep within the earth. These solutions probably rose along major faults and fractures until they came to the Mississippian beds (Fig. 5). The Cherokee Group shales acted as an impermeable barrier, or cap, to the rising metal-bearing solutions and forced them to migrate laterally. These solutions spread through the broken beds of chert and other porous and permeable layers in the Mississippian limestones, depositing the galena, sphalerite, and other associated materials.
Figure 5--Red arrows show origin, movement, and deposition of ore-bearing solutions.
Only two minerals, galena and sphalerite were commercially important in the Tri-State district. Sphalerite (zinc sulfide, ZnS) is five times more abundant than galena (lead sulfide, PbS). Sphalerite and galena can occur as crystals lining cavities, as cement that fills the spaces between broken chert fragments, or as finely disseminated grains.
The hundred years of mining also left the region with serious environmental problems. When the mines closed, the pumping stopped, and the abandoned tunnels filled with water. The water in these tunnels became contaminated by iron sulfide (from pyrite and marcasite) and other metallic sulfides, which remained in the mine walls or were left behind by the miners. In addition to becoming very acidic, the water contained dissolved metals, some of which are very toxic. This water, in turn, contaminated local ground water, springs, and surface water.
20

Lead and zinc production involved crushing and grinding the mined rock to standard sizes and separating the ore. This left behind piles of leftover rock called tailings that covered 4,000 acres in southeastern Cherokee County. These wastes were also a source of contamination. Lead, zinc, and cadmium from the tailings leached into the shallow ground water; in addition, runoff moved contaminants into nearby streams and rivers. NPDES: There are four permitted wastewater treatment facilities discharging to the Spring River directly or via tributary below the Crestline monitoring station (Table 23). Three of these facilities are relatively low volume, lagoon treatment systems. The fourth is a coal-fired power generation station with once-through cooling. Limited effluent data from 2004 are available from Empire, Galena and Baxter Springs. Some infiltration of metal laden ground water may be occurring in Galena’s sanitary sewer system, but results are inconclusive. Table 23. NPDES Point Sources Discharging to Spring River City Type Receiving
Stream Design Flow
Pb conc Zn conc Cu conc Permit # NPDES #
Permit Expires
Baxter Springs
5-Cell Lagoon
Spring River
0.60 MGD
ND in 3 samples
203 ppb (1 sample)
ND in 3 samples
M-NE06OO01
KS 0045934
Sept 30, 2008
Galena 4-Cell Lagoon
Spring River
0.42 MGD
923 ppb (1 sample)
249 & 890 ppb (2 samples)
923 ppb (1 sample)
M-NE28OO01
KS 0048135
Oct 31, 2008
Columbus 5-Cell Lagoon
Brush Creek
0.42 MGD
Not Sampled
Not Sampled
Not Sampled
M-NE15OO01
KS 0031445
Sept 30, 2008
Empire Electric
Once-through cooling
Spring River & Empire Lake
97.4 MGD @ 3 outfalls
6.23 ppb (1 sample)
148 & 212 ppb (2 samples)
ND in 3 samples
I-NE73BO01
KS 0079812
Dec 31, 2008
The Riverton power plant of Empire Electric actually has three outfalls, the first is the flume discharging the once-through cooling water which can reach 92.4 MGD. The other two outfalls are drains from the facility designed to discharge 3 and 2 MGD, respectively. The three outfalls and the upstream river intake are monitored quarterly for lead, zinc and copper. In one instance, lead was detected at the main outfall, otherwise, copper and lead were not detected at the outfalls or intake in 2004. Zinc was measured in the main flume at levels slightly higher than those measured in the intake water. Zinc levels in the two drains were in the vicinity of that seen in the flume. Occasional storm water monitoring also is done on the drains. In June 2001, the north drain had zinc, lead and copper concentrations of 724, 90 and 50 ppb, respectively. Concentrations in the south drain reached 335, 40 and 30 ppb, respectively. The drains discharge washoff from the yards and roofs during high rainfall periods. 4. ALLOCATION OF POLLUTANT REDUCTION RESPONSIBILITY Point Sources: Analysis of the impairments seen in the Spring River under various flow conditions reveals little exceedance of the metal criteria at lowest flows when point source impacts might be most significant. Given the paucity of metal data for effluent from the facilities and the lack of low flow impacts, the initial wasteload allocations will be set at zero. Wasteload allocations will be re-examined and established in 2008 through revision of this TMDL prior to expiration of the existing NPDES permits.
21
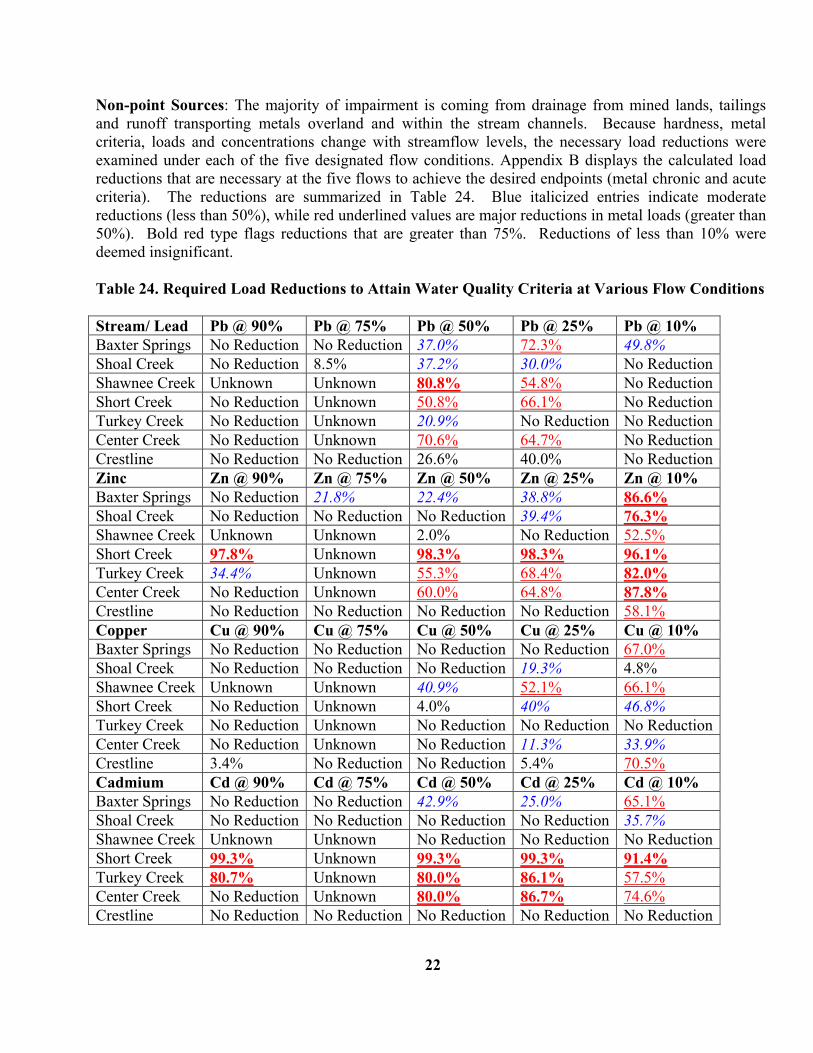
Non-point Sources: The majority of impairment is coming from drainage from mined lands, tailings and runoff transporting metals overland and within the stream channels. Because hardness, metal criteria, loads and concentrations change with streamflow levels, the necessary load reductions were examined under each of the five designated flow conditions. Appendix B displays the calculated load reductions that are necessary at the five flows to achieve the desired endpoints (metal chronic and acute criteria). The reductions are summarized in Table 24. Blue italicized entries indicate moderate reductions (less than 50%), while red underlined values are major reductions in metal loads (greater than 50%). Bold red type flags reductions that are greater than 75%. Reductions of less than 10% were deemed insignificant. Table 24. Required Load Reductions to Attain Water Quality Criteria at Various Flow Conditions Stream/ Lead Pb @ 90% Pb @ 75% Pb @ 50% Pb @ 25% Pb @ 10% Baxter Springs No Reduction No Reduction 37.0% 72.3% 49.8% Shoal Creek No Reduction 8.5% 37.2% 30.0% No ReductionShawnee Creek Unknown Unknown 80.8% 54.8% No ReductionShort Creek No Reduction Unknown 50.8% 66.1% No ReductionTurkey Creek No Reduction Unknown 20.9% No Reduction No ReductionCenter Creek No Reduction Unknown 70.6% 64.7% No ReductionCrestline No Reduction No Reduction 26.6% 40.0% No ReductionZinc Zn @ 90% Zn @ 75% Zn @ 50% Zn @ 25% Zn @ 10% Baxter Springs No Reduction 21.8% 22.4% 38.8% 86.6% Shoal Creek No Reduction No Reduction No Reduction 39.4% 76.3% Shawnee Creek Unknown Unknown 2.0% No Reduction 52.5% Short Creek 97.8% Unknown 98.3% 98.3% 96.1% Turkey Creek 34.4% Unknown 55.3% 68.4% 82.0% Center Creek No Reduction Unknown 60.0% 64.8% 87.8% Crestline No Reduction No Reduction No Reduction No Reduction 58.1% Copper Cu @ 90% Cu @ 75% Cu @ 50% Cu @ 25% Cu @ 10% Baxter Springs No Reduction No Reduction No Reduction No Reduction 67.0% Shoal Creek No Reduction No Reduction No Reduction 19.3% 4.8% Shawnee Creek Unknown Unknown 40.9% 52.1% 66.1% Short Creek No Reduction Unknown 4.0% 40% 46.8% Turkey Creek No Reduction Unknown No Reduction No Reduction No ReductionCenter Creek No Reduction Unknown No Reduction 11.3% 33.9% Crestline 3.4% No Reduction No Reduction 5.4% 70.5% Cadmium Cd @ 90% Cd @ 75% Cd @ 50% Cd @ 25% Cd @ 10% Baxter Springs No Reduction No Reduction 42.9% 25.0% 65.1% Shoal Creek No Reduction No Reduction No Reduction No Reduction 35.7% Shawnee Creek Unknown Unknown No Reduction No Reduction No ReductionShort Creek 99.3% Unknown 99.3% 99.3% 91.4% Turkey Creek 80.7% Unknown 80.0% 86.1% 57.5% Center Creek No Reduction Unknown 80.0% 86.7% 74.6% Crestline No Reduction No Reduction No Reduction No Reduction No Reduction
22

As seen in the previous analysis of the current conditions, there are few load reductions necessary at lower flows, signified by the 90 and 75 percent exceedance flows. The assessment of the tributaries at the low (75%) flow is hampered by the lack of data collected under that range of flows. The exception is the need for reductions in zinc and cadmium loading at low (90%) flow on Short and Turkey Creeks. Zinc and cadmium appear to be the more significant loadings on the tributaries, followed by lead and finally, copper. The highest flow condition exceeded 10% of the time or less is significantly impaired as indicated in Appendix B by the high reductions necessary to achieve chronic criteria. Because of the unstable conditions at that flow, the acute criteria are the targeted endpoints for attention. Acute criteria require large load reductions as well at the highest flows. For the purpose of selecting the most critical issues and reaches under this TMDL, impairment is ranked by the duration of the excursions, the frequency of the exceedances and the magnitude of the digressions as expressed by their necessary load reductions. A ranking system was established to evaluate the individual flow-stream-metal combinations. Table 25 shows the designated values given to various levels of duration, frequency and magnitude over applicable criteria. Duration is represented by the number of excursions that have been sampled with the supposition that a high number of excursions is indicative of extended time periods over the applicable water quality criteria. Appendix C shows the individual scores for the various streams and metals at different flow conditions. Table 26 ranks the overall exceedances. A score of 11 is significant in all three factors. Scores above 7 were considered first priority, while scores of 6-7 represented secondary priority for implementation. Scores below 6 were viewed as minor impairments. Table 25. Designated Score Values for Relative Duration, Frequency and Magnitude of Exceedances
Duration (# of Excursions) Frequency (% of Samples Exceeding) Magnitude (% Load Reduction)
Number of Exceedances
Score Percent of Samples Exceeding
Score Necessary Load Reduction
Score
< 2 hits 0 < 10% Samples 0 < 10% Load Reduction 0 2-4 hits 1 10-24% Samples 1 10-34% Load Reduction 1 5-7 hits 2 25-49% Samples 2 35-49% Load Reduction 2 8-11 hits 3 Greater/Equal than 50% 3 50-65% Load Reduction 3 > 11 hits 4 ----------------- -- 66-99% Load Reduction 4
23
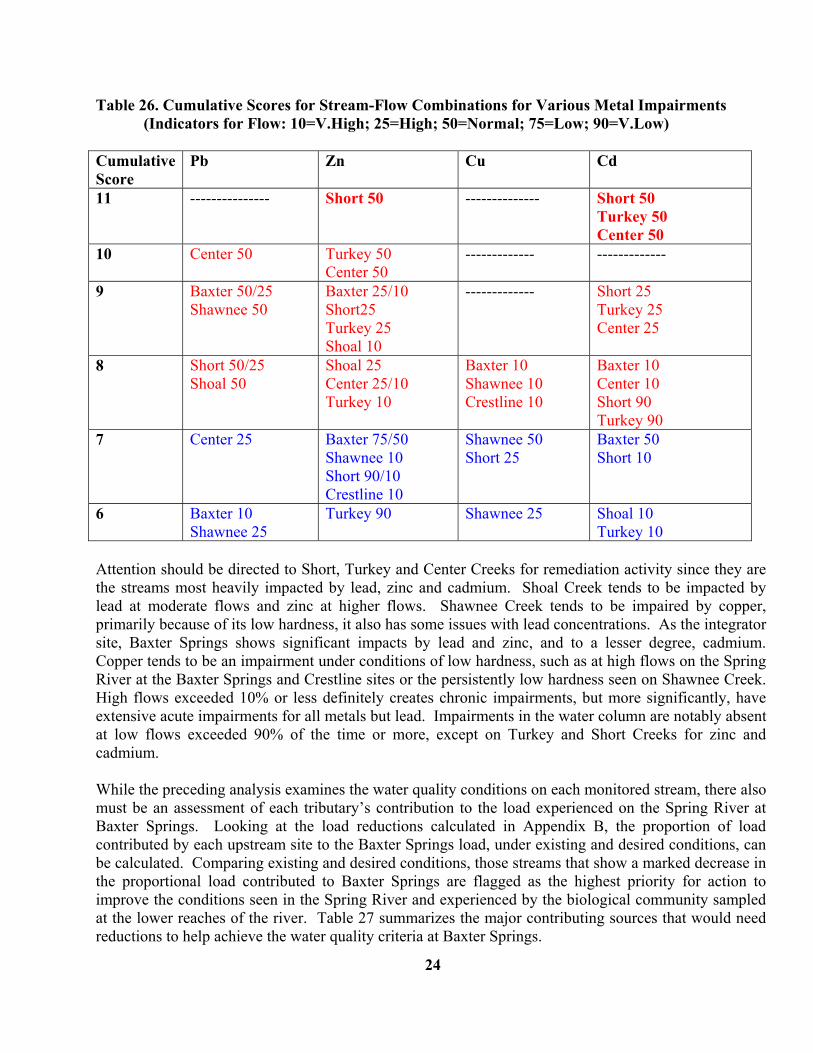
Table 26. Cumulative Scores for Stream-Flow Combinations for Various Metal Impairments (Indicators for Flow: 10=V.High; 25=High; 50=Normal; 75=Low; 90=V.Low) Cumulative Score
Pb Zn Cu Cd
11 --------------- Short 50 -------------- Short 50 Turkey 50 Center 50
10 Center 50 Turkey 50 Center 50
------------- -------------
9 Baxter 50/25 Shawnee 50
Baxter 25/10 Short25 Turkey 25 Shoal 10
------------- Short 25 Turkey 25 Center 25
8 Short 50/25 Shoal 50
Shoal 25 Center 25/10 Turkey 10
Baxter 10 Shawnee 10 Crestline 10
Baxter 10 Center 10 Short 90 Turkey 90
7 Center 25 Baxter 75/50 Shawnee 10 Short 90/10 Crestline 10
Shawnee 50 Short 25
Baxter 50 Short 10
6
Baxter 10 Shawnee 25
Turkey 90 Shawnee 25 Shoal 10 Turkey 10
Attention should be directed to Short, Turkey and Center Creeks for remediation activity since they are the streams most heavily impacted by lead, zinc and cadmium. Shoal Creek tends to be impacted by lead at moderate flows and zinc at higher flows. Shawnee Creek tends to be impaired by copper, primarily because of its low hardness, it also has some issues with lead concentrations. As the integrator site, Baxter Springs shows significant impacts by lead and zinc, and to a lesser degree, cadmium. Copper tends to be an impairment under conditions of low hardness, such as at high flows on the Spring River at the Baxter Springs and Crestline sites or the persistently low hardness seen on Shawnee Creek. High flows exceeded 10% or less definitely creates chronic impairments, but more significantly, have extensive acute impairments for all metals but lead. Impairments in the water column are notably absent at low flows exceeded 90% of the time or more, except on Turkey and Short Creeks for zinc and cadmium. While the preceding analysis examines the water quality conditions on each monitored stream, there also must be an assessment of each tributary’s contribution to the load experienced on the Spring River at Baxter Springs. Looking at the load reductions calculated in Appendix B, the proportion of load contributed by each upstream site to the Baxter Springs load, under existing and desired conditions, can be calculated. Comparing existing and desired conditions, those streams that show a marked decrease in the proportional load contributed to Baxter Springs are flagged as the highest priority for action to improve the conditions seen in the Spring River and experienced by the biological community sampled at the lower reaches of the river. Table 27 summarizes the major contributing sources that would need reductions to help achieve the water quality criteria at Baxter Springs.
24

Table 27. Major Contributing Tributaries Needing to Reduce Load to Achieve Baxter Springs Endpoints
Metal/Flow Normal Flow (50%) High Flow (25%) Very High Flow (10%) Lead Center Creek Intervening* Intervening* Zinc Center Creek, Short Creek,
Turkey Creek, Intervening* Center Creek, Short Creek, Turkey Creek, Intervening*
Center Creek, Short Creek, Intervening*
Copper None None Crestline, Intervening* Cadmium Center Creek, Short Creek,
Turkey Creek, Intervening* Center Creek, Short Creek, Turkey Creek, Intervening*
None
* includes Empire Lake, Spring Branch and Willow Creek
For the main impairing metals of lead, zinc and cadmium, Center Creek should be the top priority followed by Short Creek. However, in all cases, there is a significant contribution from sites that are not monitored by the existing surface water chemistry network. These unmonitored, intervening contributions might come from streams such as Brush Creek, Willow Creek or Spring Branch in the Baxter Springs area, which showed high metal concentrations in the 2001 high flow synoptic survey. The proportional loads contributed to Baxter Springs under existing conditions is too high to be accounted by these remaining tributaries with their relatively small hydrology. A more likely, significant source of contributions are the re-suspension of metal-laden sediments within the stream channels and Empire Lake. The greatest impairments are seen at high flows when there is sufficient energy to re-suspend and transport in-channel sediment deposits. Anecdotal observations at times of sampling have noted the large deposits of chat and sediment in the streams. As seen in past Kansas Biological Survey and U.S. Geological Survey studies, the sediments have high concentrations of metals attached to their particles. The data from the KDHE high flow synoptic sampling and studies done by the Kansas Biological Survey and Pittsburg State University hint at Empire Lake as a significant trap of sediments, metals and nutrients and that at high flow, these deposits can get re-suspended into the stream profile and impact water quality conditions and biological communities on the Spring River at Baxter Springs. Finally, at low flows, there is typically adequate water quality to support a strong biological community among the macroinvertebrates and mussels, yet the biological indicators show varying degrees of stress. Because of the contact of the biology with the underlying substrate, it is highly probable that elevated metals in the sediments are dampening biologic integrity within the stream channels, regardless of the metal concentrations seen in the overlying water column. Metals are a greater threat at the substrate interface because anoxic conditions create redox environments favoring metal species that are more bioavailable, toxic and mobile. Therefore, there are three aspects of load reduction necessary to re-establish a fully supported biological community: 1) Achieve water quality criteria under moderate and high flow conditions on the individual stream reaches; 2) Reduce metal loads from tributaries that contribute to the impaired condition seen on the Spring River at Baxter Springs; and, 3) Remove contaminated sediments from the channel bed at selected locations to lower high flow exceedances of metals and to create a healthier substrate for ecological habitat and niche support.
25

Margin of Safety: The Margin of Safety is explicitly established by designating the existing conditions of metal concentrations as the upper quartile (75%) value around the sample means segregated by flow condition. Conversely, the desired endpoints are established using the lower 90% confidence limit of the mean total hardness in each flow range. The resulting necessary load reductions are a conservative estimate of decreases in the existing condition to reach the desired condition. Additionally, the use of biological indices and upstream/downstream comparative studies will serve to confirm improved biological communities in response to load reductions, ultimately reaching full support levels for aquatic life. Finally, in the case of cadmium, the endpoints were derived using the new stricter criteria equations, currently being adopted into Kansas Surface Water Quality Standards. Implementation Priority: Because of the high degree of impairment noted on Center, Short and Turkey Creeks in terms of the magnitude, frequency and assumed duration of zinc and cadmium exposure to aquatic life and because these three tributaries are primary contributors to the loads, concentrations and impacts seen on the Spring River at Baxter Springs, these streams should be the initial focus of remedial activity. Shoal Creek should likewise receive immediate attention to reduce lead and zinc loadings impacting that stream’s biota. Shawnee Creek should be evaluated for impairment by copper, focusing on causes of its low total hardness that leaves it vulnerable to copper toxicity. Abatement of lead loading should also be addressed on Shawnee Creek. As part of and in addition to the remedial activities necessary to reduce loadings on the stream segments, it is imperative that major deposits of contaminated sediment within stream channels be removed in order to eliminate a significant source of loading during high flow as well as a serious stressor to the biota inhabiting the stream substrate. This source removal will work toward reducing the acute criteria exceedances seen at high flows occurring less than 10% of the time. Remedial activity should also investigate sources on and along Willow Creek and Spring Branch in the vicinity of Baxter Springs. These tributaries have been noted as high in metals, particularly zinc, during synoptic surveys and, because of their proximity to the Baxter Springs station on Spring River, may impact the lowest reaches of the river during high flows. Unified Watershed Assessment Priority Ranking: This TMDL addresses streams the Spring Subbasinl (HUC 8: 11070207) with a ranking of 16 (High Priority for restoration). Priority HUC 11s: Because of their high levels of metals and contribution to the Spring River, the drainages of Short Creek, Turkey Creek and Center Creek are the top priority. Additionally, because of the impact to the historically diverse population of mussels, remediation activities along Shoal Creek need to abate the impact of contaminated sediments. This designation requires Missouri to conduct remedial actions on Center, Shoal and Turkey Creeks to help Kansas achieve its water quality standards.
26
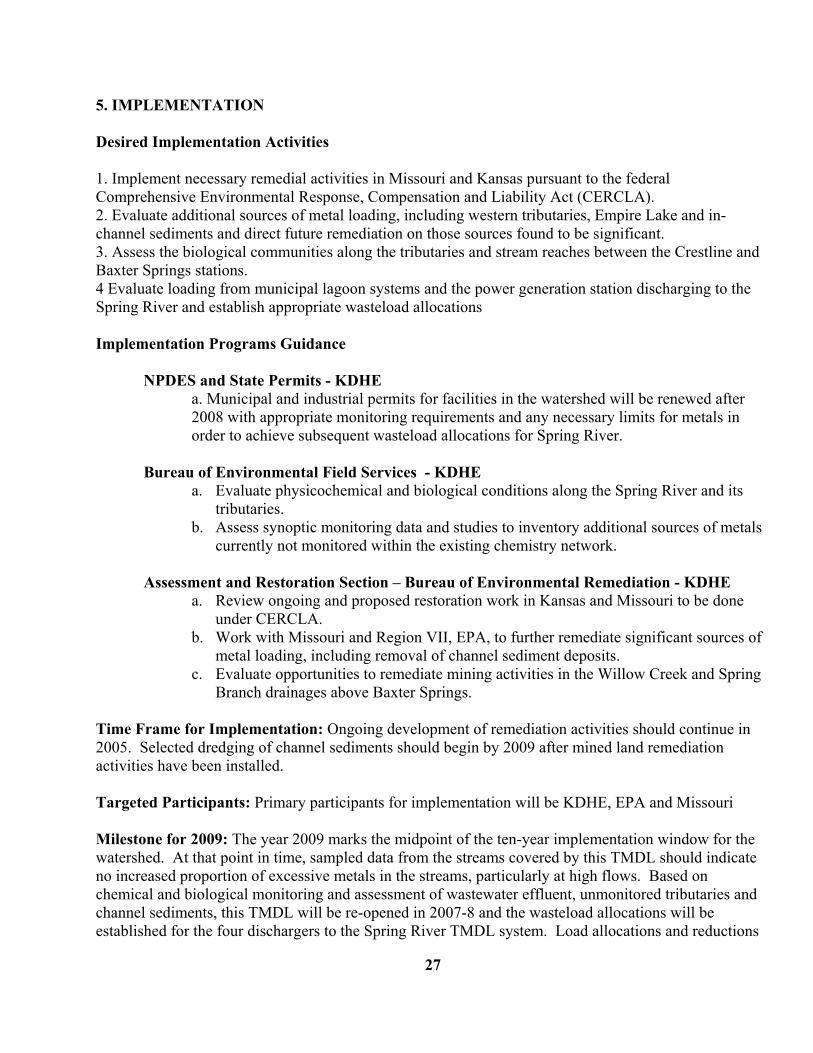
5. IMPLEMENTATION Desired Implementation Activities 1. Implement necessary remedial activities in Missouri and Kansas pursuant to the federal Comprehensive Environmental Response, Compensation and Liability Act (CERCLA). 2. Evaluate additional sources of metal loading, including western tributaries, Empire Lake and in-channel sediments and direct future remediation on those sources found to be significant. 3. Assess the biological communities along the tributaries and stream reaches between the Crestline and Baxter Springs stations. 4 Evaluate loading from municipal lagoon systems and the power generation station discharging to the Spring River and establish appropriate wasteload allocations Implementation Programs Guidance NPDES and State Permits - KDHE
a. Municipal and industrial permits for facilities in the watershed will be renewed after 2008 with appropriate monitoring requirements and any necessary limits for metals in order to achieve subsequent wasteload allocations for Spring River.
Bureau of Environmental Field Services - KDHE
a. Evaluate physicochemical and biological conditions along the Spring River and its tributaries.
b. Assess synoptic monitoring data and studies to inventory additional sources of metals currently not monitored within the existing chemistry network.
Assessment and Restoration Section – Bureau of Environmental Remediation - KDHE
a. Review ongoing and proposed restoration work in Kansas and Missouri to be done under CERCLA.
b. Work with Missouri and Region VII, EPA, to further remediate significant sources of metal loading, including removal of channel sediment deposits.
c. Evaluate opportunities to remediate mining activities in the Willow Creek and Spring Branch drainages above Baxter Springs.
Time Frame for Implementation: Ongoing development of remediation activities should continue in 2005. Selected dredging of channel sediments should begin by 2009 after mined land remediation activities have been installed. Targeted Participants: Primary participants for implementation will be KDHE, EPA and Missouri Milestone for 2009: The year 2009 marks the midpoint of the ten-year implementation window for the watershed. At that point in time, sampled data from the streams covered by this TMDL should indicate no increased proportion of excessive metals in the streams, particularly at high flows. Based on chemical and biological monitoring and assessment of wastewater effluent, unmonitored tributaries and channel sediments, this TMDL will be re-opened in 2007-8 and the wasteload allocations will be established for the four dischargers to the Spring River TMDL system. Load allocations and reductions
27
will be modified at that time. Delivery Agents: The primary delivery agents for program participation will be the Kansas Department of Health and Environment. Reasonable Assurances: Authorities: The following authorities may be used to direct activities in the watershed to reduce pollutants.
1. K.S.A. 65-171d empowers the Secretary of KDHE to prevent water pollution and to protect the beneficial uses of the waters of the state through required treatment of sewage and established water quality standards and to require permits by persons having a potential to discharge pollutants into the waters of the state.
2. K.S.A. 49-402a designates KDHE with the jurisdiction and authority to regulate reclamation of lands affected by surface mining operations.
3. K.S.A. 65-3453 provides the Secretary of KDHE with authority to determine the need to clean up contaminated sites and direct actions and resources to carry out the clean up activities.
Funding: Funding sources will be generated by a combination of private industry, Superfund and state funding. Funding limitations will necessitate long -term remedial action plans to take advantage of funding opportunities as they arise. This watershed and its TMDL is a High Priority consideration. Effectiveness: Remedial action can be quite effective in curtailing metal loading to streams through isolating chat tailings from runoff and collecting ground water seepage before it enters waterways. Leveling and capping mined areas will also curtail loading. The most difficult undertaking will be the removal and disposal of contaminated channel sediments at targeted stream locations. 6. MONITORING KDHE will continue to collect bimonthly samples from permanent and rotational stations in the Spring River Watershed (Table 4). KDHE will also continue biological and mussel tissue sampling operations in the watershed. The results from the 2004 & 2005 sampling for the Natural Resource Damage Assessment will be fully compiled and analyzed by KDHE by 2006. Monitoring of metal levels in effluent will be a condition of NPDES and state permits for discharging facilities. This monitoring will continually assess the contributions of metals in the wastewater effluent released to the streams upstream of Baxter Springs. 7. FEEDBACK Public Meetings: Public meetings to discuss TMDLs in the Neosho Basin were held January 30, 2004, July 30, 2004 and September 30, 2004 in Burlington.. An active Internet Web site was established at http://www.kdhe.state.ks.us/tmdl/ to convey information to the public on the general establishment of TMDLs and specific TMDLs for the Neosho Basin, including this TMDL for the Spring River. A Forum for discussing the Tri-State Mining District issues occurred in Joplin on April 12-14, 2005.
28

Public Hearing: A Public Hearing on the TMDLs of the Neosho Basin was held in Burlington on September 30, 2004 Basin Advisory Committee: The Neosho Basin Advisory Committee met to discuss the TMDLs in the basin on January 30, 2004, July 30, 2004 and September 30, 2004, all in Burlington. An additional meeting was held in Baxter Springs on April 18, 2005 to discuss this TMDL. Milestone Evaluation: In 2008, evaluation will be made as to necessary wasteload allocations and load allocations assigned to additional sources of metals entering Spring River. Subsequent decisions will be made regarding the implementation approach and follow up of additional implementation in the watershed. Consideration for 303(d) Delisting: The stream will be evaluated for delisting under Section 303(d), based on the monitoring data over the period 2008-2012. Therefore, the decision for delisting will come about in the preparation of the 2012 303(d) list. Should modifications be made to the applicable water quality criteria during the ten-year implementation period, consideration for delisting, desired endpoints of this TMDL and implementation activities may be adjusted accordingly. Incorporation into Continuing Planning Process, Water Quality Management Plan and the Kansas Water Planning Process: Under the current version of the Continuing Planning Process, the next anticipated revision will come in 2006 which will emphasize implementation of TMDLs. At that time, incorporation of this TMDL will be made into both documents. Recommendations of this TMDL will be considered in Kansas Water Plan implementation decisions under the State Water Planning Process for Fiscal Years 2005-2009.
29
Bibliography
1. Ferrington, Leonard C., Jr.; Occurrence and Biological Effects of Cadmium, Lead, Manganese and Zinc in the Short Creek/Empire Lake Aquatic System, in Cherokee County, Kansas; Kansas Water Resources Research Institute Contribution No. 277; June 1989; 126 p.
2. Ferrington, Leonard C.,Jr.; Final Report of Water Chemistry and Macroinvertebrate Communities for Selected Sites at the Galena Sub-site of the Cherokee County Superfund Site, Cherokee County, Kansas, within the Tri-State Mining District; Kansas Biological Survey Technical Report No. 107; 2002; 40 p.
3. Ferrington, Leonard C., Jr., C.Wright, D.Goldhammer, B.Hayford and R.Hagen; Summary of Water Chemistry, Sediment Chemistry, Fish Populations and Macroinvertebrate Communities for Selected Sites at the Galena Sub-site of the Tri-State Mining District, Phase I. Report No. 56; 1993; 57p.
4. Ferrington, Leonard C., Jr., S.M. Stringer and S.T. Stringer; Summary of Water Chemistry and Macroinvertebrate Communities for Selected Sites at the Galena Sub-site of the Tri-State Mining District, Year Two of Phase III.; Report No. 97; 2000; 25p.
5. Spruill, Timothy B.; Assessment of Water Resources in Lead-Zinc Mined Areas in Cherokee County, Kansas, and Adjacent Areas; U.S. Geological Survey Water-Supply Paper 2268; 1987; 68 p.
6. Petersen, James C., J.C. Adamski, R.W. Bell, J.V. Davis, S.R. Femmer, D.A. Freiwald and R.L. Joseph; Water Quality in the Ozark Plateaus, Arkansas, Kansas, Missouri and Oklahoma, 1992-95; U.S. Geological Survey Circular 1158; 1998; 33 p.
7. Davis, Jerri V. and Richard W. Bell; Water-Quality Assessment of the Ozark Plateaus Study Unit, Arkansas, Kansas, Missouri and Oklahoma – Nutrients, Bacteria, Organic Carbon, and Suspended Sediment in Surface Water, 1993-95. U.S. Geological Survey Water-Resources Investigations Report 98-4164; 1998; 56 p.
8. Chambers, Dave K. and Joseph A. Arruda; A Synoptic Water Quality Survey of the Spring River and its Tributaries; Unpublished Manuscript; Pittsburg State University; 2004; 22 p.
9. McCauley, J.R., L.L.Brady and F.W.Wilson; Study of Stability Problems and Hazard Evaluation of the Kansas Portion of the Tri-state Mining Area; Kansas Geological Survey Open-File Report 83-2; 1983; http://www.kgs.ukans.edu/Publications/OFR/1983/83-2/index.html
10. Brosius, Liz and Robert S. Sawin, Lead and Zinc Mining in Kansas; Kansas Geological Survey Public Information Circular 17; 2001; http://www.kgs.ukans.edu/Publications/pic17/pic17_1.html.
11. Perry, CA., Wolock, D.M., and Artman, J.C.; Estimates of Flow Duration, Mean Flow and Peak-Discharge Frequency Values for Kansas Stream Locations; USGS Scientific Investigations Report 2004-5033; 2004; 651 p.
30

Appendix A. Total Metal Concentrations and Criteria Segregated by Flow Condition at Baxter Springs
Spring River near Crestline Lead
0.0010
0.0100
0.1000
1.0000
98 94 92 89 82 78 75 60 53 49 47 40 36 26 22 18 11 3
Pct of Time Flow Exceeded
Lead
in p
pm
Lead CCC Lead CMC Sample
Spring River near Crestline Zinc
0.001
0.010
0.100
1.000
10.000
98 94 92 89 82 78 75 60 53 49 47 40 36 26 22 18 11 3
Pct of Time Flow Exceeded
Zinc
in p
pm
Zinc CCC Sample
CCC = Criterion Continuous Concentration = Chronic Aquatic Life Criteria CMC = Criterion Maximum Concentration = Acute Aquatic Life Criteria Zinc CCC = Zinc CMC
31
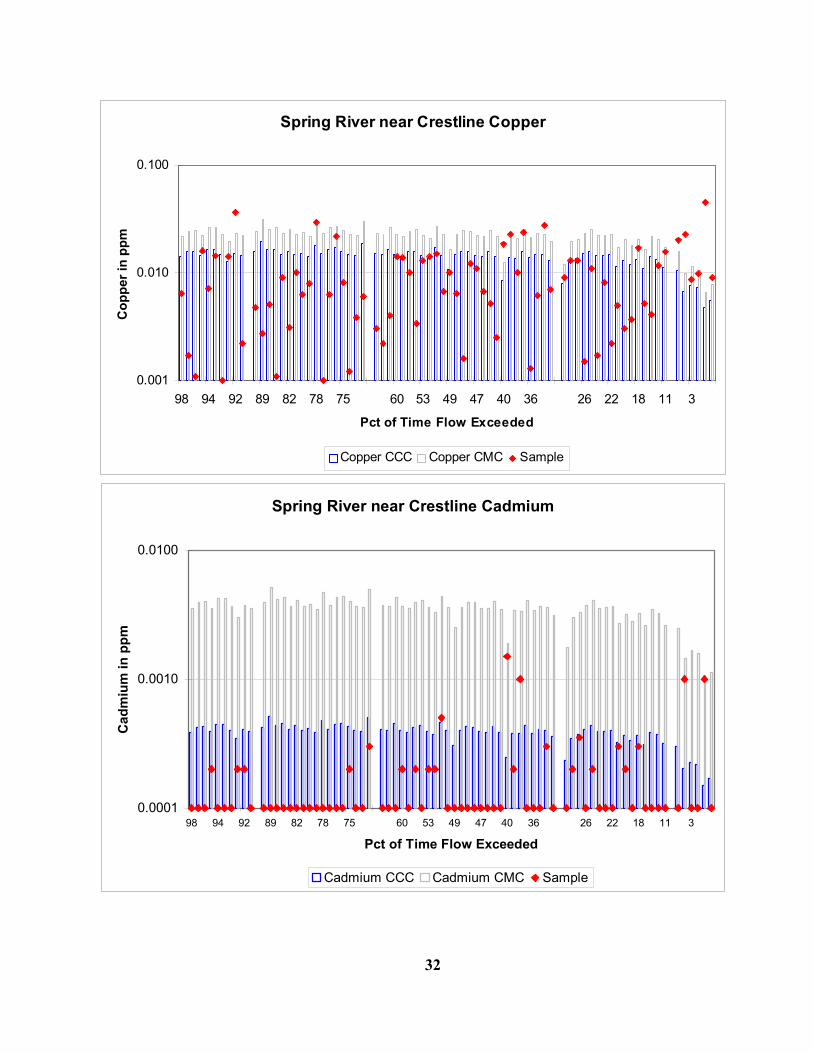
Spring River near Crestline Copper
0.001
0.010
0.100
98 94 92 89 82 78 75 60 53 49 47 40 36 26 22 18 11 3
Pct of Time Flow Exceeded
Cop
per i
n pp
m
Copper CCC Copper CMC Sample
Spring River near Crestline Cadmium
0.0001
0.0010
0.0100
98 94 92 89 82 78 75 60 53 49 47 40 36 26 22 18 11 3
Pct of Time Flow Exceeded
Cad
miu
m in
ppm
Cadmium CCC Cadmium CMC Sample
32
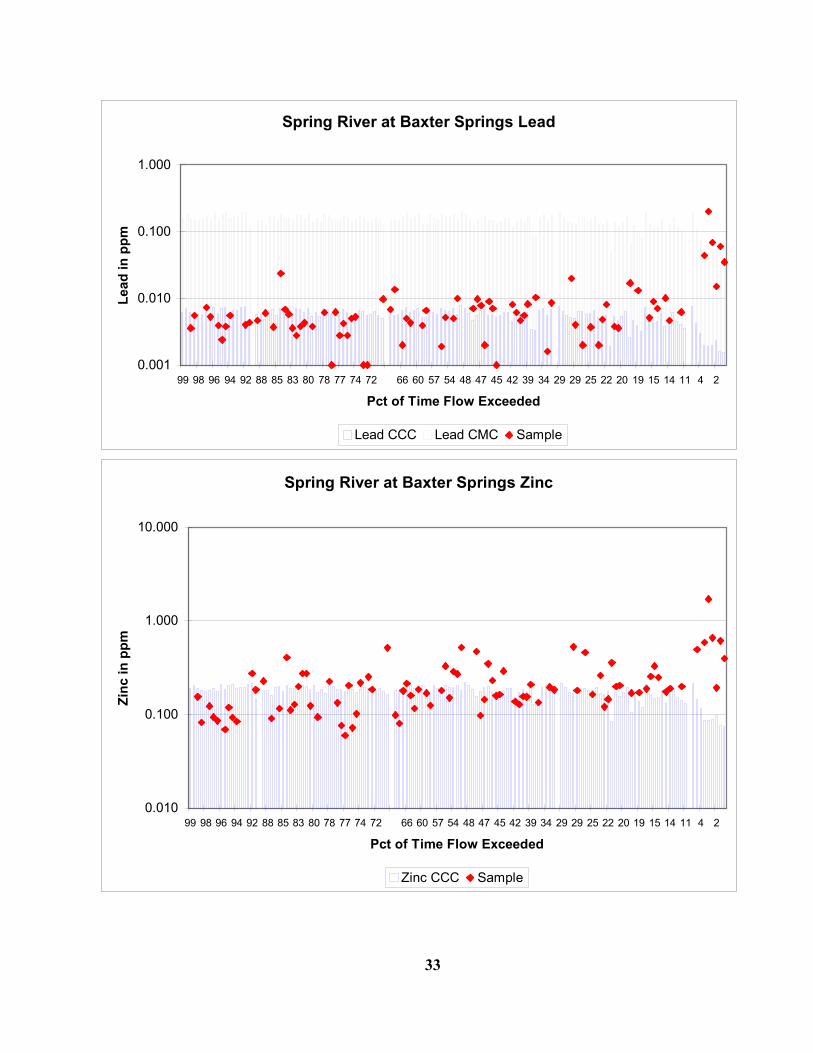
Spring River at Baxter Springs Lead
0.001
0.010
0.100
1.000
99 98 96 94 92 88 85 83 80 78 77 74 72 66 60 57 54 48 47 45 42 39 34 29 29 25 22 20 19 15 14 11 4 2
Pct of Time Flow Exceeded
Lead
in p
pm
Lead CCC Lead CMC Sample
Spring River at Baxter Springs Zinc
0.010
0.100
1.000
10.000
99 98 96 94 92 88 85 83 80 78 77 74 72 66 60 57 54 48 47 45 42 39 34 29 29 25 22 20 19 15 14 11 4 2
Pct of Time Flow Exceeded
Zinc
in p
pm
Zinc CCC Sample
33

Spring River at Baxter Springs Copper
0.001
0.010
0.100
99 98 96 94 92 88 85 83 80 78 77 74 72 66 60 57 54 48 47 45 42 39 34 29 29 25 22 20 19 15 14 11 4 2
Pct of Time Flow Exceeded
Cop
per i
n pp
m
Copper CCC Copper CMC Sample
Spring River at Baxter Springs Cadmium
0.0001
0.0010
0.0100
0.1000
99 98 96 94 92 88 85 83 80 78 77 74 72 66 60 57 54 48 47 45 42 39 34 29 29 25 22 20 19 15 14 11 4 2
Pct of Time Flow Exceeded
Cd
in p
pm
Cadmium CCC Cadmium CMC Sample
34

Shoal Creek Lead
0.001
0.010
0.100
1.000
99 98 96 94 92 88 83 81 78 74 66 65 62 58 53 50 49 45 43 41 39 35 32 25 20 18 14 13 10 3 1
Pct of Time Flow Exceeded
Lead
in p
pm
Lead CCC Lead CMC Sample
Shoal Creek Zinc
0.010
0.100
1.000
99 98 96 94 92 88 83 81 78 74 66 65 62 58 53 50 49 45 43 41 39 35 32 25 20 18 14 13 10 3 1
Pct of Time Flow Exceeded
Zinc
in p
pm
Zinc CCC Sample
35
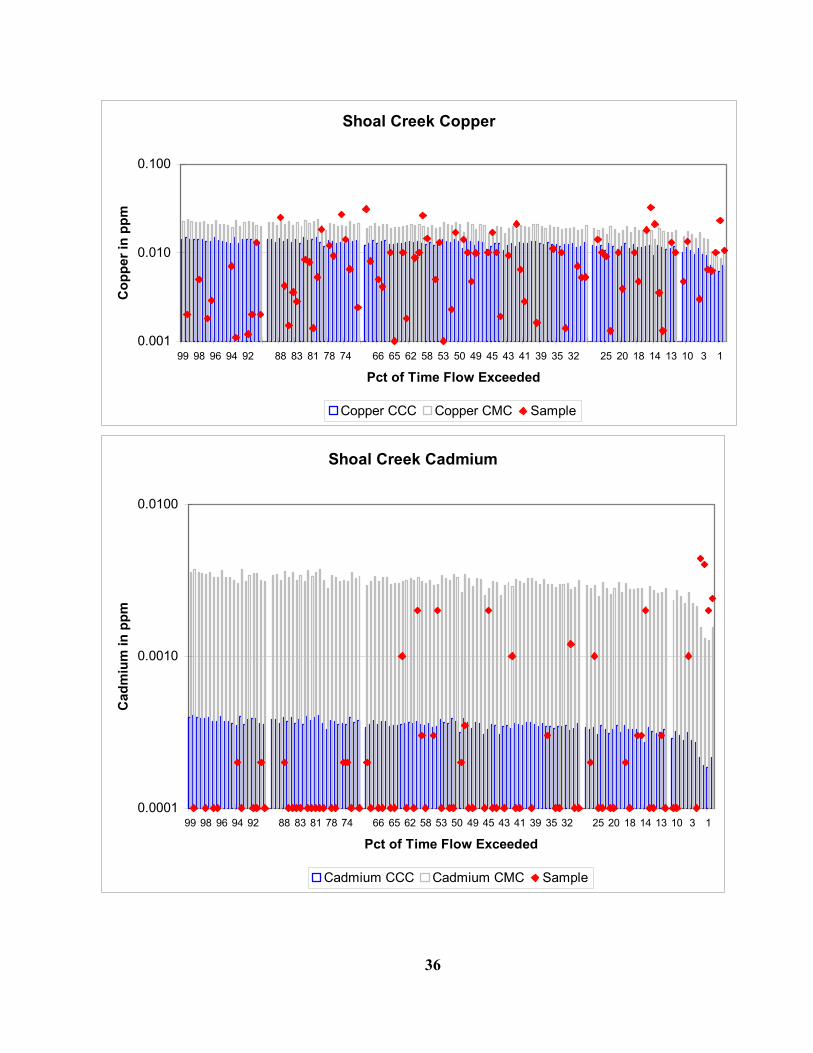
Shoal Creek Copper
0.001
0.010
0.100
99 98 96 94 92 88 83 81 78 74 66 65 62 58 53 50 49 45 43 41 39 35 32 25 20 18 14 13 10 3 1
Pct of Time Flow Exceeded
Cop
per i
n pp
m
Copper CCC Copper CMC Sample
Shoal Creek Cadmium
0.0001
0.0010
0.0100
99 98 96 94 92 88 83 81 78 74 66 65 62 58 53 50 49 45 43 41 39 35 32 25 20 18 14 13 10 3 1
Pct of Time Flow Exceeded
Cad
miu
m in
ppm
Cadmium CCC Cadmium CMC Sample
36

Center Creek Lead
0.001
0.010
0.100
1.000
99 97 95 93 88 75 66 64 62 56 52 46 43 41 39 37 35 30 25 20 18 14 3
Pct of Time Flow Exceeded
Lead
as
ppm
Lead CCC Lead CMC Sample
Center Creek Zinc
0.01
0.10
1.00
10.00
99 97 95 93 88 75 66 64 62 56 52 46 43 41 39 37 35 30 25 20 18 14 3
Pct of Time Flow Exceeded
Zinc
in p
pm
Zinc CCC Sample
37

Center Creek Copper
0.001
0.010
0.100
99 97 95 93 88 75 66 64 62 56 52 46 43 41 39 37 35 30 25 20 18 14 3
Pct of Time Flow Exceeded
Cop
per i
n pp
m
Copper CCC Copper CMC Sample
Center Creek Cadmium
0.0001
0.0010
0.0100
0.1000
99 97 95 93 88 75 66 64 62 56 52 46 43 41 39 37 35 30 25 20 18 14 3
Pct of Time Flow was Exceeded
Cad
miu
m in
ppm
Cadmium CCC Cadmium CMC Sample
38
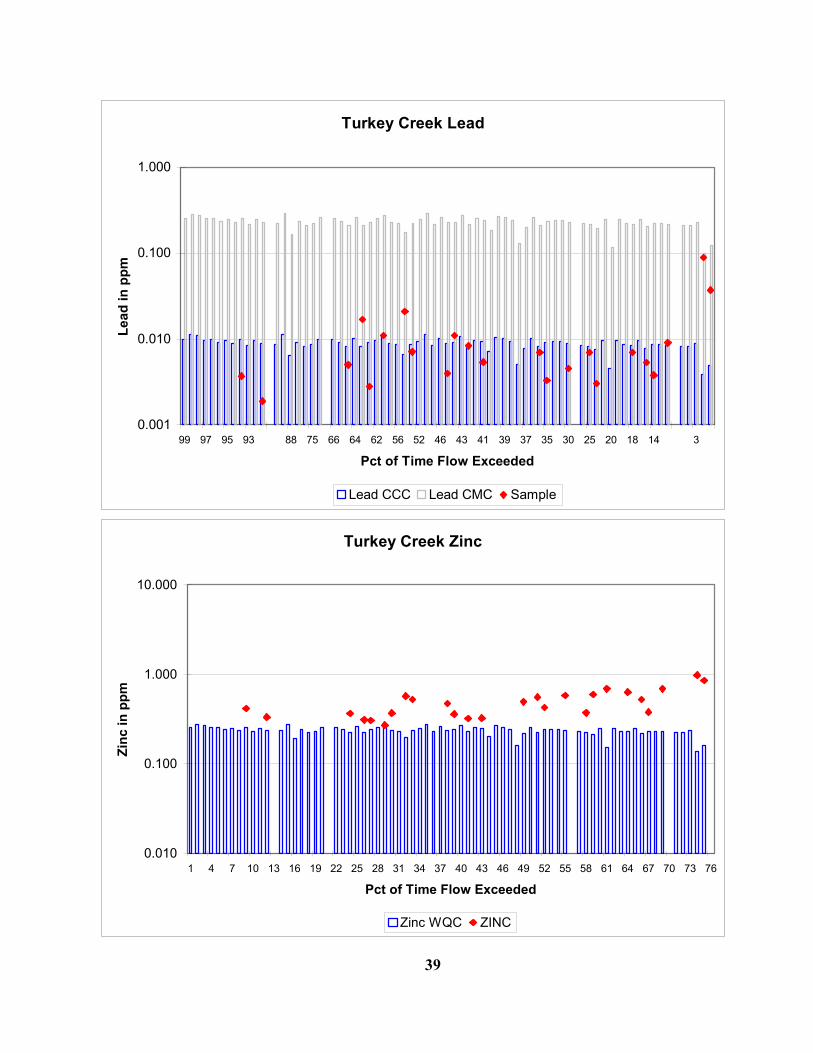
Turkey Creek Lead
0.001
0.010
0.100
1.000
99 97 95 93 88 75 66 64 62 56 52 46 43 41 39 37 35 30 25 20 18 14 3
Pct of Time Flow Exceeded
Lead
in p
pm
Lead CCC Lead CMC Sample
Turkey Creek Zinc
0.010
0.100
1.000
10.000
1 4 7 10 13 16 19 22 25 28 31 34 37 40 43 46 49 52 55 58 61 64 67 70 73 7
Pct of Time Flow Exceeded
Zinc
in p
pm
6
Zinc WQC ZINC
39

Turkey Creek Copper
0.001
0.010
0.100
99 97 95 93 88 75 66 64 62 56 52 46 43 41 39 37 35 30 25 20 18 14 3
Pct of Time Flow Exceeded
Cop
per i
n pp
m
Copper CCC Copper CMC Sample
Turkey Creek Cadmium
0.0001
0.0010
0.0100
0.1000
99 97 95 93 88 75 66 64 62 56 52 46 43 41 39 37 35 30 25 20 18 14 3
Pct of Time Flow Exceeded
Cad
miu
m in
ppm
Cadmium CCC Cadmium CMC Sample
40

Short Creek Lead
0.001
0.010
0.100
1.000
94 92 65 63 59 53 53 46 43 41 37 35 35 30 25 25 20 18 14 14 13 1
Pct of Time Flow Exceeded
Lead
in p
pm
Lead CCC Lead CMC Sample
Short Creek Zinc
0.01
0.10
1.00
10.00
100.00
94 92 65 63 59 53 53 46 43 41 37 35 35 30 25 25 20 18 14 14 13 1
Pct of Time Flow Exceeded
Zinc
in p
pm
Zinc CCC Sample
41

Short Creek Copper
0.001
0.010
0.100
94 92 65 63 59 53 53 46 43 41 37 35 35 30 25 25 20 18 14 14 13 1
Pct of Time Flow Exceeded
Cop
per i
n pp
m
Copper CCC Copper CMC Sample
Short Creek Cadmium
0.0001
0.0010
0.0100
0.1000
1.0000
94 92 65 63 59 53 53 46 43 41 37 35 35 30 25 25 20 18 14 14 13 1
Pct of Time Flow Exceeded
Cad
miu
m in
ppm
Cadmium CCC Cadmium CMC Sample
42
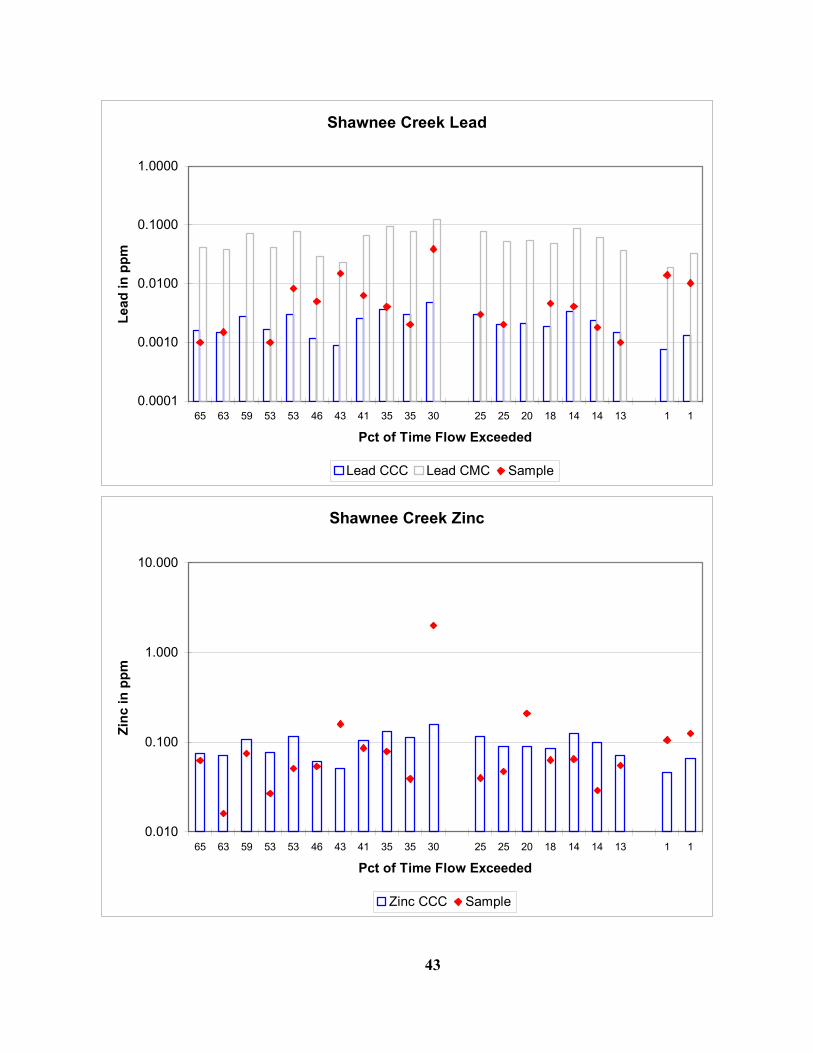
Shawnee Creek Lead
0.0001
0.0010
0.0100
0.1000
1.0000
65 63 59 53 53 46 43 41 35 35 30 25 25 20 18 14 14 13 1 1
Pct of Time Flow Exceeded
Lead
in p
pm
Lead CCC Lead CMC Sample
Shawnee Creek Zinc
0.010
0.100
1.000
10.000
65 63 59 53 53 46 43 41 35 35 30 25 25 20 18 14 14 13 1 1
Pct of Time Flow Exceeded
Zinc
in p
pm
Zinc CCC Sample
43
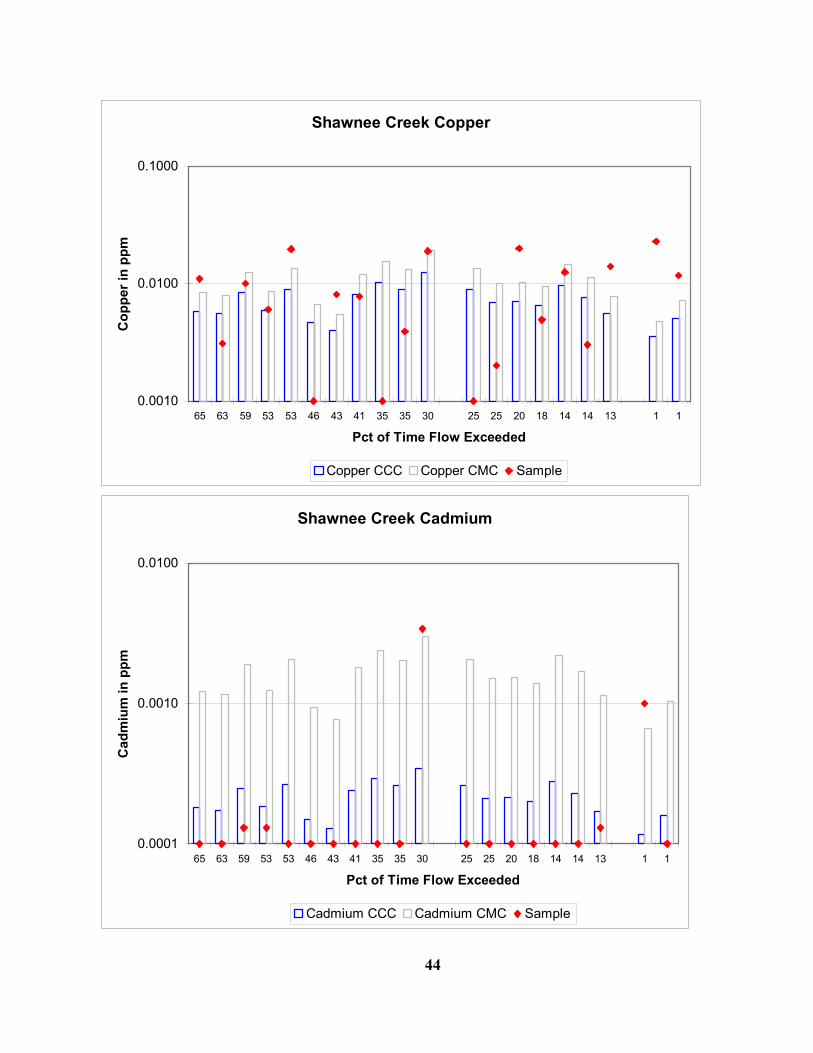
Shawnee Creek Copper
0.0010
0.0100
0.1000
65 63 59 53 53 46 43 41 35 35 30 25 25 20 18 14 14 13 1 1
Pct of Time Flow Exceeded
Cop
per i
n pp
m
Copper CCC Copper CMC Sample
Shawnee Creek Cadmium
0.0001
0.0010
0.0100
65 63 59 53 53 46 43 41 35 35 30 25 25 20 18 14 14 13 1 1
Pct of Time Flow Exceeded
Cad
miu
m in
ppm
Cadmium CCC Cadmium CMC Sample
44

Appendix B-1. Necessary Reductions in Lead Loading to Meet WQS at Various Flows (Blue indicates No Data, Red indicates Load Reduction) Stream 90% Flow Exist Pb Desire Pb Curr Load Des Load Delt Load Pct Redct Baxter Sp 195 0.0055 0.0061 5.7915 6.4233 -0.6318 -10.90909091Shoal C 85 0.0047 0.0056 2.1573 2.5704 -0.4131 -19.14893617Shawnee C 0.09 0.0032Short C 0.001 0.0026 0.0107 1.404E-05 0.00005778 -0.00004374 -311.5384615Turkey C 0.11 0.0028 0.0093 0.0016632 0.0055242 -0.003861 -232.1428571Center C 18 0.0023 0.0076 0.22356 0.73872 -0.51516 -230.4347826Crestline 92 0.0029 0.0061 1.44072 3.03048 -1.58976 -110.3448276 meas sum 195.201 3.8237432 6.34673718 additions -0.201 1.9677568 0.07656282 Stream 75% Flow Exist Pb Desire Pb Curr Load Des Load Delt Load Pct Redct Baxter Sp 348 0.006 0.006 11.2752 11.2752 0 0Shoal C 132 0.0059 0.0054 4.20552 3.84912 0.3564 8.474576271Shawnee C 0.89 0.0032Short C 0.01 0.0077Turkey C 1.1 0.0081Center C 45 0.0069Crestline 168 0.0059 0.0066 5.35248 5.98752 -0.63504 -11.86440678 meas sum 347 9.8118 11.577249 additions 1 1.4634 -0.302049 Stream 50% flow Exist Pb Desire Pb Curr Load Des Load Delt Load Pct Redct Baxter Sp 789 0.0083 0.0058 35.36298 24.71148 10.65150 30.12048174Shoal C 244 0.0078 0.0049 10.27728 6.45624 3.82104 37.17948718Shawnee C 5.7 0.0099 0.0019 0.304722 0.058482 0.24624 80.80808081Short C 1.3 0.0124 0.0061 0.087048 0.042822 0.044226 50.80645161Turkey C 7.2 0.011 0.0087 0.42768 0.338256 0.089424 20.90909091Center C 99 0.0231 0.0068 12.34926 3.63528 8.71398 70.56277056Crestline 390 0.0079 0.0058 16.6374 12.2148 4.4226 26.58227848 meas sum 747.2 40.08339 22.74588 additions 41.8 -0.88587 1.9656 Exist Metal = Upper 90% Confidence Limit around Mean Concentration at each flow condition Desire Metal = Chronic (or Acute for 10% Flows) Criterion using Lower 90% Confidence Limit around Mean Total Hardness at each flow condition
45
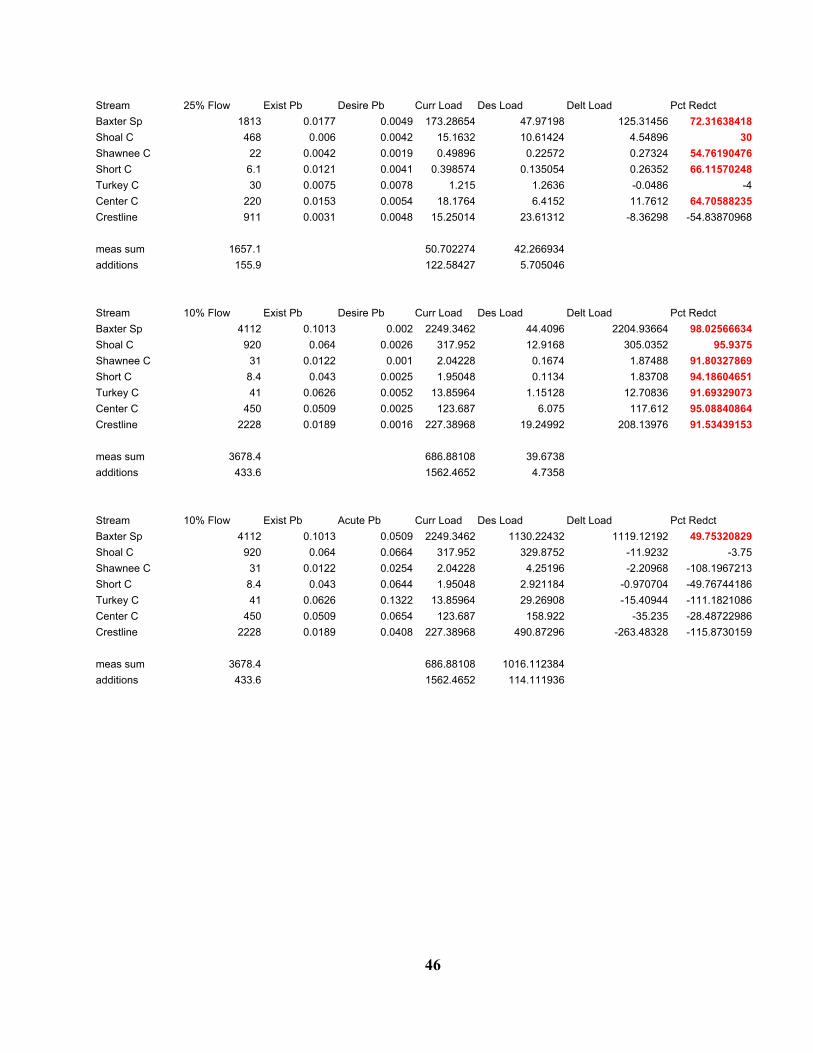
Stream 25% Flow Exist Pb Desire Pb Curr Load Des Load Delt Load Pct Redct Baxter Sp 1813 0.0177 0.0049 173.28654 47.97198 125.31456 72.31638418Shoal C 468 0.006 0.0042 15.1632 10.61424 4.54896 30Shawnee C 22 0.0042 0.0019 0.49896 0.22572 0.27324 54.76190476Short C 6.1 0.0121 0.0041 0.398574 0.135054 0.26352 66.11570248Turkey C 30 0.0075 0.0078 1.215 1.2636 -0.0486 -4Center C 220 0.0153 0.0054 18.1764 6.4152 11.7612 64.70588235Crestline 911 0.0031 0.0048 15.25014 23.61312 -8.36298 -54.83870968 meas sum 1657.1 50.702274 42.266934 additions 155.9 122.58427 5.705046 Stream 10% Flow Exist Pb Desire Pb Curr Load Des Load Delt Load Pct Redct Baxter Sp 4112 0.1013 0.002 2249.3462 44.4096 2204.93664 98.02566634Shoal C 920 0.064 0.0026 317.952 12.9168 305.0352 95.9375Shawnee C 31 0.0122 0.001 2.04228 0.1674 1.87488 91.80327869Short C 8.4 0.043 0.0025 1.95048 0.1134 1.83708 94.18604651Turkey C 41 0.0626 0.0052 13.85964 1.15128 12.70836 91.69329073Center C 450 0.0509 0.0025 123.687 6.075 117.612 95.08840864Crestline 2228 0.0189 0.0016 227.38968 19.24992 208.13976 91.53439153 meas sum 3678.4 686.88108 39.6738 additions 433.6 1562.4652 4.7358 Stream 10% Flow Exist Pb Acute Pb Curr Load Des Load Delt Load Pct Redct Baxter Sp 4112 0.1013 0.0509 2249.3462 1130.22432 1119.12192 49.75320829Shoal C 920 0.064 0.0664 317.952 329.8752 -11.9232 -3.75Shawnee C 31 0.0122 0.0254 2.04228 4.25196 -2.20968 -108.1967213Short C 8.4 0.043 0.0644 1.95048 2.921184 -0.970704 -49.76744186Turkey C 41 0.0626 0.1322 13.85964 29.26908 -15.40944 -111.1821086Center C 450 0.0509 0.0654 123.687 158.922 -35.235 -28.48722986Crestline 2228 0.0189 0.0408 227.38968 490.87296 -263.48328 -115.8730159 meas sum 3678.4 686.88108 1016.112384 additions 433.6 1562.4652 114.111936
46

Appendix B-2. Necessary Reductions in Zinc Loading to Meet WQS at Various Flows
(Blue indicates No Data, Red indicates Load Reduction)
90% Flow Exist Zn Desire Zn Curr Load Des Load Delt Load Pct Redct Stream 195 0.153 0.185 161.109 194.805 -33.696 -20.91503268 Baxter Sp
85 0.11 0.1737 50.49 79.7283 -29.2383 -57.90909091 Shoal C 0.09 0.1198 Shawnee C
0.001 12.1 0.2692 0.06534 0.0014537 0.06388632 97.77520661 Short C 0.11 0.374 0.2453 0.222156 0.1457082 0.0764478 34.41176471 Turkey C
18 0.204 0.2147 19.8288 20.86884 -1.04004 -5.245098039 Center C 92 0.044 0.1841 21.8592 91.46088 -69.60168 -318.4090909 Crestline
195.201 92.514096 192.2634 meas sum
-0.201 68.594904 2.5415953 additions 75% Flow Exist Zn Desire Zn Curr Load Des Load Delt Load Pct Redct Stream
348 0.233 0.1822 437.8536 342.39024 95.46336 21.80257511 Baxter Sp 132 0.126 0.1708 89.8128 121.74624 -31.93344 -35.55555556 Shoal C
0.89 0.1198 Shawnee C 0.01 0.2692 Short C
1.1 0.2453 Turkey C 45 0.2147 Center C
168 0.055 0.199 49.896 180.5328 -130.6368 -261.8181818 Crestline
347 192.63636 356.49852 meas sum 1 245.21724 -14.108278 additions
50% flow Exist Zn Desire Zn Curr Load Des Load Delt Load Pct Redct Stream
789 0.23 0.1784 979.938 760.09104 219.84696 22.43478261 Baxter Sp 244 0.131 0.1603 172.6056 211.21128 -38.60568 -22.36641221 Shoal C 5.7 0.086 0.0843 2.64708 2.594754 0.052326 1.976744186 Shawnee C 1.3 10.93 0.1841 76.7286 1.292382 75.436218 98.31564501 Short C 7.2 0.525 0.2346 20.412 9.121248 11.290752 55.31428571 Turkey C 99 0.495 0.1981 264.627 105.90426 158.72274 59.97979798 Center C
390 0.07 0.1791 147.42 377.1846 -229.7646 -155.8571429 Crestline
747.2 684.44028 707.30852 meas sum 41.8 295.49772 52.782516 additions
47

25% Flow Exist Zn Desire Zn Curr Load Des Load Delt Load Pct Redct Stream
1813 0.262 0.1603 2565.0324 38.816793891569.3691 995.66334 Baxter Sp 468 0.239 0.1448 604.0008 365.93856 238.06224 39.41422594 Shoal C
22 0.065 0.0864 7.722 10.26432 -2.54232 -32.92307692 Shawnee C 6.1 8.281 0.1428 272.77614 4.703832 268.072308 98.27557058 Short C 30 0.689 0.2174 111.618 35.2188 76.3992 68.44702467 Turkey C
220 0.485 0.1708 576.18 202.9104 373.2696 64.78350515 Center C 911 0.061 0.1574 300.0834 774.31356 -474.23016 -158.0327869 Crestline
1657.1 1872.38034 1393.3495 meas sum
155.9 692.65206 176.01959 additions 10% Flow Exist Zn Desire Zn Curr Load Des Load Delt Load Pct Redct Stream
4112 86.620795110.654 0.0875 14521.9392 1942.92 12579.0192 Baxter Sp 76.27272727920 0.44 0.1044 2185.92 518.6592 1667.2608 Shoal C
31 0.116 0.0551 19.4184 9.22374 10.19466 52.5 Shawnee C 8.4 2.642 0.1023 119.84112 4.640328 115.200792 96.12793338 Short C 41 0.917 0.1651 203.0238 36.55314 166.47066 81.99563795 Turkey C
450 0.85 0.1034 2065.5 251.262 1814.238 87.83529412 Center C 58.055555562228 0.18 0.0755 2165.616 908.3556 1257.2604 Crestline
3678.4 6759.31932 1728.694 meas sum
433.6 7762.61988 214.22599 additions
48

Appendix B-3. Necessary Reductions in Copper Loading to Meet WQS at Various Flows (Blue indicates No Data, Red indicates Load Reduction) 90% Flow Exist Cu Desire Cu Curr Load Des Load Delt Load Pct Redct Stream
195 0.0071 0.0145 7.4763 15.2685 -7.7922 -104.22535 Baxter Sp 85 0.0055 0.0136 2.5245 6.2424 -3.7179 -147.27273 Shoal C
0.09 0.0093 Shawnee C 0.001 0.0055 0.0056 0.0000297 3.024E-05 -5.4E-07 -1.8181818 Short C
0.11 0.0029 0.005 0.0017226 0.00297 -0.001247 -72.413793 Turkey C 18 0.0014 0.0043 0.13608 0.41796 -0.28188 -207.14286 Center C 92 0.0149 0.0144 7.40232 7.15392 0.2484 3.3557047 Crestline
195.201 10.0651383 13.8218 meas sum
-0.201 -2.5888383 1.4467 additions 75% Flow Exist Cu Desire Cu Curr Load Des Load Delt Load Pct Redct Stream
348 0.0105 0.0142 19.7316 26.68464 -6.95304 -35.238095 Baxter Sp 132 0.0133 0.0133 9.48024 9.48024 0 0 Shoal C
0.89 0.0093 Shawnee C 0.01 0.0056 Short C
1.1 0.005 Turkey C 45 0.0043 Center C
168 0.0085 0.0144 7.7112 13.06368 -5.35248 -69.411765 Crestline
347 17.553969 23.663518 meas sum 1 2.177631 3.0211218 additions
50% flow Exist Cu Desire Cu Curr Load Des Load Delt Load Pct Redct Stream
789 0.0128 0.0139 54.53568 59.22234 -4.68666 -8.59375 Baxter Sp 244 0.0108 0.0125 14.23008 16.47 -2.23992 -15.740741 Shoal C 5.7 0.011 0.0065 0.33858 0.20007 0.13851 40.9090909 Shawnee C 1.3 0.015 0.0144 0.1053 0.101088 0.004212 4 Short C 7.2 0.018 0.0184 0.69984 0.715392 -0.015552 -2.2222222 Turkey C 99 0.0149 0.0155 7.96554 8.2863 -0.32076 -4.0268456 Center C
390 0.014 0.014 29.484 29.484 0 0 Crestline
747.2 52.82334 55.25685 meas sum 41.8 1.71234 3.96549 additions
49

25% Flow Exist Cu Desire Cu Curr Load Des Load Delt Load Pct Redct Stream 1813 0.012 0.0125 117.4824 122.3775 -4.8951 -4.1666667 Baxter Sp
468 0.014 0.0113 35.3808 28.55736 6.82344 19.2857143 Shoal C 22 0.014 0.0067 1.6632 0.79596 0.86724 52.1428571 Shawnee C
6.1 0.0185 0.0111 0.60939 0.365634 0.243756 40 Short C 30 0.015 0.017 2.43 2.754 -0.324 -13.333333 Turkey C
220 0.015 0.0133 17.82 15.8004 2.0196 11.3333333 Center C 911 0.013 0.0123 63.9522 60.50862 3.44358 5.38461538 Crestline
1657.1 121.85559 108.78197 meas sum
155.9 -4.37319 13.595526 additions 10% Flow Exist Cu Desire Cu Curr Load Des Load Delt Load Pct Redct Stream
4112 0.03 0.0068 666.144 150.99264 515.15136 77.3333333 Baxter Sp 920 0.0126 0.0081 62.5968 40.2408 22.356 35.7142857 Shoal C
31 0.0174 0.0043 2.91276 0.71982 2.19294 75.2873563 Shawnee C 8.4 0.022 0.008 0.99792 0.36288 0.63504 63.6363636 Short C 41 0.0159 0.0129 3.52026 2.85606 0.6642 18.8679245 Turkey C
450 0.018 0.008 43.74 19.44 24.3 55.5555556 Center C 2228 0.0285 0.0059 342.8892 70.98408 271.90512 79.2982456 Crestline
3678.4 456.65694 134.60364 meas sum
433.6 209.48706 16.389 additions 10% Flow Exist Cu Acute Cu Curr Load Des Load Delt Load Pct Redct Stream
4112 0.03 0.0099 666.144 219.82752 446.31648 67 Baxter Sp 920 0.0126 0.012 62.5968 59.616 2.9808 4.76190476 Shoal C
31 0.0174 0.0059 2.91276 0.98766 1.9251 66.091954 Shawnee C 8.4 0.022 0.0117 0.99792 0.530712 0.467208 46.8181818 Short C 41 0.0159 0.02 3.52026 4.428 -0.90774 -25.786164 Turkey C
450 0.018 0.0119 43.74 28.917 14.823 33.8888889 Center C 2228 0.0285 0.0084 342.8892 101.06208 241.82712 70.5263158 Crestline
3678.4 456.65694 195.54145 meas sum
433.6 209.48706 24.286068 additions
50
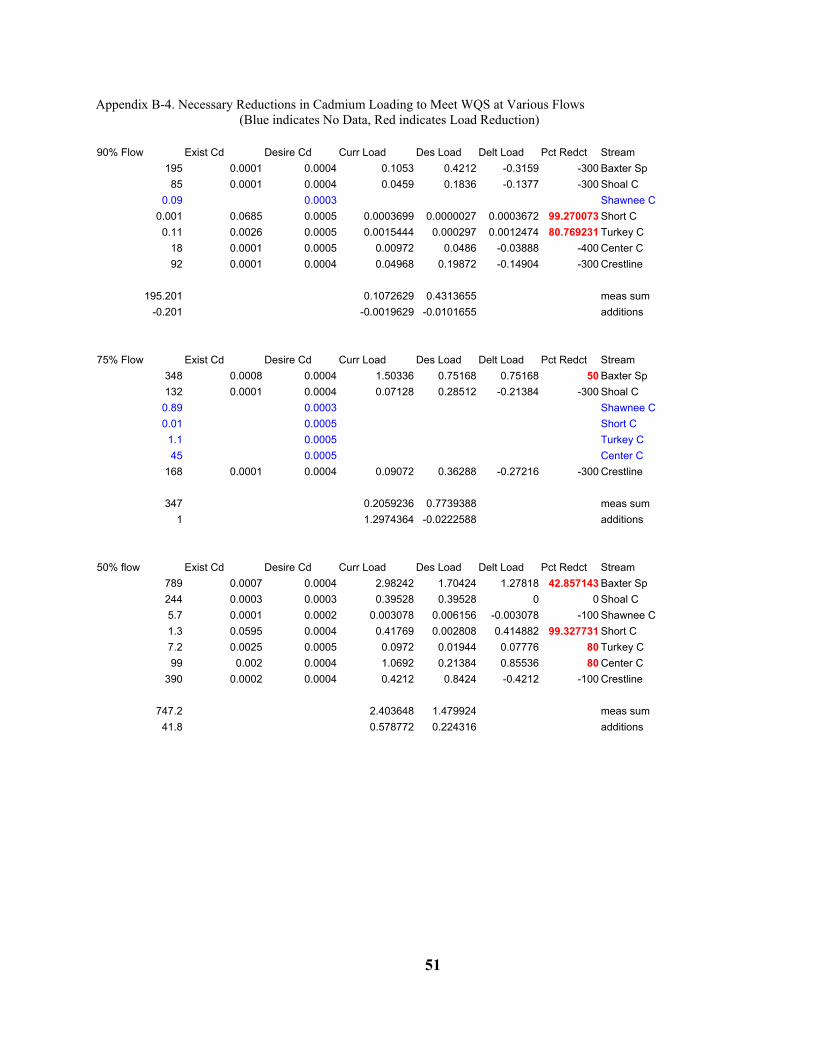
Appendix B-4. Necessary Reductions in Cadmium Loading to Meet WQS at Various Flows (Blue indicates No Data, Red indicates Load Reduction) 90% Flow Exist Cd Desire Cd Curr Load Des Load Delt Load Pct Redct Stream
195 0.0001 0.0004 0.1053 0.4212 -0.3159 -300 Baxter Sp 85 0.0001 0.0004 0.0459 0.1836 -0.1377 -300 Shoal C
0.09 0.0003 Shawnee C 0.001 0.0685 0.0005 0.0003699 0.0000027 0.0003672 99.270073 Short C
0.11 0.0026 0.0005 0.0015444 0.000297 0.0012474 80.769231 Turkey C 18 0.0001 0.0005 0.00972 0.0486 -0.03888 -400 Center C 92 0.0001 0.0004 0.04968 0.19872 -0.14904 -300 Crestline
195.201 0.1072629 0.4313655 meas sum
-0.201 -0.0019629 -0.0101655 additions 75% Flow Exist Cd Desire Cd Curr Load Des Load Delt Load Pct Redct Stream
348 0.0008 0.0004 1.50336 0.75168 0.75168 50 Baxter Sp 132 0.0001 0.0004 0.07128 0.28512 -0.21384 -300 Shoal C
0.89 0.0003 Shawnee C 0.01 0.0005 Short C
1.1 0.0005 Turkey C 45 0.0005 Center C
168 0.0001 0.0004 0.09072 0.36288 -0.27216 -300 Crestline
347 0.2059236 0.7739388 meas sum 1 1.2974364 -0.0222588 additions
50% flow Exist Cd Desire Cd Curr Load Des Load Delt Load Pct Redct Stream
789 0.0007 0.0004 2.98242 1.70424 1.27818 42.857143 Baxter Sp 244 0.0003 0.0003 0.39528 0.39528 0 0 Shoal C 5.7 0.0001 0.0002 0.003078 0.006156 -0.003078 -100 Shawnee C 1.3 0.0595 0.0004 0.41769 0.002808 0.414882 99.327731 Short C 7.2 0.0025 0.0005 0.0972 0.01944 0.07776 80 Turkey C 99 0.002 0.0004 1.0692 0.21384 0.85536 80 Center C
390 0.0002 0.0004 0.4212 0.8424 -0.4212 -100 Crestline
747.2 2.403648 1.479924 meas sum 41.8 0.578772 0.224316 additions
51

25% Flow Exist Cd Desire Cd Curr Load Des Load Delt Load Pct Redct Stream 1813 0.0007 0.0003 6.85314 2.93706 3.91608 57.142857 Baxter Sp
468 0.0003 0.0003 0.75816 0.75816 0 0 Shoal C 22 0.0001 0.0002 0.01188 0.02376 -0.01188 -100 Shawnee C
6.1 0.0595 0.0003 1.95993 0.009882 1.950048 99.495798 Short C 30 0.0025 0.0005 0.405 0.081 0.324 80 Turkey C
220 0.002 0.0004 2.376 0.4752 1.9008 80 Center C 911 0.0002 0.0003 0.98388 1.47582 -0.49194 -50 Crestline
1657.1 6.49485 2.823822 meas sum
155.9 0.35829 0.113238 additions 10% Flow Exist Cd Desire Cd Curr Load Des Load Delt Load Pct Redct Stream
4112 0.0007 0.0002 15.54336 4.44096 11.1024 71.428571 Baxter Sp 920 0.0003 0.0002 1.4904 0.9936 0.4968 33.333333 Shoal C
31 0.0001 0.0001 0.01674 0.01674 0 0 Shawnee C 8.4 0.0595 0.0002 2.69892 0.009072 2.689848 99.663866 Short C 41 0.0025 0.0005 0.5535 0.1107 0.4428 80 Turkey C
450 0.002 0.0002 4.86 0.486 4.374 90 Center C 2228 0.0002 0.0002 2.40624 2.40624 0 0 Crestline
3678.4 12.0258 4.022352 meas sum
10% Flow Exist Cd Acute Cd Curr Load Des Load Delt Load
C wnee C
0.002 4.86 4.374 0.4860.0002
28.655748 meas sum
433.6 3.51756 0.418608 additions
Pct Redct Stream 4112 0.0007 0.0015 15.54336 33.3072 -17.76384 -114.2857 Baxter Sp
920 0.0003 0.0018 1.4904 8.9424 -7.452 -500 Shoal 31 0.0001 0.0008 0.01674 0.13392 -0.11718 -700 Sha
8.4 0.0595 0.0018 2.69892 0.081648 2.617272 96.97479 Short C 41 0.0025 0.0031 0.5535 0.68634 -0.13284 -24 Turkey C
450 0.0018 10 Center C 2228 0.0012 2.40624 14.43744 -12.0312 -500 Crestline
3678.4 12.0258
433.6 3.51756 4.651452 additions
52

Appendix C-1. Value Scoring of Lead Sample Magnitude, Frequency and Duration
Lead 90% 75% 50% 25% 10% Baxter Magnitude 0 0 1 4 2 Baxter Frequency 1 1 3 2 3 Baxter Duration 1 2 4 3 1 Baxter Cumulative Score 2 3 9 9 6 Shoal Magnitude 0 0 2 1 0 Shoal Frequency 1 2 2 2 3
1 1 2 Shoal Cumulative Score 2 3 8 4 5
Shawnee Magnitude 4 3 0 Shawnee Frequency 3 2 3 Shawnee Duration 2 1 0 Shawnee Cumulative Score 9 6 0 Short Magnitude 0 3 4 0 Short Frequency 0 3 3 0 Short Duration 0 2 1 0 Short Cumulative Score 0 8 8 0 Turkey Magnitude 0 1 0 0
0 2 1 0 Turkey Duration 0 1 0 0 Turkey Cumulative Score 0 4 1 0
4 3 0 Center Frequency 0 3 3 3 Center Duration 0 3 1 0 Center Cumulative Score 0 10 7 3 Crestline Magnitude 0 0 1 2 0 Crestline Frequency 0 0 1 0 0 Crestline Duration 0 0 1 0 0 Crestline Cumulative Score 0 0 3 2 0
Center Magnitude 0
Turkey Frequency
Shoal Duration 4 1
53

Appendix C-2. Value Scoring of Zinc Sample Magnitude, Frequency and Duration Zinc 90% 75% 50% 25% 10% Baxter Magnitude 0 1 1 2 4 Baxter Frequency 1 3 2 3 3 Baxter Duration 1 3 4 4 2 Baxter Cumulative Score 2 7 7 9
Shoal Magnitude 1
3
1
4 4 4
Short Frequency 3 3 3 3 Short Duration 1 4 2 0 Short Cumulative Score
9
7 11 9 7 Turkey Magnitude 2 3 4 4 Turkey Frequency 3 3 3 3 Turkey Duration 1 4 2 1 Turkey Cumulative Score 6 10 9 8 Center Magnitude 0 3 3 4 Center Frequency 3 3 3 3 Center Duration 0 4 2 1 Center Cumulative Score 3 10 8 8
0 0 3 Crestline Frequency 0 1 1 0 3 Crestline Duration 0 1 1 0 2 Crestline Cumulative Score 0 2 2 0 7
0 0 0 2 4
Shoal Frequency 0 1 3 3 Shoal Duration 0 1 1 2 Shoal Cumulative Score 0 2 2 8 9 Shawnee Magnitude 0 0 3 Shawnee Frequency 1 3 Shawnee Duration 1 0 1 Shawnee Cumulative Score 2 1
4
7
Short Magnitude
Crestline Magnitude 0 0
54

Appendix C-3. Value Scoring of Copper Sample Magnitude, Frequency and Duration
Copper 90% 75% 50% 25% 10% Baxter Magnitude 0 0 0 0 4 Baxter Frequency 0 0 1 2 3 Baxter Duration 0 1 1 2 1 Baxter Cumulative Score 0 1 2 4 8 Shoal Magnitude 0 0 0 1 0 Shoal Frequency 1 2 2 2 2 Shoal Duration 0 1 3 2 1 Shoal Cumulative Score 1 3 5 5 3 Shawnee Magnitude 2 3 4 Shawnee Frequency 3 2 3 Shawnee Duration 2 1 1 Shawnee Cumulative Score 7 6 8 Short Magnitude 0 0 2 2 Short Frequency 0 2 3 3 Short Duration 0 1 2 0 Short Cumulative Score 0 3 7 5
0 0 0 0 Turkey Frequency 0 1 1 3 Turkey Duration 0 1 2 0 Turkey Cumulative Score 0 2 1 3
0 0 1 1 0 2 2 3
Center Duration 0 1 1 1 0 3 4 5 0 0 0 0 4
Crestline Frequency 1 1 1 1 3 Crestline Duration 1 1 2 1 1 Crestline Cumulative Score 2 2 3 2 8
Turkey Magnitude
Center Magnitude Center Frequency
Center Cumulative Score Crestline Magnitude
55

56
Appendix C-4. Value Scoring of Cadmium Sample Magnitude, Frequency and Duration
Cadmium 90% 75% 50% 25% 10% Baxter Magnitude 0 0 2 1 3 Baxter Frequency 0 2 2 1 3 Baxter Duration 0 2 3 1 2 Baxter Cumulative Score 0 4 7 3 8 Shoal Magnitude 0 0 0 0 2 Shoal Frequency 0 0 1 1 3 Shoal Duration 0 0 2 1 1 Shoal Cumulative Score 0 0 3 2 6 Shawnee Magnitude 0 0 0 Shawnee Frequency 0 0 3 Shawnee Duration 0 0 0 Shawnee Cumulative Score 0 0 3 Short Magnitude 4 4 4 4 Short Frequency 3 3 3 3 Short Duration 1 4 2 0 Short Cumulative Score 8 11 9 7 Turkey Magnitude 4 4 4 3 Turkey Frequency 3 3 3 2 Turkey Duration 1 4 2 1 Turkey Cumulative Score 8 11 9 6 Center Magnitude 4 0 4 4 Center Frequency 0 3 3 3 Center Duration 0 4 2 1 Center Cumulative Score 0 11 9 8 Crestline Magnitude 0 0 0 0 0 Crestline Frequency 0 0 0 0 0 Crestline Duration 0 0 1 0 0 Crestline Cumulative Score 0 0 0 0 1