total maximum daily load (tmdl) for … maximum daily load (tmdl) for phosphorus in palmer lake ......
TRANSCRIPT

Total Maximum Daily Load (TMDL) for Phosphorus in Palmer Lake
Towns of Kent & Carmel
Putnam County, New York
March 2015
Prepared for:
U.S. Environmental Protection Agency
Region 2
290 Broadway
New York, NY 10007
Prepared by:
New York State
Department of Environmental Conservation
Division of Water

2
TABLE OF CONTENTS
1.0 INTRODUCTION ............................................................................................................ 4
1.1. Background ............................................................................................................... 4
1.2. Problem Statement .................................................................................................... 4
2.0 WATERSHED AND LAKE CHARACTERIZATION .................................................. 5
2.1. Watershed Characterization ...................................................................................... 5
2.2. Lake Morphometry ................................................................................................... 9
2.3. Water Quality ............................................................................................................ 9
3.0 NUMERIC WATER QUALITY TARGET ..................................................................... 9
4.0 SOURCE ASSESSMENT ............................................................................................. 10
4.1. Analysis of Phosphorus Contributions .................................................................... 10
4.2. Sources of Phosphorus Loading .............................................................................. 10
5.0 DETERMINATION OF LOAD CAPACITY ................................................................ 15
5.1. Lake Modeling Using the BATHTUB Model ......................................................... 15
5.2. Linking Total Phosphorus Loading to the Numeric Water Quality Target ............. 15
6.0 POLLUTANT LOAD ALLOCATIONS ....................................................................... 17
6.1 Wasteload Allocation (WLA) ....................................................................................... 17
6.2. Load Allocation (LA) ........................................................................................... 20
6.3. Margin of Safety (MOS) ............................................................................................. 21
6.4. Critical Conditions .................................................................................................. 21
3
6.5. Seasonal Variations ................................................................................................. 21
7.0 IMPLEMENTATION .................................................................................................... 24
7.1. Reasonable Assurance for Implementation ............................................................. 24
7.2. Follow-up Monitoring ............................................................................................. 37
8.0 PUBLIC PARTICIPATION .......................................................................................... 37
APPENDIX A. MAPSHED MODELING ANALYSIS ........................................................ 51
APPENDIX B. BATHTUB MODELING ANALYSIS Model Overview ............................... 64
APPENDIX C. TOTAL EQUIVALENT DAILY PHOSPHORUS LOAD ALLOCATIONS 69
4
1.0 INTRODUCTION
1.1. Background
In April of 1991, the United States Environmental Protection Agency (EPA) Office of Water’s Assessment and Protection Division published “Guidance for Water Quality-based Decisions: The Total Maximum Daily Load (TMDL) Process” (USEPA 1991). In July 1992, EPA published the final “Water Quality Planning and Management Regulation” (40 CFR Part 130). Together, these documents describe the roles and responsibilities of EPA and the states in meeting the requirements of Section 303(d) of the Federal Clean Water Act (CWA) as amended by the Water Quality Act of 1987, Public Law 100-4. Section 303(d) of the CWA requires each state to identify those waters within its boundaries not meeting water quality standards for any given pollutant applicable to the water’s designated uses.
Further, Section 303(d) requires EPA and states to develop TMDLs for all pollutants violating or causing violation of applicable water quality standards for each impaired waterbody. A TMDL determines the maximum amount of pollutant that a waterbody is capable of assimilating while continuing to meet water quality standards. An allowable pollutant load is established for all the point and nonpoint sources of pollution that cause the impairment at levels necessary to meet the applicable standards with consideration given to seasonal variations and margin of safety. TMDLs provide the framework that allows states to establish and implement pollution control and management plans with the ultimate goal indicated in Section 101(a)(2) of the CWA: “water quality which provides for the protection and propagation of fish, shellfish, and wildlife, and recreation in and on the water, wherever attainable” (USEPA, 1991a).
1.2. Problem Statement
Palmer Lake (WI/PWL ID 1302-0103) is situated in the Towns of Kent and Carmel, in Putnam County, New York. In recent decades, the lake has experienced degraded water quality that has reduced the lake’s recreational and aesthetic value. Palmer Lake was listed on the Lower Hudson River Basin Priority Waterbody List (PWL) in 2011, with public bathing listed as stressed, and recreation listed as impaired, both uses due to algal/weed growth and nutrients (phosphorus). (NYS DEC, 5/18/2011)
A variety of sources of phosphorus are contributing to the degraded water quality in Palmer
Lake. In general, sources of phosphorous that impact water quality include septic systems, stormwater runoff, agricultural operations, wastewater treatment plants, atmospheric deposition, groundwater and lake sediment resuspension. Nutrients are then deposited and stored in the lake bottom sediments. Phosphorus is often the limiting nutrient in temperate lakes and ponds and can be thought of as a fertilizer; when lakes receive excess phosphorus, this nutrient “fertilizes” the lake by feeding the algae. Too much phosphorus can result in algae blooms, which can damage the ecology and aesthetic quality of a lake, as well as the economic well-being of the surrounding community.

5
The results from state sampling efforts confirm eutrophic (highly nutrient enriched)
conditions in Palmer Lake, with the concentration of phosphorus in the lake exceeding the state guidance value for phosphorus (20 µg/L or 0.020 mg/L, applied as the average summer total phosphorus concentration), which increases the potential for nuisance summertime algae blooms. (Results from NYSDEC sampling events are found in Figure 6.) In 2012, Palmer Lake was added to the New York State Department of Environmental Conservation (NYS DEC) CWA Section 303(d) list of impaired waterbodies that do not meet water quality standards due to excessive phosphorus levels (NYS DEC, July 2012). To address this impairment, a TMDL for phosphorus is being developed for the lake.
2.0 WATERSHED AND LAKE CHARACTERIZATION
2.1. Watershed Characterization
Palmer Lake has a direct watershed area of 460 acres (186 ha) excluding the surface area of the lake and other water bodies (Figure 1). Elevations in the lake’s basin range from approximately 935 feet above mean sea level (AMSL) to 586 feet AMSL at the surface of Palmer Lake. Palmer Lake and its watershed are bisected by the Kent/Carmel town line. The watershed is part of the larger Croton Watershed, which contributes to the system of reservoirs providing the City of New York with a portion of their drinking water.
Existing land use and land cover in the Palmer Lake watershed was determined from digital aerial photography and geographic information system (GIS) datasets, and field-verified by Department staff. Digital land use/land cover data were obtained from the most recent (2006) National Land Cover Dataset. The NLCD is a consistent representation of land cover for the conterminous United States generated from classified 30-meter resolution Landsat thematic mapper satellite imagery data. D a t a f r o m f i e l d i n v e s t i g a t i o n s a n d h igh-resolution color orthophotos were used to manually update and refine land use categories for portions of the watershed to reflect current conditions in the watershed (Figure 2). Appendix A provides additional detail about the refinement of land use for the watershed. Land use categories (including individual category acres and percent of total) in Palmer Lake’s watershed are listed in Table 1 and presented in Figures 3 and 4.

6
Figure 1. Palmer Lake Direct Watershed

7
Figure 2. Aerial Image of Palmer Lake

8
Table 1. Land Use Acreage in Palmer Lake Watershed
Figure 3. Percent Land Use in Palmer Lake Watershed
Figure 4. Land Use in Palmer Lake Watershed
Land Use Category
Acres % of Drainage Basin
Open Space 35 7.6% Developed Land 180 39.1% Forest 245 53.3%
TOTAL 460 100%

9
2.2. Lake Morphometry
Palmer Lake is a 14-acre waterbody at an elevation of 586 feet AMSL (above mean sea level) which discharges into Michael Brook, a tributary to the NYC Croton Falls Reservoir.
Table 2. Palmer Lake Characteristics
Surface Area 14 ac. Elevation 586 ft Mean Depth 4 ft Length 2,450 ft Width at widest point 625 ft Shoreline perimeter 8,645 ft Direct Drainage Area 460 ac. Watershed: Lake Ratio 33:1 Mass Residence Time 16 days Hydraulic Residence Time 19 days
2.3. Water Quality
Figure 6 shows the summer phosphorus concentrations from surface samples collected during NYSDEC sampling seasons. As depicted on the graphs, Palmer Lake exceeded the 20 ug/L phosphorous guidance value in nearly every sample collected during both sampling years (2010 and 2013), and summer mean phosphorus levels greatly exceeded this guidance value in both years. In 2010 the values ranged from 18 to 36 ug/l. In 2013 the values ranged from 23 to 110 ug/l.
3.0 NUMERIC WATER QUALITY TARGET
The TMDL target is a numeric endpoint specified to represent the level of acceptable water quality that is to be achieved by implementing the TMDL. The water quality classification for Palmer Lake is Class B, corresponding to primary and secondary contact recreation and fishing as best usages of the lake. All classifications of lakes must also be suitable for fish propagation and survival. New York State has a narrative standard for nutrients: “none in amounts that will result in growths of algae, weeds and slimes that will impair the waters for their best usages” (6 NYSCRR Part 703.2). As part of its Technical and Operational Guidance Series (TOGS 1.1.1 and accompanying fact sheet, NYS, 1993), the Department has determined that for ponded waters (i.e., lakes, reservoirs and ponds, excluding Lakes Erie, Ontario, and Champlain), the epilimnetic (surface) summer mean total phosphorus level shall not exceed 20 µg/L (or 0.02 mg/L), based on biweekly sampling, conducted from June through September. This guidance value of 20 µg/L is the TMDL target for Palmer Lake.

10
Figure 6. Summer Mean Epilimnetic Total Phosphorus Levels in Palmer Lake
4.0 SOURCE ASSESSMENT
4.1. Analysis of Phosphorus Contributions
The MapShed watershed runoff model and the BATHTUB lake response model were used together to develop the Palmer Lake TMDL. This approach used MapShed to model mean annual phosphorus loading to the lake, and BATHTUB to define the extent to which the phosphorus load must be reduced to meet the water quality target.
MapShed incorporates an enhanced version of the Generalized Watershed Loading Function (GWLF) model developed by Haith and Shoemaker (1987) and the RUNQUAL model also developed by Haith (1993). GWLF and RUNQUAL simulate runoff and stream flow by a water- balance method based on measurements of daily precipitation and average temperature. The complexity of the two models falls between that of detailed, process-based simulation models and simple export coefficient models that do not represent temporal variability. The enhanced GWLF model within MapShed is appropriate for this TMDL analysis because it simulates the important processes of concern, but does not have onerous data requirements for calibration. MapShed was developed to facilitate the use of the GWLF and RUNQUAL models via a MapWindow interface (Evans, 2009). Appendix A discusses the setup, calibration, and use of the MapShed model for lake TMDL assessments in New York.
4.2. Sources of Phosphorus Loading
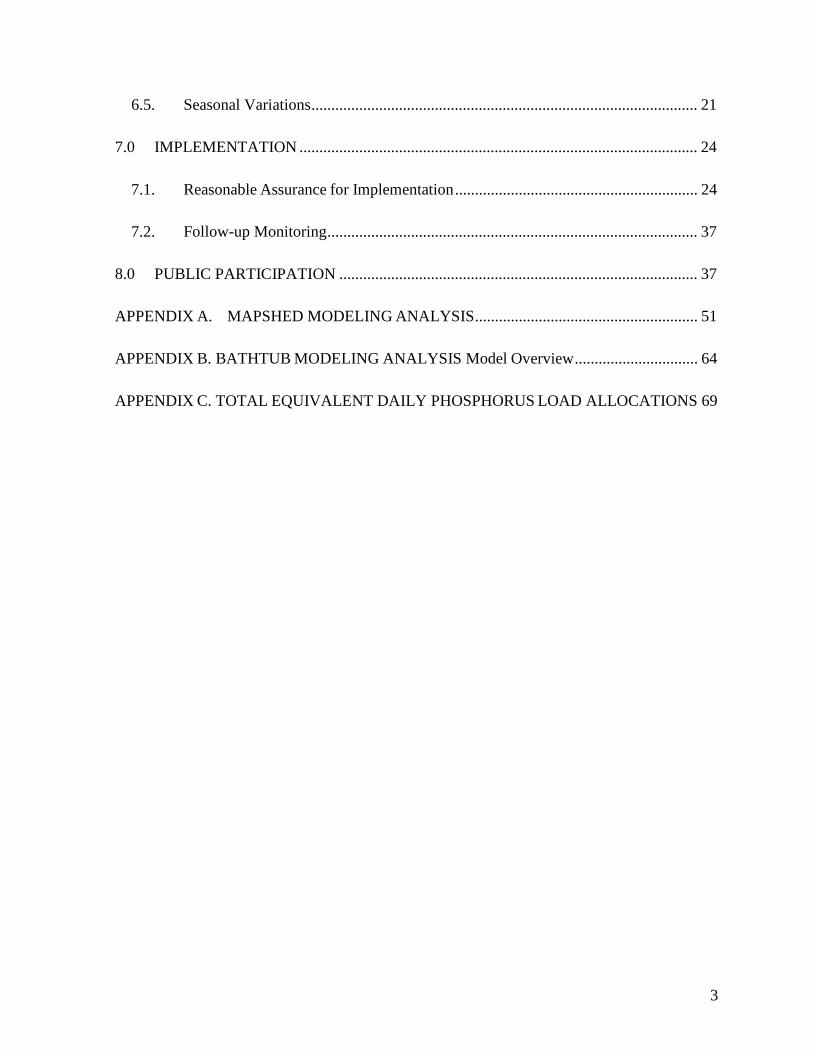
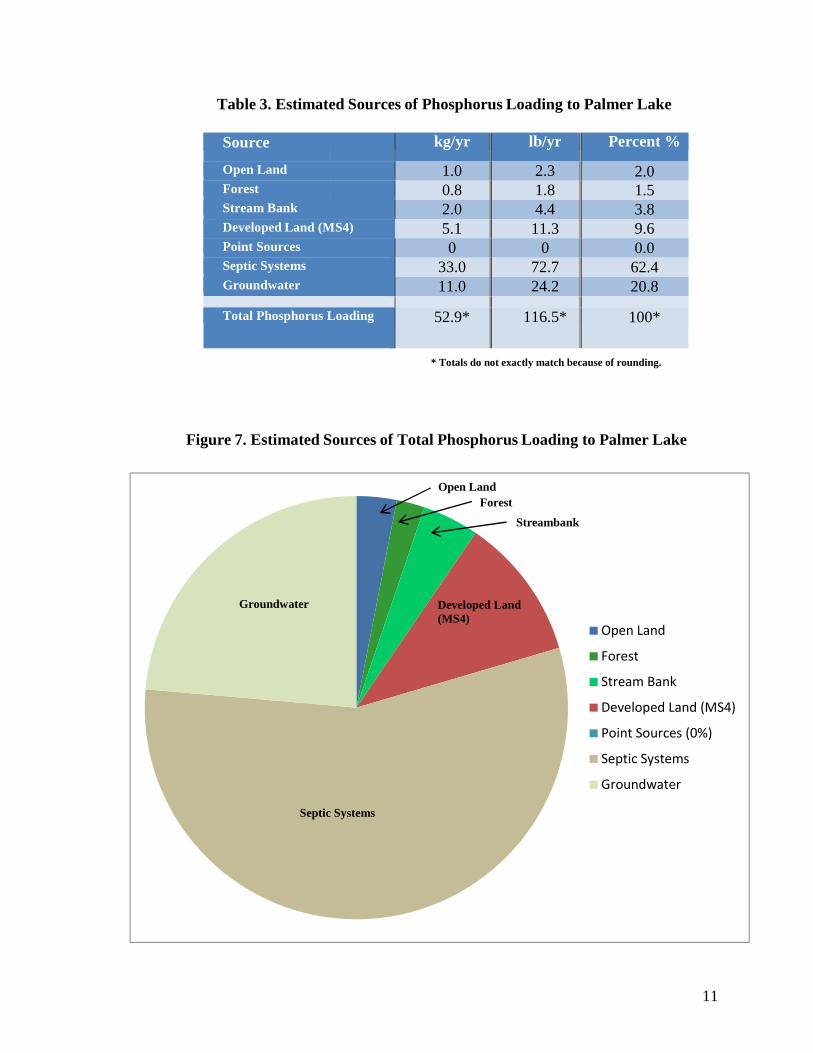
MapShed was used to estimate long-term (1990-2013) mean annual phosphorus external loading to Palmer Lake. The estimated mean annual external load of 52.9 kg/yr (116.5 lb/yr) of total phosphorus that enters Palmer Lake originates from the sources listed in Table 3 and shown in Figure 7. Appendix A provides additional Mapshed model data.
2010 2013
11
Open Land
Forest
Stream Bank
Developed Land (MS4)
Point Sources (0%)
Septic Systems
Groundwater
Table 3. Estimated Sources of Phosphorus Loading to Palmer Lake
Source kg/yr lb/yr Percent %
Open Land 1.0 2.3 2.0 Forest 0.8 1.8 1.5 Stream Bank 2.0 4.4 3.8 Developed Land (MS4)
5.1 11.3 9.6 Point Sources 0 0 0.0 Septic Systems 33.0 72.7 62.4 Groundwater 11.0 24.2 20.8 Total Phosphorus Loading 52.9* 116.5* 100*
* Totals do not exactly match because of rounding.
Figure 7. Estimated Sources of Total Phosphorus Loading to Palmer Lake
Groundwater Developed Land (MS4)
Streambank Forest
Open Land
Septic Systems

12
4.2.1. Residential On-Site Septic Systems
Residential on-site septic systems contribute an estimated 33.0 kg/yr (72.7 lb/yr) of phosphorus to Palmer Lake, which is 62% of the total loading to the lake. Residential septic systems contribute dissolved phosphorus to nearby waterbodies due to leach field saturation and system malfunctioning. Septic systems treat human waste using a collection system that discharges liquid waste into the soil through a series of distribution lines that comprise the drain field. In properly functioning (normal) systems, phosphates are adsorbed and retained by the soil as the effluent percolates through the soil to the shallow saturated zone. Therefore, normal systems contribute very little phosphorus loading to nearby waterbodies. A ponding septic system malfunction occurs when there is a discharge of waste to the soil surface (where it is available for runoff); as a result, malfunctioning septic systems can contribute high phosphorus loads to nearby waterbodies. Short-circuited systems (those systems that, due to close proximity to surface waters and shallow depth to groundwater) also contribute significant phosphorus loads; septic systems within 250 feet of the lake are subject to potential short-circuiting, with those closer to the lake more likely to contribute greater loads. Additional details about the process for estimating the population served by normal and malfunctioning systems within the lake watershed is provided in Appendix A.
There are 250 homes in the Palmer Lake Watershed, with many of the houses originally built for summer residency. According to Putnam County Department of Health records, many of the homes have constructed additions, including the addition of bedrooms and bathrooms, and kitchen renovations including washing machines and dishwashers that discharge into their septic systems. No information on septic system upgrades that may have accompanied these type of renovations is available for expansions occurring prior to 1989.
According to the USGS Soil Survey, the soils surrounding the lake itself are primarily Chatfield-Charlton complex. The soils comprising this complex vary in permeability and depth to restrictive features. Charlton loam is “well drained” with “more than 80 inches” to a restrictive feature. Chatfield soils are also “well drained”, however, they have “20 to 40 inches to lithic bedrock.” The New York State Department of Health requires septic systems designed for new houses to have a minimum of two feet separation from restrictive features from the bottom of conventional absorption trenches. Where soils have shallow depth to lithic bedrock, septic system leach fields may contribute to septic failure and subsequent nutrient loading to the lake. Finally, many of the septic systems are located too close to the lake to meet current health standards or codes, are undersized, and inadequate area exists for leach fields.
Analysis of satellite imagery for the basin shows 4 houses w i th in 50 fee t and 26 houses within 50- 250 feet of the shoreline; all of the houses are assumed to have septic systems. Within 50-250 feet of the shoreline, 25% of septic systems were categorized as short- circuiting, 15% were categorized as ponding systems, and 60% were categorized as normal systems. These percentages were established based on the Department’s experience with other lake TMDLs. All the houses within 50 feet of the shoreline are categorized as short-circuiting. Approximately 90% of the homes around the lake are estimated to be year-round

13
residences, while 10% are seasonally occupied (i.e., June through August only). To convert the estimated number of septic systems to population served, an average household size of 2.6 people per dwelling was used based on the circa 2010 USCB census estimate for number of persons per household in New York State. The estimated population in the Palmer Lake watershed served by normal and malfunctioning or deficient systems is summarized in Table 4.
Table 4. Population Served by Septic Systems in the Palmer Lake Watershed
Normally Functioning Ponding Short Circuiting Total September – May 543 9 35 587
June – August (Summer) 603 10 39 652
4.2.2. Urban and Residential Development Runoff
Developed land comprises 180 acres (39%) of the lake watershed. Stormwater runoff from developed land contributes 5.1 kg/yr (11.3 lb/yr) of phosphorus to Palmer Lake, which is 10% of the total phosphorus loading to the lake. This load does not account for contributions from malfunctioning septic systems. 100% of the developed land in the basin resides within a permitted Municipal Separate Storm Sewer System (MS4).
In addition to the contribution of phosphorus to the lake from overland urban runoff, additional phosphorus originating from developed lands is leached in dissolved form from the surface and transported to the lake through subsurface movement via groundwater. The process for estimating subsurface delivery of phosphorus originating from developed land is discussed in the Groundwater Seepage section (below).
Phosphorus runoff from developed areas originates primarily from human activities, and is more readily mobilized and carried to nearby waterbodies from developed impervious surfaces during storm events. Shoreline development, in particular, can have a large phosphorus loading impact to nearby waterbodies in comparison to its relatively small percentage of the total land area in the watershed.
4.2.3. Forest Land Runoff
Forested land comprises 245 acres (53 %) of the lake watershed. Runoff from forested land is estimated to contribute about 0.8 kg/yr (1.8 lb/yr) of phosphorus loading to Palmer Lake, which is about 1.5 % of the total phosphorus loading to the lake. Phosphorus contribution from forested land is considered a component of background loading.
The Kent Manor Condominiums project proposal demonstrated no increase in phosphorus loading due to that proposed change in land use. The existing land use (the no-build condition) phosphorus export coefficient was used as a baseline and runoff treated by the BMPs in the built-out condition was shown to exhibit no increased phosphorus loading and therefore the phosphorous loading to Palmer Lake is unchanged from this conversion of forested land to developed land.

14
The Kent Manor Stormwater Pollution Prevention Plan meets or exceeds the requirements of the SPDES General Permit for Stormwater Discharges from Construction Activity (the SWPPP was evaluated for compliance with GP-02-01).
In addition to the contribution of phosphorus to the lake from overland forest land runoff, additional phosphorus originating from forest lands is leached in dissolved form from the surface and transported to the lake through subsurface movement via groundwater. The process for estimating subsurface delivery of phosphorus originating from forest land is discussed in the Groundwater Seepage section (below).
4.2.4. Groundwater Seepage
In addition to nonpoint sources of phosphorus delivered to the lake by surface runoff, a portion of the phosphorus loading from nonpoint sources seeps into the ground and is transported to the lake via groundwater. Groundwater is estimated to transport about 11.0 kg/yr (24.2 lb/yr) of the total phosphorus load to Palmer Lake (25%). With respect to groundwater, there is typically a small “background” concentration owing to various natural sources. In the Palmer Lake watershed, the model-estimated groundwater phosphorus concentration is 0.01 mg/L. The GWLF manual provides estimated background groundwater phosphorus concentrations for ≥90% forested land in the eastern United States, which is 0.006 mg/L. Consequently, about 60% of the groundwater load can be attributed to natural sources, including forested land and soils.
The remaining amount of the groundwater phosphorus load likely originates from developed land sources (i.e., leached in dissolved form from the surface). Table 5 summarizes this information.
Table 5. Sources of Phosphorus Transported in the Subsurface via Groundwater
Total Phosphorus
(kg/yr) Total Phosphorus
(lb/yr) % of Total Groundwater
Load
Natural Sources 6.6 14.5 60%
Developed Land 4.4 9.7 40%
TOTAL 11.0 24.2 100%
15
4.2.5. Open Land Runoff
Open land that is not developed accounts for 1.0 kg/yr (2.3 lb/yr) of phosphorus loading. This land was originally identified on land use shape files as pasture, and was field verified and then revised to open, undeveloped land.
4.2.6. Other Sources
Atmospheric deposition, wildlife, waterfowl, and domestic pets are also potential sources of phosphorus loading to the lake. All of these small sources of phosphorus are incorporated into the land use loadings as identified in the TMDL analysis (and therefore accounted for). Further, the deposition of phosphorus from the atmosphere over the surface of the lake is accounted for in the lake model, though it is small in comparison to the external loading to the lake.
5.0 DETERMINATION OF LOAD CAPACITY
5.1. Lake Modeling Using the BATHTUB Model
BATHTUB was used to define the relationship between phosphorus loading to the lake and the resulting concentrations of total phosphorus in the lake. The U.S. Army Corps of Engineers’ BATHTUB model predicts eutrophication-related water quality conditions (e.g., phosphorus, nitrogen, chlorophyll a, and transparency) using empirical relationships previously developed and tested for reservoir applications (Walker, 1987). BATHTUB performs steady-state water and nutrient balance calculations in a spatially segmented hydraulic network. Appendix B discusses the setup, calibration, and use of the BATHTUB model.
5.2. Linking Total Phosphorus Loading to the Numeric Water Quality Target
In order to estimate the loading capacity of the lake, simulated phosphorus loads from MapShed were used to drive the BATHTUB model to simulate water quality in Palmer Lake. MapShed was used to derive a mean annual phosphorus loading to the lake for the period 1990-2013. Using this load as input, BATHTUB was used to simulate water quality in the lake. The results of the BATHTUB simulation were compared against the average of the lake’s observed summer mean phosphorus concentrations for the years 2010 and 2013. Year-specific loading was also simulated with MapShed, run through BATHTUB, and compared against the observed summer mean phosphorus concentration for years with observed in-lake data. The combined use of MapShed and BATHTUB provides a good fit to the observed data for Palmer Lake (Figure 8).

16
Figure 8. Observed vs. Modeled Summer Mean Epilimnetic Total Phosphorus Concentrations (µg/L) in Palmer Lake
The BATHTUB model was used as a “diagnostic” tool to derive the total phosphorus load
reduction required to achieve the phosphorus target of 20 µg/L. The loading capacity of Palmer Lake was determined by running BATHTUB iteratively, reducing the concentration of the watershed phosphorus load until model results demonstrated attainment of the water quality target. The maximum concentration that results in compliance with the TMDL target for phosphorus is used as the basis for determining the lake’s loading capacity. This concentration is converted into a loading rate using simulated flow from MapShed.
The maximum annual phosphorus load (i.e., the annual TMDL) that will maintain
compliance with the phosphorus water quality goal of 20 µg/L in Palmer Lake is a mean
0.0
10.0
20.0
30.0
40.0
50.0
60.0
70.0
19
90
19
91
19
92
19
93
19
94
19
95
19
96
19
97
19
98
19
99
20
00
20
01
20
02
20
03
20
04
20
05
20
06
20
07
20
08
20
09
20
10
20
11
20
12
20
13
Tota
l P
ho
sph
oru
s (u
g/L
)
Simulated
Observed

17
annual load of 63.1 lbs/yr. Lakes and reservoirs store phosphorus in the water column and sediment, therefore water quality responses are generally related to the total nutrient loading occurring over a year or season. For this reason, phosphorus TMDLs for lakes and reservoirs are generally calculated on an annual or seasonal basis. The use of annual loads, versus daily loads, is an accepted method for expressing nutrient loads in lakes and reservoirs. This is supported by EPA guidance such as The Lake Restoration Guidance Manual (USEPA 1990) and Technical Guidance Manual for Performing Waste Load Allocations, Book IV, Lakes and Impoundments, Chapter 2 Eutrophication (USEPA 1986). While a daily load has been calculated, it is recommended that the annual loading target be used to guide implementation efforts since the annual load of total phosphorus as a TMDL target is more easily aligned with the design of best management practices (BMPs) used to implement nonpoint source and stormwater controls for lakes than daily loads. Compliance with water quality standards for the TMDL will be determined by measuring the lake’s water quality to determine when the phosphorus guidance value is attained.
6.0 POLLUTANT LOAD ALLOCATIONS
The objective of a TMDL is to provide a basis for allocating acceptable loads among all of the known pollutant sources so that appropriate control measures can be implemented and water quality standards achieved. Individual waste load allocations (WLAs) are assigned to discharges regulated by State Pollutant Discharge Elimination System (SPDES) permits (commonly called point sources) and unregulated loads (commonly called nonpoint sources) are contained in load allocations (LAs). A TMDL is expressed as the sum of all individual WLAs for point source loads, LAs for nonpoint source loads, and an appropriate margin of safety (MOS), which takes into account uncertainty (Equation 1).
Equation 1. Calculation of the TMDL
TMDL = ∑WLA + ∑ LA + MOS
The TMDL, WLAs, and MOS for Palmer Lake are included in Table 6 in lbs/yr. and in Appendix C in lbs/day.
6.1 Wasteload Allocation (WLA)
Kent Manor Wastewater Treatment Facility – Background The Kent Manor wastewater treatment facility has held a valid SPDES permit since the late
1980s and is an existing discharge. Kent Manor was initially issued a SPDES permit with an effective date of July 1, 1988 and currently holds a valid SPDES permit. The 1988 SPDES permit included a flow limit of 102,000 gpd, a phosphorous limit of 1.0 mg/l and a permitted phosphorous load of 310.5 lbs/yr.
18
In 2009, the Department issued a SPDES permit modification to the Kent Manor Sewer Corporation authorizing discharge from the Kent Manor Wastewater Treatment Facility ("WWTF") of 70,000 gallons per day ("gpd") to an unnamed tributary to Palmer Lake '(SPDES Number NY0207322) (the "2009 SPDES Permit"). The 2009 SPDES Permit contained a phosphorus limit of 0.05 mg/l, the most restrictive permit limit for phosphorous applied in New York, including all other facilities within the NYC Watershed. This limit exceeds the limits set forth in the Department's Division of Water Technical and Operational Guidance Series ("TOGS") 1.3.6 "Phosphorous Removal Requirements for Wastewater Discharges to Lakes and Lake Watersheds" as well as the requirements of the New York City Watershed Rules and Regulations, both of which indicate that a wastewater discharge of 70,000 gpd requires a total phosphorus limit of 0.5 mg/I. The 2009 SPDES modification reduced the annual permitted phosphorus load from the Kent Manor WWTF from 310.5 1bs/year (102,000 gpd at 1.0 mg/l) to 10.71bs/yr (70,000 gpd at .05 mg/l).
In 2012, the Kent Manor WWTF and proposed development still had not been constructed.
At that time Kent Manor requested and the Department drafted a modified SPDES Permit which proposed to increase flow from the Kent Manor WWTF from 70,000 gpd to 103,200 gpd (33,200 gpd more than the current permit limit of 70,000 gpd) and maintain all current wastewater discharge standards and limitations. The increase in flow was proposed to allow for the following connections to the Kent Manor WWTF:
• a scaled down Kent Manor Development; • sewering 41 parcels in the Town of Kent served by inadequate septic systems pursuant to
a variance from the NYC Watershed Regulations • limited new development within an area in the Town to be sewered, in an amount limited
by the original flow allocation under the Phosphorous Offset Pilot Program; and • a connection from an existing WWTF (Frangel Realty) under NYC DEP's Regulatory
Upgrade Program. The increased flow in the draft modified SPDES Permit would be treated by the Kent Manor
WWTF and be discharged to Palmer Lake with a phosphorus effluent limit of 0.05 mg/l, the same limit contained in the 2009 SPDES permit. The additional flow would have resulted in an increased phosphorus load of 5.1 lb/yr. The total phosphorous load would then be 15.8 lb/yr (10.7 lb/yr as currently permitted + 5.1 lb/yr for the additional flows), assuming that the wastewater treatment plant operates at maximum capacity and discharges at the permit's phosphorus effluent limit 365 days a year.
The Department received a number of public comments voicing concerns about the additional
phosphorus loading to Palmer Lake associated with the increase in flow included in the 2012 Draft SPDES permit. To address this concern, the final SPDES permit (issued in 2013) includes a flow limit of 103,200 gpd to allow for the new sewer service area and to provide for the elimination of marginal and failing septics. However, to address the phosphorus loading to Palmer Lake, the 2013 SPDES permit limits the annual phosphorous loading from the Kent Manor WWTF to 10.7 lbs/yr, which is the phosphorous loading allowed under the 2009 SPDES permit for the Kent Manor WWTF. The terms of the Kent Manor WWTF SPDES permit require

19
that the Permittee establish a fund not to exceed $200,000 to fund Palmer Lake TMDL phosphorous load reductions as specified in this TMDL.
Furthermore, to allow for the increase in flow to 103,200 gpd, NYC DEP granted a variance
from 15 RCNY Section 18-36(b) (dated 8/3/2012) in accordance with the requirements set forth in Section 18-61 (d)(I). This variance states that: “No new wastewater treatment plants with surface discharges, or expansions of existing wastewater treatment plants with surface discharges, shall be allowed in a phosphorus restricted basin. A variance from this provision may be sought in accordance with the requirements set forth in §18-61 (d) of Subchapter F.”
Section 18-61 (d) states that: “The Department may grant a variance from the prohibition of locating a new wastewater treatment plant or expanding an existing wastewater treatment plant in a coliform restricted basin, or in a phosphorus restricted basin, where the Department determines that conditions in the area to be served by the new or expanded wastewater treatment plant are resulting in the release or discharge of inadequately treated sewage into the water supply, and that there is no other feasible method of correcting such release or discharge of inadequately treated sewage except to provide a variance from such prohibition.”
The Town of Kent demonstrated to NYC DEP that the requirements of §18-61 (d) of the NYC
Watershed Rules and Regulations are met by showing that 41 developed units (in the overall proposed sewer district) are currently served by marginal septic systems which may be contributing to a release or discharge of inadequately treated sewage into the Croton Falls and Middle Branch reservoirs (NYC water supply) and that absent a variance no other feasible method exists to treat this discharge. NYC DEP determined that the reduction in phosphorus loading from eliminating the marginal septic systems provides adequate mitigation for the variance.
As noted above, 41 parcels in the Town of Kent that were served by inadequate septic systems have been or will shortly be connected to the Kent Manor WWTF. Thirteen (13) of these parcels are commercial properties within the Palmer Lake watershed. These 13 properties had on-site septic systems documented by the Putnam County Health Department as failing or deficient. The phosphorus load from the deficient systems of the 13 properties was estimated at 15.1 lb/yr. The Kent Manor WWTF, by connecting the 13 deficient septic systems, (which had contributed 15.1 lbs/yr), is providing a net phosphorous benefit as the WWTF discharge (permitted at 10.7 lb/yr) is more than offset by removing the load from the thirteen deficient septic systems. As noted in section 7.1.2. Recommended Phosphorus Management Strategies for Wastewater Treatment Plants, in order for Palmer Lake to meet the 20 µg/L numeric endpoint, additional septic systems (beyond the 13 septic systems noted above) in close proximity to Palmer Lake would need to be provided sewer service such that the phosphorous loading from these septic systems would be removed from Palmer Lake. These additional septic systems could be connected to the Kent Manor WWTF and, as such, an increase in flow and corresponding phosphorous loading would be necessary to accommodate these additional connections. The calculated increase in phosphorous loading (3.3 lb/yr) is more than offset by the removal of the additional septic systems which contribute phosphorous to Palmer Lake and furthermore would allow Palmer Lake to meet the 20 µg/L numeric endpoint.
20
The WLA for Palmer Lake is set at 24.1 lb/yr. This includes WLAs of 14.0 lb/yr for the Kent Manor Wastewater Treatment Plant (WWTF), (10.7 lb/yr + 3.3 lb/yr as noted above), and 10.1 lb/yr for the MS4 contribution.
The Municipal Separate Storm Sewer Systems (MS4s) in the basin (Towns of Kent and Carmel) are subject to the MS4 Permit “Heightened Requirements” because they are located in the NYC East of Hudson (Croton Falls Reservoir) Watershed. As noted in Section 7, these MS4s are subject to reductions resulting from the Croton Watershed TMDL. The TMDL assumes a 10% reduction in MS4 developed land phosphorus loading because of implementation of the MS4 Permit requirements, including the requirement that all septic systems in the MS4 must be inspected and tanks pumped once every five years and, where necessary, repaired.
An enhanced surveying and testing program, above and beyond the requirements of the MS4 Permit requirements, could be implemented to document the location of septic systems and verify failing systems, requiring replacement in accordance with the NY State Sanitary Code. Property owners should be educated on proper maintenance of their septic systems and encouraged to make preventative repairs. The recently passed Nutrient Runoff Law will reduce phosphorus in dishwashing detergents sold in NY State and this should reduce the phosphorus contribution from on-site wastewater systems, especially those in substandard condition.
6.2. Load Allocation (LA)
Nonpoint sources that contribute total phosphorus to Palmer Lake include malfunctioning septic systems, stream bank erosion, groundwater, open land, forest and wetlands.
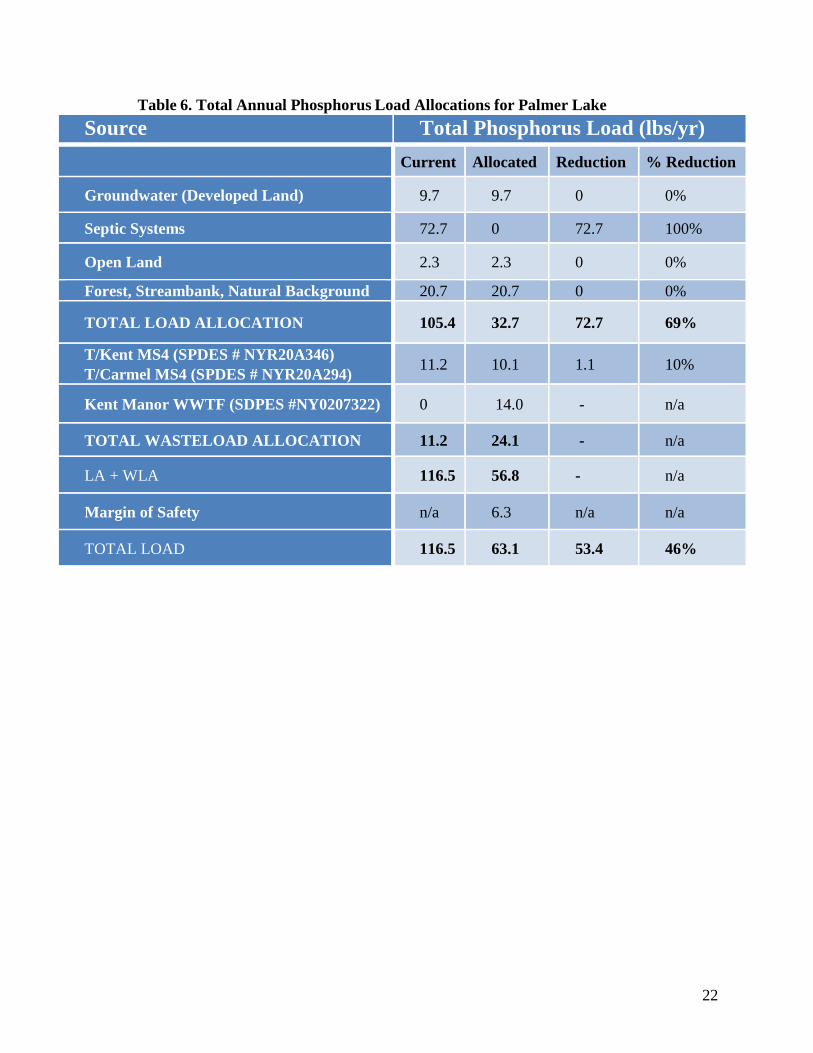
Table 6 lists the current loading for each source and the load allocation needed to meet the TMDL; Figure 9 provides a graphical representation of this information. Phosphorus originating from the natural sources mentioned above (including forested land, wetlands, and stream banks) is assumed to be a minor source of loading that is unlikely to be reduced further and therefore the load allocation is set at current loading.
The load from stream bank erosion is 4.4 lb/yr. The groundwater load attributable to developed land is 9.7 lb/yr. The remaining groundwater load of 14.6 lb/yr is attributable to natural sources. The load from open land (non-forested, non-developed) is 2.3 lb/yr. The forested load is 1.7 lb/yr.
The LA is set at 32.7 lbs/yr. The existing Palmer Lake watershed-wide septic system load has been calculated to be 72.7 lb/yr. The further expansion of the Kent Manor WWTF capacity to accommodate the remaining watershed properties with deficient septic systems is necessary to meet the TMDL, and would result in the elimination of the 72.7 lb/yr of phosphorus loading with an increase in the WWTF load of 3.3 lb/yr, or a cumulative WWTF load of 14.0 lb/yr.

21
6.3. Margin of Safety (MOS)
For the Palmer Lake TMDL, the MOS is explicitly accounted for during the allocation of loadings. An MOS of 6.3 lb/yr, or 10% of the assimilative capacity, is provided based on good confidence in modeling alignment with measured phosphorus concentrations.
6.4. Critical Conditions
TMDLs must take into account critical environmental conditions to ensure that the water quality is protected during times when it is most vulnerable. Critical conditions were taken into account in the development of this TMDL, as low hydraulic flow along with high temperatures and high phosphorus concentrations in the summer months can drive high algal growth. The water quality ramifications of these nutrient loads are most severe during middle or late summer. Therefore, BATHTUB model simulations were compared against observed data for the summer period only. Additionally, the water quality standard is applicable to the summer period. Furthermore, MapShed takes into account loadings from all periods throughout the year, including spring loads.
6.5. Seasonal Variations
Seasonal variation in nutrient load and response is captured within the models used for this TMDL. In BATHTUB, seasonality is incorporated in terms of seasonal averages for summer. Seasonal variation is also represented in the TMDL by taking 24 years of daily precipitation data when calculating runoff through MapShed, as well as by estimating septic system loading inputs based on summer or year-round residency. This is important as in the summer period the lake experiences the highest phosphorus concentrations and this is when the water quality standard applies. This takes into account the seasonal effects the lake will undergo during a given year.
22
Table 6. Total Annual Phosphorus Load Allocations for Palmer Lake
Source Total Phosphorus Load (lbs/yr)
Current Allocated Reduction % Reduction
Groundwater (Developed Land) 9.7 9.7 0 0%
Septic Systems 72.7 0 72.7 100%
Open Land 2.3 2.3 0 0%
Forest, Streambank, Natural Background 20.7 20.7 0 0%
TOTAL LOAD ALLOCATION 105.4 32.7 72.7 69%
T/Kent MS4 (SPDES # NYR20A346) T/Carmel MS4 (SPDES # NYR20A294)
11.2 10.1 1.1 10%
Kent Manor WWTF (SDPES #NY0207322) 0 14.0 - n/a
TOTAL WASTELOAD ALLOCATION 11.2 24.1 - n/a
LA + WLA 116.5 56.8 - n/a
Margin of Safety n/a 6.3 n/a n/a
TOTAL LOAD 116.5 63.1 53.4 46%

23
Developed Land (groundwater)
Septic Systems (0%)
Open Land
Forest, Wetland, Stream Bank,
and Natural Background
Point Sources
Margin of Safety
Developed Land (regulated MS4
stormwater)
Figure 9. Total Phosphorus Load Allocations for Palmer Lake (lbs/yr)
Groundwater (developed) 15.4% 9.7 lb/yr
Developed Land (Regulated MS4 Stormwater) 16% 10.1 lb/yr
Margin of Safety 10% 6.3 lb/yr
Point Sources 22.2% 14.0 lb/yr
Forest, Wetland, Streambank & Natural Background 32.8% 20.7 lb/yr
Open Land 3.6% 2.3 lb/yr
24
7.0 IMPLEMENTATION
One of the critical factors in the successful development and implementation of TMDLs is the identification of potential management alternatives, such as best management practices (BMPs) and screening and selection of final alternatives in collaboration with the involved stakeholders. Coordination with state agencies, federal agencies, local governments, and stakeholders will ensure that the proposed management alternatives are technically and financially feasible. The Department, in coordination with these local interests, will address the sources of impairment, match management strategies with sources, and align available resources to affect implementation.
The Department recognizes that TMDL designated load reductions alone may not be sufficient to restore eutrophic lakes. The TMDL establishes the required nutrient reduction targets and provides some regulatory framework to affect those reductions. However, the nutrient load only affects the eutrophication potential of a lake. The implementation plan therefore calls for the collection of additional monitoring data, as discussed in Section 7.2.
7.1. Reasonable Assurance for Implementation
Reasonable assurance that the TMDL will be met is provided through implementation of existing regulatory programs supplemented by load reduction commitments required by the TMDL. SPDES General Permits regulate stormwater discharges from construction activities (GP-0-10-001) and MS4s (GP-0-10-002) requiring control of post-construction stormwater discharges and implementation of the Enhanced Phosphorus Removal Standards in accordance with New York State Stormwater Management Design Manual. Phosphorus reductions anticipated from Environmental Conservation Law §17-2103, which limits the use of lawn fertilizer containing phosphorus, will also be credited to developed lands. Although point source reductions from MS4s will be beneficial, the TMDL can be met only by sewering the septic load from lake properties with deficient septic systems.
Green Infrastructure (GI) and Low Impact Development (LID) can be used to eliminate or reduce urban runoff and pollutant loadings by managing the runoff as close to its sources as possible. A collection of small-scale practices, linked together on a site, can be used to reduce the impacts of development/redevelopment on water resources by maintaining or replicating the predevelopment site hydrology. Green infrastructure, in combination with other strategies outlined in this section, can be implemented to assure that future growth does not result in increases in phosphorus loads to Palmer Lake that degrade current water quality. As use of green infrastructure gains wider acceptance and adoption, green infrastructure development practices can be expected to play an important role in protecting the lake and its watershed while allowing for future growth in the watershed.

25
7.1.1. Recommended Phosphorus Management Strategies for Septic
Systems
Septic systems are the primary source of loading in the Palmer Lake watershed, due to proximity of the systems to the lake, and in some instances, relatively shallow bedrock, high groundwater and poor soils. Restoration o f Palmer Lake is largely dependent on eliminating phosphorus loading from septic systems.
This TMDL recommends eliminating phosphorus loading from septic systems by sewering the watershed properties so the wastewater is properly treated, and instituting a management system as an interim measure. As all MS4s in the NYC East of Hudson (EOH) Watershed are required to implement and enforce a program for the inspection, maintenance, and, where necessary, the rehabilitation of septic systems, inspections (at least once every five years) and repairs of failing septic systems should be occurring in the Palmer Lake Watershed as required by the provisions of the MS4 Permit.
The properties adjacent to Palmer Lake should be connected to the Kent Manor WWTF. The first recommendation of this TMDL report is that an engineering design study to sewer the lake properties be initiated. The following grant and funding opportunities and information regarding contact staff are available for communities wishing to consider water quality improvements associated with moving from individual septic systems to watershed-wide sewering: Engineering Planning Grant: Funding available to complete preliminary engineering reports
� Contact: NYSDEC Regional Water Engineers (http://www.dec.ny.gov/about/558.html) � Website: http://www.dec.ny.gov/pubs/81196.html
Clean Water State Revolving Fund: Low interest loans to municipalities for constructing water quality protection projects like sewers and wastewater treatment facilities
� Contact: Fred Testa, NYS Environmental Facilities Corporation, 518-402-7396, [email protected] (Dutchess, Orange, Putnam, Rockland, Sullivan, Ulster, Westchester, Albany, Columbia, Greene, Montgomery, Rensselaer, Schenectady and Schoharie)
J.C. Smith, NYS Environmental Facilities Corporation, 607-776-4978, [email protected] (Chemung, Genesee, Livingston, Monroe, Ontario, Orleans, Seneca, Steuben, Schuyler, Wayne, Yates, Allegany, Cattaraugus, Chautauqua, Erie, Niagara, and Wyoming)
Terry Deuel, NYS Environmental Facilities Corporation, 607-753-3095 x 252, [email protected] (Delaware, Otsego, Jefferson, Lewis, Oneida, Broome, Cayuga, Chenango, Cortland, Madison, Onondaga, Oswego, Tioga, and Tompkins)
Jason Denno, NYS Environmental Facilities Corporation, 518-623-1244, [email protected] (Clinton, Essex, Franklin, Fulton, Hamilton, Saratoga, Warren, Washington, Herkimer, and St. Lawrence)
� Website: www.efc.ny.gov

26
NYS Community Development Block Grant: Financial assistance to communities & counties under a population threshold for activities such as water and sewer infrastructure projects
� Contact: Charles Philion, Office of Community Renewal, 518-474-2057, [email protected] � Website: http://nysdhcr.gov/AboutUs/Offices/CommunityRenewal/
USDA Rural Development Utilities Service Water & Environment Program: Loans & grants to public bodies, non-profits & Native American tribes for design, construction & improvements of wastewater systems for rural communities
� Contact: http://www.rurdev.usda.gov/NY_Office_Locations.html � Website: http://www.rurdev.usda.gov/NYHome.html
Local Government Efficiency Program: Technical assistance & competitive grants to local governments to develop projects that will achieve savings & improve municipal efficiency through shared services, cooperative agreements, mergers, consolidations and dissolutions. Applicants must include at least two involved municipalities.
� Contact: Kyle Wilber, NYS Department of State, 518-473-3355, [email protected] � Website: http://www.dos.ny.gov/lg/lge/index.html
Water Quality Improvement Projects: A competitive, statewide reimbursement grant program open to local governments & not-for-profit corporations for projects that directly address documented water quality impairments, including municipal wastewater treatment infrastructure improvement.
� Contact: Water Quality Improvement Project Program, NYS Department of Environmental Conservation, 518-402-8179, [email protected]
� Website: http://www.dec.ny.gov/pubs/4774.html
7.1.2. Recommended Phosphorus Management Strategies for
Wastewater Treatment Plants
The Kent Manor SPDES permit contains a flow limit of 103,200 gpd to allow for a new sewer service area and to provide for the elimination of marginal and failing septic systems, and a limit of 0.05 mg/l for phosphorous which is an order of magnitude more restrictive than the current NYSDEC and NYCDEP requirements. The SPDES permit for Kent Manor contains the most restrictive permit limit for phosphorus for any facility in New York including all others within the NYC watershed. To further restrict the amount of phosphorous, the Kent Manor SPDES permit restricts annual phosphorous loading from the Kent Manor WWTF to 10.7 lbs/yr. To provide reasonable assurance that the TMDL will be met, the WLA for the Kent Manor WWTF will be increased to 14.0 lbs/yr upon completion of sewer connections with the 30 houses closest to the lake. The waste load allocation set forth in this TMDL will be translated into a new permit limit for Kent Manor WWTF.
Additionally, the SPDES permit contains a compliance schedule requiring that within 3 months of exceeding 90 % (9.6 lbs/yr) of the annual phosphorous loading limit of 10.7 lbs/yr. Kent Manor shall submit a plan and schedule to the Department for approval, that identifies measures to be implemented at the Kent Manor WWTF to reduce the annual phosphorous loading from the WWTF and/or identify and implement phosphorous reduction measures within the Palmer Lake watershed. Once approved, the plan and schedule shall be enforceable by the Department. The Department is requiring the plan and schedule once the annual phosphorous

27
loading reaches 90% of the permitted limit to allow for the implementation of the measures identified in the approved plan so that the annual loading limit does not exceed 10.7 lbs/yr.
7.1.3. Recommended Phosphorus Management Strategies for
Stormwater Runoff The Department has expanded its permitting program to include a federally mandated
program to control stormwater runoff and protect waterways. According to the federal law, commonly known as Stormwater Phase II, permits are required for stormwater discharges from MS4s in urbanized areas and for construction activities disturbing one or more acres. To implement the law, the Department has developed two general SPDES permits, one for MS4s in urbanized areas and one for construction activities. Operators of regulated small MS4s seeking authorization to discharge stormwater in compliance with the Federal CWA are required to apply for and secure coverage under the SPDES General Permit for MS4s. Operators of construction activities must obtain either a SPDES or a general permit prior to the commencement of construction. MS4 municipalities are required to develop, implement and enforce a stormwater management program (SWMP). The SWMP must describe the BMPs for each of the minimum control measures:
1. Public education and outreach program to inform the public about the impacts of the stormwater on the receiving water quality.
2. Public involvement and participation. 3. Illicit discharge detection and elimination. 4. Construction site stormwater runoff control program for sites disturbing one or more
acres. 5. Post-construction runoff control program for new development and redevelopment
sites disturbing one or more acres. 6. Pollution prevention and good housekeeping operation and maintenance program.
Operators must have developed the initial SWMP and have provided adequate resources to fully implement the SWMP no later than three years from the date of the individual MS4’s designation. The MS4s that discharge to the Palmer Lake Watershed are owned and operated by the municipalities of Kent and Carmel. Accordingly, all municipalities identified in the TMDL have submitted an application to gain coverage under New York’s SPDES General Permit for Municipal Separate Storm Sewer Systems. Each of the regulated MS4s in this TMDL (see Table 7) has developed an initial SWMP and has coverage under the general permit (GP-0-10-002). An MS4 may modify its SWMP at any time, although any changes to a SWMP shall be reported to the Department in the MS4's annual report. MS4s are required to make steady progress toward full implementation.

28
Table 7. MS4 Permittees
Permittee SPDES #
Town of Kent NYR20A346
Town of Carmel NYR20A294 A SWMP is designed to reduce the discharge of pollutants to the maximum extent
practicable (MEP) to protect water quality and to satisfy the appropriate water quality requirements of the Environmental Conservation Law and the CWA. MEP is a technology-based standard established by Congress in the CWA. No precise definition of MEP exists, therefore it allows for maximum flexibility on the part of MS4 operators as they develop their programs. Since stormwater is discharged to a 303(d)-listed segment of a waterbody, the SWMP must ensure there is no resulting increase in the pollutant of concern – phosphorus - to the receiving waters.
Palmer Lake is located in the New York City East of Hudson (NYC EOH) watershed;
therefore the permittees listed in Table 7 are subject to the additional BMPs for Watershed Improvement Strategies for the NYC EOH. These BMPs include:
1. Conduct public education and outreach, including developing pertinent educational
material, to describe the impacts of phosphorus on waterbodies, to identify phosphorus sources in stormwater runoff and steps that can be taken to reduce the phosphorus concentration in stormwater runoff.
2. Develop and maintain a map showing the entire MS4 conveyance system including all components of the system.
3. Develop a program to insure that onsite wastewater disposal systems are inspected, and where necessary repaired, at least once every five years.
4. Develop and enforce a program equivalent to the NYSDEC Construction General Permit requiring erosion and sediment controls for all construction activities that disturb between five thousand (5000) square feet and one acre of land, including provisions for inspections for all sites with greater than one acre of disturbance.
5. Post-Construction stormwater management controls for projects disturbing over one acre of land designed in accordance with the NYS Stormwater Design Manual, and a retrofit program implemented to correct or reduce erosion and/or pollutant loading problems.
6. Development of MS4 conveyance inspection and maintenance program, including the mapping, inspection and repair of all MS4 outfalls.
As noted above, MS4s in the EOH NYC Watershed are required to develop and implement a
5 year stormwater retrofit program to reduce phosphorous in stormwater discharges in the Croton Watershed. Each MS4 in the EOH was given a specific phosphorous load reduction requirement based on the relative area of high-intensity development in each municipality. 19 of the MS4s in the EOH (including the Towns of Kent and Carmel) have formed an East-of-Hudson Watershed Coalition (EOHWC) to implement the stormwater retrofit program on a

29
regional basis. The required reductions of the 19 participating municipalities were aggregated for the purpose of “bubble” compliance, and as such, the most cost effective retrofit projects can be constructed in any of the municipalities and all 19 receive credit for such. By the end of the initial 5 year retrofit program in 2015 it is expected that over 150 stormwater retrofit projects, at a cost of approximately $40 million, will be constructed in the EOH NYC Watershed to reduce phosphorous loading by 600 kg/yr.
It is expected that the stormwater retrofit program will be implemented for an additional 5
years (beginning in 2016). The EOHWC has not yet sited a stormwater retrofit project in the Palmer Lake watershed. When siting future stormwater retrofit projects it is recommended that an analysis be undertaken to determine if a cost effective retrofit project(s) can be constructed in the Palmer Lake watershed. Such a retrofit project would provide phosphorous reduction for Palmer Lake and the overall Croton watershed and count towards the phosphorous reduction required by the MS4 SPDES General Permit. The wasteload reductions specified in this TMDL may be superseded by more stringent load reductions necessary to satisfy the water quality targets set by the Croton Watershed TMDL.
7.1.4. Additional Protection Measures
Measures to further protect water quality and limit increases in phosphorus load should be considered. The basic protections afforded by local zoning ordinances could be enhanced to limit non-compatible development, preserve natural vegetation along shorelines and promote smart growth. Identification of wildlife habitats, sensitive environmental areas, and key open spaces within the watershed could lead to their preservation or protection by way of conservation easements or other voluntary controls.
7.1.4.1. Aquatic Plant Control
Palmer Lake is currently utilized for swimming, boating, fishing and other passive uses such as wildlife viewing. As previously noted, Palmer Lake is fairly shallow and currently contains various weeds and algae which interfere with the present uses of the lake. Aquatic plants are an important part of lake ecosystems and fish and wildlife cannot survive without them. While aquatic plants naturally go through cyclical growth patterns, excessive weeds usually indicate a larger problem such as excessive sedimentation and nutrients as well as the potential introduction of invasive species, most of which cannot be eradicated.
Palmer Lake currently contains various aquatic plants, most notably the following: • Invasive (exotic) plants
– Eurasian watermilfoil – Brittle naiad
• Nuisance (native) plants – Coontail – Duckweed

30
• Beneficial (native) plants – Water lilies – Water net
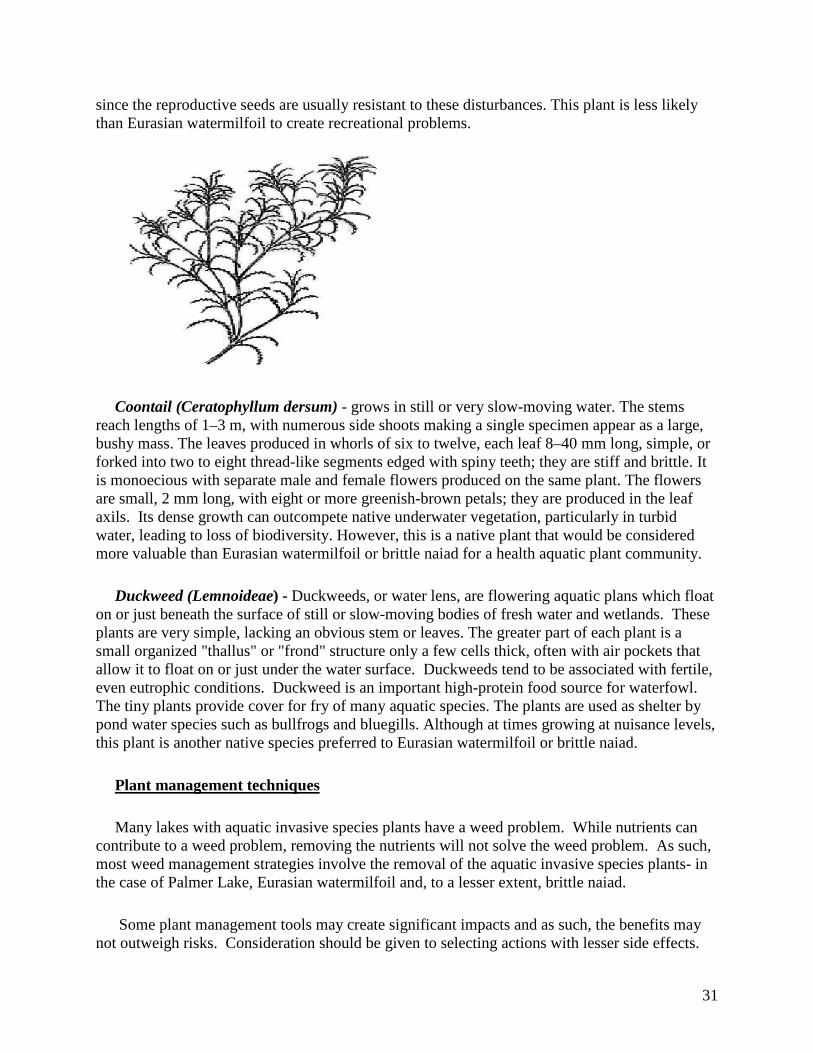
Eurasian Watermilfoil (Myriophyllum spicatum)- Eurasian watermilfoil has slender stems up to 3 m long. The submerged leaves are usually between 15–35 mm long and are borne in pinnate (feather-like) whorls of four, with numerous thread-like leaflets roughly 4–13 mm long. Flowers are produced in the leaf axils (male above, female below) on a spike 5–15 cm long held vertically above the water surface, each flower inconspicuous, orange-red, 4–6 mm long. Eurasian water milfoil has 12- 21 pairs of leaflets.
In lakes or other aquatic areas where native aquatic plants are not well established, Eurasian watermilfoil can quickly spread. It has been known to crowd out native plants and create dense surface canopies or dense stands within the water that interfere with recreational activity. Eurasian watermilfoil can grow from broken off stems which increases the rate in which the plant can spread and grow
Brittle naiad (Najas minor)- , is an annual aquatic plant which prefers calm waters, such as ponds, reservoirs and lakes and is capable of growing in depths up to 4 meters. Brittle Naiad grows in dense clusters and has highly branched stems. These stems fragment easily and this plant is capable of propagation from stem fragments or from small seeds which grow along its stem. The small flowers are located in clusters along the leaf axils. The leaves of the plant are opposite, unbranched, strap-shaped, and are around 4.5 centimeters in length. The leaves have serrations which are visible to the naked eye.
The presence of this plant is a problem because its dense growth covers wide areas, inhibiting the growth of native species of aquatic macrophytes. The thick, clustering growths of brittle naiad can make fishing access or the operation of a boat difficult in a pond or lake. Brittle naiad may spread to new areas by stem fragments carried on a boat's hull, deck, propeller or trailer, and it does particularly well in lakes with varying water levels or disturbed bottom characteristics,
31
since the reproductive seeds are usually resistant to these disturbances. This plant is less likely than Eurasian watermilfoil to create recreational problems.
Coontail (Ceratophyllum dersum) - grows in still or very slow-moving water. The stems reach lengths of 1–3 m, with numerous side shoots making a single specimen appear as a large, bushy mass. The leaves produced in whorls of six to twelve, each leaf 8–40 mm long, simple, or forked into two to eight thread-like segments edged with spiny teeth; they are stiff and brittle. It is monoecious with separate male and female flowers produced on the same plant. The flowers are small, 2 mm long, with eight or more greenish-brown petals; they are produced in the leaf axils. Its dense growth can outcompete native underwater vegetation, particularly in turbid water, leading to loss of biodiversity. However, this is a native plant that would be considered more valuable than Eurasian watermilfoil or brittle naiad for a health aquatic plant community.
Duckweed (Lemnoideae) - Duckweeds, or water lens, are flowering aquatic plans which float on or just beneath the surface of still or slow-moving bodies of fresh water and wetlands. These plants are very simple, lacking an obvious stem or leaves. The greater part of each plant is a small organized "thallus" or "frond" structure only a few cells thick, often with air pockets that allow it to float on or just under the water surface. Duckweeds tend to be associated with fertile, even eutrophic conditions. Duckweed is an important high-protein food source for waterfowl. The tiny plants provide cover for fry of many aquatic species. The plants are used as shelter by pond water species such as bullfrogs and bluegills. Although at times growing at nuisance levels, this plant is another native species preferred to Eurasian watermilfoil or brittle naiad.
Plant management techniques
Many lakes with aquatic invasive species plants have a weed problem. While nutrients can contribute to a weed problem, removing the nutrients will not solve the weed problem. As such, most weed management strategies involve the removal of the aquatic invasive species plants- in the case of Palmer Lake, Eurasian watermilfoil and, to a lesser extent, brittle naiad.
Some plant management tools may create significant impacts and as such, the benefits may not outweigh risks. Consideration should be given to selecting actions with lesser side effects.
32
The method or methods chosen should be dictated by the goals desired to be obtained.
Potential goals for weed management in Palmer Lake include surface reduction of weeds to: 1) improve boating; 2) clear edges for anglers; and 3) clear whole sections for swimming.
Decisions needs to be made as to whether to manage weeds in: 1) part of or the whole lake; 2) in the early summer or the entire summer; and the desired duration of control (e.g. short term, long term)
Other factors include how much money is available for weed management, and whether consultant services are necessary or if it can be done with citizen volunteers.
The first and best line of defense is PREVENTION • Visual inspection - assume all dangling plants are invasive • Disinfection - Hot water, disinfectant • Quarantining - Delay entering lake until any transported plants have been
dried or inactivated • Intercepting - Remove plants before they leave other infected lakes • Regulating their sale and transport
– Management actions discussed in detail in Diet for a Small Lake which is available on NYSDEC website (http://www.dec.ny.gov/ chemical/82123.html). Chapter 6 discusses each aquatic plant management option in detail
Options for weed control in Palmer Lake - Overview
If the desired goal is to manage relatively small areas (swimming area, boat channels), it is possible to implement the following techniques with citizen volunteers.
– Hand harvesting – Benthic barriers
If the desired goal is to manage a large area (whole lake), a consultant would need to be retained and consideration could be given to the following techniques:
– Herbicides- EWM only- triclopyr; EWM and coontail- fluridone – Grass carp
Listed below is a comprehensive table of potential weed control options for Palmer Lake which includes the recommended techniques noted above:
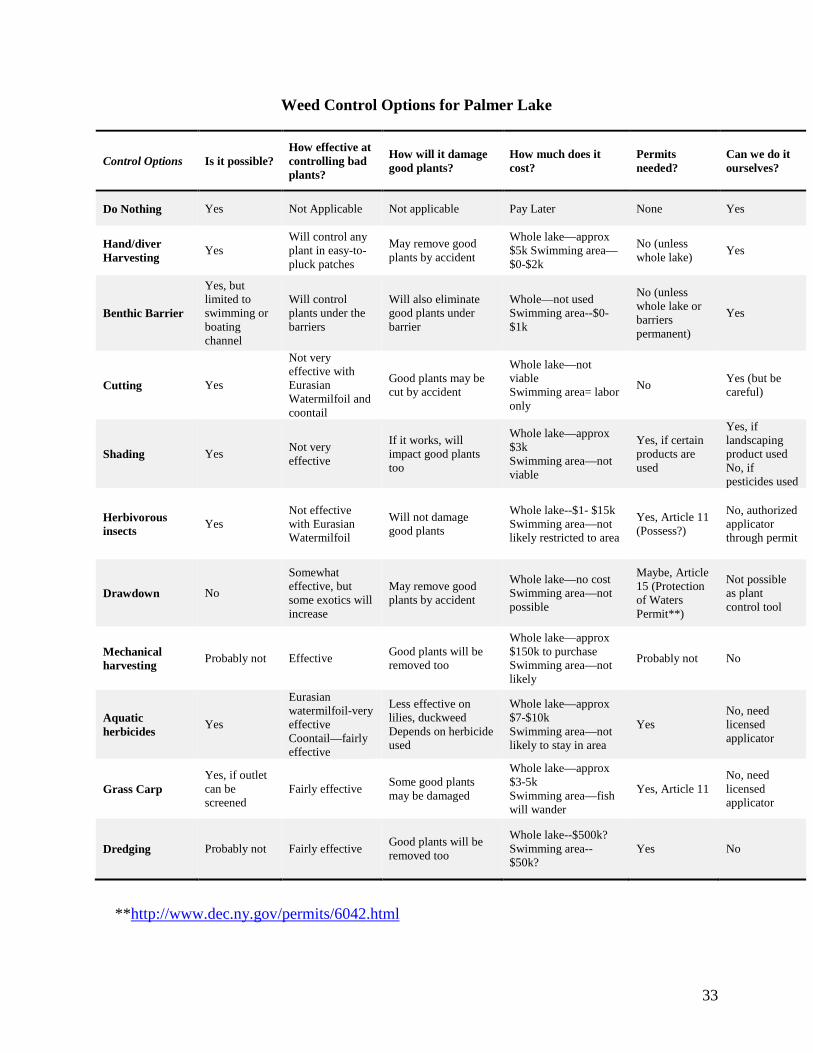
33
Weed Control Options for Palmer Lake
Control Options Is it possible? How effective at controlling bad plants?
How will it damage good plants?
How much does it cost?
Permits needed?
Can we do it ourselves?
Do Nothing Yes Not Applicable Not applicable Pay Later None Yes
Hand/diver Harvesting
Yes Will control any plant in easy-to-pluck patches
May remove good plants by accident
Whole lake—approx $5k Swimming area—$0-$2k
No (unless whole lake)
Yes
Benthic Barrier
Yes, but limited to swimming or boating channel
Will control plants under the barriers
Will also eliminate good plants under barrier
Whole—not used Swimming area--$0-$1k
No (unless whole lake or barriers permanent)
Yes
Cutting Yes
Not very effective with Eurasian Watermilfoil and coontail
Good plants may be cut by accident
Whole lake—not viable Swimming area= labor only
No Yes (but be careful)
Shading Yes Not very effective
If it works, will impact good plants too
Whole lake—approx $3k Swimming area—not viable
Yes, if certain products are used
Yes, if landscaping product used No, if pesticides used
Herbivorous insects
Yes Not effective with Eurasian Watermilfoil
Will not damage good plants
Whole lake--$1- $15k Swimming area—not likely restricted to area
Yes, Article 11 (Possess?)
No, authorized applicator through permit
Drawdown No
Somewhat effective, but some exotics will increase
May remove good plants by accident
Whole lake—no cost Swimming area—not possible
Maybe, Article 15 (Protection of Waters Permit**)
Not possible as plant control tool
Mechanical harvesting
Probably not Effective Good plants will be removed too
Whole lake—approx $150k to purchase Swimming area—not likely
Probably not No
Aquatic herbicides
Yes
Eurasian watermilfoil-very effective Coontail—fairly effective
Less effective on lilies, duckweed Depends on herbicide used
Whole lake—approx $7-$10k Swimming area—not likely to stay in area
Yes No, need licensed applicator
Grass Carp Yes, if outlet can be screened
Fairly effective Some good plants may be damaged
Whole lake—approx $3-5k Swimming area—fish will wander
Yes, Article 11 No, need licensed applicator
Dredging Probably not Fairly effective Good plants will be removed too
Whole lake--$500k? Swimming area--$50k?
Yes No
** http://www.dec.ny.gov/permits/6042.html

34
Other alternatives include utilizing IPM, or Integrated Plant Management, the principle of which is combining two or more management techniques. IPM can target any/all invasives and is often viewed as a more comprehensive approach as it can combine local and lakewide management techniques. Care should be taken to ensure that techniques are compatible so there are no side effects. The costs and need for permits will depend on the management techniques chosen
Decision trees help guide initial decision-making process based on the key factors for each infestation. Key factors may include:
Management objectives Efficacy Logistics Permitting Side Effects Longevity Cost
An example of a decision tree for Eurasian Watermilfoil is shown on the following page.

35

36
Algae Control
Algae is an important part of lake ecosystems and fish and wildlife can’t survive without it. Algae naturally goes thru cyclical growth patterns, but excessive algae can produce blooms and toxins. Excessive algae usually indicates a larger problem – namely excessive nutrients.
List of Lake Management Actions- Algae Control Management actions discussed in detail in Diet for a Small Lake Available on NYSDEC website (http://www.dec.ny.gov/ chemical/82123.html) Chapter 7 discusses each aquatic plant management option in detail No blue green algae observed in Palmer Lake
Algae Control Options for Palmer Lake
Control Options Is it possible? Pros Cons How much
does it cost? Permits needed?
Can we do it ourselves?
Barley Straw Yes
Cheap, Easy, DIY, No Evidence of Harm, Some Anecdotal Evidence It Works
Only Anecdotal Evidence, Removal of Spent Bales
Whole Lake = $400-500
Swimming area = $100 (if placed near edge, outside area)
None or Not Allowed
Yes
Algeacides Yes -Chemically Wipe Out Algae by Contact
Short Term Control, Immediate, Usually Effective
Non-Target Impacts, Controversial, Some Limits on Use, Can Push Toxins Into Water
Whole lake—approx $1-2k. Swimming area—$500-$1k (usually done as whole lake)
ECL Article 15/Part 327, Article 17/SPDES General Permit, Article 24)
No – need licensed applicator
Biomanipulation
Yes – stock fish to eat algae (or to eat fish that eat zooplankton that eat algae)
Can be effective. One and Done, “Natural”, Improve Fishery
Unclear as to how effective Disrupt Fish/food web Community, Hard To Reverse, Highly Variable Success; Assume BB/Carp Dominate Lake
$100-200/ 100 fish; 100-1000 fish/acre
Article 11 No – need permit applicator

37
Lake Management Resources
Diet for a Small Lake (http://www.dec.ny.gov/chemical/82123.html) • Chapter 6 discusses each aquatic plant management option in detail • Chapter 7 discusses each algae control option in detail
Harmful Blue-green Algae Bloom • General information— http://www.dec.ny.gov/chemical/77118.html • Bloom Notices— http://www.dec.ny.gov/chemical/83310.html • Frequently Asked Questions— http://www.dec.ny.gov/chemical/91570.html
Invasive Species • General information about invasive species—http://www.dec.ny.gov/animals/265.html • Aquatic invasive species in NYS— http://www.dec.ny.gov/animals/50121.html • How to prevent the spread of aquatic invasive species—
http://www.dec.ny.gov/animals/48221.html
Citizens Statewide Lake Assessment Program (CSLAP) • Need to be a member of the NY Federation of Lake Associations—
http://www.nysfola.org/ • No spots available in 2014 program, but can apply to NYSFOLA for 2015 • General information about CSLAP— http://www.dec.ny.gov/chemical/81576.html
7.2. Follow-up Monitoring
A targeted post-assessment monitoring effort will be initiated to determine the effectiveness of the implementation plan associated with the TMDL. Palmer Lake will be sampled at its deepest location (approx. 5-6 feet) during the warmer part of the year (May through September) on 8 sampling dates. Grab samples will be collected at approximately 1.5 meters. The samples will be analyzed for the phosphorus series (total phosphorus, total soluble phosphorus, and soluble reactive phosphorus), the nitrogen series (nitrate, ammonia, and total nitrogen), chlorophyll and chloride. The Secchi disk depth will be measured. A simple macrophyte survey will also be conducted one time during mid-summer.
8.0 PUBLIC PARTICIPATION
The Department held an informational meeting on April 29th, 2014 in the Town of Kent, to
educate the public on lake management strategies, to engage in discussion, answer lake management questions and to hear the community's water quality and water use goals for Palmer Lake.
38
On May 27th, 2014 in the Town of Kent, the Department gave a presentation on the TMDL process, to explain the implications of the TMDL and to collect available data about the lake and watershed to aid in TMDL development.
Notice of availability of the Draft TMDL was made to local government representatives and interested parties. Additional notice of the draft TMDL Document was provided by email via the Environmental Notice Bulletin Listserve and the DEC Division of Water Making Waves email list. The Draft TMDL was public noticed in the Environmental Notice Bulletin on July 2, 2014. A 30-day public review period was established for soliciting written comments from stakeholders prior to the finalization and submission of the TMDL for EPA approval. Comments were accepted until close of business on July 31, 2014. Written comments were received and the following are Public Comments and the Department’s responses: Comment# Commenters:
1-3 G. Michael McGrath 4 Carl Steike 5 Michelle Cottle 6 Jason Cohen 7 Dave Warne, NYCDEP 8-21 Bruce Barber, for Town of Kent 22 The Mulvena Family 23 James Mulvena Comment #1: There are at least two additional (small) streams feeding into the lake as well as two ponds and wetlands in the community. Were other sources (small streams, ponds, wetlands) of water entry into Palmer Lake directly measured or were they part of an estimation? If additional water sources into Palmer Lake were not directly studied, why? Response #1: The estimated phosphorus loading to Palmer Lake was determined using the annual rainfall data, annual runoff, watershed area and specific land characteristics including soil type, topography, stream length, land use for the entire Palmer Lake watershed. Discharges of water into Palmer Lake from small streams, ponds and wetlands were not measured separately, but these discharges are included in the total watershed discharge to the lake. Comment #2: Appendix A, page 44 "These assumptions are based on data from Putnam County Health Department (PCHD) records of septic system failures and repairs and best professional judgment". This appears, to me, to be quite an assumption to the extent of being near worthless! How does the PCHD know when septic systems are repaired or pumped? My system has been pumped every 3 - 4 years since it was installed in 1988; I have never been visited by the PCHD or asked for any documentation. How would the PCHD know if there was a malfunctioning system or systems?
39
Response #2: The Department reviewed hundreds of records at the Putnam County Health Department that documented septic failures on properties in the Palmer Lake watershed. PCHD was informed of these septic system failures in most cases by the homeowners or the contractors that the homeowner hired to repair the deficient septic systems. The septic systems often are discovered to be deficient due to effluent surfacing that is discovered by the homeowner. These reported failures do not represent all of the deficient septic systems in the Palmer Lake watershed since septic systems that discharge partially treated effluent directly to the groundwater do not display any evidence of failure. However, this qualitative information that was obtained from PCHD was used along with information on the experiences of other lake communities along with the specific soil data and location of the houses in relation to Palmer Lake, to provide justification for a best professional judgment of likely septic system malfunction rates. Comment #3: My impression from the TMDL is that the best alternative to reduce the phosphorus level in Palmer Lake would be to sewer homes, at least those bordering the lake. Can individual homeowners correct potential problems with their septic systems to avoid connecting to a sewer system? Will our septic systems be inspected? By whom? Or, does each property owner arrange for an inspection of their septic system? What documentation is needed to show either a properly functioning septic system or corrective action done to correct a malfunctioning system?
Response #3: Individual homeowners can minimize potential problems with their septic systems with proper care of the septic system, including regular inspection and pumpout of the septic tank. In instances where the septic system is located very close to the lake and the septic field discharges into the groundwater, the homeowner may opt to install a raised bed system or other alternative system to minimize the leaching of effluent into the groundwater. The decision to form a sewer district would be made by homeowners in the proposed sewer district, who have the opportunity to vote on the decision. Inspection of septic systems is the responsibility of the homeowner and is a requirement of the MS4 General Permit, to which the Towns of Kent and Carmel are both signatories. Copies of the record of inspection and pumpout should be retained by the homeowner as evidence of compliance with this Town ordinance. Comment #4: I'll try to keep this short and to the point and I admit up front I have not been able to follow this thoroughly for the past few years. But something is very wrong and unfair to the residents of Hill and Dale who own Palmer Lake. We have been fighting the proposed Kent Manor development and associated waste water treatment plant since the 1980s. The environmental impact study that was done was on that project as a whole and it did NOT include a study of the impact of adding commercial businesses on Route 52. It also did NOT anticipate sewering houses in Hill and Dale surrounding Palmer Lake. Therefore that study should be of no effect and the plant should not be permitted to operate unless another FULL EIS is conducted.

40
Furthermore the developers of Kent Manor failed and did not build the development nor the sewage plant. The foundation that was going to be used for the sewage plant laid open for years and was decaying and we have photos from several years ago reflecting that. Then without the Kent Manor development, a plan to install the plant and connect businesses was implemented. I can only assume that the funding for such a plan came from NYC DEP since no one else has deep enough pockets to build such a sewage plant if the associated houses in Kent Manor are not being built. I maintain that the previous study cannot be used as it does NOT reflect actual conditions as they now stand. Furthermore our understanding is that businesses on Route 52 were charged approximately $7,500 each to be connected to the sewage plant, but I've read an estimate for houses in Hill and Dale that is 3.5 times that amount or approximately $25,000 each. That is outrageous! Furthermore many of those businesses lie on Lake Carmel, not Palmer Lake. So they want to flow treated sewage from other people and other businesses through our lake and then charge us disproportionately for that right? Something is very wrong! If this plant is permitted to proceed, they should be paying Hill and Dale to use our lake for the sewage plant outflows and that payment could come in the form of sewering the houses in Hill and Dale at no cost to the homeowners and maintaining the lake on an ongoing basis. Despite all the assurances about how effective this plant was designed, the fact is that plants do fail and it will be our lake and the property owners in Hill and Dale that will suffer should that occur. Whoever operates that plant should be required to establish a significant escrow account to pay for the damages that could arise in the event of such a failure. The political BS that has occurred over the years with regard to this sewage plant and its impact on us has made me decide that if this project is permitted to proceed we will be leaving New York permanently. This whole process shows that the state and city basically do not care about the rights of homeowners in Hill and Dale. If NYC DEP wants the plant and wants the lake to conform to their standards, then every penny of that cost should be paid by them, not by us. They should have no right to impose costs upon us. We are not residents of NYC and they have no legal right to impose any tax or other financial burden upon us. We believe this plant should be stopped as it has not gone through the full required approval process as things now stand. If it is permitted to proceed then it should be done at no cost to the homeowners that own Palmer Lake. Response #4:
There will be no cost to the residents of the Palmer Lake watershed for the operation of the Kent Manor Wastewater Treatment Facility (WWTF). The cost for operation and maintenance of the WWTF is borne by the developer of the Kent Manor Condominium project and the properties that are served by the WWTF. The WWTF includes the highest level of phosphorus treatment in NY State, and includes redundant units, alarms systems and standby power in the

41
event of power failure. In addition, the WWTF requires that certified WWTF operators maintain the WWTF, who will be responsible for continuous operations. The TMDL implementation section has been revised to recommend an engineering analysis to determine the cost of providing sewers to the lake community, which will enable the residents to make an informed decision about whether to sewer the lake properties. Comment #5: I am a resident of Hill & Dale Country Club which surrounds Palmer Lake. Despite the name of our community, we are not actually a "country club". We are a community of modest homes with average earners as head of household. Our lake is already struggling from high phosphorous levels and will be further damaged by the water treatment plant set to be built within the next year, creating effluent to run through our small already struggling lake. Please help stop this water treatment plant from going through. If there ever is a power failure of the generator which is designed to prevent the failure of the generator that operates the water treatment center - the likes of which we saw severely affect Manhattan, shutting down hospitals and creating emergency situation, when power generators failed - raw effluent will seep into and destroy our lake. Not only will the lake suffer but my home value will plummet. My family has a moderate income and something like this would destroy us financially. This scenario is not a possibility, it is a probability given the types of strong storm systems we have seen in the last few years in New York. Please use your influence to step in and stop the continued construction of this facility and help us save our community and our homes.
Response #5: Discharge of sewage into any waterbody in contravention of SPDES permit limits and water quality standards is a violation of the Environmental Conservation Law and associated regulations. The Kent Manor WWTF construction will include the highest level of treatment including redundant units, alarms systems and standby power. The SPDES Permit for the Kent Manor WWTF also requires that the WWTF employ certified WWTF operators who will be responsible for continuous operations. In addition, a number of parcels in the Palmer Lake watershed formerly served by inadequate septic systems have been (or will shortly be) connected to the Kent Manor WWTF. These properties had on-site septic systems documented by the Putnam County Health Department as failing or deficient. The Kent Manor WWTF, by treating effluent from these parcels, is providing a net phosphorous benefit as these inadequate septic systems will no longer be impacting Palmer Lake.
Comment #6: Hi, I am writing this letter to ask you to stop the construction of the Kent water treatment plant on Route 52. A project which was conceived under unscrupulous and undemocratic circumstances was also poorly researched. This entire situation borders on the criminal. Your agency exists to work and protect the environment of New York. I will not get into the details of how this project got permits, but the DEC of NY is the only body of government
42
capable of stopping it. If this isn't true please let me know. The greedy town officials (let it be known that they are no longer in power in the town of Kent) won and DEC seems powerless to react. Please take action now to stop this water treatment plant. Government bodies in the past created the DEC to conserve and protect the environment from the very injustice affecting our community. Please read the DEC's mission statement and tell me our situation doesn't fit into it. I apologize for any harsh tones in this letter. I am very passionate about this topic and I don't want to in the future have to explain to my son after another Sandy like storm (and it's just a matter of time) why our lake has turned into a cesspool. Please react. Thank you for reading. Response #6: The Department does not have the authority to revoke the Kent Manor SPDES Permit. The Kent Manor SPDES permit contains a limit of 0.05 mg/l which is an order of magnitude more restrictive than the current DEC and NYCDEP requirements, and includes an annual phosphorous loading limit of 10.7 lbs/yr as a definitive permit limit, calculated on a monthly basis, as a 12 month rolling average. The SPDES permit for Kent Manor contains a more restrictive permit limit for phosphorous than any other facility in New York, including all others within the NYC watershed. Also, see response to Comment #5 Comment #7: The Report {draft Total Maximum Daily Load (TMDL) for Phosphorus in Palmer Lake} briefly states under the Watershed Characterization section that Palmer Lake is located within the Croton Watershed. However, the Report fails to acknowledge that the lake is within the Croton Falls Reservoir Watershed which has a pre-existing phosphorus TMDL; this TMDL requires phosphorus load reductions. It is important that this draft TMDL, which is also requiring phosphorus load reductions in the Croton Falls Watershed, be placed in a regional context for stakeholders. Additionally, the Report should explain that different methodologies and datasets have been used over time to calculate phosphorus loads for the Phase II NYC Reservoir TMDLs, the MS4 retrofit requirements, and the current Palmer Lake TMDL. These methodologies – and in particular, the use of different export coefficients and models – have resulted in different analyses of phosphorus loads that are not directly comparable, in terms of either absolute or relative values. As a result, there is conflicting information in the public domain, and stakeholders are likely to be confused or to misinterpret the Report, particularly in the absence of a clear explanation that the analyses used to support the Reservoir TMDLs, the determination of MS4 retrofit requirements, and this proposed TMDL are not the same. Implementation of TMDLs is an ongoing and challenging issue, and the Palmer Lake TMDL is no exception. The Report concludes that near shore septic systems are likely a significant source of phosphorus loading to the lake. As noted in the Report, the MS4 permit requires the rehabilitation of septic systems, where necessary. However, the report concludes that “[t]he TMDL can be met only be sewering the lake properties,” Report at 19; without significant assistance from the State it seems unlikely that the recommendation to sewer the area will be

43
realized. Absent a plan for further reductions in phosphorus loading from wastewater sources, it is unclear to what extent the TMDL can be achieved. Response #7: The TMDL report has been revised to clearly state that Palmer Lake watershed is part of the larger East of Hudson NYC watershed and specifically within the Croton Falls reservoir watershed, and that a TMDL exists for that watershed with phosphorus load reduction requirements. The phosphorus loading methodologies utilized in the Croton Falls Reservoir TMDL, the Palmer Lake TMDL and the MS4 Stormwater Retrofit program, though different, all utilize a similar premise: “the phosphorus load from non-point sources is controlled primarily by the land use.” - Croton Falls Reservoir TMDL, p. 19. The land use export coefficients used for the Palmer Lake TMDL were derived from monitoring studies conducted in twenty two (22) watersheds in NY State and New England, and the Department considers them appropriate for this watershed. The Department agrees that TMDL implementation is a challenging issue and that any effort to sewer the lake properties will require substantial financial assistance. A summary of currently available loan and grant opportunities is included in the final TMDL Implementation section. Comment #8: The phosphorus discharge from the waste water treatment plan (WWTF) to Palmer Lake is indicated as 10.7 lbs/yr. As the Town of Kent is a regulated MS4, this load adds to the total amount of phosphorous that Kent is ultimately responsible to reduce in order to comply with MS4 permit requirements unless there is at least a commensurate reduction in phosphorus loading by connecting to sewers the properties within the sewer district. This analysis should be included. Response #8: The final TMDL has been revised per this comment to include the estimated reductions in phosphorus loading as a result of the installation of sewers along Route 52 and the connection of thirteen commercial septic systems to the WWTF, which will result in a phosphorus reduction to Palmer Lake. This estimated reduction has been accounted for in the waste load allocation for the Kent Manor WWTF. Comment #9: Section 4.2.1: Page 11 (3rd paragraph): The report indicates that the soils used to determine normal, ponding or short-circuited septic systems consist of Chatfield soils which have 20”-40” to lithic bedrock. Review of the NRCS soil maps reveals that the predominant soil within the area of homes around the lake (65% +/-) is Charlton- Chatfield complex (CrC) rolling and very rocky which have a depth to restrictive layer of more than 80”. Additionally, the area also is comprised (8% +/-) of Charlton Loam (ChB) soils which have a depth to restrictive layer of 80”. Charlton-Chatfield complex (CsD) hilly, very rock with a restrictive layer (depth to lithic bedrock of 20”-40”) comprises only 11.9% of the area. As soil maps are generally not accurate

44
to mapping unit levels, it is unclear if NYSDEC conducted any actual soil testing to support the soil analysis. Response #9: The Department did not conduct soil tests as part of the TMDL analysis. The Department estimated total deficient septic systems (normal, ponding or short-circuited) based on proximity to Palmer Lake, as it typically does when writing TMDLs. Additionally, as noted in response to comment #2, the Department reviewed hundreds of records at the Putnam County Health Department that documented septic failures on properties in the Palmer Lake watershed. The assessment of watershed soils, including complex soil types where depth to restrictive layer varied widely, provided additional information about the likelihood of septic system failure. The commenter correctly states that soil maps are generally not accurate to mapping unit levels, therefore, there is more uncertainty in determination of soil type in smaller watersheds. Comment #10: Discussion with a former lake board member did not reveal a substantial history of Health Department closures due to high bacteria counts which would be due to failing septic systems. Response #10: The Department reviewed hundreds of documents related to septic system failures on properties in the Palmer Lake watershed, and, as expected, few failures were reported close to the lake, as these systems are likely short-circuiting with no evidence of surface failure. See response to Comment #2. Comment #11: A map in which the developed areas around the lake are overlaid on an accurate soils map would be helpful in more accurately determining soil-septic system characteristics. Response #11: The USDA website http://websoilsurvey.sc.egov.usda.gov/App/HomePage.htm contains a soils mapper that can provide information about the soil types surrounding the lake. However, as indicated in the TMDL, the basis for the estimate of deficient septic systems was proximity of the house to Palmer Lake and the Department review of hundreds of records at the Putnam County Health Department that documented septic failures on properties in the Palmer Lake watershed. See response to Comment #2 Comment #12: Section 4.2.2 The stormwater infrastructure within the watershed of Palmer Lake may discharge through outfalls to the lake. It is unclear in the NYSDEC analysis why point sources were not considered in the total phosphorous load assignments for Palmer Lake (Table 6, page 17). Further review by the Town Engineer is recommended. Response #12: The MS4 outfalls were effectively modeled using Mapshed/GWLF to estimate stormwater runoff into the lake, along with associated phosphorus loading and identified in the TMDL. The watershed stormwater analysis calculated phosphorus loading for stormwater from developed land utilizing land use coefficients and total developed land.

45
Comment #13: Section 5.2 Figure 8 data represents a simulation of summer mean epilimnetic data. It is my understanding that there has been historical lake water sampling by a professional lake management company (Princeton Hydro). It is unclear why this actual data was not used to supplement NYSDEC testing conducted in 2010 and 2013.
Response #13: In order for data to be utilized in the development of a TMDL there must be a federally approved Quality Assurance Project Plan (QAPP) that would have specified established sampling protocols and quality control measures. The data collected by Princeton Hydro was not subject to sampling protocols established by the Department in the Small Lakes TMDL Sampling Quality Assurance Procedures Plan, and for this reason the data cannot be used for TMDL calculations.
Comment #14: Section 6.1 It is not clear how the TMDL reduction of 10% from implementation of MS4 permit requirements was derived. Response #14: 10% is a modest estimate of reduction for the implementation of the Six (6) Minimum Control Measures required in the MS4 permit. Additionally, the Town of Kent MS4 permit requires additional measures to specifically control phosphorous in their stormwater discharges. It also should be noted that the NYS Dishwasher Detergent and Nutrient Runoff Law went into effect on August 14, 2010 which places restrictions on dishwasher detergents and fertilizers that contain phosphorus. The law will reduce the quantity of phosphorus entering the State’s waters, and is based on monitoring results from across the country. For example, the City of Ann Arbor enacted an ordinance in 2007 to limit phosphorus application to lawns, resulting in an estimated 22% reduction in phosphorus entering the Huron River. Comment #15: Section 7.1. The report indicates that the Palmer Lake TMDL can be met only by sewering the lake properties. Within the context of implementation, realistic costs and funding opportunities should be discussed. Response #15: The Implementation Section has been amended to include grant and funding opportunities and information regarding contact staff for communities wishing to consider moving from individual septic systems to watershed-wide sewering. Realistic costs may be best estimated by a sewering assessment study conducted by a qualified professional. An assessment study is the first recommendation of the TMDL. Comment #16:
46
This section also indicates that the use of green infrastructure, alone or in combination with other strategies are available to achieve waste load allocation and/or load reduction targets of the TMDL and/or to assure that future growth does not result in increases in phosphorous loads to Palmer Lake that degrade current water quality. Further details including practical information of potential green infrastructure components, areas of installation and projected phosphorous removal and cost would expand on the supplied information. Response #16: The Department has not quantified specific phosphorus reductions from individual GI practices to date, but recognizes an estimated phosphorus reduction based on the phosphorus load in stormwater that is infiltrated by GI practices. Specific reductions would need to be determined on a case by case basis. Additional information on GI components and areas of installation may be found in Chapter 5 of the New York State Stormwater Design Manual. Comment #17: Section 7.1.1 Additional details of a management system as an interim measure to ensure design and operation of individual systems would provide necessary information to implement. Response #17: As all MS4s in the NYC East of Hudson (EOH) Watershed are required to implement and enforce a program for the inspection, maintenance, and, where necessary, the rehabilitation of septic systems, inspections (at least once every five years) and repairs of failing septic systems should be occurring in the Palmer Lake Watershed as required by the provisions of the MS4 Permit. An enhanced surveying and testing program, above and beyond the requirements of the MS4 Permit requirements, could be implemented to document the location of septic systems and verify failing systems, requiring replacement in accordance with the NY State Sanitary Code. Property owners should be educated on proper maintenance of their septic systems and encouraged to make preventative repairs. Recommended strategies could also include retaining a qualified professional for study of the near shore properties, dye testing individual systems and specific recommendations for repair based on any findings of deficiency, including installation of New York State Department of Health 10NYCRR Appendix 75-A compliant systems where required. Comment #18: Section 7.1.2 A copy of the referenced compliance schedule and plan should be provided to the Town when available. Response #18: The Kent Manor SPDES Permit and associated compliance schedule and plan has been provided to the Town. Comment #19: Section 7.1.3

47
Potential retrofit sites and reduction in phosphorous loading as a result of the installation of the retrofits should be included. Funding sources to construct the NYSDEC approved retrofits which would be accomplished in years 6-10 should be identified. Response #19: The Department is not aware of any retrofits that have been identified and constructed in the Palmer Lake watershed to date by the East of Hudson Coalition which is currently managing the retrofit program. It is expected that the stormwater retrofit program will be implemented for an additional 5 years (beginning in 2016). When siting future stormwater retrofit projects it is recommended that an analysis be undertaken to determine if a cost effective retrofit project(s) can be constructed in the Palmer Lake watershed. Such a retrofit project would provide phosphorous reduction for Palmer Lake and the overall Croton watershed and count towards the phosphorous reduction required by the MS4 SPDES General Permit. Comment #20: Installation of sewers along Route 52 should result in a reduction of phosphorous loading in the Lake Carmel/EOH watershed. It is unclear if these reductions have been analyzed and credited to the Town of Kent. Response #20: The Department is currently drafting a TMDL for Lake Carmel and the phosphorus loading reduction attributed to sewering of properties along Route 52 in the Lake Carmel watershed will be articulated in that TMDL. Comment #21: Section 7.1.4.1 The inclusion of specific aquatic weed control strategies is recommended. In addition, as the average depth of the lake is indicated as four (4) feet, phosphorous contributions to the lake from internal loading may be discussed. Response #21: Excessive weed growth in the lake is a symptom rather than a cause of nutrient loading, and removal of weeds will not appreciably affect the phosphorus loading to the lake. Nonetheless, information on types of weeds and weed control options is included in the Implementation section to aid in the decision to treat this nuisance symptom for the benefit of the lake community. Accurate simulation of internal phosphorus loading is an uncertain science and a generally applicable method has yet to be identified. Typically, in drafting TMDL source loads, once all external sources of phosphorus loading are identified, it is assumed that any remaining load originates from internal sources. In the case of Palmer Lake, the identified external loading and calculated phosphorus concentration in the tributary load matched well with the resultant calculated phosphorus concentration in the lake, so a value for internal loading was not assigned. Comment #22:

48
It seems this TMDL report was made based on a lot of assumptions that are not necessarily true and/or will drastically change if and when the Kent Manor Development is built. Figure 3 shows 39.10% developed land in the Palmer Lake watershed. If and when Kent Manor is built this number will rise drastically. The percentage of impervious surface will rise as well. This will significantly affect the phosphorus into the lake. This future event was not factored in. Would a new TMDL be issued when that happens? Table 6 shows a reduction of 83.6 pounds in the Septic System category for a 100% reduction. This is an absolute fallacy. It assumes that the septic systems will be sewered. As there is currently no plan and/or funding in the community to accomplish this, the 83.6 pounds should not have been removed from the calculations. This would show that the already impaired Palmer Lake will have an additional 10.7 pounds of phosphorus added per year. It was stated that the WWTF outflow will be measures at the discharge point. This does not take into consideration the additional phosphorus which the additional flow created by effluent discharge will pick up on its way to Palmer Lake. Measuring should be done at the point the effluent drains into Palmer Lake. Response #22: The increase in impervious surfaces accompanying the Kent Manor Development construction was considered in the TMDL analysis. The approved design for the stormwater best management practices (BMPs) associated with the Kent Manor Development construction included post-construction water quality treatment practices which when modeled ensured that the post-developed conditions will be equal to pre-developed conditions, therefore showing no increase in phosphorus loading as a result of the change in land use. The TMDL implementation plan recommends that the septic load from 30 houses nearest to the lake be collected and treated by the Kent Manor WWTF. The Department has no regulatory authority over the decision to sewer the lake community and cannot therefore require that the Hill and Dale community accept this solution as the remedy for the impaired lake. All the phosphorus loading associated runoff from each land use was included in the TMDL calculation, including phosphorus loading due to stormwater runoff from the land between the WWTF discharge point and Palmer Lake itself. Comment #23: The Town of Kent Route 52 Sewer System Facility Plan as presented to Putnam County for the $2.5 million needed from the East of Hudson Fund (EOH) to construct a sewer district on Route 52 in Lake Carmel, NY, did not include any properties in the Palmer Lake drainage basin. After receiving the EOH funding properties in the Palmer Lake drainage basin were later added to Route 52 Sewer District to cause the discharge of the entire Route 52 Sewer District's effluent into the Croton System via Lake Palmer. This decision was made by the Supervisor of Kent, Kathy Doherty (Doherty). At the time Doherty made this decision, Doherty owned property in Lake Carmel.

49
On July 15, 2010, the Supervisor of Kent, Kathy Doherty (Doherty), presented a copy of Route 52 Sewer System Facility Study to the Putnam County Legislatures. The Route 52 Sewer District Facility Service Area, (p3, section 3.2 Service Area - Proposed), would consist of 40 lots draining entirely in the Middle Branch System. The plan summary noted in bullet point #14, (pl8, "In order for the NYCDEP to approve the required variance the stormwater retrofits should focus on the drainage area to Lake Carmel.) indicates Lake Palmer was never considered as being a part of the Route 52 Sewer System. On September 24, 2010, Putnam County approves the use of $2.5 million in East of Hudson funding for the Route 52 Sewer District. This funding was for a sewer district that was composed entirely of properties draining into the Middle Branch System. On May 4, 2012, the Route 52 Sewer District was increased to include properties draining into the Croton Falls Watershed. This decision was approved by the Supervisor of Kent, Doherty. At the time Doherty made this decision, Doherty owned property in Lake Carmel and two parcels in the newly expanded Route 52 Sewer District. Putnam County authorized the expenditure of EOH funds for a project that discharged into the Middle Branch Watershed. Lake Palmer is a stressed and impaired waterbody that was chosen for both political and financial reasons to be the recipient of up to 37,230,000 gallons of effluent produced each year by the Route 52 Sewer District. That effluent will contain 10 pounds phosphorus that will drain from the Sewer District into Lake Palmer. The DEC should direct the Route 52 Sewer District to comply with the original Sewer System Facility Plan and order that the treated discharge be released into the Middle Branch Watershed system. Response #23: In 2009, the Department issued a SPDES permit modification to the Kent Manor Sewer Corporation authorizing discharge from the Kent Manor Wastewater Treatment Plant ("WWTF") of 70,000 gallons per day ("gpd") to an unnamed tributary to Palmer Lake (SPDES Number NY0207322) (the "2009 SPDES Permit"). The 2009 SPDES Permit also required Kent Manor Sewer Corporation to establish a fund not to exceed $200,000 for the purpose of funding Palmer Lake Total Maximum Daily Load (''TMDL'') phosphorous load reductions, if the Department developed a TMDL analysis for Palmer Lake. The 2009 SPDES modification reduced the annual permitted phosphorus load from the Kent Manor WWTF from 310.5 1bs/year (102,000 gpd at 1.0 mg/l) to 10.71 lbs/yr (70,000 gpd at .05 mg/l). The Draft 2012 SPDES Permit proposed to increase flow from the Kent Manor WWTF from 70,000 gpd to 103,200 gpd (33,200 gpd more than the current permit limit of 70,000 gpd) and maintained all current wastewater discharge standards and limitations. The increased flow would be treated by the Kent Manor WWTF and be discharged to Palmer Lake with a phosphorus effluent limit of 0.05 mg/l, the same limit contained in the 2009 SPDES permit. The additional flow would result in an increased phosphorus load of 5.1 lb/yr. The total phosphorous load would then be 15.8 lb/yr (10.7 lb/yr as currently permitted + 5.1 lb/yr for the additional flows), assuming that the wastewater treatment plant operates at maximum capacity and discharges at the permit's phosphorus effluent limit 365 days a year.
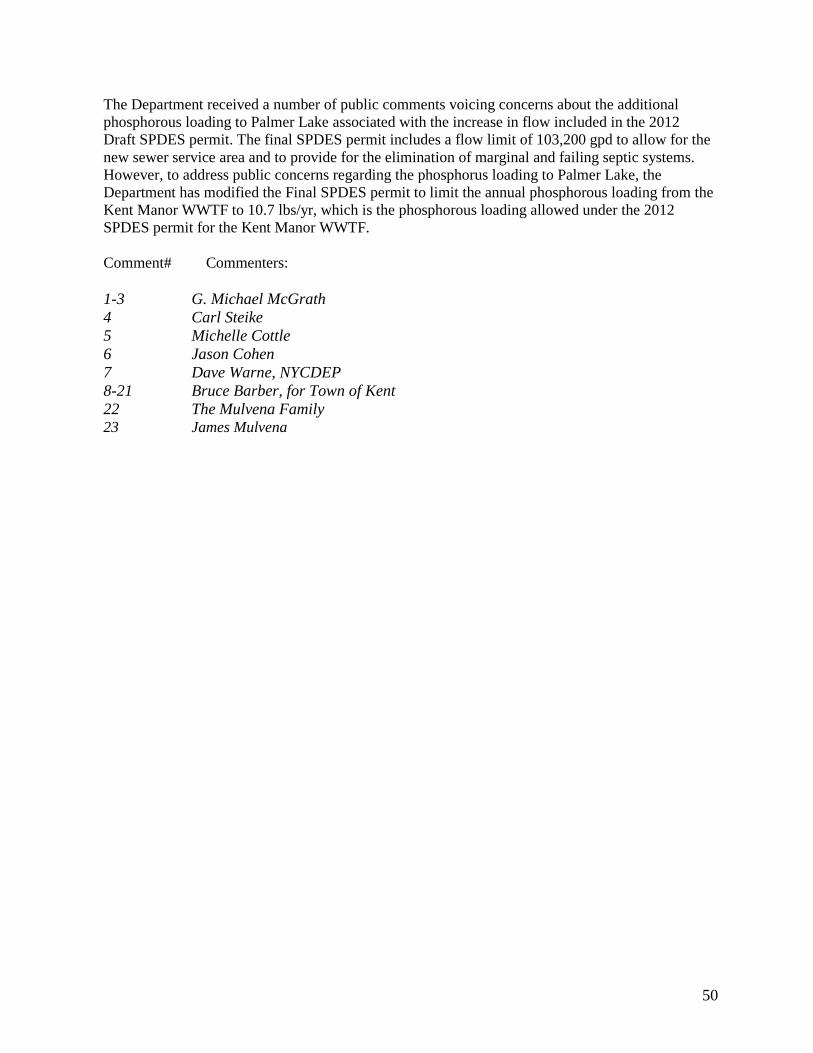
50
The Department received a number of public comments voicing concerns about the additional phosphorous loading to Palmer Lake associated with the increase in flow included in the 2012 Draft SPDES permit. The final SPDES permit includes a flow limit of 103,200 gpd to allow for the new sewer service area and to provide for the elimination of marginal and failing septic systems. However, to address public concerns regarding the phosphorus loading to Palmer Lake, the Department has modified the Final SPDES permit to limit the annual phosphorous loading from the Kent Manor WWTF to 10.7 lbs/yr, which is the phosphorous loading allowed under the 2012 SPDES permit for the Kent Manor WWTF. Comment# Commenters:
1-3 G. Michael McGrath 4 Carl Steike 5 Michelle Cottle 6 Jason Cohen 7 Dave Warne, NYCDEP 8-21 Bruce Barber, for Town of Kent 22 The Mulvena Family 23 James Mulvena

51
APPENDIX A. MAPSHED MODELING ANALYSIS
The MapShed model was developed in response to the need for a version of AVGWLF that would operate in a non-proprietary GIS package. AVGWLF had previously been calibrated for the Northeastern U.S. in general and New York specifically. Conversion of the calibrated AVGWLF to MapShed involved the transfer of updated model coefficients and a series of verification model runs. The calibration and conversion of the models is discussed in detail in this section.
Northeast AVGWLF Model
The AVGWLF model was calibrated and validated for the northeast (Evans et al., 2007). AVGWLF requires that calibration watersheds have long-term flow and water quality data. For the northeast model, watershed simulations were performed for twenty-two (22) watersheds throughout New York and New England for the period 1997-2004 (Figure 10). Flow data were obtained directly from the water resource database maintained by the U.S. Geological Survey (USGS). Water quality data were obtained from the New York and New England State agencies. These data sets included in-stream concentrations of nitrogen, phosphorus, and sediment based on periodic sampling.
52
Figure 10. Location of Calibration and Verification Watersheds for the Original Northeast AVGWLF Model
53
In this step, adjustments were iteratively made in various model parameters until a “best fit” was achieved between simulated and observed stream flow, and sediment and nutrient loads. Based on the calibration results, revisions were made in various AVGWLF routines to alter the manner in which model input parameters were estimated. To check the reliability of these revised routines, follow-up verification runs were made on the remaining eleven watersheds for the same time period. Finally, statistical evaluations of the accuracy of flow and load predictions were made.
To derive historical nutrient loads, standard mass balance techniques were used. First, the in-stream nutrient concentration data and corresponding flow rate data were used to develop load (mass) versus flow relationships for each watershed for the period in which historical water quality data were obtained. Using the daily stream flow data obtained from USGS, daily nutrient loads for the 1997-2004 time period were subsequently computed for each watershed using the appropriate load versus flow relationship (i.e., “rating curves”). Loads computed in this fashion were used as the “observed” loads against which model-simulated loads were compared.
During this process, adjustments were made to various model input parameters for the purpose of obtaining a “best fit” between the observed and simulated data. With respect to stream flow, adjustments were made that increased or decreased the amount of the calculated evapotranspiration and/or “lag time” (i.e., groundwater recession rate) for sub-surface flow. With respect to nutrient loads, changes were made to the estimates for sub-surface nitrogen and phosphorus concentrations. In regard to both sediment and nutrients, adjustments were made to the estimate for the “C” factor for cropland in the USLE equation, as well as to the sediment “a” factor used to calculate sediment loss due to stream bank erosion. Finally, revisions were also made to the default retention coefficients used by AVGWLF for estimating sediment and nutrient retention in lakes and wetlands.
Based upon an evaluation of the changes made to the input files for each of the calibration watersheds, revisions were made to routines within AVGWLF to modify the way in which selected model parameters were automatically estimated. The AVGWLF software application was originally developed for use in Pennsylvania, and based on the calibration results, it appeared that certain routines were calculating values for some model parameters that were either too high or too low. Consequently, it was necessary to make modifications to various algorithms in AVGWLF to better reflect conditions in the Northeast. A summary of the algorithm changes made to AVGWLF is provided below.
• ET: A revision was made to increase the amount of evapotranspiration calculated automatically by AVGWLF by a factor of 1.54 (in the “Pennsylvania” version of AVGWLF, the adjustment factor used is 1.16). This has the effect of decreasing simulated stream flow.
• GWR: The default value for the groundwater recession rate was changed from 0.1 (as used in Pennsylvania) to 0.03. This has the effect of “flattening” the hydrograph within a given area.
54
• GWN: The algorithm used to estimate “groundwater” (sub-surface) nitrogen concentration was changed to calculate a lower value than provided by the “Pennsylvania” version.
• Sediment “a” Factor: The current algorithm was changed to reduce estimated stream bank- derived sediment by a factor of 90%. The streambank routine in AVGWLF was originally developed using Pennsylvania data and was consistently producing sediment estimates that were too high based on the in-stream sample data for the calibration sites in the Northeast. While the exact reason for this is not known, it’s likely that the glaciated terrain in the Northeast is less abundance of lakes, ponds and wetlands in the Northeast have an effect on flow velocities and sediment transport.
• Lake/Wetland Retention Coefficients: The default retention coefficients for sediment, nitrogen and phosphorus are set to 0.90, 0.12 and 0.25, respectively, and changed at the user’s discretion.
To assess the correlation between observed and predicted values, two different statistical measures were utilized: 1) the Pearson product-moment correlation (R2) coefficient and 2) the Nash-Sutcliffe coefficient. The R2 value is a measure of the degree of linear association between two variables, and represents the amount of variability that is explained by another variable (in this case, the model- simulated values). Depending on the strength of the linear relationship, the R2 can vary from 0 to 1, with 1 indicating a perfect fit between observed and predicted values. Like the R2 measure, the Nash- Sutcliffe coefficient is an indicator of “goodness of fit,” and has been recommended by the American Society of Civil Engineers for use in hydrological studies (ASCE, 1993). With this coefficient, values equal to 1 indicate a perfect fit between observed and predicted data, and values equal to 0 indicate that the model is predicting no better than using the average of the observed data. Therefore, any positive value above 0 suggests that the model has some utility, with higher values indicating better model performance. In practice, this coefficient tends to be lower than R2 for the same data being evaluated.
Adjustments were made to the various input parameters for the purpose of obtaining a “best fit” between the observed and simulated data. One of the challenges in calibrating a model is to optimize the results across all model outputs (in the case of AVGWLF, stream flows, as well as sediment, nitrogen, and phosphorus loads). As with any watershed model like GWLF, it is possible to focus on a single output measure (e.g., sediment or nitrogen) in order to improve the fit between observed and simulated loads. Isolating on one model output, however, can sometimes lead to less acceptable results for other measures. Consequently, it is sometimes difficult to achieve very high correlations (e.g., R2 above 0.90) across all model outputs. Given this limitation, it was felt that very good results were obtained for the calibration sites. In model calibration, initial emphasis is usually placed on getting the hydrology correct. Therefore, adjustments to flow-related model parameters are usually finalized prior to making adjustments to parameters specific to sediment and nutrient production. This typically results in better statistical fits between stream flows than the other model outputs.
For the monthly comparisons, mean R2 values of 0.80, 0.48, 0.74, and 0.60 were obtained for the calibration watersheds for flow, sediment, nitrogen and phosphorus, respectively. When considering the inherent difficulty in achieving optimal results across all measures as discussed above (along with the potential sources of error), these results are quite good. The sediment load

55
predictions were less satisfactory than those for the other outputs, and this is not entirely unexpected given that this constituent is usually more difficult to simulate than nitrogen or phosphorus. An improvement in sediment prediction could have been achieved by isolating on this particular output during the calibration process; but this would have resulted in poorer performance in estimating the nutrient loads for some of the watersheds. Phosphorus predictions were less accurate than those for nitrogen. This is not unusual given that a significant portion of the phosphorus load for a watershed is highly related to sediment transport processes. Nitrogen, on the other hand, is often linearly correlated to flow, which typically results in accurate predictions of nitrogen loads if stream flows are being accurately simulated.
As expected, the monthly Nash-Sutcliffe coefficients were somewhat lower due to the nature of this particular statistic. As described earlier, this statistic is used to iteratively compare simulated values against the mean of the observed values, and values above zero indicate that the model predictions are better than just using the mean of the observed data. In other words, any value above zero would indicate that the model has some utility beyond using the mean of historical data in estimating the flows or loads for any particular time period. As with R2 values, higher Nash-Sutcliffe values reflect higher degrees of correlation than lower ones.
Improvements in model accuracy for the calibration sites were typically obtained when comparisons were made on a seasonal basis. This was expected since short-term variations in model output can oftentimes be reduced by accumulating the results over longer time periods. In particular, month-to- month discrepancies due to precipitation events that occur at the end of a month are often resolved by aggregating output in this manner (the same is usually true when going from daily output to weekly or monthly output). Similarly, further improvements were noted when comparisons were made on a mean annual basis. What these particular results imply is that AVGWLF, when calibrated, can provide very good estimates of mean annual sediment and nutrient loads.
Following the completion of the northeast AVGWLF model, there were a number of ideas on ways to improve model accuracy. One of the ideas relates to the basic assumption upon which the work undertaken in that project was based. This assumption is that a “regionalized” model can be developed that works equally well (without the need for resource-intensive calibration) across all watersheds within a large region in terms of producing reasonable estimates of sediment and nutrient loads for different time periods. Similar regional model calibrations were previously accomplished in earlier efforts undertaken in Pennsylvania (Evans et al., 2002) and later in southern Ontario (Watts et al., 2005). In both cases this task was fairly daunting given the size of the areas involved. In the northeast effort, this task was even more challenging given the fact that the geographic area covered by the northeast is about three times the size of Pennsylvania, and arguably is more diverse in terms of its physiographic and ecological composition.
As discussed, AVGWLF performed very well when calibrated for numerous watersheds throughout the region. The regionalized version of AVGWLF, however, performed less well for the verification watersheds for which additional adjustments were not made subsequent to the initial model runs. This decline in model performance may be a result of the regionally-
56
adapted model algorithms not being rigorous enough to simulate spatially-varying landscape processes across such a vast geographic region at a consistently high degree of accuracy. It is likely that un-calibrated model performance can be enhanced by adapting the algorithms to reflect processes in smaller geographic regions such as those depicted in the physiographic province map in Figure 11.
Fine-tuning & Re-Calibrating the Northeast AVGWLF for New York State For the TMDL development work undertaken in New York, the original northeast
AVGWLF model was further refined by The Cadmus Group, Inc. and Dr. Barry Evans to reflect the physiographic regions that exist in New York. Using data from some of the original northeast model calibration and verification sites, as well as data for additional calibration sites in New York, three new versions of AVGWLF were created for use in developing TMDLs in New York State. Information on the fourteen (14) sites is summarized in Table 8. Two models were developed based on the following two physiographic regions: Eastern Great Lakes/Hudson Lowlands area and the Northeastern Highlands area. The model was calibrated for each of these regions to better reflect local conditions, as well as ecological and hydrologic processes. In addition to developing the above mentioned physiographic-based model calibrations, a third model calibration was also developed. This model calibration represents a composite of the two physiographic regions and is suitable for use in other areas of upstate New York.
Figure 11. Location of Physiographic Provinces in New York and New England
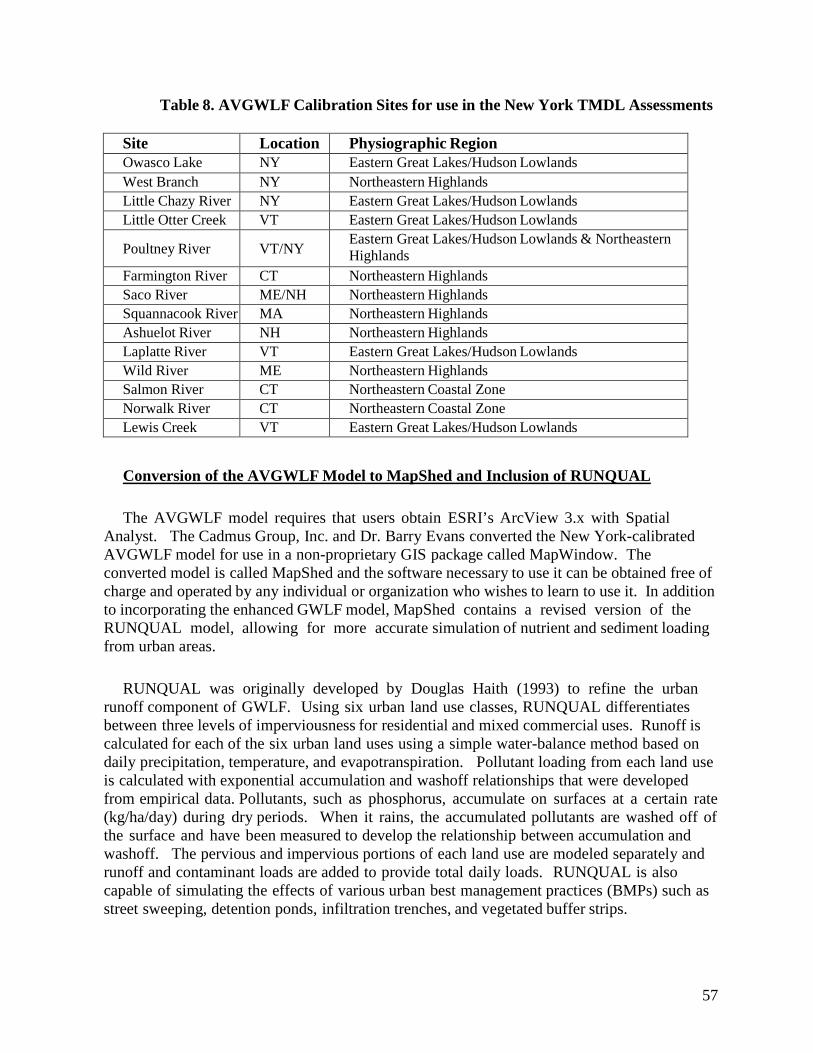
57
Table 8. AVGWLF Calibration Sites for use in the New York TMDL Assessments Site Location Physiographic Region Owasco Lake NY Eastern Great Lakes/Hudson Lowlands West Branch NY Northeastern Highlands Little Chazy River NY Eastern Great Lakes/Hudson Lowlands Little Otter Creek VT Eastern Great Lakes/Hudson Lowlands
Poultney River
VT/NY Eastern Great Lakes/Hudson Lowlands & Northeastern Highlands
Farmington River CT Northeastern Highlands Saco River ME/NH Northeastern Highlands Squannacook River MA Northeastern Highlands Ashuelot River NH Northeastern Highlands Laplatte River VT Eastern Great Lakes/Hudson Lowlands Wild River ME Northeastern Highlands Salmon River CT Northeastern Coastal Zone Norwalk River CT Northeastern Coastal Zone Lewis Creek VT Eastern Great Lakes/Hudson Lowlands
Conversion of the AVGWLF Model to MapShed and Inclusion of RUNQUAL
The AVGWLF model requires that users obtain ESRI’s ArcView 3.x with Spatial Analyst. The Cadmus Group, Inc. and Dr. Barry Evans converted the New York-calibrated AVGWLF model for use in a non-proprietary GIS package called MapWindow. The converted model is called MapShed and the software necessary to use it can be obtained free of charge and operated by any individual or organization who wishes to learn to use it. In addition to incorporating the enhanced GWLF model, MapShed contains a revised version of the RUNQUAL model, allowing for more accurate simulation of nutrient and sediment loading from urban areas.
RUNQUAL was originally developed by Douglas Haith (1993) to refine the urban runoff component of GWLF. Using six urban land use classes, RUNQUAL differentiates between three levels of imperviousness for residential and mixed commercial uses. Runoff is calculated for each of the six urban land uses using a simple water-balance method based on daily precipitation, temperature, and evapotranspiration. Pollutant loading from each land use is calculated with exponential accumulation and washoff relationships that were developed from empirical data. Pollutants, such as phosphorus, accumulate on surfaces at a certain rate (kg/ha/day) during dry periods. When it rains, the accumulated pollutants are washed off of the surface and have been measured to develop the relationship between accumulation and washoff. The pervious and impervious portions of each land use are modeled separately and runoff and contaminant loads are added to provide total daily loads. RUNQUAL is also capable of simulating the effects of various urban best management practices (BMPs) such as street sweeping, detention ponds, infiltration trenches, and vegetated buffer strips.

58
Set-up of the “New York State” MapShed Model Using data for the time period 1990-2013, the calibrated MapShed model was used to
estimate mean annual phosphorus loading to the lake. Table 9 provides the sources of data used for the MapShed modeling analysis. The various data preparation steps taken prior to running the final calibrated MapShed Model for New York are discussed below the table
Table 9. Information Sources for MapShed Model Parameterization
WEATHER.DAT file Data Source or Value Historical weather data from Yorktown, NY and
Stormville, NY National Weather Service Stations
TRANSPORT.DAT file Data Source or Value Basin size GIS/derived from basin boundaries Land use/cover distribution GIS/derived from land use/cover map Curve numbers by source area GIS/derived from land cover and soil maps USLE (KLSCP) factors by source area GIS/derived from soil, DEM, & land cover ET cover coefficients GIS/derived from land cover Erosivity coefficients GIS/ derived from physiographic map Daylight hrs. by month Computed automatically for state Growing season months Input by user Initial saturated storage Default value of 10 cm Initial unsaturated storage Default value of 0 cm Recession coefficient Default value of 0.1 Seepage coefficient Default value of 0 Initial snow amount (cm water) Default value of 0 Sediment delivery ratio GIS/based on basin size Soil water (available water capacity) GIS/derived from soil map
NUTRIENT.DAT file Data Source or Value Dissolved N in runoff by land cover type Default values/adjusted using GWLF Manual Dissolved P in runoff by land cover type Default values/adjusted using GWLF Manual N/P concentrations in manure runoff Default values/adjusted using AEU density N/P buildup in urban areas Default values (from GWLF Manual) N and P point source loads Derived from SPDES point coverage Background N/P concentrations in GW Derived from new background N map
Background P concentrations in soil Derived from soil P loading map/adjusted using GWLF Manual
Background N concentrations in soil Based on map in GWLF Manual Months of manure spreading Input by user
Population on septic systems Derived from census tract maps for 2010 and house counts
Per capita septic system loads (N/P) Default values/adjusted using AEU density

59
Land Use
The 2006 NLCD land use coverage was obtained, recoded, and formatted specifically for use in MapShed for this TMDL. The New York State High Resolution Digital Orthoimagery was used to perform updates and corrections to the 2001 NLCD land use coverage to more accurately reflect current conditions. Staff visually inspected the land uses in the basin for the potential need for land use corrections. The following were the corrections applied:
1) Hay/Pasture/Cropland was identified as Open Space.
Total phosphorus concentrations in runoff from the urban land uses was acquired from the National Stormwater Quality Database (Pitt, et al., 2008). These data were used to adjust the model’s default phosphorus accumulation rates. These adjustments were made using best professional judgment based on examination of specific watershed characteristics and conditions.
Phosphorus retention in wetlands and open waters in the basin can be accounted for in MapShed. MapShed recommends the following coefficients for wetlands and pond retention in the northeast: nitrogen (0.12), phosphorus (0.25), and sediment (0.90). Wetland retention coefficients for large, naturally occurring wetlands vary greatly in the available literature. Depending on the type, size and quantity of wetland observed, the overall impact of the wetland retention routine on the original watershed loading estimates, and local information regarding the impact of wetlands on watershed loads, wetland retention coefficients defaults were adjusted accordingly. The percentage of the watershed area that drains through a wetland area was calculated and used in conjunction with nutrient retention coefficients in MapShed. To determine the percent wetland area, the total basin land use area was derived using ArcView. Of this total basin area, the area that drains through emergent and woody wetlands were delineated to yield an estimate of total watershed area draining through wetland areas. If a basin displays large areas of surface water (ponds) aside from the water body being modeled, then this open water area is calculated by subtracting the water body area from the total surface water area.
On-site Wastewater Treatment Systems (“septic tanks”)
MapShed, following the method from GWLF, simulates nutrient loads from septic systems as a function of an estimate of the unsewered population served by normally functioning vs. three types of malfunctioning systems: ponded, short-circuited, and direct discharge (Haith et al., 1992).
• Normal Systems are septic systems whose construction and operation conforms to recommended procedures, such as those suggested by the EPA design manual for on-site wastewater disposal systems. Effluent from normal systems infiltrates into the soil and enters the shallow saturated zone. Phosphates in the
60
effluent are adsorbed and retained by the soil and hence normal systems provide no phosphorus loads to nearby waters.
• Short-Circuited Systems are located close enough to surface water (~15 meters) so that negligible adsorption of phosphorus takes place. The only nutrient removal mechanism is plant uptake. Therefore, these systems are always contributing to nearby waters.
• Ponded Systems exhibit hydraulic malfunctioning of the tank’s absorption field and resulting surfacing of the effluent. Unless the surfaced effluent freezes, ponding systems deliver their nutrient loads to surface waters in the same month that they are generated through overland flow. If the temperature is below freezing, the surfacing is assumed to freeze in a thin layer at the ground surface. The accumulated frozen effluent melts when the snowpack disappears and the temperature is above freezing.
• Direct Discharge Systems illegally discharge septic tank effluent directly into surface waters.
The estimated number of septic systems in the watershed was estimated visually using orthoimagery. T he number of houses within 250 feet of the lakes was counted and applied. To convert the estimated number of septic systems to population served, an average household size of 2.6 people per dwelling was used based on the circa 2010 USCB census estimate for number of persons per household in New York State.
MapShed also requires an estimate of the number of normal and malfunctioning septic systems. These assumptions are based on data from Putnam County Health Department records of septic system failures and repairs and best professional judgment.
To account for seasonal variations in population, data from the 2000 census were used to estimate the percentage of seasonal homes for the town(s) surrounding the lake. The failure rate for septic systems closer to the lake (i.e., within 250 feet) were adjusted to account for increased loads due to greater occupancy during the summer months. For the purposes of this analysis, seasonal homes are considered those occupied only during the month of June, July, and August.
Groundwater Phosphorus
Phosphorus concentrations in groundwater discharge are derived by MapShed. Watersheds with a high percentage of forested land will have low groundwater phosphorus concentrations while watersheds with a high percentage of agricultural land will have high concentrations. The GWLF manual provides estimated groundwater phosphorus concentrations according to land use for the eastern United States. Completely forested watersheds have values of 0.006 mg/L. Primarily agricultural watersheds have values of 0.104 mg/L. Intermediate values are also reported. The MapShed-generated groundwater phosphorus concentration was evaluated to ensure groundwater phosphorus values reasonably reflect the actual land use composition of the watershed and modifications were made if deemed unnecessary.

61
Point Sources
One permitted point source exists in the watershed, and an estimated monthly total phosphorus load and flow was determined using estimated flow based on SPDES permitted limit.
Municipal Separate Storm Sewer Systems (MS4s)
Stormwater runoff within Phase II permitted Municipal Separate Storm Sewer Systems (MS4s) is considered a point source of pollutants. Stormwater runoff outside of the MS4 is non-permitted stormwater runoff and, therefore, considered nonpoint sources of pollutants. Permitted stormwater runoff is accounted for in the wasteload allocation of a TMDL, while non-permitted runoff is accounted for in the load allocation of a TMDL.
GWLF Input Transport File:
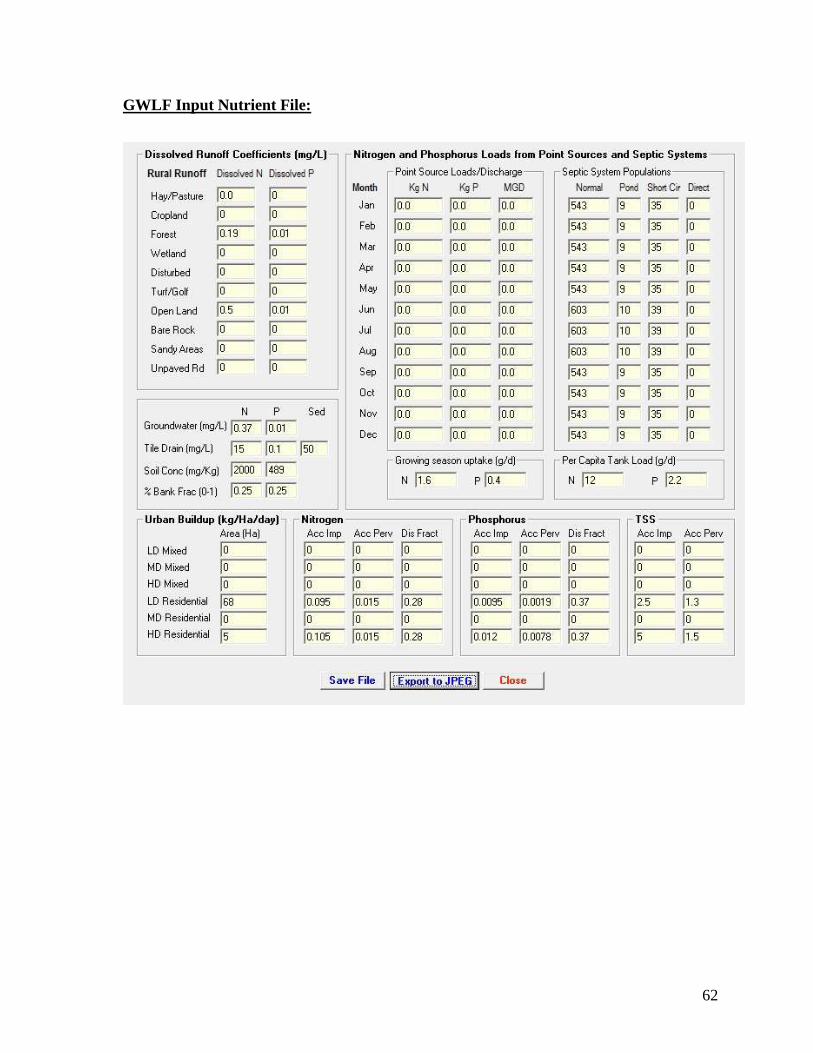
62
GWLF Input Nutrient File:

63
Mapshed Model Simulation Results:
64
APPENDIX B. BATHTUB MODELING ANALYSIS Model Overview
BATHTUB is a steady-state (Windows-based) water quality model developed by the U. S. Army Corps of Engineers (USACOE) Waterways Experimental Station. BATHTUB performs steady- state water and nutrient balance calculations for spatially segmented hydraulic networks in order to simulate eutrophication-related water quality conditions in lakes and reservoirs. BATHTUB’s nutrient balance procedure assumes that the net accumulation of nutrients in a lake is the difference between nutrient loadings into the lake (from various sources) and the nutrients carried out through outflow and the losses of nutrients through whatever decay process occurs inside the lake. The net accumulation (of phosphorus) in the lake is calculated using the following equation:
Net accumulation = Inflow – Outflow – Decay
The pollutant dynamics in the lake are assumed to be at a steady state, therefore, the net accumulation of phosphorus in the lake equals zero. BATHTUB accounts for advective and diffusive transport, as well as nutrient sedimentation. BATHTUB predicts eutrophication-related water quality conditions (total phosphorus, total nitrogen, chlorophyll-a, transparency, and hypolimnetic oxygen depletion) using empirical relationships derived from assessments of reservoir data. Applications of BATHTUB are limited to steady-state evaluations o f relations between nutrient loading, transparency and hydrology, and eutrophication responses. Short-term responses and effects related to structural modifications or responses to variables other than nutrients cannot be explicitly evaluated.
Input data requirements for BATHTUB include: physical characteristics of the watershed lake morphology (e.g., surface area, mean depth, length, mixed layer depth), flow and nutrient loading from various pollutant sources, precipitation (from nearby weather station) and phosphorus concentrations in precipitation (measured or estimated), and measured lake water quality data (e.g., total phosphorus concentrations).
The empirical models implemented in BATHTUB are mathematical generalizations about lake behavior. When applied to data from a particular lake, actual observed lake water quality data may differ from BATHTUB predictions by a factor of two or more. Such differences reflect data limitations (measurement or estimation errors in the average inflow and outflow concentrations) or the unique features of a particular lake (no two lakes are the same). BATHTUB’s “calibration factor” provides model users with a method to calibrate the magnitude of predicted lake response. The model calibrated to current conditions (against measured data from the lakes) can be applied to predict changes in lake conditions likely to result from specific management scenarios, under the condition that the calibration factor remains constant for all prediction scenarios.
Model Set-up Using descriptive information about Palmer Lake and its surrounding drainage area, as well
as output from MapShed, a BATHTUB model was set up for Palmer Lake. Mean annual
65
phosphorus loading to the lake was simulated using MapShed for the period 1990-2013. After initial model development, NYS DEC sampling data were used to assess the model’s predictive capabilities and, if necessary, “fine tune” various input parameters and sub-model selections within BATHTUB during a calibration process. Once calibrated, BATHTUB was used to derive the total phosphorus load reduction needed in order to achieve the TMDL target.
Sources of input data for BATHTUB include:
• Physical characteristics of the watershed and lake morphology (e.g., surface area, mean depth, length, mixed layer depth) - Obtained from CSLAP and bathymetric maps provided by NYS DEC or created by the Cadmus Group, Inc.
• Flow and nutrient loading from various pollutant sources - Obtained from MapShed output.
• Precipitation – Obtained from nearby National Weather Services Stations. • Phosphorus concentrations in precipitation (measured or estimated), and measured
lake water quality data (e.g., total phosphorus concentrations) – Obtained from NYS DEC.
Tables 10 – 13 summarize the primary model inputs for Palmer Lake, including the coefficient of variation (CV), which reflects uncertainty in the input value. Default model choices are utilized unless otherwise noted. Spatial variations (i.e., longitudinal dispersion) in phosphorus concentrations are not a factor in the development of the TMDL for Palmer Lake. Therefore, division of the lake into multiple segments was not necessary for this modeling effort. Modeling the entire lake with one segment provides predictions of area-weighted mean concentrations, which are adequate to support management decisions. Water inflow and nutrient loads from the lake’s watershed were treated as though they originated from one “tributary” (i.e., source) in BATHTUB and derived from MapShed.
BATHTUB is a steady state model, whose predictions represent concentrations averaged over a period of time. A key decision in the application of BATHTUB is the selection of the length of time over which water and mass balance calculations are modeled (the “averaging period”). The length of the appropriate averaging period for BATHTUB application depends upon what is called the nutrient residence time, which is the average length of time that phosphorus spends in the water column before settling or flushing out of the lake. Guidance for BATHTUB recommends that the averaging period used for the analysis be at least twice as large as nutrient residence time for the lake. The appropriate averaging period for water and mass balance calculations would be 1 year for lakes with relatively long nutrient residence times or seasonal (6 months) for lakes with relatively short nutrient residence times (e.g., on the order of 1 to 3 months). The turnover ratio can be used as a guide for selecting the appropriate averaging period. A seasonal averaging period (April/May through September) is usually appropriate if it results in a turnover ratio exceeding 2.0. An annual averaging period may be used otherwise. Other considerations (such as comparisons of

66
observed and predicted nutrient levels) can also be used as a basis for selecting an appropriate averaging period, particularly if the turnover ratio is near 2.0.
Precipitation inputs were taken from the observed long term mean daily total precipitation values from the Yorktown, NY and Stormville, NY National Weather Service Stations for the 1990-2013 period. Evapotranspiration was derived from MapShed using daily weather data (1990-2013) and a cover factor dependent upon land use/cover type. The values selected for precipitation and change in lake storage have very little influence on model predictions. Atmospheric phosphorus loads were specified using data collected by NYS DEC from the Moss Lake Atmospheric Deposition Station located in Herkimer County, NY. Atmospheric deposition is not a major source of phosphorus loading to Palmer Lake and has little impact on simulations.
Lake surface area, mean depth, and length were derived using GIS analysis of bathymetric data. Depth of the mixed layer was estimated using a multivariate regression equation developed by Walker (1999). Existing water quality conditions in Palmer Lake were represented using an average of the observed summer mean phosphorus concentrations for years 2010 and 2013. These data were collected by NYS DEC. The concentration of phosphorus loading to the lake was calculated using the average annual flow and phosphorus loads simulated by MapShed. To obtain flow in units of volume per time, the depth of flow was multiplied by the drainage area and divided by one year. To obtain phosphorus concentrations, the nutrient mass was divided by the volume of flow.
Internal loading rates reflect nutrient recycling from bottom sediments. Internal loading rates are normally set to zero in BATHTUB since the pre-calibrated nutrient retention models already account for nutrient recycling that would normally occur (Walker, 1999). Walker warns that nonzero values should be specified with caution and only if independent estimates or measurements are available. In some studies, internal loading rates have been estimated from measured phosphorus accumulation in the hypolimnion during the stratified period. Results from this procedure should not be used for estimation of internal loading in BATHTUB unless there is evidence the accumulated phosphorus is transported to the mixed layer during the growing season. Specification of a fixed internal loading rate may be unrealistic for evaluating response to changes in external load. Because they reflect recycling of phosphorus that originally entered the reservoir from the watershed, internal loading rates would be expected to vary with external load. In situations where monitoring data indicate relatively high internal recycling rates to the mixed layer during the growing season, a preferred approach would generally be to calibrate the phosphorus sedimentation rate (i.e., specify calibration factors < 1). However, there still remains some risk that apparent internal loads actually reflect under-estimation of external loads.

67
Table 10. BATHTUB Model Input Variables: Model Selections Water Quality Indicator Option Description Total Phosphorus 07 Settling Velocity Phosphorus Calibration 01* Decay Rates Error Analysis 01* Model and Data Availability Factors 00* Ignore Mass Balance Tables 01* Use Estimated Concentrations * Default model choice
Table 11. BATHTUB Model Input: Global Variables Model Input Mean CV Averaging Period (years) 0.25 NA Precipitation (meters) 0.3 0* Evaporation (meters) 0.25 0*
Atmospheric Load (mg/m2-yr)- Total P 30 0.5*
Atmospheric Load (mg/m2-yr)- Ortho P 15 0.5* * Default model choice
Table 12. BATHTUB Model Input: Lake Variables Morphometry Mean CV Surface Area (km2) 0.056 NA Mean Depth (m) 1.2 NA Length (km) 2.46 NA
Estimated Mixed Depth (m) 1.2 0.12 Water Quality Mean CV Total Phosphorus (ppb) 40.3 0
Table 13. BATHTUB Model Input: Watershed “Tributary” Loading Monitored Inputs Mean CV Total Watershed Area (km2) 1.89 NA
Flow Rate (hm3/yr) 1.33 0.1 Total P (ppb) 40.1 0.2 Organic P (ppb) - -

68
Model Calibration
BATHTUB model calibration consists of:
1. Applying the model with all inputs specified as above 2. Comparing model results to observed phosphorus data 3. Adjusting model coefficients to provide the best comparison between model
predictions and observed phosphorus data (only if absolutely required and with extreme caution.
Several t-statistics calculated by BATHTUB provide statistical comparison of observed and predicted concentrations and can be used to guide calibration of BATHTUB. Two statistics supplied by the model, T2 and T3, aid in testing model applicability. T2 is based on error typical of model development data set. T3 is based on observed and predicted error, taking into consideration model inputs and inherent model error. These statistics indicate whether the means differ significantly at the 95% confidence level. If their absolute values exceed 2, the model may not be appropriately calibrated. The T1 statistic can be used to determine whether additional calibration is desirable. The t-statistics for the BATHUB simulations for Palmer Lake are as follows:
Year Observed Simulated T1 T2 T3 Average of years
observed 40.3 39.4 - 0.09 0.98
In cases where predicted and observed values differ significantly, calibration coefficients
can be adjusted to account for the site-specific application of the model. Calibration to account for model error is often appropriate. However, Walker (1999) recommends a conservative approach to calibration since differences can result from factors such as measurement error and random data input errors. Error statistics calculated by BATHTUB indicate that the match between simulated and observed mean annual water quality conditions in Palmer Lake is good. Therefore, BATHTUB is sufficiently calibrated for use in estimating load reductions required to achieve the phosphorus TMDL target in the lake.

69
APPENDIX C. TOTAL EQUIVALENT DAILY PHOSPHORUS LOAD
ALLOCATIONS
Source Total Phosphorus Load (lbs/day)
Current Allocated Reduction % Reduction
Groundwater (Developed Land) 0.027 0.027 0 0%
Septic Systems 0.199 0 0.199 100%
Open Land 0.006 0.006 0 0%
Forest, Streambank, Natural Background
0.057
0.057
0
0%
TOTAL LOAD ALLOCATION 0.289 0.090 0.199 69%
T/Kent MS4 (SPDES # NYR20A346) T/Carmel MS4 (SPDES # NYR20A294)
0.031
0.028
0.003
10%
Kent Manor WWTF (SDPES #NY0207322) 0.0 0.038 0 n/a
TOTAL WASTELOAD ALLOCATION 0.031 0.066 0.035 n/a
LA + WLA 0.319 0.156 - -
Margin of Safety --- 0.017 --- n/a
TOTAL LOAD 0.319 0.173 0.135 46%