smartphone app advertising effectiveness research · in 2012, the number of chinese mobile users...
TRANSCRIPT

Smartphone APP Advertising
Effectiveness Research

Background
2
The size of mobile users has increased dramatically. In 2012, the number of Chinese mobile users has reached 1.11 Billion, and
55% of them are smartphone users. APP as an extreme important element of smartphones, has penetrated into everywhere of people’s
life, including dining, clothing, living, etc. It becomes a significant part of people’s daily life and work, bringing them fun, convenience and
variable discount information. Advertisers generally believe the value of APP traffic is greater than that of WAP now.
In addition, just as other online ads and video advertisements, it is more effective adopting APP ads in early stages; therefore APP
advertisement is now at the window of opportunity for advertisement style innovation.
However, now the industry has encountered with some perceptional challenges with mobile ads (referred to APP ads).
Effectiveness
Users Measurement
Perception
•Advertisers not familiar with the effectiveness of mobile ads
•The role of mobile ads in the whole advertising system
•No appropriate measurement tools to test mobile ads effect in scientific way •No authorized research analyzes mobile ads effects
•Misunderstandings in advertisers’
perception to users’ attitude
•Negative effects from small screens
•Users’ opposition to mobile ads
Media Value of
Smartphone
Consumer
Behavior of APP
Advertising
Value of APP
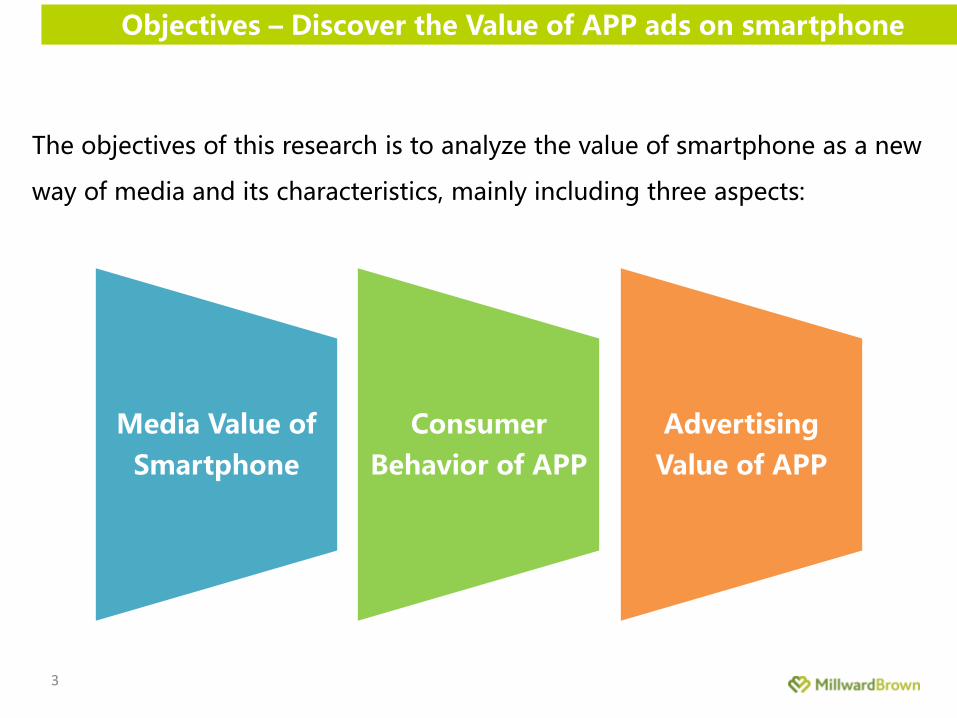
Objectives – Discover the Value of APP ads on smartphone
3
The objectives of this research is to analyze the value of smartphone as a new
way of media and its characteristics, mainly including three aspects:
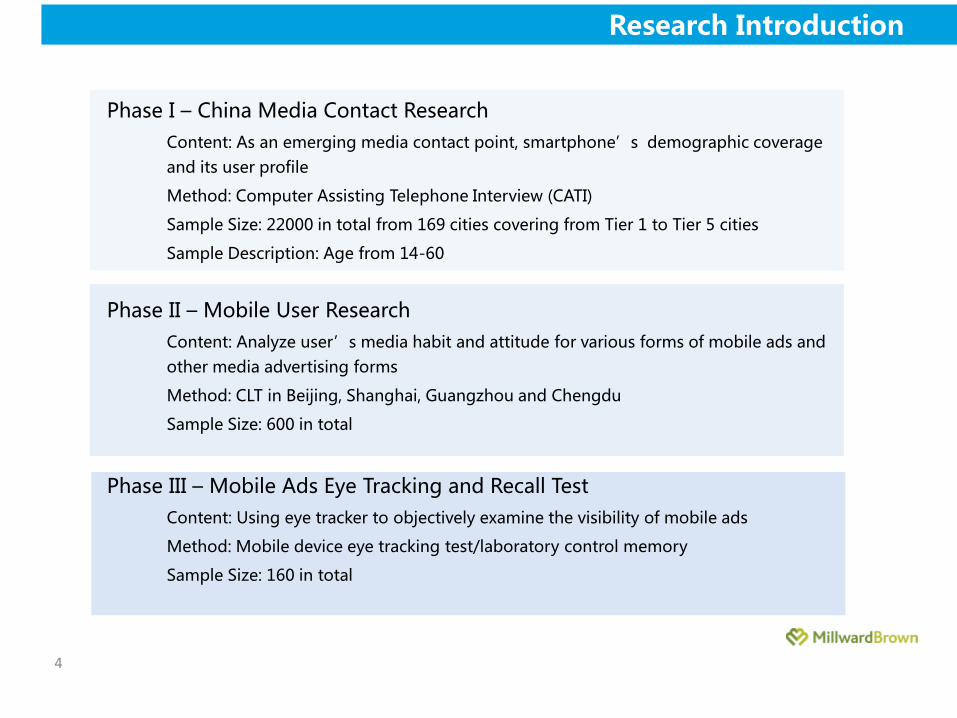
Phase I – China Media Contact Research
Content: As an emerging media contact point, smartphone’s demographic coverage
and its user profile
Method: Computer Assisting Telephone Interview (CATI)
Sample Size: 22000 in total from 169 cities covering from Tier 1 to Tier 5 cities
Sample Description: Age from 14-60
Phase II – Mobile User Research
Content: Analyze user’s media habit and attitude for various forms of mobile ads and
other media advertising forms
Method: CLT in Beijing, Shanghai, Guangzhou and Chengdu
Sample Size: 600 in total
Phase III – Mobile Ads Eye Tracking and Recall Test
Content: Using eye tracker to objectively examine the visibility of mobile ads
Method: Mobile device eye tracking test/laboratory control memory
Sample Size: 160 in total
Research Introduction
4
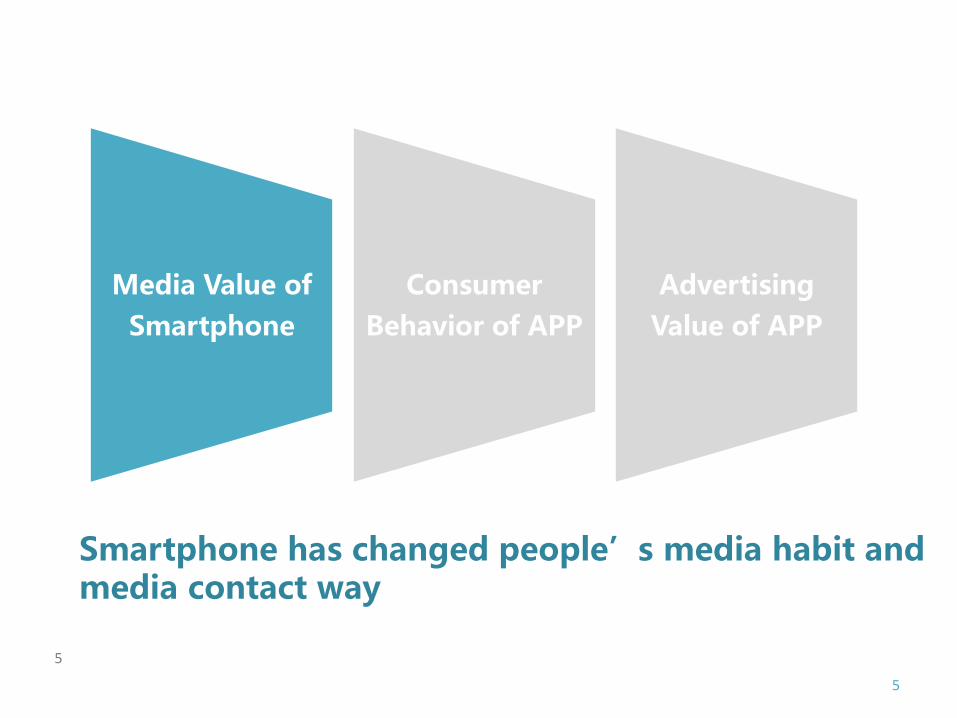
Smartphone has changed people’s media habit and media contact way
5
Media Value of
Smartphone
Consumer
Behavior of APP
Advertising
Value of APP
5

0%
5%
10%
15%
20%
25%
30%
35%
40%
45%
Print Radio TV Internet Mobile
6%
14%
42%
26%
12% 11%
5%
29%
33%
22%
% M
ed
ia t
ime s
pen
t sh
are
US China
Media time spent between US and Chinese consumers in 2012
Time spent on smartphone in China is higher than in the US
6
Users in China spend about 22% of media time spent on their smartphones,
10% higher than those in the US.

79%
88%
81%
69%
57%
45%
30%
13%
Age 14-19
Age 20-24
Age 25-29
Age 30-34
Age 35-39
Age 40-44
Age 45-49
Age 50-60
86%
79%
82%
86%
88%
88%
90%
93%
87%
91%
91%
87%
83%
75%
65%
47%
Source: National Pan-Media Survey / Sample size: 22000 Question: Which of the following media did you use in the past week?
Smartphone is a significant part contributing to multi-screen life
7
Mobile PC TV
The consumption rate of smartphones is higher than that of TV in the group of age 20 – 24.
Penetration rate of various screen in the past week

71% of users online using their smartphone more than 4 times a day, which is higher than the frequency of PC.
Source: Smartphone APP Advertising CLT Research / Sample size: 600 Question: How often did you use for online in the past week?
Average 4 times a day
Average 2.5 times
a day
71%
18%
11%
More than 4 times a day
2-3 times a day
Less than 1 times a day
The frequency of smartphone is higher than that of PC
8

0%
10%
20%
30%
40%
50%
60%
00:0
0-0
1:0
0
01:0
0-0
2:0
0
02:0
0-0
3:0
0
03:0
0-0
4:0
0
04:0
0-0
5:0
0
05:0
0-0
6:0
0
06:0
0-0
7:0
0
07:0
0-0
8:0
0
08:0
0-0
9:0
0
09:0
0-1
0:0
0
10:0
0-1
1:0
0
11:0
0-1
2:0
0
12:0
0-1
3:0
0
13:0
0-1
4:0
0
14:0
0-1
5:0
0
15:0
0-1
6:0
0
16:0
0-1
7:0
0
17:0
0-1
8:0
0
18:0
0-1
9:0
0
19:0
0-2
0:0
0
20:0
0-2
1:0
0
21:0
0-2
2:0
0
22:0
0-2
3:0
0
23:0
0-0
0:0
0
Comparison of different media contact time
Smartphone
Online
PC Online
TV
Usi
ng
pro
po
rtio
n
Time
Source: Smartphone APP Advertising CLT Research / Sample size: 600 Question: When did you surf the internet by using in a day in the past week?
Smartphone increases media contact time, revealing its time flexibility
9

66%
65%
57%
49%
37
24%
24%
20%
9%
5%
On the bus / subway
On the bed at home
In Office / at school
On the couch at home
By a desk at home
Café / Restaurant
Dining table at home
In bathroom
In a car
On the train / plane
Occasions of Smartphone's Access to The Internet
Source: Smartphone user survey / Sample size: 600 Question: Where do you use smartphone in the past month?
Smartphone highly rises media contact locations, indicating its mobility
10
People use smartphone more frequent on public transport, working/studying
places, living room and restaurants.
PC and TV are more used only at home.
PC TV
Mobile
Entertainment
Leisure
Social
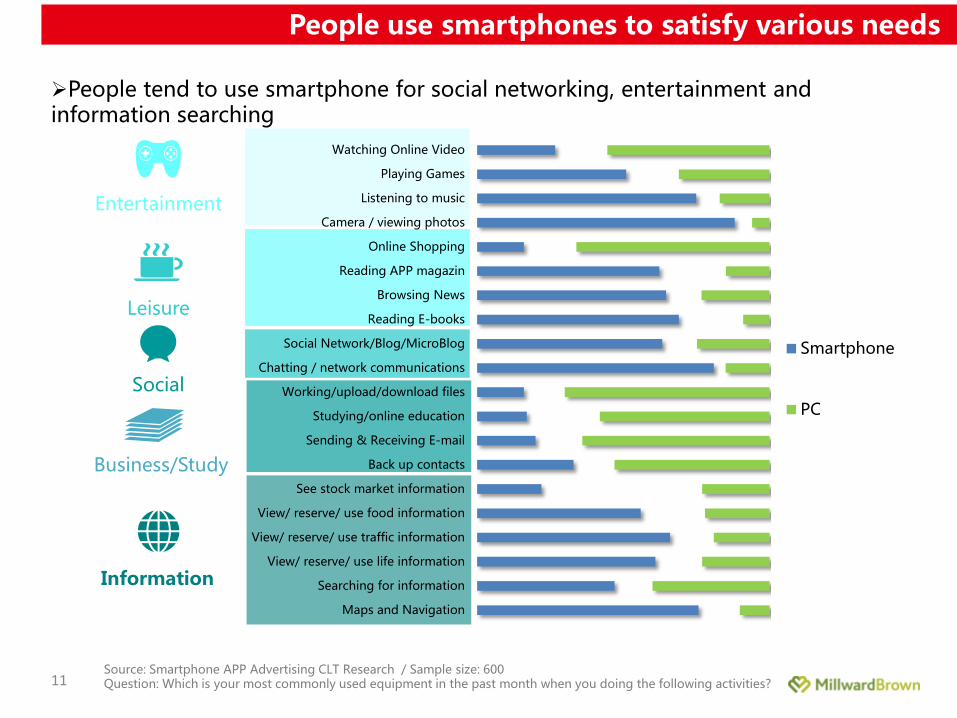
Information
Business/Study
Source: Smartphone APP Advertising CLT Research / Sample size: 600 Question: Which is your most commonly used equipment in the past month when you doing the following activities?
Watching Online Video
Playing Games
Listening to music
Camera / viewing photos
Online Shopping
Reading APP magazin
Browsing News
Reading E-books
Social Network/Blog/MicroBlog
Chatting / network communications
Working/upload/download files
Studying/online education
Sending & Receiving E-mail
Back up contacts
See stock market information
View/ reserve/ use food information
View/ reserve/ use traffic information
View/ reserve/ use life information
Searching for information
Maps and Navigation
Smartphone
PC
People use smartphones to satisfy various needs
11
People tend to use smartphone for social networking, entertainment and information searching
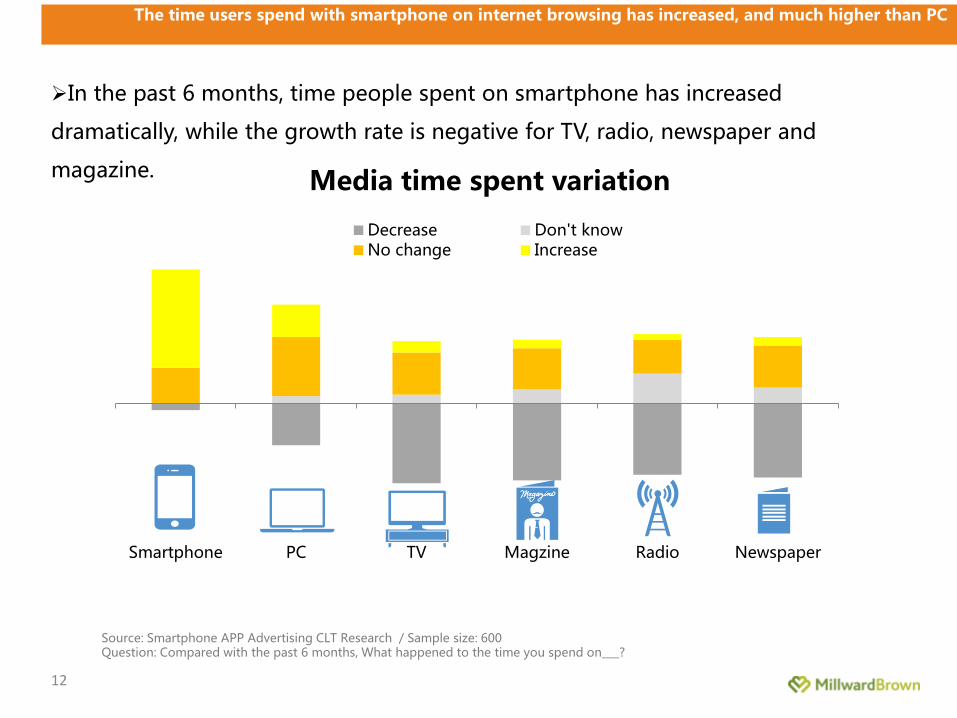
Smartphone PC TV Magzine Radio Newspaper
Media time spent variation
Decrease Don't knowNo change Increase
In the past 6 months, time people spent on smartphone has increased
dramatically, while the growth rate is negative for TV, radio, newspaper and
magazine.
Source: Smartphone APP Advertising CLT Research / Sample size: 600 Question: Compared with the past 6 months, What happened to the time you spend on ?
The time users spend with smartphone on internet browsing has increased, and much higher than PC
12

13
APP is an effective tool of marketing:
Strong Precision marketing and Interactive
Cooperation Marketing
Media Value of
Smartphone
Consumer
Behavior of APP
Advertising
Value of APP
13

Level of watching TV among users who access internet by using APP
Source: National telephone Survey / Sample size: 22000 Question: How long do you watch TV per week on the average? Which way do you access internet using smartphone?
Light TV viewers: Average watching TV less than 15 hours per week; Medium TV viewers: Average watching TV 16-30 hours per week; High TV viewers: Average watching TV more than 31 hours per week;
Light TV viewers 66%
Medium TV viewers 24%
High TV viewers 10%
APP can help reach light TV viewers
APP can cover 66% of light TV viewers and 24% medium TV viewers.
14
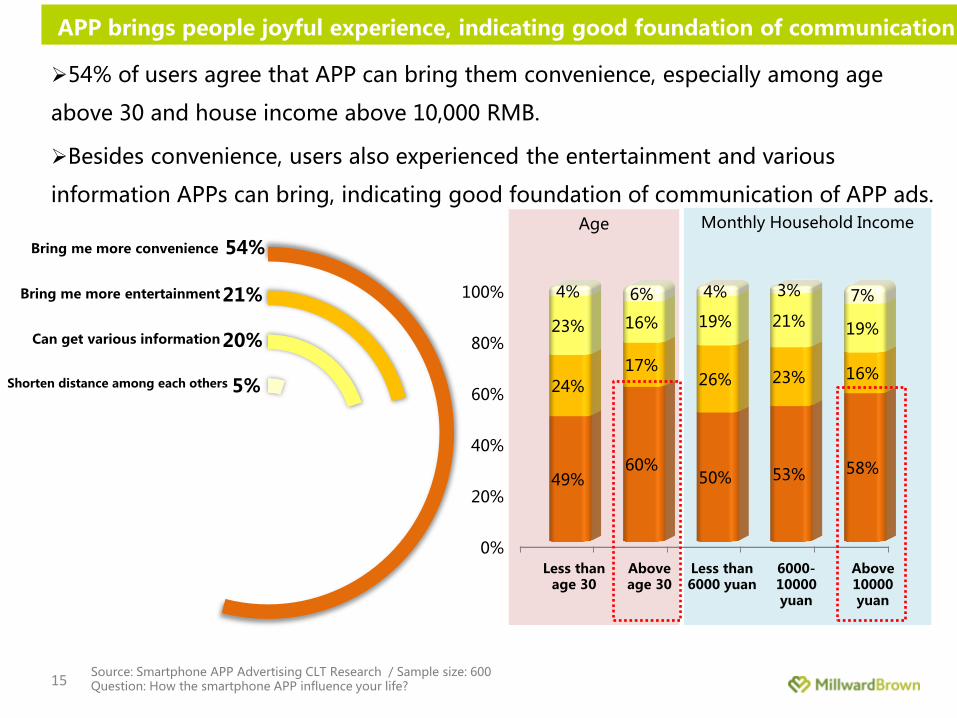
Monthly Household Income Age
54%
21%
20%
5%
Bring me more entertainment
Bring me more convenience
Can get various information
Shorten distance among each others
0%
20%
40%
60%
80%
100%
49% 60%
50% 53% 58%
24% 17%
26% 23% 16%
23% 16% 19% 21% 19%
4% 6% 4% 3% 7%
Less than age 30
Above age 30
Less than 6000 yuan
6000-10000 yuan
Above 10000 yuan
Source: Smartphone APP Advertising CLT Research / Sample size: 600 Question: How the smartphone APP influence your life?
APP brings people joyful experience, indicating good foundation of communication
15
54% of users agree that APP can bring them convenience, especially among age
above 30 and house income above 10,000 RMB.
Besides convenience, users also experienced the entertainment and various
information APPs can bring, indicating good foundation of communication of APP ads.

86%
69%
46%
58%
35%
23%
50%
36%
15%
46%
45%
41%
29%
29%
21%
19%
11%
Social/chat
Music
Video
Games
Photo/Videography
Entertainment
News
Books/Reading
Newspapers/magazines
Navigation
System tools
Life
Food
Shopping
Education
Travel
Sports
Entertainment
Leisure
Social
Information
Tool
Source: Smartphone APP Advertising CLT Research / Sample size: 600 Question: Which is your most frequently used APP in the past one week?
10%
10%
22%
28%
48%
82%
91%
Most frequently used APP type
Most frequently used APPs are social/instant message ones
16
Social/instant message, music, game, news and tool kind of APPs are more often
used.

Users use APP over twice on average, giving mobile ads the foundation of multi-time reaching their users
Source: Smartphone APP Advertising CLT Research / Sample size: 600 Question: How often did you use these APPs?
1.1
1.4 1.4 1.6 1.7
1.8 1.9 1.9 1.9 2.0 2.1 2.1 2.2 2.2 2.4 2.4 2.5 2.6 2.6 2.6
3.6
Tra
vel
Foo
d
Navig
atio
n
Sh
op
pin
g
Med
ical ca
re/H
ealth
Finan
ce
Bu
siness
Ed
uca
tion
Life
Sp
orts
Efficie
ncy
Vid
eo
Ph
oto
/Vid
eo
gra
ph
y
Syste
m to
ols
New
s
Mu
sic
New
spap
ers/m
ag
azin
es
Bo
oks/R
ead
ing
Gam
es
En
terta
inm
en
t
So
cial/ch
at
Frequency of using APP per day
17
Average 2 times
Users more often use social, entertainment, game and book kind of APPs.

The download of different APPs has interconnections, contributing to more opportunities for precision marketing
Source: Smartphone APP Advertising CLT Research / Sample size: 600 Question: How often did you use these APPs in the past one week? 18
APP Type Factor1 Factor2 Factor3 Factor4
Life Social Reading Tools Entertainment
Education 0.494
Travel 0.498
Efficiency 0.483
Medical care/Health 0.432
Entertainment 0.492
Food 0.429 0.401
Social/Chat 0.451
Photography/video-graphic 0.522
Books/Reading 0.464
System tools 0.425
Music 0.488
Video 0.614
Games 0.517
Shopping 0.423
Factor analysis categorized APPs with high usage relationship together according to hidden
interconnections between APPs. Advertisers can switch within different APPs under the same
category to reach similar users; for instance, advertisers hoping to reach shopping APP users
can accomplish by advertise on music and game APPs.
Note: A factor type is represented by each color field.

Users use multi-screens at the same time shows the value of cross screen marketing for smartphones
At the same time of using smartphone,
they also
Watching TV 44%
Talking with someone else
Doing nothing else
12%
Playing PC 34%
Reading /newspaper /magazine 24%
Playing Tablet 17%
0%
10%
20%
30%
40%
50%
60%
17:0
0-1
8:0
0
18:0
0-1
9:0
0
19:0
0-2
0:0
0
20:0
0-2
1:0
0
21:0
0-2
2:0
0
22:0
0-2
3:0
0
23:0
0-0
0:0
0
Access to internet by smartphoneAccess to internet by PCTV
Usi
ng
p
rop
ort
ion
Period of time
Source: Smartphone APP Advertising CLT Research / Sample size: 600 Question: Which of the following activities will you do while using smartphone APP? 19
While people are using APPs, they can also do things like communicating with others,
watching TV and playing computers. With only 12% of people doing nothing when using APPs,
it hints the value of cross screen marketing for smartphones, especially from 7PM – 9PM.
62%
21
Mobile Ads are more noticed than PC Banner Ads by users
Media Value of
Smartphone
Consumer
Behavior of APP
Advertising
Value of APP
21

Scientifically and systematically evaluate the value of mobile adds by eye tracker
受众沟通 价值
Visible – Ads go into the edge of consumer’s central vision area Scan – Ads go into consumer’s central vision area Notice – Ads go into consumer’s central vision and stay for processing
22
Eye Tracking Test
Visibility, scan、attention: eye tracking index Watching time: longer watching time may lead to more chance of processing and memorizing Eye tracking heat map: Clearly shows the contents users pay attention to.
The research includes 9 brands(Intel, Pizza Hut, Yili, Samsung, KFC, Ford, Ikea,
Peugeot and Este Launder), 3 styles(Full Screen Interstitial, Full Screen Started、
Banner) of mobile ads and compare the result to that of PC ads.
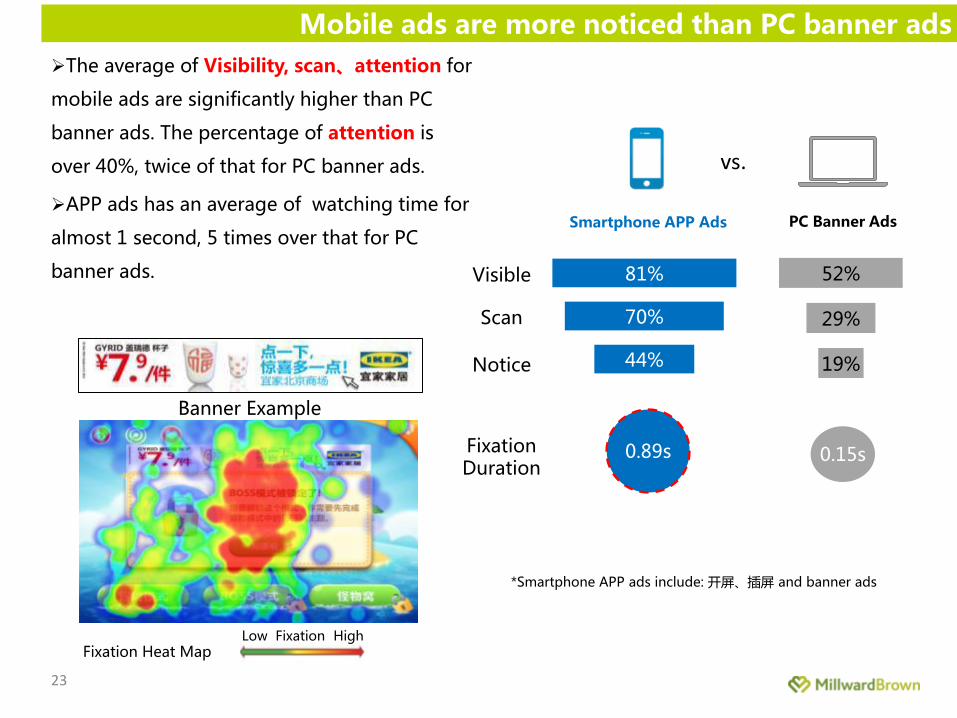
The average of Visibility, scan、attention for
mobile ads are significantly higher than PC
banner ads. The percentage of attention is
over 40%, twice of that for PC banner ads.
APP ads has an average of watching time for
almost 1 second, 5 times over that for PC
banner ads. Visible
Scan
Notice
Fixation Duration
0.15s
PC Banner Ads
52%
29%
19%
0.89s
Smartphone APP Ads
81%
70%
44%
vs.
Fixation Heat Map Low Fixation High
Banner Example
*Smartphone APP ads include: 开屏、插屏 and banner ads
Mobile ads are more noticed than PC banner ads
23

B
•Brand logo on left side A In mobile ads, brand logo should be put on left side so that users can remember the brand information even only glance once at the ads..
•Multiple frame creation with brand logo in every frame
MB discovers APP ads are more effective if their creation follow the rules below
25
√
√
About Brand Logo

D
•Using of bright colors C Using at least one bright color, but not over two of them Using bright colors to deliver core information can gain attention
26
√
About CreativeColor
•Clear and brief text content
About Text Content
Make your smile sparkle √
MB discovers APP ads are more effective if their creation follow the rules below

E
27
•About text content
Test content should not be over 50% of total ad space Don’t use white background with black text for content creation, since it may confuse people from page content
About Ad Information
Information is hard to be recognized under black background.
MB discovers APP ads are more effective if their creation follow the rules below

Source: Smartphone APP Advertising CLT Research / Sample size: 600 Question: Which aspects of smartphone APP ads is more acceptant compared with PC ads?
Age
Acceptant aspects of APP ads compared with PC ads
Age 25-34
Better quality
clear More interactive
Age 35-44 Less than age 24
Color is full
Overall number is not large Content is closely related to me
Overall page is clean
High input lefel
Creative
1.0
0.0
0.5
-0.5
-1.0
1.0 0.0 0.5 -0.5
People think APP ads are clean and engaging. In comparison, people under 35-44 think mobile
ads are more interactive and have better quality than PC; people under 24 believe APP ads are
creative and clear.
28
People under different ages like different aspects of APP ads, brands can focus on relevant mobile ads creation

Conclusion I: Smartphone has changed people’s media habit and media contact way
4.7 HOURS
Daily time using smartphone to browse internet is 4.7 hours (while using PC is 4.8 hours), but the frequency is higher and occasion is wider than other media
• Time spent on smartphone in China is higher than in the
US, and smartphone is a significant part contributing to
multi-screen life
• Smartphone is fully time and space coverage close media,
allowing multiple reaching to users; smartphone is used
more under different time and locations to browse internet.
• Time of internet browsing with smartphone is significantly
fragmented: time using smartphone to browse internet is 4.7
hours (while using PC is 4.8 hours), but the frequency is higher
and occasion is wider than other media
• People rely more on smartphones than PCs: People tend to
use smartphone for social, entertainment and information
searching.
• Time spent on smartphone has increased, 70% of users say
they have used smartphone more than in the past 6 months;
while traditional media are used less (57% users think they
watch less TV; 55% users believe they read less magazines)
29
54%
21%
20%
5%
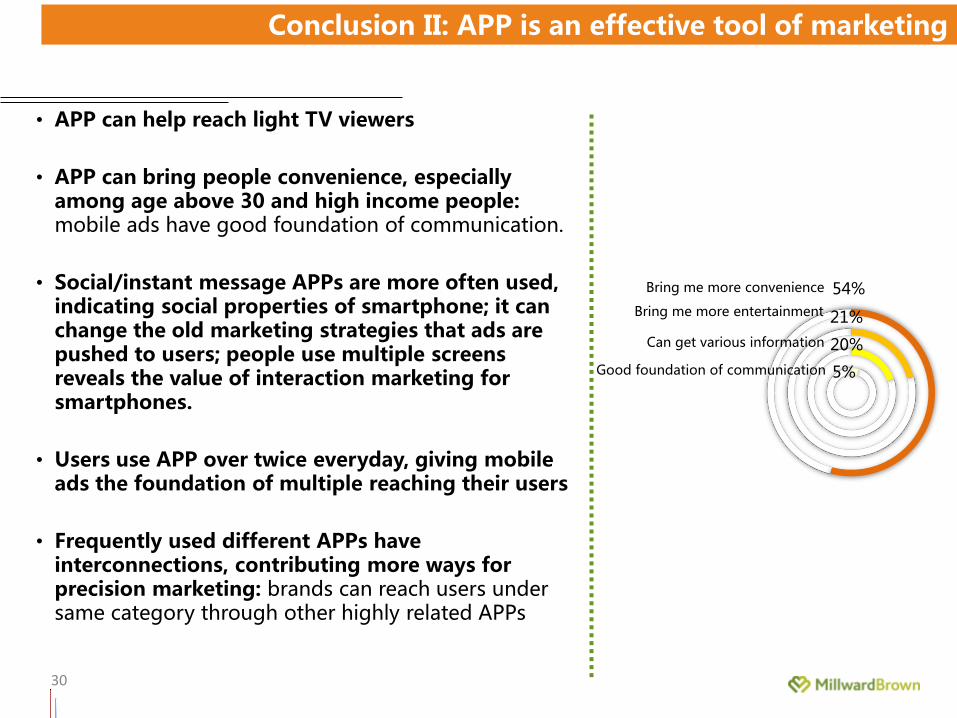
• APP can help reach light TV viewers
• APP can bring people convenience, especially among age above 30 and high income people: mobile ads have good foundation of communication.
• Social/instant message APPs are more often used, indicating social properties of smartphone; it can change the old marketing strategies that ads are pushed to users; people use multiple screens reveals the value of interaction marketing for smartphones.
• Users use APP over twice everyday, giving mobile ads the foundation of multiple reaching their users
• Frequently used different APPs have interconnections, contributing more ways for precision marketing: brands can reach users under same category through other highly related APPs
Bring me more entertainment
Bring me more convenience
Can get various information
Good foundation of communication
Conclusion II: APP is an effective tool of marketing
30

Visible
Scan
Notice
Fixation Duration
0.89s
Smartphone APP Advertising
81%
70%
44%
Conclusion III: APP Ads are more noticed than PC Banner Ads by users
31
• APP ads have higher displaying value, and attract more attention than PC banner ads
• People under different ages like different aspects of APP ads, brands can focus on relevant APP ads creation: In comparison, people between 35-44 think APP ads are more interactive and have better quality than PC; people between 25-34 think they are clean and engaging; people under 24 believe APP ads are creative and clear.
• MB discovers APP ads are more effective if their creation follow the rules below
– Brand logo on left side; Multiple frame creation with brand logo in every frame; thus users can remember the brand information more easily
– For creative color, using at least one bright color, but not over two of them; using bright colors to deliver core information can get attention; don’t use white background with black text for content creation, since it may confuse people from page content
– Text content should not be over 50% of total ad space
