smartmoves - mid-america regional council
TRANSCRIPT

smartmoves 3.0
TRANSIT AND MOBILITY PLAN FOR THE KANSAS CITY REGION
A PROJECT OF THE MID-AMERICA REGIONAL COUNCIL AND ITS PARTNERS
W
EXECUTIVE SUMMARYIINTRODUCTIONII
STRATEGIES & RECOMMENDATIONSVIIIMPLEMENTATIONVIII
APPENDICIESIX
TABLE OF CONTENTS
A — Projects by PhaseB — Cost EstimatesC — Assumptions and MethodologyD — Public and Stakeholder
Engagement SummaryE — Near-term Investment Strategies
F — Demographic Data, Transit Propensity and Other Analyses
G — Pilot Area AnalysisH — Transit-Supportive DevelopmentI — Mobility Toolkit
TRANSIT & MOBILITY SERVICES: EXISTING CONDITIONSIIIFigure 1: IndeBus Fixed-Route Service Characteristics 4Figure 2: Unified Government Fixed-Route Service Characteristics 4Figure 3: KCATA Annual Regional Ridership 5Figure 4: The JO, UGT, IndeBus And Streetcar Annual Regional Ridership 5Figure 5: Travel Times for Sample Commutes 6Figure 6: Current Sources of Funding for Public Transportation 7Figure 7: Transit Operating Expenses Per Capita 8Figure 8: RideKC Freedom Services 9Figure 9: RideKC Freedom On-Demand versus Traditional Paratransit 12Figure 10: Transit Apps 17
TRANSIT & MOBILITY SERVICES — CHALLENGES AND GAPSIVFigure 11: KCATA Funding Sources 3
JOBS ACCESSIBILITY VIA TRANSITVFigure 12: Jobs Accessibility via Transit 3Figure 13: Jobs Accessibility after Smart Moves Implementation 4Figure 14: Geographic Proximity of Jobs to Transit System 7
DEFINING THE SMART MOVES SYSTEMVIFigure 15: Conceptual Locations of Mobility Hubs 3Figure 16: Fast and Frequent and 30-Minute Service Map 5Figure 17: Fast and Frequent Network Characteristics 6Figure 18: 30-Minute Network Map 7Figure 19: Express Network Map 8Figure 20: Express Network Characteristics 9
Figure 21: Cost Summary 3Figure 22: Phase 1 Operating 3Figure 23: Phase 2 Operating Cost 4Figure 24: Phase 3 Operating Cost 4Figure 25: Rolling Stock Cost Summary 5Figure 26: Mobility Hub Cost Summary 5Figure 27: Funding Mechanisms 6Figure 28: Service Type 11

1 | Smart Moves 3.0 — Introduction
II. Introduction Smart Moves is metropolitan Kansas City’s vision and implementation plan to enhance and expand regional transit and mobility services in the years and decades ahead. This plan serves as a guide for transit providers and local governments to implement transit and mobility services in a way that addresses some of our region’s greatest challenges and takes advantage of new opportunities. The plan’s concepts and recommendations lead to a bolder approach that is adaptive to the many distinct and diverse parts of the region, that inspires innovative solutions, and that leverages partnerships across sectors and disciplines. Smart Moves, an initiative that began nearly 15 years ago, builds on prior planning efforts and integrates common goals to ensure a high-functioning, seamless experience for the region’s residents and visitors, a healthy environment, a thriving economy, and a better quality of life for everyone.
The Smart Moves Initiative: A Brief History The Smart Moves initiative began in 2002 with a 20-year service plan designed to increase transit service in the region to a level comparable with peer metropolitan areas. With local support and working in partnership with the Kansas City Area Transportation Authority, Unified Government Transit and Johnson County, MARC led the development of a new policy direction for transit and paratransit services. Largely a bus-based plan, the first Smart Moves proposed a system of “Rapid Riders,” “Freeway Flyers,” “Local Links” and “Special Services.” In order to implement the plan (projected cost of $155 million in 2003), a regional investment fund concept was developed to replace local sales tax and general funds that still support transit today. The fund would be generated through a regional investment district enabled by Kansas and Missouri legislation allowing local communities to jointly raise funds for a regional transit system. The legislation would have allowed area counties to levy up to ½-cent sales tax.
The first Smart Moves plan was adopted in 2005. Since then, local progress and momentum have grown steadily as transportation costs have continued to rise. This momentum was illustrated by the completion of the MAX bus rapid transit service on Main Street along with many other local and regional milestones. The regional investment fund concept was put on hold after the enabling legislation was passed in Missouri but not in Kansas.
How This Plan is Organized
The Smart Moves plan is organized to serve as a guide for implementation. Each subsequent section of the plan is designed to be a shareable, stand-alone document. Together, the sections tell a story about transit and mobility as it exists today and how these types of services will evolve in the future.
Plan Sections:
• Introduction Provides context and vision for the plan
• Existing Conditions Explains transit and mobility services today
• Gap Analysis Explains major service gaps addressed by this plan
• Defining the Smart Moves System Provides a detailed description of Smart Moves 3.0 system
• Recommendations and Performance Monitoring Provides specific recommendations for transit and mobility services and development
• Implementation Provides implementation strategies to achieve recommendations
• Appendices Provides more detailed background and analysis information and mobility hub toolkit.

2 | Smart Moves 3.0 — Introduction
By this time, several corridor studies were underway and more local communities had begun to incorporate transit into their local plans and community visions. In response to this increasing interest in regional transit services, the Smart Moves planning team initiated an update to the original Smart Moves plan.
Framed as a vision, the Smart Moves update sought to develop a service framework to help coordinate local and regional transit planning efforts already underway; provide a way to reflect and build on newly developed local plans, strategies, and studies; and evaluate the possibilities of light rail and other transit technologies. In 2008, after an extensive public engagement and a vision vetting process with local governments, the Smart Moves Update was adopted. Further planning led to the development of specific implementation plans to supplement the Smart Moves Regional Transit Vision.
To learn more about past Smart Moves plans and other transit efforts, visit the online plan archive at kcsmartmoves.org.
Developing Smart Moves 3.0: Regional Transit and Mobility Plan In 2014, MARC, KCATA and Johnson County were awarded a USDOT TIGER grant to develop a strategic implementation plan that would double the number of jobs accessible by transit in the region over the next 10 years. While jobs access had always been a large driver in the Smart Moves initiative, a Brookings Institute report entitled Missed Opportunity: Transit and Jobs in Metropolitan America (2011) shed new light on how significant the region’s jobs access problem really was. This report ranked the Kansas City region 90th among the 100 largest metropolitan areas in the country, concluding that only 18.3 percent of jobs in the region are accessible by transit within 90 minutes. While the analysis included jobs in all 14 counties in the Kansas City metropolitan statistical area, the percentage was still eye-opening for MARC, regional transit providers and elected leaders alike.
PLANNING SUCCESSES
2002 Smart Moves initiative begins
2005 Smart Moves Transit Plan Adopted
2005 Main Street MAX Bus Rapid Transit route begins
2008 Smart Moves Regional Transit Vision adopted
2010 Smart Moves Implementation Plan developed
2010 TIGER grant provides funds to build three new transit centers and transit infrastructure
2011 Troost Avenue MAX BRT opens
2015 RideKC regional brand adopted, with a new regional fare pass and a common eligibility process for ADA paratransit riders
2016 Main Street Streetcar service begins
2017 Smart Moves Regional Transit and Mobility Plan (Smart Moves 3.0) adopted
2019 Anticipated launch date for Prospect MAX BRT
3 | Smart Moves 3.0 — Introduction
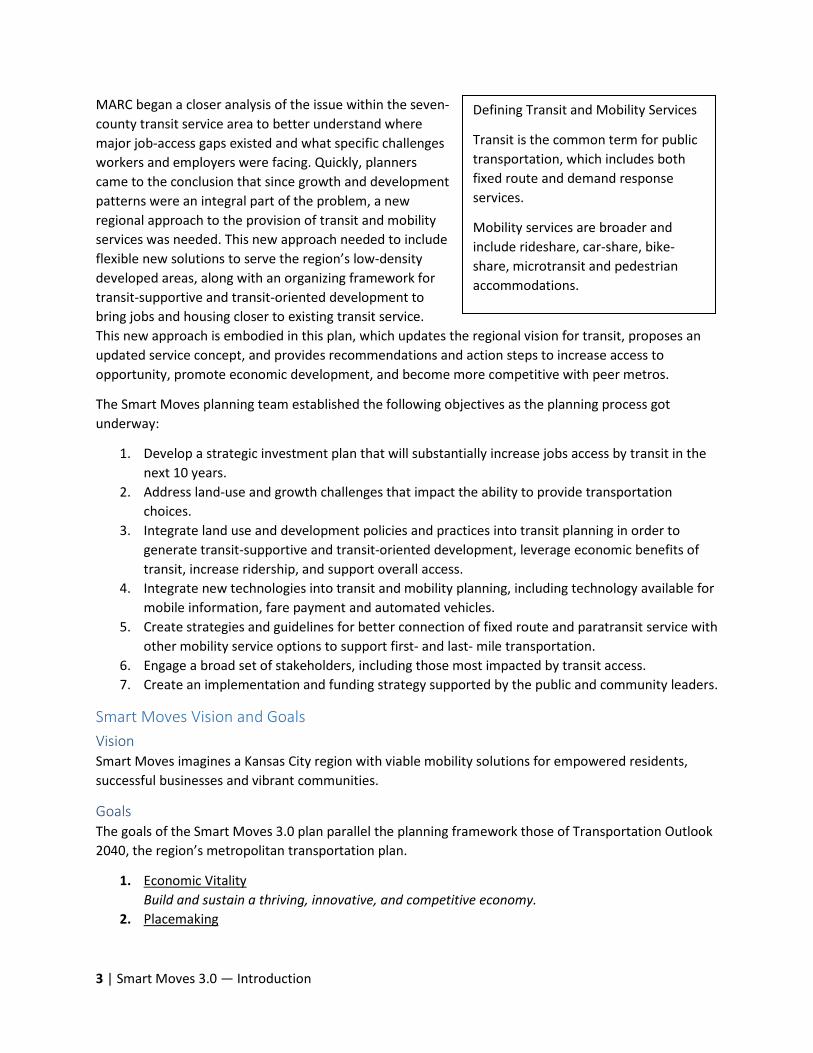
MARC began a closer analysis of the issue within the seven-county transit service area to better understand where major job-access gaps existed and what specific challenges workers and employers were facing. Quickly, planners came to the conclusion that since growth and development patterns were an integral part of the problem, a new regional approach to the provision of transit and mobility services was needed. This new approach needed to include flexible new solutions to serve the region’s low-density developed areas, along with an organizing framework for transit-supportive and transit-oriented development to bring jobs and housing closer to existing transit service. This new approach is embodied in this plan, which updates the regional vision for transit, proposes an updated service concept, and provides recommendations and action steps to increase access to opportunity, promote economic development, and become more competitive with peer metros.
The Smart Moves planning team established the following objectives as the planning process got underway:
1. Develop a strategic investment plan that will substantially increase jobs access by transit in the next 10 years.
2. Address land-use and growth challenges that impact the ability to provide transportation choices.
3. Integrate land use and development policies and practices into transit planning in order to generate transit-supportive and transit-oriented development, leverage economic benefits of transit, increase ridership, and support overall access.
4. Integrate new technologies into transit and mobility planning, including technology available for mobile information, fare payment and automated vehicles.
5. Create strategies and guidelines for better connection of fixed route and paratransit service with other mobility service options to support first- and last- mile transportation.
6. Engage a broad set of stakeholders, including those most impacted by transit access. 7. Create an implementation and funding strategy supported by the public and community leaders.
Smart Moves Vision and Goals Vision Smart Moves imagines a Kansas City region with viable mobility solutions for empowered residents, successful businesses and vibrant communities.
Goals The goals of the Smart Moves 3.0 plan parallel the planning framework those of Transportation Outlook 2040, the region’s metropolitan transportation plan.
1. Economic Vitality Build and sustain a thriving, innovative, and competitive economy.
2. Placemaking
Defining Transit and Mobility Services
Transit is the common term for public transportation, which includes both fixed route and demand response services.
Mobility services are broader and include rideshare, car-share, bike-share, microtransit and pedestrian accommodations.

4 | Smart Moves 3.0 — Introduction
Coordinate investment in transit, mobility services and land use along transit corridors and mobility hubs.
3. Equity Ensure all people have the opportunity to thrive by providing equal access to jobs, goods, and services.
4. Transportation Choices Expand mobility options to better connect residents and visitors to jobs and services.
5. Safety and Security Ensure safe, comfortable, and convenient access to services.
6. System Condition Ensure transit and mobility systems are maintained in good condition.
7. System Performance Manage the existing systems to achieve reliable and efficient performance and maximize the value of existing investments.
8. Public Health Facilitate healthy, active living.
9. Environment Improve air quality and conserve natural resources through increased use of transit and mobility services as well as through transit oriented development.
10. Climate Change and Energy Use Decrease fossil fuel use and greenhouse gas emissions through energy efficiency, alternative and renewable fuels and VMT reduction.

1 | Smart Moves 3.0 — Transit & Mobility Services: Existing Conditions
III. Transit & Mobility Services: Existing Conditions Section III describes the Kansas City region’s current transit and mobility systems. This information provides context for challenges and gaps outlined later in the plan and the strategies the plan recommends to address them. For documentation on existing demographics and commute behaviors, please see Appendix F.
RideKC Coordination and Branding The five transit agencies in the Kansas City region — KCATA, Johnson County Transit, Unified Government Transit, IndeBus and the KC Streetcar — are working together to coordinate services, creating a seamless system from the rider’s perspective. In October 2015, the agencies adopted the RideKC brand and create a single transit website for the entire region: RideKC.org. Since then, the agencies have coordinated in other ways as well:
• Created one regional fare ($1.50)1and standard monthly fare pass. • Made the system free to ride for all qualified paratransit users.2 • Expanded the U-Pass program from serving only University of Missouri–Kansas City students to
include Metropolitan Community College and Kansas City Art Institute students.3 • Made the RideKC system free for veterans. • Began branding buses and bus stops with the RideKC colors and logo. • Created a new RideKC system map. • Initiated a route renumbering plan to make route numbers correspond geographically.
Traditional Fixed-Route Transit Fixed-route transit is made up of buses, streetcars and other vehicles that follow prescribed routes and stop at regular, scheduled intervals. There are currently 87 bus routes and one streetcar route in the RideKC system. Each fixed-route bus belongs to one of four network categories: Fast and Frequent, 30-Minute, Express, or Other Local.
Fast and Frequent Service Currently, there are six existing bus routes and a streetcar line that can be considered Fast and Frequent service. These are the two bus rapid transit (BRT) routes, Main and Troost MAX, the KC Streetcar and the following bus routes:
• 71 (which runs on Prospect and will be partially replaced by the Prospect MAX BRT route that will start operating in 2019)
• 39 (which runs on 39th Street) • 31 (which runs on 31st Street) • 24 (which runs on Independence Avenue)
1 Effective January 4, 2016. 2 Pilot program started on August 1, 2016. 3 August 2016.

2 | Smart Moves 3.0 — Transit & Mobility Services: Existing Conditions
30-Minute Service There are 15 existing bus routes that can be considered 30-minute (or supporting) service. All routes run on 30-minute headways except #39, which runs every 20 minutes.
• 9, 9th Street • 11, Northeast-Westside • 12, 12th Street • 15, Truman Road • 25, Troost • 35, 35th Street • 57, Wornall • 63, 63rd Street • 75, 75th Street • 85, Paseo • 101, State Avenue • 108, Indiana (soon to be changed to 18)
Express Network Express bus service runs in the morning and evening peak commute hours, typically bringing people into downtown Kansas City, Missouri in the morning, and back out to suburban locations in the evening.
There are nine existing express routes:
• 535, Shoal Creek-Liberty (2 morning + 2 evening w/limited reverse commute) • 550, Lee’s Summit (5 morning + 5 evening w/limited reverse commute) • 570, Blue Springs (4 morning + 4 evening) • 571, 71 Hwy (7 morning + 7 evening w/limited reverse commute) • 519, Olathe (7 morning + 9 evening w/limited reverse commute) • 563, Shawnee (2 morning + 2 evening) • 569, South Overland Park (4 morning + 5 evening) • 595, Gardner-Overland Park (5 morning + 5 evening w/limited reverse commute)
RideKC Streetcar The RideKC Streetcar, which began operations in May 2016, is 2.1 miles long and runs from the River Market to Union Station. It runs every 10 minutes, qualifying it as an integral piece of the Fast and Frequent network. The streetcar is administered by the Kansas City Streetcar Authority, which operates four streetcars in the Main Street cooridor within a Transportation Development District (TDD). The streetcar, which has been fare-free since its inception, is funded with a 1 percent sales tax and special assessment on real estate and surface pay parking lots in the TDD. Streetcar extensions to the north along the riverfront and south to UMKC are proposed and currently under study.

3 | Smart Moves 3.0 — Transit & Mobility Services: Existing Conditions
The 510 (K-10 Connector) is also classified as an express route because it covers a long distance, but it operates on frequent headways (every 30 minutes) bi-directionally between Johnson County and Lawrence.
Other Local Service While the focus of Smart Moves 3.0 is interjurisdictional transit, community-based transit plays an important role in connecting riders to the regional network, as well as transporting them to local goods and services. The local network within the Kansas City metropolitan area provides an array of service types, including fixed-route transit.
For the purpose of this plan, Other Local Service is defined as routes operated by Unified Government Transit (UGT) or IndeBus, which provide transit service in Wyandotte County, Kansas, and the city of Independence, Missouri, respectively. Both systems are managed by the KCATA.
These local systems, including the names and headways of their routes, are as follows:
There are nine UGT routes:
• 101, State Avenue (30 min.) • 102, Central Avenue (60 min.) • 103, 3rd Street/Fairfax (60 min.) • 104, Argentine (30 min. peak/60 min. midday) • 106, Quindaro (30 min.) • 107, 7th Street-Parallel (30 min. peak/60 min. midday) • 113, Leavenworth Road (90 min.) • 115, Kansas Avenue (60 min.) • 116, West Parallel (90 min.)
There are six IndeBus routes:
• 301, Green Route (60 min.) • 302, Blue Route (60 min.) • 303, Purple Route (60 min.) • 304, Yellow Route (120 min.) • 305, Orange Route (120 min.) • 306, Red Route (60 min.) • The two independently operating transit services in the Kansas City region are IndeBus and
Unified Government.

4 | Smart Moves 3.0 — Transit & Mobility Services: Existing Conditions
Figure 1: IndeBus Fixed-Route Service Characteristics •
Service Frequency Routes operate on one-hour headways all day
Service Hours Service hours vary, with one starting as early as 5:30 a.m. and ending as late as 8:30 p.m.
Operating Characteristics
Lines operate in mixed traffic with high-capacity transit vehicles.
Capital Amenities Independence Transit Center is the only transit center. Otherwise, most transit stops have basic signage, along with some seating and shelter amenities.
Figure 2: Unified Government Fixed-Route Service Characteristics •
Service Frequency Each route operates with a different headway, varying from 1 to 1.5 hours.
Service Hours Routes operate from 6 a.m. to 6 p.m. Monday through Friday, and 9 a.m. to 6 p.m. on Saturday.
Operating Characteristics
Lines operate in mixed traffic with high-capacity transit vehicles.
Capital Amenities There are two transit centers, the 7th and Minnesota Transit Center and the 47th and State Avenue Transit Center. Otherwise, most transit stops have basic signage, along with some seating and shelter amenities.
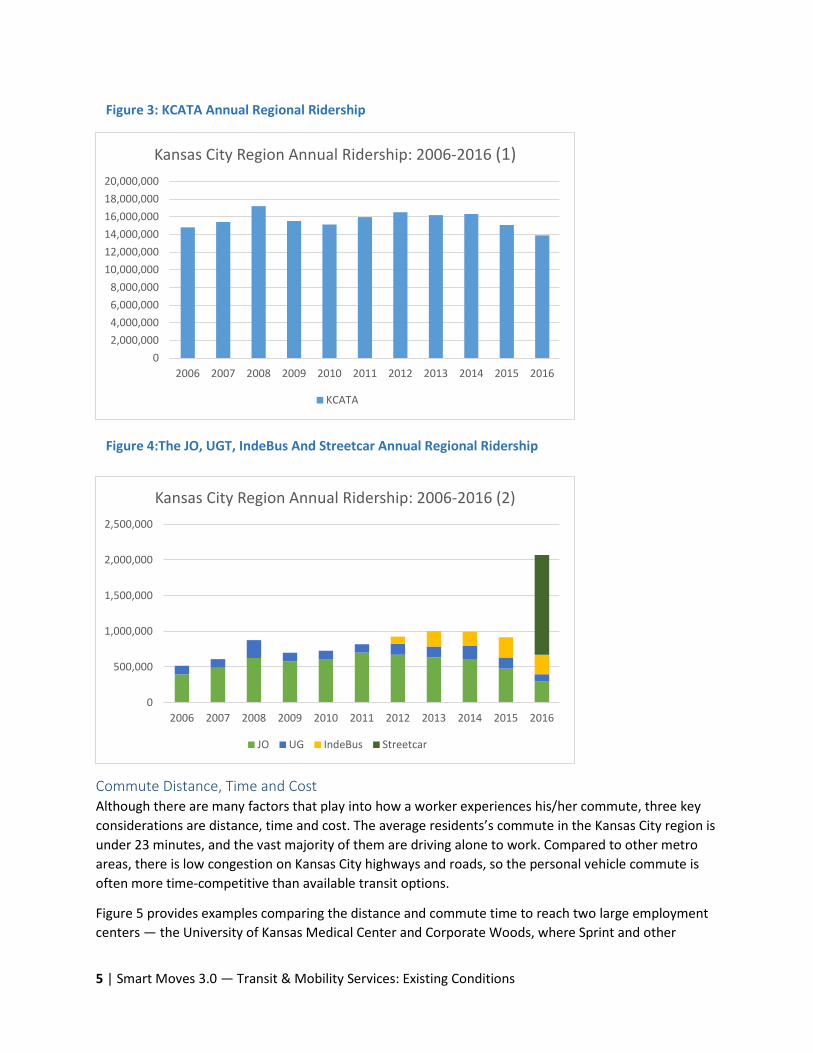
Trends in Transit and Travel Ridership In 2016, annual ridership across all systems (including RideKC Streetcar, which launched on May 5, 2016) was 15.9 million rides. Since 2006, despite year-to-year changes that are influenced by gas prices and other economic factors, ridership has increased 2.61 percent in the Kansas City region, which is similar to national trends in transit usage.
5 | Smart Moves 3.0 — Transit & Mobility Services: Existing Conditions
Commute Distance, Time and Cost Although there are many factors that play into how a worker experiences his/her commute, three key considerations are distance, time and cost. The average residents’s commute in the Kansas City region is under 23 minutes, and the vast majority of them are driving alone to work. Compared to other metro areas, there is low congestion on Kansas City highways and roads, so the personal vehicle commute is often more time-competitive than available transit options.
Figure 5 provides examples comparing the distance and commute time to reach two large employment centers — the University of Kansas Medical Center and Corporate Woods, where Sprint and other
02,000,0004,000,0006,000,0008,000,000
10,000,00012,000,00014,000,00016,000,00018,000,00020,000,000
2006 2007 2008 2009 2010 2011 2012 2013 2014 2015 2016
Kansas City Region Annual Ridership: 2006-2016 (1)
KCATA
0
500,000
1,000,000
1,500,000
2,000,000
2,500,000
2006 2007 2008 2009 2010 2011 2012 2013 2014 2015 2016
Kansas City Region Annual Ridership: 2006-2016 (2)
JO UG IndeBus Streetcar
Figure 3: KCATA Annual Regional Ridership
Figure 4:The JO, UGT, IndeBus And Streetcar Annual Regional Ridership

6 | Smart Moves 3.0 — Transit & Mobility Services: Existing Conditions
companies are located — from four residential locations popular with workers at these employment sites.
Travel Times for Sample Commutes in the Metro Area, Auto v. Transit
Employment Center
Residential Location
Zone Centroid Distance (miles)
Auto Travel Time (minutes)
Transit Travel Time (minutes)
KU Med Downtown KC
Approx. 10th and Main 5.4 9 59
Country Club Plaza
Approx. 47th and Pennsylvania 2.4 7 52
Prairie Village
Approx. 71st and Roe 5.2 13 93
Lenexa
Approx. 87th and Lackman 14.5 23 118
Corporate Woods
Downtown KC
Approx. 10th and Main 17.4 22 102
Country Club Plaza
Approx. 47th and Pennsylvania 13.8 23 123
Prairie Village
Approx. 71st and Roe 9.1 16 135
Lenexa
Approx. 87th and Lackman 10.0 17 105
MARC Travel Demand Model, 2010
Though the commutes range in distance from 2.4 to 17.4 miles, the auto travel times only vary between seven and 23 minutes, while the transit travel times for the same commutes vary between 52 and 135 minutes. In fact, only two of the commutes — Downtown Kansas City and Country Club Plaza to University of Kansas Medical Center — are under an hour by transit.
In terms of monetary costs, a 31-day RideKC bus pass costs $50. The cost of a one-way personal vehicle commute is calculated by dividing the trip distance by the average vehicle fuel economy (miles per gallon) and then multiplying the number of gallons needed by the average price of fuel. Using this methodology, the cost of the driving commutes in Figure 5 range from $11 to $79 per month, assuming two one-way trips per day and 23 working days per month. This cost, of course, does not factor in parking, insurance or maintenance, which are likely to cost car owners at least an additional $50 dollars per month, making the real cost of owning a car and using it for work-based trips a minimum of $61-$129 monthly, and likely considerably more.
Figure 5: Travel Times For Sample Commutes

7 | Smart Moves 3.0 — Transit & Mobility Services: Existing Conditions
Funding Funding for transit service in the Kansas City region comes from federal, state, and local sources, as well as fare revenues and other sources, such as advertising. Over half of funding for transit comes from local sources (dedicated sales tax and general funds) in the region.
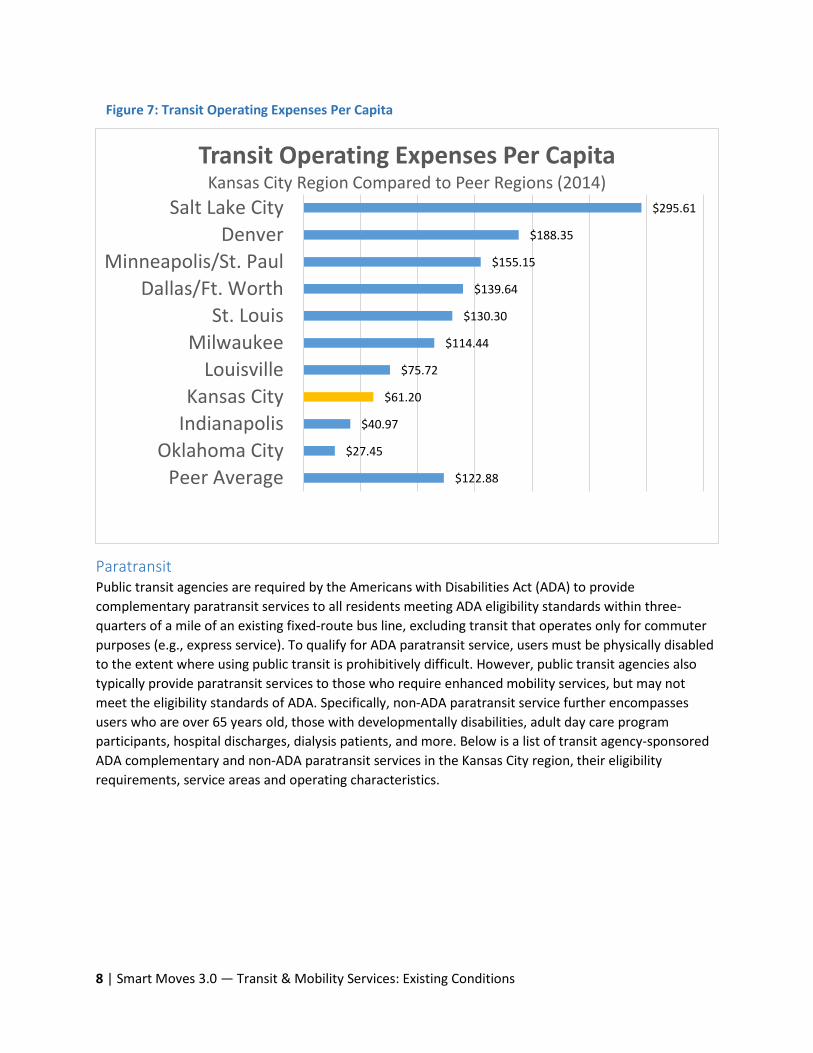
Transit spending per capita is a useful measure when comparing the Kansas City region to peer regions from around the country. The figure below shows transit operating expenses per capita, using each region’s transit service area population. In 2014, the region spent $61.20 in operating funds per person on transit, 50 percent of the peer region per capita average. Most of the peer regions with higher per capita spending on transit, have significantly more local funds dedicated specifically for transit service. Currently in the Kansas City region, a region with 119 municipalities, only Kansas City, Missouri, contributes dedicated funding (sales tax) for transit. Other local funding comes from city and county general funds and is subject to year-to-year budget negotiations.
31%
1%
54%
12%2%
Sources of Funding for Public TransportationKansas City Region
Federal State Local Farebox Other
Figure 6: Current Sources of Funding For Public Transportation
8 | Smart Moves 3.0 — Transit & Mobility Services: Existing Conditions
Paratransit Public transit agencies are required by the Americans with Disabilities Act (ADA) to provide complementary paratransit services to all residents meeting ADA eligibility standards within three-quarters of a mile of an existing fixed-route bus line, excluding transit that operates only for commuter purposes (e.g., express service). To qualify for ADA paratransit service, users must be physically disabled to the extent where using public transit is prohibitively difficult. However, public transit agencies also typically provide paratransit services to those who require enhanced mobility services, but may not meet the eligibility standards of ADA. Specifically, non-ADA paratransit service further encompasses users who are over 65 years old, those with developmentally disabilities, adult day care program participants, hospital discharges, dialysis patients, and more. Below is a list of transit agency-sponsored ADA complementary and non-ADA paratransit services in the Kansas City region, their eligibility requirements, service areas and operating characteristics.
$295.61
$188.35
$155.15
$139.64
$130.30
$114.44
$75.72
$61.20
$40.97
$27.45
$122.88
Salt Lake CityDenver
Minneapolis/St. PaulDallas/Ft. Worth
St. LouisMilwaukee
LouisvilleKansas City
IndianapolisOklahoma City
Peer Average
Transit Operating Expenses Per CapitaKansas City Region Compared to Peer Regions (2014)
Figure 7: Transit Operating Expenses Per Capita

9 | Smart Moves 3.0 — Transit & Mobility Services: Existing Conditions
Figure 8: RideKC Freedom Services
SERVICE
NAME
ELIGIBLE
USERS
SERVICE
AREA
OPERATING
CHARACTERISTICS
RideKC Freedom (Formerly Share-a-Fare)
Must be approved through eligibility process. Criteria is specific to the Americans with Disabilities Act (ADA).
ADA Paratransit – Operated within ¾ miles of local bus routes.
Operating hours are the same as the hours of operation of fixed route adjacent to the trip.
Must meet one of the following criteria: 1. Age 16-65, with a
disability. 2. Age 65 or older with
an annual income of no more than 150% of the U.S. poverty level.
Non-ADA Paratransit – Service is provided anywhere within Kansas City, Missouri, city limits.
Operating hours are 6 a.m.-midnight, seven days a week.
Unified Government Transit Dial-A-Ride
Must be approved through eligibility process. Criteria is specific to ADA.
ADA Paratransit – Operated within ¾ miles of local bus routes.
Operating hours are the same as the hours of operation of fixed route adjacent to the trip.
Unified Government Transit Dial-A-Ride Aging Transit
Must be approved through eligibility process.
Covers all of Wyandotte County.
Provides demand-responsive transit, congregate meals and meals on wheels.
City of Independence IndeAccess
Must be approved through eligibility process. Criteria is specific to ADA.
ADA Paratransit – Operated within ¾ miles of local bus routes.
Operating hours are the same as the hours of operation as the fixed route adjacent to the trip.
City of Independence IndeAccess+
Must be approved through eligibility process.
Covers all of the city of Independence.
Operating hours are the same as the rest of the City of Independence transit system.
Johnson County Special Edition
Must be approved through eligibility process and meet one of the following criteria: 1. Age 65 or older. 2. Have a documented
disability. 3. Have a monthly family
income within low-income guidelines.
One leg of the trip must be in Johnson County, but the other leg can be in Kansas City, Kansas, or Kansas City, Missouri.
Operating hours are Monday through Friday, 6 a.m.-6 p.m.

10 | Smart Moves 3.0 — Transit & Mobility Services: Existing Conditions
SERVICE
NAME
ELIGIBLE
USERS
SERVICE
AREA
OPERATING
CHARACTERISTICS
Johnson County SWIFT Only available to Johnson County Development Support clients.
Johnson County. Provides services for Johnson County Development Support clients to sheltered workshops.
In addition to the paratransit services offered by KCATA and community transit providers in the region, numerous social service agencies and municipalities receive Federal Transit Administration (FTA) Section 5310 funding (Enhanced Mobility for Elderly Individuals and Individuals with Disabilities Program) through a biennial competitive selection process sponsored by MARC and the KCATA. These agencies purchase or lease vehicles to provide services to meet the needs of specific clientele within the elderly or disabled community, or to serve areas or times of day that are not currently met through existing public transportation resources. This funding also provides funding for mobility management and infrastructure projects, which increase access to transit and mobility services.
Mobility Services Rideshare According to the FTA, ridesharing involves adding passengers to a private trip in which driver and passengers share a destination. Such an arrangement provides additional transportation options for riders while allowing drivers to fill otherwise empty seats in their vehicles. 4 Carpooling and vanpooling are the ridesharing options available for the Greater Kansas City Metro area. Ridesharing is distinct from taxi-like ridehailing services in that it does not involve payments to the driver, except as reimbursement for gas, tolls and/or parking.
Carpooling In a carpool, an individual with a car provides the vehicle and shares a ride to a common destination with others. Carpoolers typically take turns driving or passengers reimburse drivers for the cost of the ride. Family members, neighbors, co-workers and friends account for most carpool trips nationwide, but many commuters find partners through regional or employer-based ride matching services.
MARC hosts the regional ride matching website RideshareKC.org. Commuters create a secure account and input their trip details, and the software returns a list of potential carpool partners with the option to contact likely matches through the website. Details such as meeting time and place and sharing arrangements are at the discretion of the participants. Additionally, users can see transit routes and bike paths which could connect them to trips or destinations, and participate in challenges and other incentives.
4 FTA Shared Mobility Definitions https://www.transit.dot.gov/regulations-and-guidance/shared-mobility-definitions

11 | Smart Moves 3.0 — Transit & Mobility Services: Existing Conditions
Currently, RideshareKC has over 2,200 people registered through the site, with over 1,000 available for commute partner matches. Carpooling, including both RideshareKC-facilitated and informal trips, accounts for 9 percent of commuter trips in the Kansas City region.
Vanpooling In a vanpool, a group of commuters — typically between six and 14 individuals — ride to and from work on a regular basis in a designated van. Vanpool passengers pay a monthly fee based on the cost of operating the van. The vanpool provider handles maintenance and insurance.
KCATA coordinates the RideKC Van program, contracting with a vanpool service to provide the vanpool vehicles, coordinate payments, train drivers, process payments and provide employer outreach and customer service. Vanpool service is available to commuters in Jackson, Johnson, Wyandotte, Clay, Platte, Leavenworth and Cass counties in the Kansas City area. Vehicles include seven to 15-passenger vans, along with sport utility vehicles.
Currently, there are 50 vanpools in the region, transporting over 400 commuters.
Employer Shuttles Employer-based shuttles can take many forms, including shuttles that employees meet at park-and-ride lots, or campus shuttles that transport employees between buildings at large-scale work complexes. In addition to carpooling and vanpooling, the SmartMoves 3.0 plan calls for programming that supports employers who choose to transport their employees via employer/business shuttles.
There are currently few employer shuttles in operation in the Kansas City region, isolated mostly to schools, hospitals and other large institutions.
Transportation Management Associations Transportation Management Associations (TMAs) provide transportation services and education to businesses and employees in a particular geographic area, combining the efforts of many employers to reduce program costs. Most TMAs are nonprofit collaborations of private and public sector employers working together toward common goals, such as congestion mitigation or pollution reduction. TMAs typically serve employers in congested urban areas with rideshare matching, marketing travel options, conducting travel surveys, and development of trip reduction plans. TMAs also help with parking management, flexible work hours, vanpools, special events management and freight transport movements.
There are currently no active TMAs in the Kansas City Region.
Transit Pass Programs Transit passes allow employers to partner with area transit agencies to provide access to the fixed-route network. Employers purchase transit passes in bulk, frequently at a discounted rate, and provide them to their employees either as a free benefit or at an additionally discounted price. Transit passes under this model incentivize card/pass holders to use fixed-route transit by enhancing convenience and affordability. For businesses, beyond providing reliable transportation for their employees, transit pass programs can provide tangible tax benefits, as IRS regulations permit employer-provided transit passes to be excluded as a taxable benefit (up to $100 per month).

12 | Smart Moves 3.0 — Transit & Mobility Services: Existing Conditions
Current pass programs exist for students attending UMKC, all Metropolitan Community College campuses, the Kansas City Art Institute, and KCK Community College. This increases accessibility to these institutions, which can eliminate a barrier to higher education for those without personal transportation. Many regional employers, both public and private sector, currently purchase monthly transit passes for their employees.
Ridehailing / Demand Responsive Services Demand responsive operations provide smaller scale transportation services that meet the demands of individual users or, in some cases, multiple users who share trips. The following section provides definitions of mobility service types.
Transportation Network Companies Transportation Network Companies (TNCs) are technology companies that operate via websites or mobile apps to connect users to independent, non-commercial drivers who provide standard transportation services.
To date, two TNCs (Uber and Lyft) have been in operation in the Kansas City region, while others have been restricted by state laws. However, those laws changed in Missouri in spring 2017, enabling other companies to enter the market. Data regarding the number of drivers, users and trips provided, as well as the origins/destinations of those trips, was not available during the SmartMoves 3.0 planning process.
RideKC Freedom On-Demand RideKC Freedom is the umbrella name for the complimentary paratransit services offered by fixed-route operators in the Kansas City metropolitan area. Beneath that umbrella, a ridehailing pilot program was launched in May 2017. Through the RideKC Freedom smartphone app (or by calling the regional call center), eligible paratransit users may book an on-demand trip in a traditional or ADA-accessible taxi. Trips can be booked on-demand, whereas typical ADA-complementary paratransit services typically must be booked at least 24-hours in advance, although frequently those advance times are much longer.
Non-paratransit users within the service area may also use the RideKC Freedom app much the same way they would use a TNC. A portion of the revenue from these non-ADA trips subsidizes the paratransit operations.
In the first two months of operation, RideKC Freedom provided 121 retail trips, and over 3,000 ADA paratransit trips.
Freedom On-Demand Freedom (previously Share-A-Fare)
No advance reservation required Schedule at least 24 hours in advance Curb-to-curb service Door-to-door service To book a trip: use app or call 816.842.9070 To book a trip: call 816.842.9070 Pay with cash, credit or debit card, or through the app Pay cash
Figure 9: RideKC Freedom On-Demand versus Traditional Paratransit

13 | Smart Moves 3.0 — Transit & Mobility Services: Existing Conditions
ADA: $3 for the first 8 miles & $2 each mile after Ages 65+: $5 for the first 8 miles & $2 each mile after ADA $3 per trip
Up to 4 trips per day Unlimited daily trips
Book a trip for a friend or family member Book a trip for a friend or family member
Up to three guests for free No guests (except PCAs) for free
FLEX KCATA offers five demand-responsive services in the Kansas City metropolitan area, called RideKC Flex (formerly MetroFlex). They are located in the following areas:
• North Kansas City • Raytown • Gladstone-Antioch • South Kansas City • Bannister-Hillcrest
This service is best utilized in small areas where traditional fixed-route transit is not feasible, allowing users to access the larger transit network or seek goods and services within the service area. Reservations must be made at least 24 hours in advance, and service is limited to certain hours and days of the week.
Taxis Several taxi companies operate in the Kansas City metro region. They are typically used by individuals or small groups of passengers for one-way trips. Kansas City taxicab companies include 10/10 Taxi, Checker Cab Company, Yellow Cab Taxi, and a number of smaller providers.
A growing mobility option for older adults or individuals with disabilities are taxi vouchers. With taxi voucher programs, a locally determined eligible participant receives vouchers for reduced cost rides with participating taxis. When a customer wants a ride, he or she contacts the taxi company directly to dispatch the ride and pays with a voucher. The company then invoices the applicable agency for the trip. Using taxis instead of general paratransit services saves money and builds a strong partnership with the private sector while also providing positive benefits for users.
Olathe and Shawnee, Kansas have successful local taxi voucher programs. KCATA has recently introduced a regional taxi voucher pilot program called RideKC Taxi. This service provides taxi service to residents of Johnson County, Kansas; Raytown, Missouri; Sugar Creek, Missouri; Independence, Missouri; and areas of Kansas City, Missouri. To be eligible for the service, the customer must be age 65 or older or have a disability and live in the service area.
Microtransit The Federal Transit Administration defines microtransit as multi-passenger transportation services that serve passengers using information technology to create dynamically-generated routes. These services may expect passengers to make their way to and from common pick-up or drop-off points. Vehicles can range from large SUVs to vans to shuttle buses. Because they provide transit-like service but on a smaller, more flexible scale, these new services are known as microtransit.
14 | Smart Moves 3.0 — Transit & Mobility Services: Existing Conditions
In March 2016, KCATA embarked on a first-of-its-kind public-private partnership with microtransit provider Bridj. The pilot, called RideKC Bridj, used a smartphone app to allow users to book rides on 14-seat passenger vans driven by KCATA drivers. Ride requests made through the app generated crowd-sourced routes with few stops and short travel times. Fares were $1.50, the same charged to ride a non-express bus.
Although RideKC Bridj was discontinued after the first year, KCATA gained valuable insight from the project. A survey conducted by the University of California–Berkeley identified low customer awareness and geographic barriers as factors contributing to low ridership numbers. While the project was not as successful as hoped, through the pilot, KCATA learned who likely microtransit customers are as well as how a similar model might operate more efficiently in the region in the future.
Carshare Carshare is a service that provides members with access to an automobile for intervals of less than a day. Nationwide there are three major business models for carsharing:
• Round-trip or traditional carshare requires users to borrow from and return vehicles to the same location.
• One way or free-floating allows users to pick up a vehicle at one location and drop off at another.
• Peer-to-peer (p2p) uses an online platform to enable car owners to rent their personal vehicles to other carshare members.5
The Kansas City Metropolitan Area has been home to a small fleet of Zipcar carshare vehicles since 2012. The initial two vehicles were located at the University of Missouri–Kansas City campus. Two more vehicles were added at the Kansas City International Airport, and eight vehicles were added to four locations in downtown Kansas City.
Biking and Walking Bicycle and pedestrian infrastructure is a critical element of a transportation system that provides individuals and families with access to affordable and healthy transportation options. In 2012, a task force composed of members of MARC’s transportation modal and programming committees drafted a regional complete streets policy for input and approval from the Total Transportation Policy Committee and the MARC Board of Directors. The policy, which was updated in 2015, calls for “a safe, balanced, regional multimodal transportation system that is coordinated with land use planning, supports equitable access to opportunities and protects the environment.” Currently, 12 local governments and the states of Missouri and Kansas have adopted complete streets policies. This regional complete streets policy sets the stage for regional and local bicycle and pedestrian facility plans.
Bicycle In addition to plans adopted by local governments, the Kansas City metro has regional plans for both off-street (trails) and on-street bicycle facilities.
5 FTA

15 | Smart Moves 3.0 — Transit & Mobility Services: Existing Conditions
MetroGreen Initially adopted in 1991 and later updated in 2002, MetroGreen™ is the region’s vision of a system of interconnected trails and greenways. While some of the corridors were designated solely to protect or restore streams, about half contain either a trail or an off-street facility. Currently, the region has 701 miles of trails.
Greater Kansas City Regional Bikeway Plan The Greater Kansas City Regional Bikeway Plan was adopted in January 2015. The plan envisions a cohesive regional network of bikeways, connected across city, county and state boundaries, that promotes active transportation. The proposed Regional Bikeway Network would make it easier for people across the metro to use bicycling not only for recreation, but as a viable mode of transportation.
Currently, the region has 602 miles of on-street bicycle facilities including 93 miles of bike lanes. When fully implemented, the Regional Bikeway Plan calls for over 2,000-miles of on-road and off-road facilities that will expand active transportation choices for residents of eight-counties in the bistate Kansas City region. This network will complement the regional trails system along steamway, rivers and rail-road utility corridors.
Bikeshare Bikeshare is a system in which a rider can check out a bicycle at a given station and use it for a few minutes or longer before returning it to another station. Stations are equipped with docks that securely lock bicycles. Typically, users can pay a membership fee and then check bicycles out for short periods of time for free, only paying rental rates if they have a bicycle out for a longer period. Non-members can also check out a bicycle, using a credit card.
Kansas City BCycle, launched in July 2012 with 12 stations spread out between the River Market and Crown Center. There are currently 30 stations, and there will be 42 by the end of summer 2017. New areas that will get bikeshare stations include North Kansas City, West 39th Street, the University of Missouri–Kansas City campus, and Longview Lake. B-Cycle is also working with Johnson County Parks on a plan for stations in Shawnee Mission Park with installation anticipated in 2018. Bikeshare is also in talks to expand into the University of Kansas Medical Center area, Westwood and Olathe, Kansas.
In 2016, riders took 16,700 trips (a 20 percent increase from 2015). One-third of riders use public transit in conjunction with their bikeshare trip. Although there is no specific statistic on the percentage of trips that are work trips, annual members make up 12 percent of total ridership and these riders tend to use the service most for work and errand-related transportation.
Pedestrian MARC is currently in the process of creating the region’s first pedestrian plan. This plan will synthesize a vision to improve walkability across jurisdictional boundaries and coordinate planning efforts at the regional level.
In late 2016, 78 communities responded to a Local Government Pedestrian Inventory (LGPI) survey. Of those, 27 percent reported that they have a Pedestrian Master Plan, 33 percent reported having a Bicycle Master Plan, and 53 percent reported having a Trails Linkage Plan. Additionally, 26 percent of respondents cited “lack of adopted plans” as the greatest challenge to bicycle/pedestrian planning,

16 | Smart Moves 3.0 — Transit & Mobility Services: Existing Conditions
which was tied with “lack of implementation,” and “lack of supporting development ordinances.” Lack of support from land developers was identified by 42 percent of respondents as their greatest barrier. Finally, 53 percent of communities reported that they did not have an adopted Complete Streets Policy.
Regional and local data on sidewalk mileage and condition is currently lacking. Many cities do not have sidewalk inventories, and some have only partial data. MARC’s sidewalk data for 21 jurisdictions in the region — where 60 percent of the metro population reside — indicates that there are over 6,000 miles of sidewalk in these communities.6 In 2017, the cities of Kansas City and Independence, Missouri, contracted for their entire roadway networks to be studied. This data shows that Kansas City has over 2,200 miles of sidewalks, while the Independence study had not been completed at the time of this study’s publishing.
Technology Mobile Software Applications (Apps) Smartphones have substantially changed the way people are able to access information, particularly relating to mobility options. TNCs like Uber, Lyft and SilverRides, as well as services like RideKC Freedom On-Demand, would not exist were it not for mobile technology that can track rides geospatially and facilitate payments. Many rely on navigation apps like Google and Apple Maps to access step-by-step directions, avoid congested roadways, and even search for new destinations. Apps like Waze make it easy to estimate the time and cost of a range of different mobility options, including transit, taxis, bikeshare, TNCs and carshare. All of these advancements have affected how we make decisions about how to travel.
One critical component that factors into the adoption of mobility apps is the digital divide. While there is evidence that that gap has been closing in recent years, there are still many individuals, often those who need assistance the most, who are unable to access this technology because of their inability to afford a smartphone, because they do not have a bank account, or because they do not have the physical ability to use a smartphone effectively. These individuals must be accounted for in any planned shifts to mobile app technology to support public transportation services. For example, while RideKC Freedom is primarily app-based, users are still able to call a reservation desk to book their trips and have a ride dispatched to them. Lyft has been piloting services under the Concierge brand that allow seniors in assisted living facilities to book a trip using Lyft by calling the front desk. Accommodations like these are critical to maintaining accessibility for all.
6 MARC has data from: Lee’s Summit, Grandview, Blue Springs, and Kansas City (in Missouri) and Mission, Overland Park, Olathe, Lenexa, and Kansas City (in Kansas). The Lenexa data, as well as the Kansas City, Missouri, Overland Park, and Olathe data is dated.

17 | Smart Moves 3.0 — Transit & Mobility Services: Existing Conditions
Logo Name Cost Platform(s) Description
RideKC App Free iOS, Android This app allows riders to pay fares, track RideKC buses and KC Streetcar, and plan trips.
Freedom On-Demand
Free iOS, Android This app-based option offers same-day taxi service. Designed for paratransit trips and available for everyone.
Google Maps Free
Android, BlackBerry, iPhone/iPad, Nokia, S60, Windows
Provides public transit directions (trip planning) and information.
ItsAB.us Free Web Real-time bus tracking
KC Street Track
$0.99 iOS, Android Tracks RideKC Bus and Streetcar stops and gives directions, along with street view, social media interfaces and more.
Transit App Free iOS, Android Provides information about the next bus or train
arrival in 53 regions. Includes a trip planner.
TransitTimes+ $2.99 iOS, Android TransitTimes+ provides public transit trip planning
and schedules for more than 50 cities.
RideshareKC Free iOS, Android Helps commuters find commute partners and transit routes and participate in incentive programs.
Informational Kiosks One way to address the digital divide is by providing interactive, informational, digital kiosks at critical junction points (e.g., mobility hubs). These digital kiosks currently enable users to track the real-time location of their ride and access information regarding destinations in the vicinity of the transit stop, which boosts economic activity. However, these kiosks are capable of much more.
There are currently 25 interactive kiosks in use along the RideKC Streetcar Line in Downtown Kansas City. These kiosks provide real-time arrival information, information about adjacent mobility options, and advertising for local businesses. Headphone jacks on the kiosks allow visually-impaired users to utilize the services. Additionally, 311 services are accessible through these kiosks.
Figure 10: Transit Apps
18 | Smart Moves 3.0 — Transit & Mobility Services: Existing Conditions
Mobility Hubs While there currently are no mobility hubs in the Kansas City region branded as such, there are many locations that are remarkably close to the intended concept. Although not entirely a new idea, proposed mobility hubs are more than simple bus stops. Mobility hubs serve as a place where riders are introduced to a range of transportation choices that are part of an integrated family of services, making the entire system more accessible and appealing. For a more in-depth examination of what is meant by mobility hubs in the context of this planning effort, see the Defining the Smart Moves System section.
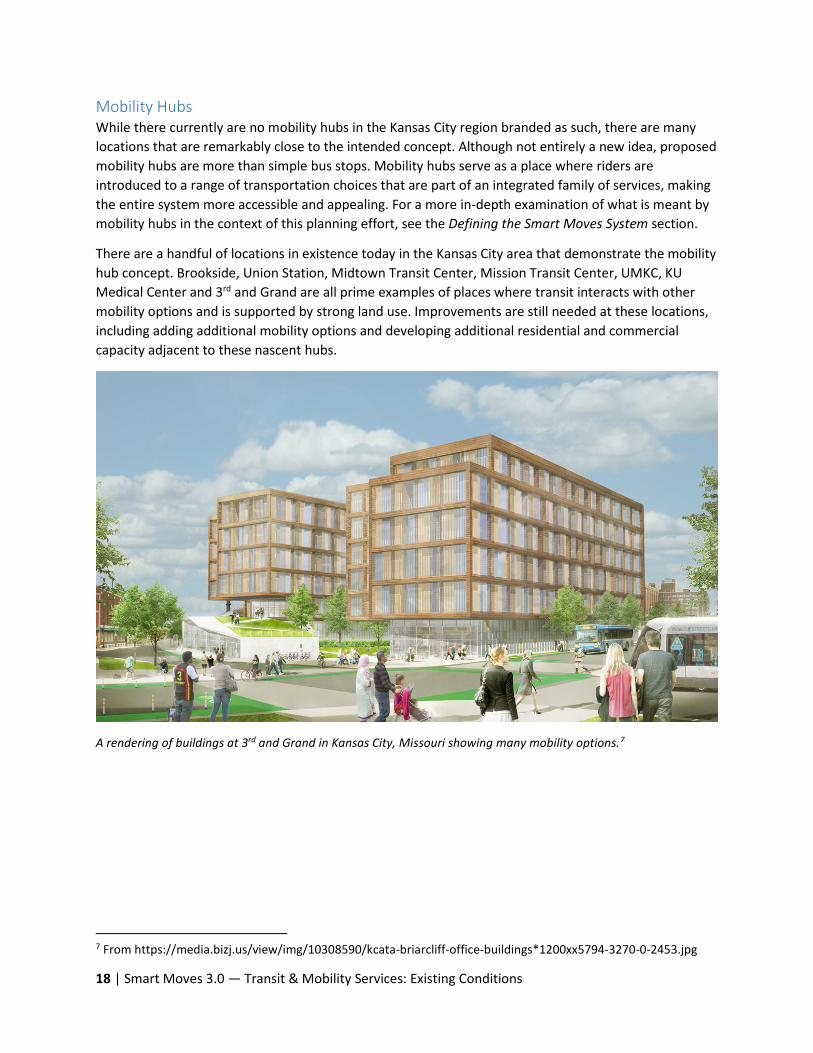
There are a handful of locations in existence today in the Kansas City area that demonstrate the mobility hub concept. Brookside, Union Station, Midtown Transit Center, Mission Transit Center, UMKC, KU Medical Center and 3rd and Grand are all prime examples of places where transit interacts with other mobility options and is supported by strong land use. Improvements are still needed at these locations, including adding additional mobility options and developing additional residential and commercial capacity adjacent to these nascent hubs.
A rendering of buildings at 3rd and Grand in Kansas City, Missouri showing many mobility options.7
7 From https://media.bizj.us/view/img/10308590/kcata-briarcliff-office-buildings*1200xx5794-3270-0-2453.jpg

1 | Smart Moves 3.0 — Transit & Mobility Services: Challenges and Gaps
IV. Transit and Mobility Services: Challenges and Gaps Challenges Providing efficient transit and other mobility options is no simple task in the Kansas City area and many other regions. Specific transit and mobility challenges include historic land use and development patterns, residents’ attachment to driving, employment centers that are not easily accessible by transit, and funding shortfalls. These challenges directly relate to this plan’s goals: economic vitality, placemaking, equity, transportation choices, safety and security, system condition, system performance, public health, environment, and climate change and energy use. Complicating matters, these challenges relate to each other in a type of feedback loop where one challenge affects another.
For example, the region is not bound by significant geographic barriers like coasts or mountains, which has allowed it to spread over a large area, causing residents to feel a strong need for and attachment to their personal vehicles. Easy access to the region’s many highways, necessary because of the large amount of single-occupancy vehicles, reinforces the dispersed nature of development. The lack of density in many places in our region, enabled by the lack of geographic barriers and car-oriented development patterns, also makes it difficult for transit service to reach employment centers, disproportionately affecting opportunities for workers who rely on transit.
Kansas City’s Land Use and Development Pattern Like many Midwestern cities that grew quickly after the end of World War II, the Kansas City metro area has a relatively dense urban core surrounded by a pattern of lower-density, suburban land use stretching to the edges of the metro area. While Kansas City’s urban core is dense enough to support robust transit and mobility services, it is harder and harder to deliver good, cost-effective transit as residential and commercial densities decrease. Even if transit service reached low-density areas, many people will choose to drive if using transit takes longer to get where they need to go.
Solutions This does not mean, however, that those who live in less dense areas of the region should not have transportation choices beyond their own vehicles. This plan identifies mobility service solutions for areas of the region that are not dense enough to support traditional, fixed-route transit. It also includes recommendations to create denser, mixed-use development — especially at mobility hubs and along transit routes — to create nodes of density that can support transit service in suburban conditions.
Although it has not yet been deployed to serve less-dense areas, it is possible to envision a microtransit model that could help suburban residents reach key local destinations. Vanpooling, carpooling, walking, biking, bike-share, and other mobility strategies could also provide meaningful transportation options for those without access to a bus (or rail) route.

2 | Smart Moves 3.0 — Transit & Mobility Services: Challenges and Gaps
Car Culture Kansas Citians are not unique when it comes to loving their cars. Driving one’s own car is convenient, and currently relatively affordable. Nationwide, when gas prices are higher, more people shift to transit, carpooling, and other transportation options. From 2002 to 2008, the price of gasoline rose substantially, before falling sharply in 2009 during the recession. In 2012, prices reached the highest level in 80 years in both current and constant dollars, but began a steep decline afterwards. In constant dollar terms, the price of gasoline in 2015 was only seven cents higher than in 1929.1
People who do not own their own cars must rely on transit, walking, biking or carpooling. But it is often difficult to convince residents who can afford their own vehicles to consider other modes, especially when gas prices are low and parking is free or inexpensive, as it often is in the Kansas City region.
Solutions Creating a more robust and efficient transit and mobility system will not be enough to convince many Kansas Citians to leave their vehicles at home, even when gas prices go up again. Cities and counties can encourage more people to take transit and use other modes of transportation through policies that promote denser development near mobility hubs and transit routes. In addition, marketing and educational efforts can educate potential riders on the benefits of transit and mobility services and how to use them.
Jobs Access For Smart Moves 3.0, the planning team analyzed job accessibility by transit in the region. To do this, the team contracted with Conveyal, a company that developed a transit accessibility model (for more on how this model works, see Section V — Jobs Access via Transit). The model shows that currently, only five percent of jobs are accessible via transit in the morning and three percent in the evening for the average worker within a 60-minute commute. These figures, while low, are not very surprising given the decentralized nature of employment in the Kansas City region. While Downtown Kansas City still has the highest concentration of jobs, the areas experiencing the highest employment growth are in suburban locations, often very far removed from transit.
1 https://energy.gov/eere/vehicles/fact-915-march-7-2016-average-historical-annual-gasoline-pump-price-1929-2015
TRIPS BY MODE
In the Kansas City region, the vast majority of our trips are taken in single-occupant vehicles. Although data on all trips is not available, the Census Bureau collects data on how workers commute. Currently, more than 83 percent of workers in the Kansas City region drive alone, while 8.6 percent carpool and 1.2 percent take transit.
Means of Transportation to Work in the Kansas City Metro Area # of Workers % Drove Alone 779,418 83.4% Carpooled 80,593 8.6% Used Transit 11,290 1.2% Walked 11,867 1.3% Bicycled 1,796 0.2% Worked from Home 41,503 4.4% Other 8,324 0.9% TOTAL 934,791 100.0% Source: ACS 2015 5-Year Estimates.
Slightly more Kansas City commuters walk (1.3 percent), while only a small fraction (0.2 percent) bicycle to work.

3 | Smart Moves 3.0 — Transit & Mobility Services: Challenges and Gaps
Solutions This plan recommends a phased approach to expanding the region’s transit system to better connect workers to employment centers. This includes adding new routes, modifying and extending existing routes, and expanding service hours and weekend service. Additional jobs access gains will be achieved by expanding existing mobility services (such as bike-share, car-share and employer shuttles) and developing new mobility services (such as Transportation Management Associations and microtransit), especially when paired with the creation of mobility hubs. To learn more, see Section VII — Strategies and Recommendations.
Funding Although private companies or nonprofits generally provide mobility services in response to market demand, fixed-route transit service depends primarily on public funding. The following charts show funding sources for transit in 2015.
Local funds account for about two-thirds of transit funding, with all other sources, including federal funds and fare revenues, making up only about a third of the dollars devoted to transit. Because local sources provide the most funding — which unlike federal dollars can be spent on both operations and capital expenses — local funds largely determine the amount of service that can be provided. Currently the only dedicated sources of local transit funding in the Kansas City region are two sales taxes in Kansas City, Missouri. Other local governments that allocate sizable resources to the operations of their transit systems are the Unified Government of Wyandotte County and Kansas City, Kansas; the City of Independence, Missouri; and Johnson County, Kansas. Additionally, several smaller municipalities in the region provide financial support for transit service in their community or for community-based transit service.
11%
63%
0%
22%
3%
KCATA Funding Sources: 2015
Fare Revenues
Local Funds
State Funds
Federal Assistance
Other Funds
Figure 11: KCATA Funding Sources

4 | Smart Moves 3.0 — Transit & Mobility Services: Challenges and Gaps
Solutions Given that there does not seem to be momentum for a single, regional tax dedicated to funding transit, the new transit service recommended in this plan assumes instead that a county-by-county funding system, similar to that in use by Johnson County, is feasible. Most transit services in our region cross city, county and/or state boundaries, and improvements to transit service and job access are needed throughout the region, making a county-by-county funding model a viable solution in the absence of more intensive funding solutions.
How the Kansas City Region’s Transit and Mobility Challenges Relate to Plan Goals:
The challenges that the region faces with land use, car culture, jobs access, and funding directly relate to the 10 goals included in Smart Moves 3.0. When workers struggle to get to jobs or go to school, the region’s economic vitality and equity suffer. A lack of dense, mixed-use nodes negatively impacts placemaking, system performance, public health, the environment, climate change and energy use. Likewise, it is difficult to offer transportation choice and maintain the safety and condition of the transit system given these current regional challenges.
Gaps In addition to broad regional challenges, the Project Team identified a number of gaps in current transit service through route analysis and stakeholder and public feedback.
East-West Connectivity Through the first phase of public and stakeholder outreach, it became very apparent that many people have difficulty making transit connections between the east and west areas of the Kansas City region. This includes east-west service:
• North of the Missouri River • Between Jackson and Johnson counties, including:
o Between Kansas City and northeastern Johnson County o Between Lee’s Summit and Olathe
Note: There is also a need for better north-south transit options between Johnson and Wyandotte counties.
Solutions This plan recommends new and modified fixed-route transit service that addresses the east-west connectivity gap, including new service along Barry Road in the Northland as well as service on 135th Street in the southern part of the region. Smart Moves 3.0 also recommends expanded service hours and days of the week for transit along 7th Street and Rainbow between Wyandotte and Johnson counties. These recommendations are complemented by recommendations for mobility hubs and services that have the potential to further facilitate connectivity.
Service between Suburban Job Centers and Where Workers Live A number of existing and emerging suburban employment centers are difficult to reach by transit services today because transit service does not exist, there is not enough service or travel time is prohibitively long. Examples of these employment centers include:
• The Legends

5 | Smart Moves 3.0 — Transit & Mobility Services: Challenges and Gaps
• Independence Center • College and Metcalf • Cerner, Three Trails • KCI/Zona Rosa • Gardner/Edgerton
Solutions Smart Moves 3.0 includes recommendations for new and modified fixed route service that has the potential to increase access to suburban job centers. For instance, the plan includes service expansion on College Boulevard that links to expanded service on Metcalf Avenue. Both of these upgraded services would connect to other services that would even further expand the ability of workers across the region to reach the College and Metcalf employment area. Mobility hubs are also a key strategy for linking workers with jobs in places that are difficult to serve with fixed-route transit service. For example, the plan proposes a mobility hub in Gardner, Kansas. Workers could take transit to this hub and then an employer shuttle or other service could bring them to jobs in the intermodal area in Edgerton.
Intra-County Service Using data to examine where employees live and work, MARC was able to determine that there are additional gaps in service within certain counties and sub-areas.
Johnson County
Almost 63 percent2 of Johnson County residents work within Johnson County, but more than 85 percent3 of Johnson County workers commute to their jobs by driving their own vehicles.
Eastern Jackson County
Currently, other than service provided by IndeBus within the city of Independence, there is no service connecting destinations within Eastern Jackson County. Forty-four (44) percent4 of residents work within Eastern Jackson County, but nearly 86 percent5 commute to their jobs by driving their own vehicles.
Solutions Smart Moves 3.0 proposes significant fixed-route service expansion within Johnson County and between Eastern Jackson County jurisdictions. This includes an upgrade to fast and frequent (15-minute) service on 75th Street and Quivira in Johnson County and expanding the current 251-Truman Medical Center—Lakewood service to link Lee’s Summit with Blue Springs by connecting to an upgraded 31st Street/Blue Ridge Crossing route. The plan also puts forward mobility services — vanpools transporting workers from mobility hubs to job centers, for instance — as solutions that could work to fill intra-county service gaps.
Days, Hours and Frequency of Service Much of the region’s existing transit service is designed to meet the needs of a commuter with an 8-to-5 job. But today’s economy is built on a number of economic sectors and jobs with shifts that vary
2 OntheMap, 2014 data. 3 ACS 2015 5-Year Estimates. 4 OntheMap, 2014 data. 5 ACS 2015 5-Year Estimates.

6 | Smart Moves 3.0 — Transit & Mobility Services: Challenges and Gaps
considerably from the traditional 8-to-5 model. Non-traditional shift workers often exhibit a high propensity to use transit, and the location of their jobs may require a “reverse commute,” which entails traveling the opposite of the peak direction.
In addition to extended service hours, shift workers in the retail and health sectors often work on the weekends, when current service is limited or non-existent. Shift workers, like traditional 8-to-5 workers, also could benefit from an increase in service frequency; it is difficult to arrive on time for work if the bus you must take only comes once an hour.
Solutions This plan calls for extending service hours and frequencies as well as adding weekend service on many routes, allowing workers with non-traditional shifts better transit access.

1 | Smart Moves 3.0 — Jobs Access Via Transit
V. Jobs Access via Transit This Smart Moves plan update was partially supported by a TIGER (Transportation Investments Generating Economic Recovery) grant from the U.S. Department of Transportation, awarded to MARC and its planning partners to study ways to increase the number of jobs in the region accessible by transit. This section defines what the plan means by jobs access, details current (baseline) jobs accessibility in the Kansas City region, and demonstrates how recommendations for fixed route changes will increase job access if implemented.
Definition of Jobs Access This plan defines jobs access via transit as the ability of a worker to get to his or her place of employment using fixed route transit within a reasonable time frame. The plan measures the percentage of jobs accessible via transit to the average worker in the Kansas City region based on a 60-minute commute, which includes time to walk to the transit stop, wait for the transit vehicle, ride the vehicle, wait for any transfers, and walk to the final destination. The 2012 study by the Brookings Institution that called attention to Kansas City’s low performance in job access by transit was based on a 90-minute commute time. In the Kansas City region, however, the average commute time is less than 23 minutes, one of the shortest in the United States. The Smart Moves planning team determined that 60 minutes, while still high compared to the regional average, would be a more reasonable commute time to measure transit accessibility.
The maps in this section show the number of jobs accessible to workers from where they live. These maps can be seen as measures of the economic opportunity provided by the transit system to residents in each location. Workers who live in a location that is shaded dark blue can reach a large number of job opportunities using transit, while those in light blue areas have fewer options.
Measuring Jobs Access To model jobs access via transit, the Smart Moves planning team contracted with Conveyal, a company that created an analytical tool called Transport Analyst. This tool uses regional data to calculate, for every location, the number of jobs that can be reached via transit within a specified time by the average worker.
Methodology Transport Analyst was used to compute the number of jobs that can be reached from every location in the Kansas City region with both the existing transit system and the system improvements proposed by Smart Moves 3.0. This analysis was performed for peak morning travel and late evening travel to get a picture of how well the transit system is serving those with traditional daytime commutes as well as those whose shifts begin in the early evening.

2 | Smart Moves 3.0 — Jobs Access Via Transit
To compute accessibility to jobs, several data inputs were needed, starting with the locations of jobs within Kansas City region. These were obtained from the U.S. Census Bureau’s Longitudinal Employer Household Dynamics Origin-Destination Employment Survey (LEHD LODES),1 with further editing by MARC staff to correct data collection biases. Jobs data for the seven-county (Jackson, Johnson, Wyandotte, Leavenworth, Cass, Clay and Platte) KCATA service area was retrieved. These data inputs are unfortunately not segmented by shift time, so the team could not determine which jobs require which shifts. Therefore, in this analysis, job access was computed for all jobs regardless of the time of day under study.2
Next, information about the existing and proposed public transit networks in the Kansas City region was added to the Transport Analyst model. For the existing network, the General Transit Feed Specification file from KCATA3 was obtained. Transit information from May 2016 was used. New routes, as well as routes to be modified, were added to the model. A detailed list of all the transit services included in the Smart Moves model is available in Appendix A.
Finally, to compute the time needed to walk to and from transit stops, street network data was needed. Data was obtained from OpenStreetMap,4 a worldwide, open-street network dataset.
Transport Analyst used these data sets to compute the job accessibility of the average regional worker in the region. The software works by computing the average travel time by transit from every location in the region to every job in the region during the chosen time window. For instance, in an analysis of the morning peak, the software computes the travel time from every location to every job if workers start their commutes at 6 a.m., 6:01, 6:02, 6:03, etc. It then averages those numbers to create an average travel time from each location to each job. If that average travel time is less than one hour, that job is considered reachable. For new routes that do not yet have exact schedules, but only frequencies, 1,100 random schedules with the specified frequency were created and tested in order to approximate any possible schedules that might be created in the future.5
1 U.S. Census Bureau, LEHD LODES 2014. https://lehd.ces.census.gov/data/#lodes 2 While the jobs data used in the analyses do not include shift information, given the relatively low numbers of jobs accessible by transit both under baseline and plan conditions, it is safe to assume that the number of jobs generated by the model as being accessible actually exist at the given commute times. 3 Kansas City Area Transportation Authority, Google Transit Data Feed, http://www.kcata.org/transit_data/access_gtdf 4 OpenStreetMap Foundation, http://www.openstreetmap.org/ 5 For a more thorough description of the methodology used, see Conway, Matthew Wigginton, Andrew Byrd, and Marco van der Linden. “Evidence-Based Transit and Land Use Sketch Planning Using Interactive Accessibility Methods on Combined Schedule and Headway-Based Networks.” Transportation Research Record 2653 (2017). doi:10.3141/2653-06.
Average worker concept The number of jobs that a worker can access on transit varies depending on where she or he lives. For instance, a downtown Kansas City, Missouri resident can access many more jobs via transit than a resident who lives in a neighborhood in suburban Lee’s Summit. The model tallies up the number of jobs that each worker in the region can reach within a given commute time, depending on where they live and what transit is available, and then generates the average worker’s number of accessible jobs.

3 | Smart Moves 3.0 — Jobs Access Via Transit
The analysis takes into account the time spent waiting, as well as the time spent riding the transit vehicle and walking to or from the stop, as it computes many different travel times over a given window. The resulting travel time is sensitive to changes in service frequency. Increasing the frequency on a line will decrease the time people spend waiting, and will therefore result in an accessibility boost. Many people have schedules that are not well correlated with the transit schedule. The specific time they need to arrive at or leave work may or may not align well with the transit schedule, possibly causing a long wait. This methodology captures long waits and incorporates them into the computation of accessibility.
Model Results The universe of workers was defined as those who live and work within the Census-defined urbanized area. This model does not include those workers or jobs on the rural or distant exurban areas of the region, in order to more accurately depict the realistic ability of transit to deliver workers to jobs within a reasonable commute time.
Baseline Under baseline (existing) conditions, the model shows the average Kansas City area worker can access 5 percent of the region’s jobs via transit during the morning commute and 3 percent during the late evening commute within 60 minutes. With a 90 minute commute time, these figures jump to 16 percent and 7 percent, respectively. Table X shows jobs access figures for 30, 45, and 75 minute commutes.
Kansas City Region Jobs Accessibility via Transit (Baseline) Commute Time (minutes) 30 45 60 75 90
Morning Peak, 6-9 a.m. 7,038 1% 22,192 2% 45,852 5% 88,666 10% 148,633 16% Evening, 8-11 p.m. 5,455 1% 15,086 2% 26,067 3% 40,908 5% 59,507 7% Source: Conveyal, 2017.
Smart Moves 3.0 Improvements The Smart Moves plan for fixed-route improvements is projected to result in the average worker being able to access 28 percent more jobs by transit within 60 minutes during the morning peak hour (6-9 a.m.), and 94 percent more in the late evening (8-11 p.m.) compared with baseline conditions during the mid-term (5-10 years). Short-term (0-5 years) recommendations result in increases of 18 percent in the morning peak and 70 percent in the late evening. At full plan buildout, fixed route recommendations increase the number of jobs accessible to the average worker by transit by 47 percent in the morning peak and 122 percent in the late evening. See Table X for the percentage of jobs the average worker can access under the Smart Moves plan in the short-, mid-, and long-terms for a range of commute times.
Table X: Jobs Accessibility via Transit

4 | Smart Moves 3.0 — Jobs Access Via Transit
Kansas City Region Jobs Accessibility via Transit (Model Results Under Smart Moves 3.0) Commute Time (minutes) 30 45 60 75 90
Morning Peak, 6-9AM
Short-term (0-5 years) 7,558 1% 24,895 3% 54,297 6% 102,468 11% 165,733 18% Mid-term (5-10 years) 7,730 1% 26,302 3% 58,717 7% 111,045 12% 182,281 20% Long-term (10-20 years) 8,001 1% 28,442 3% 67,256 7% 131,921 15% 222,194 25%
Evening, 8-11PM Short-term (0-5 years) 6,922 1% 21,603 2% 44,305 5% 80,217 9% 126,761 14% Mid-term (5-10 years) 7,070 1% 23,212 3% 50,475 6% 93,588 10% 151,247 17% Long-term (10-20 years) 7,342 1% 25,034 3% 57,838 6% 111,216 12% 183,537 20%
Source: Conveyal, 2017.
The following maps show baseline accessibility by transit in the morning peak and late evening as well as accessibility at buildout of the Smart Moves fixed route transit system. People who live in areas that are shaded dark blue are able to access many more jobs via transit than those who live in areas shaded lighter blue.
Figure 13: Jobs Accessibility after Smart Moves Implementation

5 | Smart Moves 3.0 — Jobs Access Via Transit

6 | Smart Moves 3.0 — Jobs Access Via Transit

7 | Smart Moves 3.0 — Jobs Access Via Transit
County-by-County Analysis The team also used Transport Analyst to model jobs accessibility by county. Cass, Clay, and Jackson counties in Missouri and Johnson, Platte, and Wyandotte counties in Kansas were examined because these are the counties that either have transit access currently or are envisioned to gain it under Smart Moves 3.0.
Just as the regional analysis generated the jobs accessibility for the average regional worker, this methodology generates the jobs accessibility for the average worker who lives in a given county. For example, the model shows that the average worker who lives in Jackson County can currently access about 71,700 jobs by transit or about eight (8) percent of the region’s jobs.
For the most part, the model results show gains for workers who live in the analyzed counties. Since Jackson and Wyandotte counties include the bulk of the urban core where transit access (and ridership) is already the highest, the workers who reside in these counties have access to the highest percentages of jobs currently and at plan build out. Under Smart Moves, workers who live in Johnson County experience the most gains—Johnson County workers go from being able to only access three (3) percent of the region’s jobs currently to eight (8) percent under plan buildout. Additionally, it should be noted that while Johnson County workers gain access to more jobs in the region as a whole, workers from across the region also gain better access to the emerging job centers in Johnson County. This is important especially in terms of connecting workers without access to a personal vehicle who live in the urban core and elsewhere with job opportunities in Johnson County.
Kansas City Region Jobs Accessibility via Transit by County (Baseline and Smart Moves 3.0 model results for 60 minute commute time) Morning Peak Late Evening
# of Jobs
Accessible % of Total
Jobs # of Jobs
Accessible % of Total
Jobs Cass County, MO
Baseline 0 - 0 - Short-term (0-5 years) 2,654 < 1% 2,193 < 1% Mid-term (5-10 years) 2,656 < 1% 2,193 < 1% Long-term (10-20 years) 2,682 < 1% 2,196 < 1%
Clay County, MO Baseline 33,899 4% 8,379 1% Short-term (0-5 years) 36,379 4% 26,006 3% Mid-term (5-10 years) 41,610 5% 32,316 4% Long-term (10-20 years) 50,605 6% 38,513 4%
Jackson County, MO Baseline 71,738 8% 47,834 5% Short-term (0-5 years) 77,733 9% 65,545 7% Mid-term (5-10 years) 78,898 9% 70,395 8% Long-term (10-20 years) 86,031 10% 75,160 8%
Johnson County, KS Baseline 29,056 3% 13,306 1% Short-term (0-5 years) 46,411 5% 41,254 5%

8 | Smart Moves 3.0 — Jobs Access Via Transit
Mid-term (5-10 years) 52,470 6% 45,463 5% Long-term (10-20 years) 68,259 8% 60,347 7%
Platte County, MO Baseline 22,729 3% 9,537 1% Short-term (0-5 years) 20,232 2% 10,053 1% Mid-term (5-10 years) 23,128 3% 11,935 1% Long-term (10-20 years) 19,217 2% 16,661 2%
Wyandotte County, KS Baseline 55,212 6% 27,360 3% Short-term (0-5 years) 63,191 7% 38,337 4% Mid-term (5-10 years) 79,384 9% 64,290 7% Long-term (10-20 years) 81,154 9% 65,400 7%
Note: Cass County results are modest because this plan recommends the addition of one route into Cass County (the Grandview/Belton Express), which currently does not have any transit service. Platte County results go up and down between the baseline, short, mid-, and long-terms, though service is improved over the course of Smart Moves 3.0 implementation. The dip between baseline and the short-term is explained by the fact that the portion of the North Oak route that goes to Zona Rosa was replaced with a route from Zona Rosa to Liberty on Barry Road, requiring a transfer to the high job density downtown. This does not change travel times that much, but it pushes some of the highest density blocks in the region from a travel time slightly below 60 minutes to slightly above. Although it’s a little bit to get to downtown, it’s a more connective network (i.e. better east-west connectivity). The dip between mid- and long-terms is explained by the fact that in the long-term, local service from downtown to KCI is replaced with express service. Under Smart Moves, access to the jobs located on Ambassador and that are currently served by the KCI route are envisioned to be provided by mobility services such as van pool, car pool and employee shuttles.
Environmental Justice Analysis Finally, the team used Transport Analyst to model access to jobs by transit for workers who live in environmental justice areas. Environmental Justice (EJ) is the concept that people of color and low-income populations are often disproportionately impacted by environmental conditions as well as being less likely to benefit from investments that affect quality of life. Investments in transit would fall into the latter category. In order to monitor the impact of a variety of actions on EJ communities, MARC has designated where EJ communities are located throughout the region. This was done by using demographic data from the U.S. Census Bureau/ American Community Survey (ACS) Five-Year Estimates. Benchmarks for both people of color and low-income populations were established in accordance with Federal Transit Administration (FTA) and Federal Highway Administration (FHWA) policy guidance on environmental justice. MARC defines EJ areas as census tracts where:
1. The proportion of minority populations in the tract is greater than the minority proportion of the overall MPO area (27.7%).
2. More than 20 percent of households are in poverty (based off the U.S. Census Bureau’s poverty thresholds).
Census tracts meeting one or both of these criteria are referred to as EJ areas or tracts.
In addition to EJ areas, the team also modeled access to jobs by transit for workers who live in racially/ethnically concentrated areas of poverty (R/ECAP). R/ECAP areas are census tracts where more than half the population is non-White and 40 percent or more of the population is in poverty or where the poverty rate is greater than three times the average poverty rate in the area.
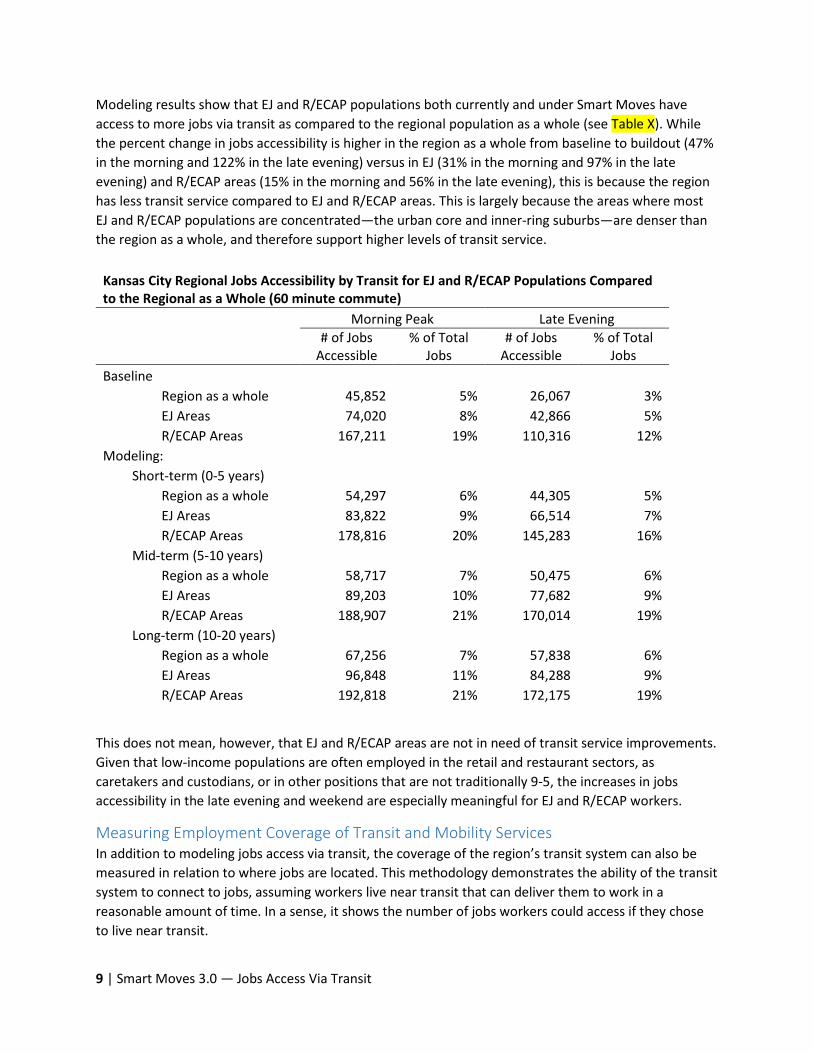
9 | Smart Moves 3.0 — Jobs Access Via Transit
Modeling results show that EJ and R/ECAP populations both currently and under Smart Moves have access to more jobs via transit as compared to the regional population as a whole (see Table X). While the percent change in jobs accessibility is higher in the region as a whole from baseline to buildout (47% in the morning and 122% in the late evening) versus in EJ (31% in the morning and 97% in the late evening) and R/ECAP areas (15% in the morning and 56% in the late evening), this is because the region has less transit service compared to EJ and R/ECAP areas. This is largely because the areas where most EJ and R/ECAP populations are concentrated—the urban core and inner-ring suburbs—are denser than the region as a whole, and therefore support higher levels of transit service.
Kansas City Regional Jobs Accessibility by Transit for EJ and R/ECAP Populations Compared to the Regional as a Whole (60 minute commute)
Morning Peak Late Evening
# of Jobs
Accessible % of Total
Jobs # of Jobs
Accessible % of Total
Jobs Baseline
Region as a whole 45,852 5% 26,067 3% EJ Areas 74,020 8% 42,866 5% R/ECAP Areas 167,211 19% 110,316 12%
Modeling: Short-term (0-5 years)
Region as a whole 54,297 6% 44,305 5% EJ Areas 83,822 9% 66,514 7% R/ECAP Areas 178,816 20% 145,283 16%
Mid-term (5-10 years) Region as a whole 58,717 7% 50,475 6% EJ Areas 89,203 10% 77,682 9% R/ECAP Areas 188,907 21% 170,014 19%
Long-term (10-20 years) Region as a whole 67,256 7% 57,838 6% EJ Areas 96,848 11% 84,288 9% R/ECAP Areas 192,818 21% 172,175 19%
This does not mean, however, that EJ and R/ECAP areas are not in need of transit service improvements. Given that low-income populations are often employed in the retail and restaurant sectors, as caretakers and custodians, or in other positions that are not traditionally 9-5, the increases in jobs accessibility in the late evening and weekend are especially meaningful for EJ and R/ECAP workers.
Measuring Employment Coverage of Transit and Mobility Services In addition to modeling jobs access via transit, the coverage of the region’s transit system can also be measured in relation to where jobs are located. This methodology demonstrates the ability of the transit system to connect to jobs, assuming workers live near transit that can deliver them to work in a reasonable amount of time. In a sense, it shows the number of jobs workers could access if they chose to live near transit.

10 | Smart Moves 3.0 — Jobs Access Via Transit
Methodology First, coverage of the current transit system was measured by creating quarter-mile buffers around all transit stops and then measuring the number of jobs within those buffers. Next, it was assumed that new routes would have transit stops located every quarter mile, although further route planning will be required to determine exactly where they will be located along each route. Finally, jobs located within half a mile of planned mobility hubs were measured, with the rationale that transportation options available at mobility hubs will provide a larger reach.
Results Table X shows results for jobs coverage for both the current transit system as well as the future system under this plan, in addition to the jobs coverage offered by planned mobility hubs.
Geographic Proximity of Jobs to Transit System # of Jobs % Total Employment (Urbanized Area) 901,257 100%
Employment within 1/4-mile of existing stops 469,337 52% Employment within 1/4-mile of proposed stops 525,469 58% Employment within 1/2-mile of mobility hubs 230,865 26% Source: 2010 Census Urbanized Area. MARC-edited LEHD 2014 employment data. Route, stop, and mobility hub data from KCATA and Consultant Team.
Of the over 900,000 jobs in the urbanized area, 52 percent are currently located within a quarter-mile of a transit stop. Adding the routes proposed in this plan, would result in 58 percent of existing jobs within a quarter-mile of transit and 26 percent of jobs within a half-mile of planned mobility hubs. Given that this plan makes recommendations that seek to attract more employers to areas around transit, these percentages will hopefully be even higher. These results indicate that increased density of development (residential and commercial) around transit stops and mobility hubs, a recommendation included in this plan, will offer workers more opportunities to locate close to transit and have access to more jobs.
Figure 14: Geographic Proximity of Jobs to Transit System

1 | Smart Moves 3.0 — Defining the Smart Moves System
VI. Defining the Smart Moves 3.0 System The Smart Moves 3.0 plan calls for strategic deployment of fixed-route transit and mobility services supported by a framework of mobility hubs. These hubs facilitate connections between modes and are places where the region can focus mixed-use development and redevelopment. The major components of the plan, which together comprise the Smart Moves 3.0 system, are explained here in detail. Specifically, this section discusses those elements that constitute significant capital investments.
Mobility Hubs and Services Under the Smart Moves 3.0 planning effort, the notion of activity nodes and transit centers has transformed into a more integrated concept that serves as a foundational component of the region’s transportation network — mobility hubs.
Mobility hubs are central places or districts that act as converging points for public transit and an integrated suite of mobility services, scaled for their respective environments and functions. Mobility hubs are also areas where there is an intensive concentration of working, living, shopping and/or playing in the form of mixed-use development. Mobility hubs serve three critical roles in the new Smart Moves 3.0 system: origin, destination and transfer point.
The Smart Moves plan includes more than 65 potential locations for mobility hubs dispersed throughout the region. The development of each hub will be driven by a local process and will align with the vision and goals of the community where it is located. Mobility hubs are proposed along current and future transit lines, based on the mobility hub categories generally defined below. In conjunction with the underlying network of transit services, these hubs can provide opportunities to complement, organize and strengthen the region’s long-term economic development and community growth ideals through focused local land-use planning and eventual increased residential and job densities in the areas surrounding these locations, i.e. Transit-Oriented Development (TOD).
Smart Moves 3.0 System Elements
• Mobility Hubs • Fixed-Route Transit Network • Mobility Services • Biking and Walking • Technology • Economic Development • Performance Measures

2 | Smart Moves 3.0 — Defining the Smart Moves System
Kansas City Mobility Hub Typologies and Conceptual Locations Planning and implementing mobility hubs will require input and involvement of numerous municipalities, agencies and stakeholders across the Kansas City metropolitan area, as well as in-depth analysis and development of a program specifically tailored to community needs and goals.
Broadly, Smart Moves 3.0 recommendations are intended to provide a starting point in the planning of mobility hubs. Example typologies, characteristics and criteria for how mobility hubs might function, and their anticipated role in the Kansas City metropolitan area, are provided below. Each of the following four typologies of mobility hubs serves a slightly different purpose:
• Destinations — A Destination mobility hub will typically have the most transit routes, service choices and amenities available. This type should be placed along existing or proposed high-frequency transit routes, and will most likely be located in densely populated locations within the Kansas City metropolitan area and along major transportation spines. These locations are also most likely to be integrated into a transit-supportive or transit-oriented development pattern, where a mixture of uses is available either directly surrounding the hub location or in the immediate vicinity. Example: Union Station.
• Junctions — A Junction mobility hub will typically be placed at connections between two or more transit routes. Some of these are likely to be at locations where high-frequency transit service connects with lower-frequency service routes, while others may be located where lower-frequency transit routes intersect. These locations can provide opportunities for riders to make direct connections between transit routes or switch to other modes to complete their trips. Junctions can be integrated into transit-supportive or transit-oriented development patterns where existing densities and development interest warrant them. Example: Johnson County Community College.
• Gateways — A Gateway mobility hub is typically located near the end of a higher-frequency transit route, furthest away from the urban core. These hubs are classified by their ability to serve as gateways for riders to enter the regional transportation system. These locations may be located in suburban or rural areas with lower densities, but will still incorporate transit-supportive design

3 | Smart Moves 3.0 — Defining the Smart Moves System
elements to facilitate mode transfers and create activity centers that are appropriately scaled for their particular context. These hubs are expected to offer a different, less-intensive package of amenities than more centrally-located mobility hubs, including park-and-ride lots. Example: Lenexa City Center.
• Local — Local mobility hubs will provide opportunities for areas located on the outer fringes of the metropolitan area that are not specifically served by the regional transportation plan’s proposed transit routes. These hubs can serve several functions, including as a portal into the regional transit system (like a Gateway Hub), albeit not necessarily connected to a transit route. In this case, the hub can become a convenient gathering place for carpool or vanpool riders, or can provide a meeting place for those sharing rides via shuttles or other on-demand services. Example: Downtown Gardner, Kansas.
Using these four typologies, the following maps show conceptual locations that illustrate this potential network of mobility hubs.
Figure 15: Conceptual Locations of Mobility Hubs

4 | Smart Moves 3.0 — Defining the Smart Moves System
Mobility Hub Amenities and Services Mobility hubs can provide a range of amenities and features. These can vary from location to location based on factors such as the types of transit routes and services being offered, the anticipated ridership and length of stay for users, adjacent services, relationships with surrounding land uses, and the types of connections being provided. Mobility hubs are customizable, and do not necessarily require major property acquisition or infrastructure investment.
A preliminary list of amenities and services that could be considered at a mobility hub includes:
• Wi-Fi / technology connections • Interactive kiosks / transportation service information • Surrounding area information + map • Transit branding signage / station + route identification • Real-time arrival signage • Area + pedestrian lighting • Transit shelter • Fare collection system • Bicycle amenities (bike-share, bike racks/lockers, bike repair
station) • Pedestrian sidewalk and trail connections • Pedestrian amenities (seating, trash receptacle, power outlets) • Parking area (park and ride) • Electric vehicle charging station • Vehicular drop-off / pick-up area (carpool, vanpool, on-
demand, park and ride, taxi stands) • Integrated services (retail, child care facility, post office) • Lighting and safety measures • Nearby community amenities (area park, amphitheater,
farmer’s market)
As pointed out above, analysis will be needed to determine the range of amenities and services to be provided at each mobility hub location. However, as new mobility hubs are developed, providing accessibility for all should be considered as a primary concern. Providing ADA-accessible facilities and amenities, including but not limited to ADA-compliant ramps, shaded waiting areas, and wayfinding signage that can be understood by vision-impaired individuals, should be integrated into all new mobility hubs. As funding allows, existing mobility hubs should be retrofitted to provide these amenities as well.
Mobility hubs offer great opportunities to connect various transit services. For example, one hurdle to carpooling is the passenger expectation that the driver will provide door-to-door service. Passengers who are willing to use another mode of travel for a segment of their trip may be more likely to find a carpool match. Mobility Hubs, especially Destination Hubs with fast and frequent transit connections and bike-share stations are an excellent place to begin or end a carpool (or vanpool) trip. As hubs are developed they will be added to the RideshareKC website along with available amenities.

5 | Smart Moves 3.0 — Defining the Smart Moves System
Fixed-Route Transit Services
Figure 16: Fast and Frequent and 30-Minute Service Map
Fixed-route transit remains the primary feature of Kansas City’s mobility network under Smart Moves 3.0. Routes will be categorized into one of four groups, depending on service frequency, service hours, operating characteristics, and capital amenities: fast and frequent, 30-minute, other local and express. In general, the principle motivating these recommendations is to make public transit time and cost competitive with the personal automobile, while also increasing the areas accessible by transit.

6 | Smart Moves 3.0 — Defining the Smart Moves System
Fast and Frequent Network The spine of the fixed-route network is focused in areas with robust existing ridership and high propensity for future ridership. Transit propensity is defined by high-density development, access to current and future jobs and socioeconomic characteristics (e.g., family size, household income, car ownership). These fast and frequent routes will provide the majority of the trips in the region and will connect riders to other services in the fixed-route and mobility service network.
Figure 17: Fast and Frequent Network Characteristics
Service Frequency
At full implementation, typical service on the Fast and Frequent Network will operate at a minimum 15-minute frequency interval. Night and weekend service will likely have lower frequency based on demand, to be determined on a route-by-route basis. This approach will bring more choice riders to the system by reducing wait and travel times.
Service Hours Consistent with the level of demand, the Fast and Frequent Network will have expanded service hours, with at least 18 hours of service daily (5 a.m. to 11 p.m.) at full implementation.
Operating Characteristics
To meet the demands of Fast and Frequent service, these routes will be optimized based on corridor conditions. Lines operating on high-demand corridors may require fixed guideways, dedicated rights-of-way, or traffic signal priority to maintain schedule adherence. In moderate-demand corridors, more passive approaches to signal priority and peak-hour guideways (such as the current approach to the Main Street MAX) will accommodate schedule adherence. In low-demand corridors, mixed-traffic operations will accommodate schedule adherence and provide times that are competitive with automobiles. In some cases, transit stops will be further apart than they are for less-frequent routes, which will allow the system to operate more quickly.
Capital Amenities
With the majority of transit trips in the region occurring on the Fast and Frequent Network, capital budgets should be focused on these routes. Amenities could include low-floor transit vehicles, higher capacity transit stops, interactive kiosks, enhanced lighting and public art.
Operation Mode Streetcar, BRT
30-Minute Network The SmartMoves 3.0 plan proposes investing in transit lines throughout the region that connect with the Fast and Frequent network, and fill in the gaps of that network. These lines serve as cross-regional routes, providing regional mobility and opportunities for job access. Typically, transit propensity along these routes is lower than along the Fast and Frequent network, and the recommended service is adjusted accordingly.

7 | Smart Moves 3.0 — Defining the Smart Moves System
Figure 18: 30-Minute Network Characteristics
Service Frequency
At full implementation, lines will operate with 30-minute headways all day, providing connections at mobility hubs with the Fast and Frequent Network and Express Network. This frequency will create benchmarks for transition into the Fast and Frequent Network. Frequency may be reduced in off-peak periods based on demand.
Service Hours To meet the needs of regional transit users, this network will provide at least 18 hours of service daily (5 a.m. to 11 p.m.) at full implementation.
Operating Characteristics
Lines will operate in mixed traffic conditions, with no signal priority or other technology enhancements to support schedule adherence. Stops will be spaced according to KCATA’s service guidelines, consistent with an urban line-haul transit line to allow users to arrive close to their end destination.
Capital Amenities Transit stop amenities should be consistent with KCATA’s adopted bus stop guidelines. Amenities such as benches and shelters will be provided at key locations based on ridership.
Operation Mode Enhanced bus
Local Network While the focus of Smart Moves 3.0 is interjurisdictional transit, local-serving community-based transit plays an important role in connecting riders with the regional network, as well as providing access to local amenities. Acknowledging local funding limitations, Smart Moves 3.0 recommends that existing local networks be expanded to serve the needs of residents, including enhanced service frequencies, duration, and supporting infrastructure as determined by local communities. Establishing new Local Network mobility options, likely to be limited to fixed-route transit and demand response, should be considered by communities that are unlikely to receive high levels of fixed-route transit from KCATA due to their location in the region. Communities interested in new Local Network services should consider efficient ways to connect to the regional network.
Service Frequency
Frequency, hours of operation, operating characteristics and level of capital investment to be determined by local jurisdictions on a case-by-case basis.
Service Hours
Operating Characteristics
Capital Amenities
Operation Mode Fixed-route transit and demand response

8 | Smart Moves 3.0 — Defining the Smart Moves System
Express Network The Smart Moves 3.0 plan proposes expanding the existing commuter-based long distance network to provide more opportunities for connecting travelers throughout the region. This express network will expand the regional reach of the RideKC Transit network and bring more users into the family of services.
Figure 19: Express Network Map

9 | Smart Moves 3.0 — Defining the Smart Moves System
Figure 20: Express Network Characteristics
Service Frequency
The Express Network will focus on peak-hour service, with a long-term goal of 30-minute headways during peak hours, where demand exists. During off-peak hours, including lower-demand reverse commute services, the frequency will be reduced to meet demand — in most corridors, the frequency will be 60 minutes.
Service Hours To open the Express Network to those who work non-peak schedules, this service will have expanded service hours, with 18 hours of service daily (5 a.m. to 11 p.m.) at full implementation, where demand exists.
Operating Characteristics
To meet the demands of the Express Network, these lines will be optimized based on their corridor conditions. Lines operating on heavily traveled corridors may require fixed guideways, dedicated rights-of-way, or traffic signal priority to facilitate service operation and to maintain schedule adherence. This approach may include commuter rail or other rail options, bus-on-shoulder or bus-plus-high-occupancy-vehicle lanes. Highway amenities that allow transit vehicles to easily access transit stops, such as slip ramps, will be considered. In moderately traveled corridors, more passive approaches to signal preference and priority and peak-hour guideways will be considered. In lower-demand corridors, mixed traffic operations will still allow for time competitiveness with automobiles and schedule adherence. Transit stops will be spaced at greater distances to allow for express service, with some intermediate stops to allow users to connect with the remainder of the network.
Capital Amenities Capital amenities may include vehicles that provide more rider comfort, as well as park-and-ride lots.
Operation Mode Enhanced Bus, over-the-road coaches, commuter rail

10 | Smart Moves 3.0 — Defining the Smart Moves System
RideKC Freedom and Other Paratransit
RideKC Freedom is the umbrella name for the ADA-complementary and non-ADA paratransit services offered by KCTATA in the Kansas City metropolitan area. RideKC Freedom seeks to provide services to each of those two service categories while also subsidizing those trips through the usage of the Freedom On-Demand service by the general public.
As transit service evolves and expands in the Kansas City region, Smart Moves 3.0 recommends that the needs of older adults, veterans, individuals with disabilities, and low-income individuals and families should be prioritized in the transportation planning process. While special transportation services tend to be more expensive to provide than standard transportation services, new models should continue to be explored to bring costs down and enable more service provision.
These models may include regional mobility management strategies that facilitate coordination between partners or service providers to expand the usability of regional services. Information referral services and streamlined trip reservation processes can greatly advantage ADA and non-ADA paratransit users. Additionally, new paratransit services that go above and beyond the requirements of ADA to provide service beyond three-quarters of a mile of a transit line, or across jurisdictional boundaries, should be pursued. Projects that fill in gaps in the service network, both in terms of geographical coverage and hours of availability, should also be undertaken.
Mobility Services A critical component of the SmartMoves 3.0 plan is an integrated, supportive system of mobility options that will facilitate first- and last-mile travel, as well as travel in places which, for reasons of population or geographic density, cannot support traditional fixed-route transit services. This is especially important in those areas where development is at a low-to-medium density, or lack of transit destinations makes fixed-route service inefficient. These services offer more flexibility than buses for both the end-user and for funders, and can expand the “reach” of traditional fixed-route services.
Mobility Services integrate directly with mobility hubs. Individuals may use mobility hub amenities such as park and rides as rendezvous points for group trips in carpools, vanpools, or employer shuttles. Individuals who use transit to access mobility hubs can then, upon arrival, use other services such as transportation network companies, carsharing, bikesharing, taxis, or microtransit as a first or last mile connection to work or home. By encouraging this kind of activity at mobility hubs, mobility services can achieve economies of scale in places that may not have previously been able to supply adequate demand, and businesses and residents located at mobility hubs benefit from the enhanced activity levels and mobility options.
Carpool Carpooling will support users who either cannot access the transit network, or simply prefer the flexibility and benefits of carpooling. This strategy can potentially reduce the number of single-occupancy vehicles (SOVs) on the road, particularly during peak hours, and reduce commuting costs for participants by filling the latent capacity in existing SOVs.
Successful ride-matching is aided by a robust database of users such as the one maintained and operated by the MARC-administered RideShareKC program. Carpooling can be encouraged by employer incentives, commuter challenges, HOV/HOT lanes, and parking policies that encourage ridesharing and

11 | Smart Moves 3.0 — Defining the Smart Moves System
other alternatives and discourage SOV driving. Communication strategies that direct potential users to regional carpool and vanpool websites will continue to be developed to build the critical mass of participants needed to ensure successful matches.
Vanpool Vanpooling is similar to carpooling in its purpose, but it is slightly more structured in its delivery. KCATA, through the RideKC Van service, links groups of workers with vanpool services. Vanpool members pay an affordable, monthly fare, based on the cost of operating the van. Vehicles include 7, 8 and 12-passenger vans. Additionally, the service provides a driver approval process to ensure safe commuting. MARC and KCATA will work with employers and municipal partners to facilitate the expansion of vanpooling throughout the Kansas City region.
Carshare The growth of car-share opportunities in the region will allow more individuals and families to consider exploring a “car-light” lifestyle, relying on transit, walking or biking for the majority of their needs while knowing they can easily access a car if needed. Car-sharing facilitates affordable midday travel for transit users who may need to complete trips too long for biking or walking, but don’t have a personal vehicle. These types of services can increase transit usage by providing solutions for those transportation problems. Smart Moves 3.0 recommends that municipal governments adopt car-share-friendly policies as an important step toward encouraging multimodal lifestyles. Partnering with private carshare providers may provide opportunities to leverage these opportunities.
Employer Shuttles In addition to carpooling and vanpooling, the Smart Moves 3.0 plan calls for programming that supports employers who choose to transport employees via employer shuttles. In general, employer shuttles should be implemented wherever congestion or capacity prevents easy access to large institutions such as hospitals, schools, events centers and other large employers. Employees benefit from shuttle service because they do not need to use their cars each time they need to take short trips from place to place within their neighborhood or campus; employer shuttles facilitate the “park once” model. Employer shuttles are frequently organized independent of transit agencies, but future integration with those systems, at mobility hubs or elsewhere, could be advantageous for everyone involved. Transportation Management Associations The principles behind Transportation Management Associations (TMAs) are similar to the principles behind Employer Shuttles, but with a service population beyond a single employer. TMAs enable a concentration of businesses, such as hotels and event centers, to provide transportation services to clients, visitors and employees. As a draw for tourism, and as a way to bring workers to employment areas that may be difficult to access, TMAs can offer effective and reliable solutions in relatively quick time frames. MARC staff will work with local groups to provide support for establishing TMAs when they are deemed appropriate by market and demographic research, particularly in proximity to mobility hubs.
Transit Pass Programs Smart Moves 3.0 recommends the continued expansion of transit pass programs in the Kansas City region, replicating, tailoring, and improving upon best practices being undertaken by peer transit agencies such as RTD in Denver and MetroTransit in Minneapolis. In particular, transit passes should be pursued as a way to provide affordable transportation for students, low-income employees,

12 | Smart Moves 3.0 — Defining the Smart Moves System
neighborhood organizations (particularly in environmental justice areas), and human services providers. Because transit passes can increase convenience and affordability for riders, it can be an effective strategy for bringing new riders into the transit system.
Ride-hailing / Demand Responsive Services Ride-hailing and Demand Responsive Services will provide private market support — potentially through public/private partnerships (PPP) where appropriate — for the publicly funded fixed-route transit services outlined previously in this section, as well as the Smart Moves 3.0 system at large. Ride-hailing and demand responsive services are diverse in their delivery, but share certain characteristics that make them unique from other types of mobility services. Generally, these services provide one-way trips to users who summon or “hail” the service via phone or mobile app to their present location, in contrast with the car-share or bike-share models (described below) whose service delivery platforms and characteristics are quite different.
Transportation Network Companies Transportation Network Companies (TNCs) such as Uber, Lyft and SilverRides will continue to operate throughout the region, connecting users to destinations and connection points, such as those at mobility hubs. Around the country, transit agencies are partnering with these technology companies to provide connections to and from transit lines. Centennial, Colorado, for example, has partnered with Lyft to provide free trips to and from a light rail station area for city residents, a program that seeks to address the community’s first-mile/last-mile connection problem.1 This model could easily be adapted to supplement the mobility hub model. As local agencies begin to see benefits from the Fast and Frequent and Express networks in particular, they may seek similar arrangements to facilitate access to these amenities.
RideKC Freedom On-demand While the focus of the RideKC Freedom program is to provide ADA and non-ADA paratransit services to individuals with disabilities and older adults, it now also encompasses non-ADA on-demand services available for the general public. RideKC Freedom On-Demand provides an opportunity for community members to support ADA and non-ADA paratransit by choosing to subsidize those trips with their fare. As the fixed-route network expands in length and service hours, providing consistent ADA-paratransit services will need to be evaluated and addressed, as required by the FTA. In addition, the non-ADA paratransit network provides an essential service to those in need of enhanced mobility and special transit services in the Kansas City metropolitan area. Continued investment and expansion, where needed, through the use of community transit providers, KCATA and social services entities, is recommended.
Flex The Flex service, operated by KCATA, will continue to be implemented in communities with relatively low levels of local transit service, to provide baseline mobility options. Beyond partnering with private-sector mobility providers, such as TNCs, Flex service can provide affordable levels of connectivity for older adults and individuals with disabilities, and even the general public depending on the eligibility determinations and funding of each program.
1 http://www.denverpost.com/2016/08/15/lyft-centennial-team-up-for-free-rides-light-rail-station/

13 | Smart Moves 3.0 — Defining the Smart Moves System
Taxis Private taxi services are unique in their flexibility and reliability. Smart Moves 3.0 takes the unique approach of partnering with these services (instead of competing with them) to provide the best service possible for all users, regardless of mode preference. To the extent that these partnerships may be used to enhance mobility for older adults, individuals with disabilities, veterans, students, and low-income individuals and families, or to provide first/last-mile connections for all users, necessary steps should be taken to do so.
Microtransit In 2016, KCATA piloted microtransit services in partnership with Bridj and gleaned invaluable experience from that process. While this service was not adopted into the full KCATA program of services upon completion of the pilot project, future iterations of microtransit in Kansas City will benefit from its undertaking, and the lessons learned from the process in general.
Microtransit may be used to connect high-activity centers or mobility hubs, and enable users to travel easily between them on more flexible schedules (and pick-up/drop-off locations) than traditional transit. Vehicles are typically equipped with Wi-Fi devices, and other amenities, which may be appealing to those who need or want more on-board amenities than what traditional transit offers.
Biking and Walking The Smart Moves 3.0 plan recommends making transit more accessible in more areas throughout the Kansas City area, so it is important to ensure that riders can make their way safely and efficiently to and from transit stops and mobility hubs using active modes of transportation. Biking and walking are cheaper, healthier and more widely accessible than some of the other more technology-intensive mobility options detailed in this section. By making active transportation an easy choice for users, the Smart Moves 3.0 network becomes all the more accessible, efficient, and effective.
Bikeshare and Bike Infrastructure The Smart Moves 3.0 plan recommends that the regional bike-share program grow to include more stations throughout the region. Bike-share stations should also be considered at first/last-mile locations close to major employers as a method of making the final connection from transit routes. This plan also recommends addressing structural barriers to bicycling by constructing additional bike racks, protected bicycle lanes, multi-purpose trails, and other amenities that encourage and facilitate bicycle use as a first- and last-mile connection where bike-share is infeasible or inappropriate.
Pedestrian Trails, sidewalks and other infrastructure and amenities that support walking as a healthy and active form of transportation and recreation should continue to be planned and built throughout the region. In particular, mobility hubs and surrounding areas should be particularly robust in their provisions for pedestrians and their safety. MARC staff will aid communities in updating public works standards and capital improvement plans to support the development of this critical infrastructure.

14 | Smart Moves 3.0 — Defining the Smart Moves System
Technology Mobile Software Applications (Apps) Apps that enable mobile ticketing (an app-based payment for trips that requires no direct currency exchange between the passenger and driver) have the potential to accelerate the boarding/alighting process, which is particularly appealing for mass transit. Apps of this variety are already being implemented in large metro areas such as Chicago, Los Angeles and New York, and the costs of adopting this technology in wholesale fashion are fairly substantial. However, the rewards are significant as well, and the Smart Moves 3.0 plan recommends pursuing these options and other options that enhance mobility wherever possible. The RideKC App, for example, provides a platform to integrate different services under a single application, and should continue to be developed to provide these services.
Informational Kiosks One way to address the digital divide is by providing interactive, informational kiosks at critical junction points (e.g., mobility hubs). These digital kiosks currently enable users to track the real-time location of their ride and access information about destinations in the vicinity of the transit stop, which boosts economic activity. However, these kiosks are capable of much more.
There are currently 25 interactive kiosks in use along the RideKC Streetcar Line in Downtown Kansas City. These kiosks provide real-time arrival information, information about adjacent mobility options, and advertising for local businesses. Headphone jacks on each kiosk enable visually-impaired individuals to utilize the kiosks as well. Additionally, 311 services are accessible through these kiosks.
Potentially, these kiosks could enable a user to hail a cab/TNC, and pay for it at the kiosk while waiting for the ride to arrive. Kiosks could also track a wider range of mobility services, provide locations for adjacent bikeshare and carshare stations, and enable payment via a range of options (e.g., cash, credit, PayPal).
Informational kiosks could potentially become critical components of mobility hubs throughout the region by facilitating access to critical connections. The Smart Moves 3.0 plan recommends the integration of these kiosks wherever users are expected to transfer between multiple modes for first/last mile connections, or otherwise as needed.
Economic Development and Land Use Transit can be used as an effective tool for leveraging economic benefits. For instance, when economic incentives are provided for transit-oriented development, communities can create vibrant places with inviting public spaces and a mix of commercial and residential uses. Increasing density around transit stops and stations (including mobility hubs) has the potential to have an even larger impact on jobs accessibility than investment in new transit service alone. Attractive development around transit and mobility hubs will drive more businesses to these
Regional Local governments and transit agencies in the region can plan play an important role in encouraging employers to support the transportation of choices for their employees. The San Francisco Bay Area has a robust 511 program that includes road conditions, carpool, vanpool, transit, biking, walking and employer outreach. The 511 program works with employers to evaluate employee travel patterns, identify commuter options that would work best for their employees, market the opportunities to the entire workforce, and assist help the employer and employees with getting tax benefits. The program is extremely successful at long-lasting mode shifts. For more information: http://511.org/employers/services/overview

15 | Smart Moves 3.0 — Defining the Smart Moves System
areas, increasing the number of jobs in close proximity to transit and mobility services. This plan strives to attract employers and residential development to transit routes, especially to the areas around the fast and frequent transit network.
The Kansas City region has already seen how transit can generate economic benefits for a community. Bus Rapid Transit (BRT) has yielded increased private sector investment along Main Street and Troost Avenue as well as providing other community benefits such as placemaking and increased public safety. The Downtown Streetcar has also fostered substantial private sector investment in areas within close proximity to the route and its stations. Since April 2016, over 40 new development projects have been undertaken within the Transportation Development District (TDD) surrounding the existing streetcar line. This new development equates to over $1.7 billion in value thus far.2
Partnering with the local business community through Chambers of Commerce and Economic Development Councils will enable MARC and local community partners to guide development in ways that benefit both transit services and local communities. Strategies such as creating taxing districts such as Community Improvement Districts (CIDs) and Transportation Development Districts (TDDs) can generate funding for transit and mobility services on the local level. Additionally, development incentives like direct subsidies, density bonuses, property tax abatements, permit fee waivers, expedited project reviews, public infrastructure investments, and tax credits can incentivize particular kinds of development.
Targeted Development at Mobility Hubs and Along Key Corridors
Mobility hubs will offer opportunities for future transit-supportive development. These opportunities will vary among the four hub types (as outlined earlier) with those located in densely populated areas providing the best opportunities for new ancillary economic development benefits. The Destination and Junction mobility hub types will generally lend themselves to more opportunities for integrated land use strategies.
Transit and mobility services perform best when supported by sufficient employment and population density. One way to facilitate these levels of support is to focus development energy along existing and planned transit routes and mobility hubs, or, in areas where this is not possible, enabling quick and reliable first- and last-mile connections to transit lines or mobility hubs from places of employment or residences. SmartMoves 3.0 offers planning, design and economic development strategies to support this concept.
Planning and Design Planning and design entails the process by which decisions are made about the form of the urban environment, and how different pieces within that environment are meant to interact with each other. It may seem that making recommendations about the forms of buildings is beyond the scope of a transit plan, but it is in fact a critical component. A building that promotes active transportation and transit usage offers more choices than one that facilitates only the use of the personal automobile. Beyond just buildings, however, the planning and design of the entire built environment, including elements such as streetscapes, parks, lighting, signage and drainage, are critical to creating safe and vibrant communities.
2 RideKC Streetcar website – Economic Development: http://kcstreetcar.org/route/economic-development-2

16 | Smart Moves 3.0 — Defining the Smart Moves System
Determinations for urban form and design will inevitably vary from one community to another and from one mobility hub to another, and should be determined in part through a robust public engagement process. Impending transit expansion is not in of itself a necessary precondition for a community to pursue “transit-ready” planning and design elements. Communities can expand transportation options for their residents by reviewing existing land use plans within a half-mile radius of transit routes and one-mile radius around existing or proposed mobility hubs and, where appropriate update planning documents and public works standards to include corridor-centric, mixed-use development policies. Additionally, Complete Streets principles should be implemented to accommodate all modes of transportation and beautify the public realm, creating safe and sustainable social and economic activity.
Zoning Zoning is a process by which state-authorized entities (municipalities and counties) formalize land-use principles for specific geographies, including densities, usage types (e.g., industrial, residential, commercial), access requirements and regulations pertaining to buildings, including numbers, types, heights, and forms. City and county planning staff review all development proposals according for compliance with adopted zoning codes, which reflect the community’s perception of acceptable use for each particular property.
The SmartMoves 3.0 plan recommends that local communities develop transit-oriented overlay districts or zones in a half-mile radius around existing and planned mobility hubs and other major activity centers along transit corridors to allow for higher densities and a mix of uses. This will allow communities to consider, during the development process, how well proposed projects accommodate transit. Where feasible, form-based codes should be implemented to retain community character while achieving desired, transit-supportive built-environment outcomes.
Parking In general, parking policies are meant to provide space for the maximum amount of single-occupancy vehicles that might be expected to use a certain property at any given time. Land that is paved and striped for a parked vehicle which is not there for a majority of the time (e.g., at the edges of a mall or grocery store parking lot) cannot be used for other revenue-producing purposes.
SmartMoves 3.0 recommends a host of strategies to reduce parking requirements, particularly around transit-oriented and transit-supportive developments, such as reducing parking requirements within a half-mile radius of transit routes and within a one-mile radius around mobility hubs, and implementing parking “maximums” around transit-oriented development and transit routes. The focus is to drive development, not cars, toward transit routes in order to bolster the success of those routes, and reduce the amount of space dedicated to personal vehicles as a proportion of all land use.
Housing While traditional zoning often separated the places where we live from where we work, there has been a strong shift toward mixed-use development in recent years. Places where people can live and work in relatively close proximity tend to be more active and vibrant than those with more homogenous land-uses. With that in mind, SmartMoves 3.0 recommends promoting housing density near transit routes and mobility hubs with a mix of market-rate and affordable housing units. Increased choices in housing and transportation will increase transit ridership, improve job access and reduce the need for personal vehicles.
17 | Smart Moves 3.0 — Defining the Smart Moves System
Performance Measures To measure progress in implementing the Smart Moves 3.0 system, MARC will be responsible for tracking the degree to which this plan’s goals have been fulfilled. All of the components described in this section, and all of the strategies and recommendations outlined in the following section, are designed to further the Smart Moves 3.0 vision: “Smart Moves imagines a Kansas City region with viable mobility solutions for empowered residents, successful businesses and vibrant communities.”
Jobs Accessibility Metrics:
• Number of jobs accessible by transit by the average worker in the MARC urbanized area. • Employment within a half-mile of mobility hubs and quarter-mile of transit routes
Improving jobs accessibility is a primary objective of this plan. Travel models will be repeated periodically to measure progress, and MARC will also monitor public perception of jobs accessibility to evaluate how changes in fixed-route transit and mobility services have impacted accessibility to employment. Geographic Information Systems (GIS) will also be used to track employment coverage of the transit and mobility hub system. Additionally, land use changes (such as the development of a mobility hub) will be reviewed for their impact on jobs accessibility.
Ridership Metric:
• Annual transit and mobility service ridership Although access to jobs by transit may increase, this does not necessarily ensure that more people will ride transit. MARC will monitor changes in ridership, taking into account externalities such as shifting gas prices and other economic factors. Increased ridership – both on traditional fixed-route transit and other mobility services – may suggest that the increased coverage of transit services has succeeded in filling a missing gap in the transportation network.
Land Use Metric:
• Population and employment density within a half-mile of mobility hubs and quarter-mile of routes, changes in property values, number and value of permits pulled.
This plan calls for strategic land use investment to drive activity towards the transit network. Using GIS and other sources, MARC will track development changes within a quarter-mile of fast and frequent and supporting transit routes as well as within a half-mile of mobility hubs.
Technology Metric:
• New technology systems implemented • Number of locations impacted • Number of new users per year
Changes in technology used to access and provide information about transit and mobility services will be tracked; their impacts may be difficult to quantify, but MARC will gather available data on usage. New

18 | Smart Moves 3.0 — Defining the Smart Moves System
technology systems to be tracked may include off-board payment options, transit vehicle tracking technology, and the addition of smart kiosks at mobility hubs.
Funding Metric:
• Annual amount of private sector funding supporting transit and mobility services. • Annual amount of public funding supporting transit and mobility service.
Additional funding is critical to implement many of the recommendations in this plan. MARC will document any changes to how the region funds transit as well as any new funding sources or additional funding that transit agencies, mobility service providers and local governments are able to obtain to provide service upgrades and investments in and around transit corridors and mobility hubs.
Greenhouse Gas Emissions Metric:
• Change in volatile organic compounds (VOCs) and nitrogen oxide emissions • Change in vehicle miles traveled.
Along with increasing jobs access via transit and focusing development along transit corridors and at mobility hubs, this plan has the potential added benefit of decreasing vehicle miles traveled (VMT), and therefore reducing greenhouse gas emissions. The region’s Congestion Mitigation and Air Quality (CMAQ) program will closely monitor changes in these emissions.
1 | Smart Moves 3.0 — Strategies & Recommendations
VII. Strategies & Recommendations This section describes the strategies and recommendations, including specific actions and responsibilities, for the Smart Moves 3.0 Plan.
Strategies The strategies described below call for transit providers, local governments, MARC and others to work together toward the creation of a transit and mobility system that works for all. This iteration of Smart Moves has a special focus on jobs access via transit (see Section V). In addition to supporting mobility for other purposes, the following strategies directly address how transit improvements can help workers access more jobs.
Strategy 1: Advance Mobility Innovations: Foster service innovations and technology that expand transit options and provide easier access. Technology will shape the future landscape in ways that we can only begin to anticipate. This strategy addresses technological and innovative transportation applications such as interactive kiosks at mobility hubs, smart phone apps, on-demand services, automation and Transportation Management Associations.
Strategy 2: Create a Network of Mobility Hubs: Establish mobility hubs across the region at locations where a variety of transit and mobility services come together. Mobility hubs are one of the key new innovations introduced in this plan. Mobility hubs are physical locations where transportation modes come together and allow for easy transfer. A mobility hub in a dense urban location might be comprised of multiple bus lines that intersect, a bike share station, and a robust pedestrian network. A hub located in a small town in a suburban location might have a Park-and-Ride lot that serves as a meet-up location for vanpools and is also the terminus of an express bus line. The Smart Moves planning team has identified locations that already have some hub elements as near-term priorities.
Strategy 3: Enable Vibrant Places: Support placemaking through zoning, planning and other local development strategies that integrate with transit and mobility services. Vibrant places offer a mix of amenities, including housing and transportation choices, with inviting public spaces and easy access to jobs and other destinations. Local governments can take actions that help enable vibrant places to emerge through planning and zoning efforts that encourage walkability, bikeability, and a mix of uses. Smart Moves contains strategies to help people travel across the metro to urban and suburban job locations, but it also seeks to encourage smart land use that can bring employment opportunities closer to where people live and recreation closer to where people play.
Strategy 4: Focus on High-Demand Corridors: Improve service on key corridors with existing or projected high travel demand, adding new transit routes and adjusting existing ones. This strategy recognizes that traditional, fixed-route transit service cannot be provided in a cost-effective manner everywhere in the region. This plan includes recommendations that address fixed-route service on the high-demand “spine” of the region’s transit network (where service is planned for

2 | Smart Moves 3.0 — Strategies & Recommendations
every 15 minutes or less). This service is envisioned to be supplemented by 30-minute (supporting) transit service, key express routes geared toward commuters, as well as and local transit service.
Strategy 5: Build Broad Partnerships: Engage employers, developers, nonprofit organizations and transit users to implement the strategies envisioned in this plan. In order to transform the region’s transit and mobility system, partnerships are needed across sectors. Transit service is typically provided by public agencies, while mobility services are often operated by private companies or nonprofits. Employers and developers are also key stakeholders. The coordination of all of these entities will be crucial to implementing transportation solutions that work for the region.
Recommendations The following recommendations cover traditional fixed-route service, paratransit, mobility hubs and mobility services, along with related recommendations for local government actions and economic development. Fixed-route and mobility hub recommendations are broken down by phase for the purpose of implementation. All other recommendations are meant to be implemented in the first five years after plan adoption.
Fixed Route and Paratransit This plan calls for a transit system made up of fast and frequent (15-minute) service, supporting (30-minute) service, express routes, local routes and paratransit. Under Smart Moves 3.0, transit service is envisioned for more hours of the day and more days of the week. Transit service should increase and evolve over time given the right combination of supportive land use, density and demand.
Appendix A identifies fixed-route and required paratransit services recommended for implementation over the next 20 years, broken out in three phases.
Recommendation FP-1: Implement fixed route service improvements.
Smart Moves 3.0 recommends fixed-route improvements in three phases: short-term (0-5 years), mid-term (5-10 years) and long-term (10-20 years). Fixed-route recommendations build on each other with incremental increases in service frequency and hours, as well as the addition of new or extended routes.
Applies to: Fixed routes
Responsibility: Transit providers
Potential Partners: MARC
How to Implement: Transit providers will work with local governments to plan for and fund service expansion. Transit providers will also likely seek federal funding when appropriate (see Section VIII). MARC will continually assist in coordination of regional priorities. See Section VII for detailed implementation steps including how transit projects were assigned by phase.
Recommendation FP-2: Create a coordinated regional mobility management system in accordance with the RideKC Coordination Plan (2015).
Applies to: Fixed routes, paratransit, mobility management
Responsibility: Transit providers, service providers, local communities

3 | Smart Moves 3.0 — Strategies & Recommendations
Potential Partners: MARC, KCATA, service providers, nonprofits, local communities
How to Implement: Work already completed in this area includes creating a single eligibility standard for the region, creating and maintaining information referral services, and fostering partnerships between service providers and communities. Moving forward, partners should continue to facilitate coordination to expand the usability of regional services. Projects that seek to coordinate service between partners should be prioritized in the regional funding allocation process.
Recommendation FP-3: Focus on maintaining and expanding existing services for transit and paratransit.
The region should prioritize maintaining existing services and service levels while pursuing new funding sources for service expansions and new routes and other services.
Applies to: Where transit and paratransit service is operated
Responsibility: Transit and paratransit providers
Potential Partners: MARC, Mobility Advisory Committee (MAC), Regional Transit Coordinating Committee (RTCC)
How to Implement: For transit, pursue additional funds for service upgrades and new routes proposed in this plan. In terms of paratransit, account for and prioritize existing services and service providers in the scoring and programming processes for regional FTA Section 5310 funds.
Recommendation FP-4: Enhance the usability of existing paratransit operations by coordinating structural improvements.
Closing gaps in the transportation network for those with special transportation needs can be achieved by addressing factors that may prevent some users from using existing resources. For example, the region recently worked to create one eligibility mechanism.
Applies to: Paratransit, fixed routes, mobility management
Responsibility: Transit providers, service providers, nonprofits
Potential Partners: MARC, KCATA, service providers, nonprofits, communities
How to Implement: Although some ADA accessibility improvements have been made at bus stops, make sure that capital projects going forward include ADA accessibility.
Additionally, prioritize projects applying for FTA Section 5310 funds that close gaps through coordination or mobility management. For instance, broker reciprocity agreements between providers to better enable customers to use services across jurisdictional boundaries.
Recommendation FP-5: Support transit and paratransit services that are regional in nature.
Applies to: Transit and service providers
Responsibility: Transit providers, service providers, MARC

4 | Smart Moves 3.0 — Strategies & Recommendations
Potential Partners: MARC, KCATA, service providers, nonprofits, communities
How to Implement: While projects may be best piloted over smaller areas, such as the current RideKC Freedom pilot, the ultimate goal should be to expand useful and productive projects to regional scales in order to seamlessly cross jurisdictional boundaries. Projects that fill in gaps in the service network, both in terms of service characteristics (e.g. geographical coverage and hours of availability) and functionality (e.g. mobility management), should be pursued to the extent that people with mobility challenges are able to move with the same ease as others. Projects that accomplish this should be prioritized in the programming process for regional funding allocations.
Mobility Hubs and Services The mobility hubs recommended in this plan not only connect the fixed-route network, but also provide entry points to an array of mobility services such as ride share, car share, bike share, employer shuttles and microtransit.
Mobility Hubs This plan recommends more than 60 mobility hub locations. These mobility hubs can change over time, offering an expanded array of travel options as the surrounding supportive land uses and transit services grow. See Appendix A for a mobility hub list and map by phase and type.
Recommendation MH-1: Through the Planning Sustainable Places grant program, support planning and implementation work on potential mobility hubs.
Applies to: Mobility hubs
Responsibility: Local governments with assistance from MARC
Potential Partners: Transit providers
How to Implement: MARC will continue to encourage local governments and other entities to apply for PSP funding to pursue planning and other efforts around the implementation of mobility hubs. Currently, MARC has awarded funds to plan for mobility hubs in Leavenworth, southwest Johnson County, Overland Park (75th Street, College & Metcalf), and in South Kansas City.
Recommendation MH-2: Develop wayfinding and landmark signage for mobility hubs that will be deployed across the region.
Applies to: Mobility hubs
Responsibility: MARC and KCATA with assistance from local governments
Potential Partners: Mobility service providers
How to Implement: MARC and KCATA staff will collaborate with other stakeholders to create wayfinding and landmark signage for mobility hubs. This effort will be coordinated with wayfinding for the regional bikeway system, and other systems as necessary.
5 | Smart Moves 3.0 — Strategies & Recommendations
Recommendation MH-3: Create profiles of the mobility hubs that are most likely to be developed first for use by local governments, transit providers and developers.
Applies to: Mobility hubs
Responsibility: MARC and KCATA with assistance from local governments
Potential Partners: n/a
How to Implement: MARC and KCATA will create mobility hub profiles for locations that currently have elements of mobility hubs. These include existing transit centers and locations that already have proximate connections to several modes. Elements of the profile will include current transit and mobility services as well as land use (including vacant/underutilized parcels within one mile), zoning and market potential.
Recommendation MH-4: Work with local governments to identify specific locations for mobility hubs.
Applies to: Mobility hubs
Responsibility: MARC, transit providers, local governments
Potential Partners: n/a
How to Implement: MARC, KCATA and other transit providers will work with local government staff to identify specific locations for the mobility hubs that have defined profiles (see Recommendation MH-4).
Recommendation MH-5: Prioritize the funding of improvements to pedestrian and bicycle infrastructure within a half-mile of mobility hubs.
Applies to: Mobility hubs
Responsibility: Local governments, MARC, transit providers
Potential Partners: n/a
How to Implement: MARC encourages cities and counties to develop bicycle and pedestrian plans that address access to and from mobility hubs for first and last mile trips.When allocating available and applicable funds, MARC committees could provide more points to infrastructure projects such as bike lanes and sidewalks that are within a half-mile of existing or planned mobility hubs.
Mobility Services The mobility services recommendations seek to facilitate the use and location of mobility services close to transit routes and at mobility hubs, where there is sufficient demand. This plan sees mobility services as especially important in providing first mile/last mile connections to and from fixed-route transit.
Bike share Recommendation BS-1: Expand the Kansas City region’s bike share system at mobility hub locations and to support transit service along fast-and-frequent and 30-minute routes.
Applies to: Fast-and-frequent routes, 30-minute routes, mobility hubs that intersect them

6 | Smart Moves 3.0 — Strategies & Recommendations
Responsibility: Bike share providers in coordination with local governments
Potential Partners: Transit providers
How to Implement: Currently, Kansas City B-Cycle works with local governments, business districts, transit providers, and the public to identify locations for new stations. The nonprofit funds stations by acquiring federal funds through the state departments of transportation, private businesses and in some cases, local governments.
Kansas City B-Cycle is working to expand to the Kansas side of the metro by adding three to four stations around the University of Kansas Medical Center (a mobility hub identified in this plan). Going forward, Kansas City B-Cycle (or another future bike share provider) will explore providing stations at mobility hubs and in conjunction with transit service, where appropriate. Local governments should also consider and seek out bike share service as part of planned developments that support the mobility hub and transit network.
Recommendation BS-2: Expand the Kansas City region’s bike share system in lower-income neighborhoods.
Applies to: Fast-and-frequent routes, 30-minute routes, mobility hubs that intersect them
Responsibility: Bike share providers in coordination with local governments
Potential Partners: Transit providers
How to Implement: Bike share has the potential to help provide first/last mile connections to places of employment, schools, shopping centers and entertainment districts. These connections are especially important in areas with lower rates of car ownership. Kansas City B-Cycle (or another future bike share provider) will research potential expansion opportunities in lower-income areas, particularly east of Troost and near downtown Kansas City, Kansas. Providers will seek funding for viable stations as well as examine potential obstacles to using the system such as requiring users to have a credit card.
Car share Recommendation CS-1: Expand the metro area’s car share system to other locations in Kansas City as well as to appropriate suburban locations. Work with vendors to locate cars at mobility hub locations. In 2016, Zipcar added cars in the River Market and at Union Station — both mobility hubs identified in this plan.
Applies to: Mobility hubs
Responsibility: Car share vendors in coordination with local governments, private companies, developers, universities, etc.
Potential Partners: Transit providers
How to Implement: Local governments, private companies, developers and others interested in bringing car share to particular locations should work with car share vendors to investigate feasibility, site design preference, and other considerations. Potential resource: Shared Use Mobility Center Toolkit.

7 | Smart Moves 3.0 — Strategies & Recommendations
Recommendation CS-2: Reduce or remove policy barriers to car share.
Applies to: All cities and counties
Responsibility: Local governments
Potential partners: n/a
How to Implement: Some policies related to traditional car rentals, such as fees and surcharges, may need to be evaluated for an hourly-basis rental. Existing policies should be reviewed to ensure even and fair application across use types. New policies should be enacted with an eye toward enabling increased utilization of mobility services rather than prioritizing individually owned vehicles over car share and other shared mobility options.
Ridehailing Recommendation RH-1: Research ridehailing as an option for last-mile connections to employment centers.
Applies to: Fast-and-frequent services, mobility hubs, other areas
Responsibility: MARC with KCATA support
Potential Partners: Uber, Lyft, RideKC Freedom and other ridehailing services
How to Implement: MARC will work with KCATA staff to research ridehailing as a first mile/last mile connectivity solution. This will include looking into how ridehailing has been used in other cities for this purpose, including through agreements with transit providers. Resource: Shared Use Mobility Center’s Policy Database.
Rideshare (including Carpool and Vanpool) Recommendation RS-1: Continue to encourage carpooling through the use of RideshareKC.org, especially in regions that are not well served by transit.
Applies to: Entire region
Responsibility: MARC, employers
Potential Partners: Local governments
How to Implement: MARC’s RideshareKC carpool matching program works by allowing commuters to register online and search for potential carpool partners based on nearby origins and destinations and as well as common work schedules. MARC sponsors an ad campaign to promote carpooling and publicize the website. Additionally, staff meet with employers and other interested groups to provide carpooling information. MARC will continue to promote RideshareKC.org and solicit assistance from employers to facilitate implementation.
Recommendation RS-2: Continue to encourage the use of RideshareKC.org as a multi-modal information resource by advertising and promoting the program with partners and interested parties.
Applies to: Entire region
Responsibility: MARC
8 | Smart Moves 3.0 — Strategies & Recommendations
Potential Partners: KCATA
How to Implement: Recent upgrades to the website enabled map layers with points of interest. Data showing locations for mobility hubs, park-and-ride lots and bicycle infrastructure is available. Every summer, Rideshare staff manage the Green Commute Challenge, a friendly competition that encourages employers to form teams of employees who use alternative transportation to commute and track their miles. Additionally, staff meet with employers and other interested groups to provide Rideshare information. The website is also promoted on RideKC.org.
Recommendation RS-3: Continue to encourage vanpooling through the RideKC Van program, especially in areas not well served by transit.
Applies to: Fast-and-frequent routes, 30-minute routes, mobility hubs that intersect them, other areas
Responsibility: KCATA, Enterprise, MARC
Potential Partners: Employers
How to Implement: MARC and KCATA currently promote vanpool as an option when meeting with employers. Both agencies will explore new applications for vanpooling, including multi-modal trips with mobility hubs as an origin or destination. KCATA’s current vanpool program is operated by Enterprise.
Local Government Actions These recommendations cover functions generally governed by cities and counties. The majority are to be implemented by local governments, while some are listed as responsibilities of MARC or other entities.
Planning These recommendations are meant to help local governments update existing plans and create new plans to facilitate density and a mix of uses around transit corridors and mobility hubs.
Recommendation PL-1: Continue regional discussions and educational programming regarding the benefits of corridor planning.
Applies to: All transit corridors and mobility hubs
Responsibility: MARC
Potential Partners: Urban Land Institute, APA-Kansas City Chapter
How to Implement: MARC coordinates and produces educational programming on a host of applicable issues, including corridor planning. This has been done through the Creating Sustainable Places and Planning Sustainable Places programs. Additionally, MARC has also periodically hosted trainings on transit-oriented development (with instructors provided by the National Transit Institute). Potential resources include the Sustainable Code Framework and Creating Sustainable Places Implementation Guidebook. Going forward, MARC should

9 | Smart Moves 3.0 — Strategies & Recommendations
continue to facilitate regional discussions and provide educational opportunities on the topic of corridor planning.
Recommendation PL-2: Perform a review of existing land use plans within a half-mile radius of transit routes and one-mile radius around mobility hubs that currently exist or are called for in this plan. Update plans to include corridor-centric development policies that call for increasing density and mix of uses.
Applies to: Fast-and-frequent routes, 30-minute routes, mobility hubs that intersect them
Responsibility: Local governments, with assistance from MARC
Potential Partners: n/a
How to Implement: MARC will convene meetings of local government staff from those cities and counties that contain transit routes and/or mobility hubs, providing maps of the current and planned route and hub locations that fall within their boundaries and discussing local development plan recommendations for these areas.
Recommendation PL-3: Convene a series of workshops and collaborative meetings with neighboring communities along identified transit corridors to review and explore modifications to their local land use plans to support corridor-centric development strategies.
Applies to: Fast-and-frequent routes
Responsibility: MARC, KCATA, local governments
Potential Partners: n/a
How to Implement: Cities in the Kansas City region have a strong history of working together on projects that affect them jointly, and this approach should be continued. MARC will organize meetings for local governments adjacent to particular corridors to discuss how planning efforts can be coordinated.
Recommendation PL-4: Provide local communities with additional technical assistance and organizational support as they consider refinements to their local land use plans and development regulations in alignment with a transit corridor-centric strategy.
Applies to: Fast-and-frequent routes, 30-minute routes, the mobility hubs that intersect them
Responsibility: MARC
Potential Partners: n/a
How to Implement: MARC will serve as a resource for local governments that want to update their land use plans and other regulations that impact transit corridors and mobility hubs. Specifically, MARC will help provide technical analysis related to transit as well as research on best practices, model ordinances and regulations.
Recommendation PL-5 (incorporates recommendation R12 from the AFFH Plan): Form partnerships among local governments, private employers and neighborhood organizations to develop transportation
10 | Smart Moves 3.0 — Strategies & Recommendations
options that connect low-income and protected populations living in racially/ethnically concentrated areas of poverty (RCAPs) with job opportunities.
Applies to: Fast-and-frequent routes, 30-minute routes, express routes, mobility hubs that intersect them (in cities included in the AFFH plan)
Responsibility: MARC, transit providers, local governments
Potential Partners: Full Employment Council, other advocacy organizations
How to Implement: This effort to connect people from RCAPs with employment opportunities will be part of a larger MARC effort to increase jobs access via transit and mobility services—one of the main goals of this plan. Many Smart Moves 3.0 fixed-route and mobility service recommendations address connecting communities with high transit propensity to employment opportunities.
MARC will convene transit providers, cities, advocacy organizations and employers to discuss employer worker needs, how potential employees can be connected to employers in opportunity areas, and advancement of innovative transportation options. By the end of 2017, develop a number of options and present them to employers and cities; develop a strategy to implement the most promising options. Begin to implement these options in 2018.
Recommendation PL-6 (incorporates recommendation Lev4 from the AFFH Plan): Form partnerships among local governments, MARC, KCATA, area nonprofits and others to connect residents to local and regional destinations.
Applies to: Fast-and-frequent routes, 30-minute routes, express routes, mobility hubs that intersect them
Responsibility: Local governments, MARC, transit providers, area employers, nonprofits.
Potential Partners: n/a
How to Implement: Interested local government staff will seek funding (including Planning Sustainable Places grants) and work with KCATA and MARC to study possible transit service changes and new transit and mobility services options that would improve connections to jobs and regional destinations.
Recommendation PL-7: During the approval process for new development/redevelopment, consider how well the site design plan integrates with transit, mobility hubs and mobility services, especially pedestrian and bicycle access.
Applies to: Fast-and-frequent routes, 30-minute routes, mobility hubs that intersect them
Responsibility: Local governments
Potential Partners: Local CIDs, Business Improvement Districts
How to Implement: Many local governments in the Kansas City region have passed Complete Streets resolutions, calling for all modes of transportation to be accommodated on the right-of-way. This does not mean that every street should have a bike lane or bus shelters, but that

11 | Smart Moves 3.0 — Strategies & Recommendations
facilities should be provided where they make sense. Local government staff should review site plans for pedestrian and bicycle connectivity and access to transit and mobility hub facilities before making recommendations to planning commissions and city councils.
Zoning These recommendations call for the creation of zoning ordinances, in alignment with community goals, to foster density and a mix of uses around transit corridors and mobility hubs.
Recommendation ZO-1: Perform an inventory of zoning regulations within a half-mile radius of transit routes and one-mile radius around mobility hubs (existing and planned).
Applies to: Fast-and-frequent routes, 30-minute routes, mobility hubs that intersect them
Responsibility: Local governments, MARC
Potential Partners: n/a
How to Implement: Use GIS or other methods to determine how land within these parameters is currently zoned.
Recommendation ZO-2: Amend zoning ordinances within a half-mile radius transit routes and one-mile radius around mobility hubs (existing and future) to allow for higher densities and a mix of uses.
Applies to: Fast-and-frequent routes, mobility hubs that intersect them
Responsibility: Local governments
Potential Partners: n/a
How to Implement: If the inventory completed in Recommendation ZO-1 determines that current zoning regulations in areas close to transit and mobility hubs do not allow for high densities and a mix of uses, consider amending them to facilitate transit-oriented development (TOD). Use the Sustainable Code Framework as a resource. Bring to local governing bodies for adoption.
Housing It is easier for residents to rely on transit and mobility services to commute or run errands if their homes are located close to transit and mobility hubs. Affordable housing options near transit services will better serve the needs of people who do not have a car, whether as a matter of personal preference or because of limitations (such as insufficient income or inability to drive).
Recommendation HO-1 (incorporates recommendation R9 from the AFFH plan): Adopt an ordinance calling for specific amounts of affordable and multi-family housing options in a half-mile radius around transit routes and one-mile radius around mobility hubs (existing and future).
Applies to: Fast-and-frequent routes, mobility hubs that intersect them
Responsibility: Local government
Potential Partners: Local Initiatives Support Corporation (LISC), local CDCs, local housing authorities

12 | Smart Moves 3.0 — Strategies & Recommendations
How to Implement: Use the Sustainable Code Framework and other code examples to create inclusionary housing ordinances that promote affordable housing units in areas near transit routes and mobility hubs.
Recommendation HO-2 (incorporates recommendation R6 from the AFFH plan): Adopt model zoning codes for smaller homes on smaller lots and small (4-12 unit) multifamily housing developments near transit routes and mobility hubs.
Applies to: Fast-and-frequent routes, 30-minute routes, the mobility hubs that intersect them, other areas identified in the AFFH plan
Responsibility: Local governments
Potential Partners: LISC, local CDCs, local housing authorities
How to Implement: Use the Sustainable Code Framework and other code examples to create codes that allow smaller single and multifamily development near transit routes and mobility hubs. In 2019, MARC will work with the five cities included in the AFFH Plan to develop model codes using its sustainable code framework that address siting smaller homes on smaller lots and encouraging small scale multifamily projects in retail and residential areas near transit services. Once developed and reviewed by these cities, MARC will present the model codes to planning commissions and elected officials in other jurisdictions.
Recommendation HO-3 (incorporates recommendations R8 and BS3 from the AFFH plan): Adopt model zoning code language to encourage accessible (and affordable) housing units of various types near transit or other key services at activity centers/mobility hubs.
Applies to: Fast-and-frequent routes, 30-minute routes, mobility hubs that intersect them, other areas identified in the AFFH plan
Responsibility: Local governments, MARC
Potential Partners: LISC, The Whole Person, local CDCs, local housing authorities
How to Implement: Use the Sustainable Code Framework and other code examples to create code language mandating that all new housing developments (multi-family, townhomes or single-family) near transit and mobility hubs are accessible to persons with mobility disabilities (not just those with four or more units and and elevator, as required by the ADA). In 2019, MARC will work with the five cities included in the AFFH Plan to develop model codes that address siting accessible (and affordable) housing near transit services and activity centers. Once developed and reviewed by these cities, MARC will present the model codes to planning commissions and elected officials in other jurisdictions.
Recommendation HO-4 (incorporates recommendations KCMO35 from the AFFH plan): Develop plans and strategies for affordable senior housing along transit corridors and in close proximity to health care, retail and recreational facilities.
Applies to: Fast-and-frequent routes, 30-minute routes, the mobility hubs that intersect them, other areas identified in the AFFH plan

13 | Smart Moves 3.0 — Strategies & Recommendations
Responsibility: Local governments
Potential Partners: LISC, local CDCs, local housing authorities
How to Implement: Use the Sustainable Code Framework and other code examples to create code language encouraging the creation of senior housing — for example, through facilitating smaller unit developments and congregate living — near transit. Encourage communities to incorporate this objective in community master plans and area plans. This will be formalized and developed during 2017 and implemented in 2018-2021.
Parking Providing parking spaces adds to the cost of development and accelerates the depletion of available land. These parking recommendations provide options for local governments to better tailor parking requirements in areas close to transit and mobility hubs and allow for innovative solutions, such as shared parking.
Recommendation PA-1: Reduce parking requirements for both residential and commercial zoning districts within a half-mile radius of transit routes and one-mile radius around mobility hubs (both existing and future).
Applies to: Fast-and-frequent routes, 30-minute routes, the mobility hubs that intersect them
Responsibility: Local governments
Potential Partners: n/a
How to Implement: Use examples from MARC’s Sustainable Code Framework and other places to create ordinance language. Bring to Planning Commissions and City Councils for adoption.
Recommendation PA-2: Allow shared parking for non-residential uses within a half-mile radius of transit routes and one-mile radius around mobility hubs (both existing and future).
Applies to: Fast-and-frequent routes, mobility hubs that intersect them
Responsibility: Local governments
Potential Partners: Local businesses
How to Implement: Use examples from MARC’s Sustainable Code Framework and other places and create ordinance language. Bring to Planning Commissions and City Councils for adoption. Also, create a shared parking agreement template for use by property owners.
Recommendation PA-3: Create parking maximums within a half-mile radius of transit routes and one-mile radius around mobility hubs (both existing and future).
Applies to: Fast-and-frequent routes, 30-minute routes, the mobility hubs that intersect them
Responsibility: Local Governments
Potential Partners: n/a
14 | Smart Moves 3.0 — Strategies & Recommendations
How to Implement: Use examples from MARC’s Sustainable Code Framework and other places and create ordinance language. Bring to planning commissions and city councils for adoption.
Recommendation PA-4: Require that development include bicycle parking for residents, customers and employees.
Applies to: Fast-and-frequent routes, 30-minute routes, the mobility hubs that intersect them
Responsibility: Local governments
Potential Partners: BikeWalkKC
How to Implement: Use examples from MARC’s Sustainable Code Framework and other places and create ordinance language. Bring to Planning Commissions and City Councils for adoption.
Recommendation PA-5 (Cross listed with: Mobility Services): Integrate car share spaces into on-street and off-street parking.
Applies to: Fast-and-frequent routes, 30-minute routes, the mobility hubs that intersect them, other areas
Responsibility: Local governments
Potential Partners: Large employers and other property owners
How to Implement: Local governments can dedicate parking spaces near busy transit stops and at mobility hub locations for use by car share vehicles. As part of their development review processes, local governments can also facilitate the integration of car share options into the design of private developments. Additionally, large employers who see a demand from their employees can work directly with car share companies to locate vehicles on-site.
Economic Development Economic development tools and incentives can help focus development in places that local governments have identified as priorities. These recommendations provide ways in which cities and counties could use these tools and incentives to foster development along transit routes and at or near mobility hubs.
Recommendation ED-1: Convene Economic Development Corporations (EDCs) and local government staff to discuss and develop regional transportation policy to employ development incentives that would encourage development/redevelopment within a half-mile of transit corridors and one mile of mobility hubs.
Applies to: Fast-and-frequent routes, 30-minute routes, mobility hubs that intersect them
Responsibility: Local governments, EDCs, other agencies with authority to award incentives
Potential Partners: Community Development Corporations (CDCs)
How to Implement: MARC staff will provide resources to economic development agencies and local governments (e.g., maps of where transit and mobility hubs exist or are planned) to

15 | Smart Moves 3.0 — Strategies & Recommendations
facilitate discussions about how transit and mobility hub proximity could figure into incentive approval.
Recommendation ED-2: Create taxing districts such as Community Improvement Districts (CIDs) and Transportation Development Districts (TDDs) to generate funding for transit and mobility services and other projects that increase corridor vitality.
Applies to: Fast-and-frequent routes, 30-minute routes, mobility hubs that intersect them
Responsibility: Local businesses, property owners, with assistance from local governments
Potential Partners: Neighborhood associations
How to Implement: There are different processes for creating CIDs versus TDDs. CIDs generally are organized by community businesses and must be submitted for approval to the local governing body. TTDs are authorized by state law. The process for their creation involves a petition of local property owners and residents; if approved, tax revenue is collected by the state and funneled to local governments for use. Local governments should work with local businesses and organizations to help identify potential CIDs and TDDs and help guide them through approval process.
Bicycle/Pedestrian Facilities (Cross listed: Mobility Services) Everyone is a pedestrian at some point in their day, even if just walking from a parking spot to a building, and bicycling is an affordable and convenient transportation mode that is an option for many. These recommendations seek to provide quality bicycle and pedestrian facilities, especially on transit routes and in and around mobility hubs.
Recommendation BP-1: Use GIS to analyze bicycle and trails facilities as they relate to mobility hub locations. Specifically, analyze local on and off street facility plans and consider elevating facilities at or near mobility hubs to Regional Trails and Bikeways status as specific place for hubs are identified.
Applies to: Mobility hubs
Responsibility: MARC with help from local governments
Potential Partners: BikeWalkKC
How to Implement: MARC and partners developed the Kansas City Regional Bikeway Plan in 2014. This plan not only incorporates locally developed and planned bicycle facilities but identifies routes (or “regional bikeways”) that provide the opportunity for bicyclists to travel from one area of the region to another.
MARC will ask local governments for updated shapefiles of bicycle facilities and use GIS to identify facilities that are candidates for elevating to the status of a regional bikeway based on their proximity to identified mobility hubs. MARC staff will provide a list of potential new regional bikeway facilities to the Bicycle Pedestrian Advisory Committee for feedback and potential adoption.
Recommendation BP-2: Prioritize funding for bicycle facilities identified as part of the regional system.

16 | Smart Moves 3.0 — Strategies & Recommendations
Applies to: Mobility hubs
Responsibility: Local governments, MARC
Potential Partners: BikeWalkKC
How to Implement: Seek out funding (including STP, STBG/TA. CMAQ and local funds) for bicycle facilities and prioritize construction of routes identified as part of the regional bikeway network. Ensure that facilities within the right-of-way may be utilized year-round, including snow-removal during the winter months, and parking enforcement to ensure that bike lanes are clear for bicycles at all times.
Recommendation BP-3: Review public works and other standards that affect walking and biking and make recommendations to revise if changes could be made to increase pedestrian and bicycle accessibility both on right-of-way and within developments.
Applies to: City/county-wide, but focused on the area within a half-mile of fast-and-fFrequent routes and one mile around mobility hubs
Responsibility: Local governments
Potential Partners: BikeWalkKC
How to Implement: Review standards and make recommendations. Adopt changes to standards. Use NACTO and FHWA resources as guides.
Recommendation BP-4: Perform an inventory of pedestrian facilities within a quarter-mile of transit stops and a half-mile of mobility hubs.
Applies to: Fast-and-frequent routes, 30-minute routes, mobility hubs that intersect them
Responsibility: MARC, local governments, with assistance from transit providers
Potential Partners: BikeWalkKC
How to Implement: MARC will work to secure funding to undertake this analysis on an ongoing basis, with the goal of collecting data for all routes and mobility hubs. The inventory of fast-and-frequent routes and the mobility hubs that intersect them will be the first priority.
Currently, MARC is working with KCATA and the cities of Kansas City, Missouri, Independence, Missouri, and Kansas City, Kansas, on a project called the “Fixed Route Accessibility Study.” The study will involve consolidating and collecting data regarding the existence and condition of infrastructure at and around transit stops along certain routes. This project will be completed in 2017. It has limited funds, but will serve as a template for collecting the same data across the region.
Recommendation BP-5: Integrate transit stop improvements with street and sidewalk projects with guidance and assistance from KCATA’s Bus Stop Guidelines.
Applies to: All transit stops and mobility hubs that intersect them
Responsibility: Local governments, in coordination with transit providers

17 | Smart Moves 3.0 — Strategies & Recommendations
Potential Partners: Business improvement districts, community development corporations, and other neighborhood groups.
How to Implement: KCATA developed Bus Stop Guidelines in 2015 that strive to enhance the rider experience. KCATA and other transit providers should consider these guidelines and strive to coordinate stop improvements with improvements to the surrounding street and sidewalk infrastructure. This involves coordinating with city and county public works departments.
Employer Coordination (Cross listed with: Mobility Hubs, Mobility Services) This plan includes a special focus on jobs access via transit, making coordination with employers key. These recommendations are intended to help employers establish future locations in places accessible to transit and also collaborate with employers to develop mobility solutions in locations where traditional transit service is not cost effective.
Recommendation EC-1: Work with large employers within two miles of mobility hubs to create Transportation Management Associations (TMAs) that provide last-mile connections to transit for employees.
Applies to: Mobility hubs
Responsibility: Large employers interested in last-mile connections, local governments, KCATA and MARC
Potential Partners: Trade organizations
How to Implement: MARC and KCATA will facilitate the creation of a TMA pilot in at least one location that has several large employers and limited transit options because of poor last-mile connections. MARC will research best practices for TMAs and convene meetings with employers, local government staff and the transit agency to pursue the creation of a TMA or a similar agreement.
Recommendation EC-2: Work with businesses seeking new facilities to identify commercial locations that are either currently well-served by transit and mobility services or are in corridors identified by this plan as candidates for new fixed-route transit service, are near a mobility hub, and/or are connected by mobility services.
Applies to: Fast-and-frequent routes, 30-minute routes, mobility hubs that intersect them
Responsibility: MARC, EDCs
Potential Partners: Local governments
How to Implement: MARC will provide a workshop for EDC staff on the importance of accessibility to transit and mobility services when siting an employer location.
Recommendation EC-3 (incorporates recommendations KCK 8 and KCMO 36 from the Affirmatively Furthering Fair Housing (AFFH) Plan): Work with employers and public, private and nonprofit sector providers of mobility services such as Kansas City B-cycle, car share vendors, and KCATA’s V-Ride-operated vanpool program to locate their services in conjunction with existing and planned fixed-route transit and mobility hubs.

18 | Smart Moves 3.0 — Strategies & Recommendations
Applies to: Fast-and-frequent routes, mobility hubs that intersect them, other mobility hubs.
Responsibility: Local governments, private-sector service providers
Potential Partners: Private/public/nonprofit providers of mobility services.
How to Implement: Work with KCATA and large employers or clusters of employers to provide mobility services that connect to fixed-route transit and mobility hubs. Local governments should identify sites for mobility services and facilitate meetings with employers, property owner, and service providers to access the feasibility of providing service.
Marketing, Education, and Outreach Transit and mobility services are most successful when useful options are provided to meet existing or latent demand. If demand is too low for a transit route or bike share station in a particular location, for example, the investment will not make practical or financial sense. Residents and other stakeholders have demonstrated a desire for convenient and affordable transit service. The recommendations in this section will assist local governments in adding services that meet their residents’ needs and marketing those services to inform residents and increase ridership.
Recommendation MO-1: Continue to work with local governments to identify new fixed-route and flexible transit services that meet the needs of residents.
Applies to: Fast-and-frequent routes, 30-minute routes, express routes, mobility hubs that intersect them, other areas
Responsibility: Transit agencies
Potential Partners: Employers
How to Implement: KCATA currently contracts with several local governments for services within their communities and connecting to other communities. KCATA should continue to work with local governments to identify route changes/additions that will meet particular needs of residents, workers, and visitors.
Recommendation MO-2: Work with local governments to identify mobility services that meet the needs of their residents and where possible, assist them in their pursuit of these modes.
Applies to: Fast-and-frequent routes, 30-minute routes, express routes, mobility hubs that intersect them, other areas
Responsibility: MARC, KCATA, mobility services companies, nonprofits in conjunction with local governments
Potential Partners: Large employers interested in last-mile connections
How to Implement: MARC will use Rideshare and other materials to provide information to local governments on how different mobility services work. There may be instances where MARC can facilitate a meeting between staff and mobility services companies/nonprofits.
Recommendation MO-3: Market new services (routes or mobility services) and changes (such as hour and weekend service expansion) through a variety of media, especially to employers.
19 | Smart Moves 3.0 — Strategies & Recommendations
Applies to: All service changes and additions
Responsibility: Transit and mobility services providers
Potential Partners: Private companies, nonprofit stakeholders, MARC
How to Implement: Create and disseminate appropriate, timely and well-targeted materials to inform current and future riders about new and expanding service. This information is not only important for current riders, but also key to attracting new riders. To attract and retain riders, marketing should include messaging on: relaxing instead of driving during commute time, cost savings, ease and timeliness of service, and connections to bike share, car share, and other mobility services.
Environmental Quality Improved access to transit, along with increased carpooling, vanpooling, bicycling and walking, reduces the vehicle miles traveled in the region, which lowers emissions and improves air quality. Likewise, land use and development decisions, such as the recommendations in this plan that address density and a mixed of uses, can help conserve natural resources and protect the environment.
Recommendation EQ-1: Continue the daily SkyCast to inform area residents of forecast ozone levels and issue Ozone Alerts when levels are expected to be high enough to impact public health.
Applies to: Kansas City region
Responsibility: MARC
Potential Partners: Transit providers
How to Implement: MARC’s air quality program monitors ozone levels and issues the daily SkyCast from April 1 to October 31 each year. In addition to alerting residents to predicted levels of ozone pollution, MARC provides information on how residents can take action to reduce emissions that are precursors to ozone — for example, by carpooling or taking transit on Ozone Arert days. MARC will continue to provide this service and publicize Ozone Alerts through its workforce partner network, on social media and numerous other outlets.
Recommendation EQ-2: Convert transit vehicle fleets to compressed natural gas (CNG) or other alternative fuels.
Applies to: Kansas City region
Responsibility: All transit providers
Potential Partners: n/a
How to Implement: Currently, KCATA operates 54 CNG buses in the region. As funding becomes available, KCATA and other transit providers should replace conventional gas-powered vehicles with those powered by CNG and other cleaner fuels. Federal programs such as the Congestion Mitigation Air Quality (CMAQ) program are a potential source of funds.

20 | Smart Moves 3.0 — Strategies & Recommendations
Recommendation EQ-3: When planning for upgraded or new transit stops and mobility hubs, integrate green infrastructure amenities such as street trees, rain gardens and permeable pavement where appropriate.
Applies to: All fixed routes and mobility hubs
Responsibility: Local governments, in coordination with transit providers
Potential Partners: n/a
How to Implement: Local governments, in coordination with transit providers, should strive to integrate green infrastructure solutions into streetscape improvements along transit corridors and around mobility hubs. Pursue Transporation Enhancements funds for this purpose.
Mobility Innovations Technology has the potential to make our transportation system function more smoothly and offer transportation choices. These recommendations call for the Kansas City region to explore, pilot and implement mobility innovations.
Recommendation MI-1: Research and stay up-to-date on best practices regarding new mobility technologies.
Applies to: Fast-and-frequent routes, 30-minute routes, express routes, mobility hubs that intersect them, other areas
Responsibility: MARC
Potential Partners: KCATA
How to Implement: Gather information on new mobility technologies on a continual basis to stay up-to-date on new mobility technologies. These technologies include on-demand apps, autonomous vehicles, ridehailing, car sharing, and bike sharing services. Potential resources include: Shared Use Mobility Center, Transporation Research Board’s Standing Committee on Emerging and Innovative Public Transport and Technologies, and the Kansas City, Missouri, Smart City program.
Recommendation MI-2: Expand RideKC Freedom On-Demand to serve residents across the metro area.
Applies to: All areas
Responsibility: KCATA
Potential Partners: Taxi companies, local governments
How to Implement: In May 2017, KCATA launched a new mobile service, RideKC Freedom On-Demand. This app, which functions much like a ridehailing service, allows the customer to solicit and pay for a ride. Vehicles used are 10-10 Taxi, Yellow Cab, or zTrip vehicles that are branded with the RideKC Freedom logo. While open to everyone, the service provides subsidized rides to those with disabilities (ADA paratransit riders), allowing these riders the same convenience and ease of trip booking. Initially, service will be available to riders being picked up in limited areas, but KCATA has plans to expand the service throughout the region.

21 | Smart Moves 3.0 — Strategies & Recommendations
Recommendation MI-3: In conjunction with the development of mobility hubs, explore interactive kiosk technology for use at hubs where several mobility services converge.
Applies to: Mobility hubs
Responsibility: KCATA and MARC
Potential Partners: Technology companies
How to Implement: This plan calls for more than 60 mobility hubs spread across the region, connecting residents, workers and visitors to fixed-route transit and a range of mobility services. At Destination and Junction-level mobility hubs, this plan envisions mobile technology-enabled kiosks that allow users to view bus schedules, hail a ride, view information about available vanpool service, see nearby pedestrian and bicycle connections, and more.
KCATA and MARC will learn from the Smart Kiosk installation in Kansas City, Missouri (part of the Smart City Initiative), which will include 25 kiosks (many of which will be located along the streetcar route). KCATA and MARC will identify a kiosk technology that is suitable for additional mobility hub locations.
Recommendation MI-4: Pilot autonomous vehicle technology as part of the transit system.
Applies to: Fast-and-frequent routes
Responsibility: KCATA
Potential Partners: n/a
How to Implement: KCATA is currently working on plans to pilot autonomous vehicles for transit service in various locations in the Kansas City metropolitan area.
Recommendation MI-5: Work with large employers, residential and commercial property owners to develop and deploy multi-modal, real-time, location-specific information feeds for public display.
Applies to: Fast-and-frequent routes, 30-minute routes, express routes, mobility hubs that intersect them, other mobility services.
Responsibility: MARC, large employers, commercial and residential property owners
Potential Partners: Technology companies, mobility service providers
How to Implement: MARC will work with technology providers, large employers and property owners to develop multi-modal information feeds. The feeds will include the services available at nearby mobility hubs: bus and streetcar arrival times, bike share, car share and ride hailing availability, local shuttles and other relevant information. Property owners may deploy the feeds online or on large public display screens. The feeds can also be integrated into the information provided at mobility hub kiosks.
Funding Funding of transit and mobility services is always a challenge. New funding will be necessary to provide many of the expanded and improved transit routes and mobility options outlined in this plan.

22 | Smart Moves 3.0 — Strategies & Recommendations
Recommendation FN-1: Work with the Regional Transit Coordinating Council (RTCC) and other stakeholders to prioritize projects.
Applies to: Where transit service can be operated
Responsibility: RTCC, MARC, transit and mobility services providers
Potential Partners: Nonprofit stakeholders
How to Implement: The RTCC will review and prioritize plan recommendations annually. MARC and the RTCC will also engage mobility service priorities in these discussions.
Recommendation FN-2: Initiate discussion of a county-by-county model for transit funding.
Applies to: MARC, transit providers, counties covered by transit services
Responsibility: RTCC, county governments, transit providers, MARC
Potential Partners: n/a
How to Implement: Currently, Johnson County is the only county in the region that funds transit for the county as a whole. Other service contracts held by KCATA are with cities. A county-by-county model would allow for a more equitable way of sharing the cost of transit and result in more services that cross jurisdictional borders to improve regional connectivity. Cities across the region have shown interest in this approach. With guidance from the RTCC, MARC and KCATA will reach out to county governments as well as cities to help organize meetings to discuss this model.
System Condition Transit system infrastructure, including vehicles, transit stations, shelters, furniture and signage, should be well-maintained. Current levels of service should also be maintained before new service is added.
Recommendation SC-1: Continue to balance service and infrastructure improvements with the need to maintain existing transit service and infrastructure in a state of good repair.
Applies to: Where transit service is operated
Responsibility: Transit providers
Potential Partners: n/a
How to Implement: The region’s transit providers should continue to strive to keep all system components well-maintained, providing attractive and comfortable service to customers.
System Performance Transit should be efficient and reliable to retain riders and attract new customers to the system.
Recommendation SP-1: Strive to meet on-time performance standards.
Applies to: Where transit service is operated
Responsibility: Transit providers
23 | Smart Moves 3.0 — Strategies & Recommendations
Potential Partners: n/a
How to Implement: Currently, the region’s transit providers have a good record of meeting on-time performance standards.These agencies should continue to make meeting these standards a priority.
Recommendation SP-2: Design simple, direct routes, minimizing deviations, serving well-defined markets while maintaining symmetry, consistency and coordination.
Applies to: Where transit service can be operated
Responsibility: Transit providers
Potential Partners: n/a
How to Implement: KCATA adopted Transit Service Guidelines in 2011 that cover these topics. KCATA will strive to meet these guidelines, which also will serve as a good blueprint for other transit providers, with appropriate modications for their organizations.
Resources: KCATA Comprehensive Service Analysis - Service Guidelines (July 2011)
Safety and Security Riders should feel safe using the transit sytem and the system should be incorporated into emergency plans to provide additional mobility options to residents in times of need.
Recommendation SS-1: Continue to make the safety of transit riders and workers a top priority by responding quickly to concerns and problems.
Applies to: Where transit service is operated
Responsibility: Transit providers
Potential Partners: Police departments
How to Implement: Transit agencies should continue to proactively identify safety issues and respond with practical solutions. For instance, agencies could install better lighting at some transit stops to deter crime and make residents feel safer. Transit agencies should also continue to take rider’s safety concerns very seriously and try their best to address them. This includes working with local police departments.
Recommendation SS-2: Continue to work with emergency management agencies to integrate transit services into emergency response plans in the case of natural or man-made disasters or other events.
Applies to: Where transit service is operated
Responsibility: Transit providers, emergency management agencies, MARC
Potential Partners: Social service agencies including the Whole Person and the Red Cross
How to Implement: For all residents and workers, but especially for vulnerable populations and those who do not have their own vehicles, having a plan for how transit can move people out of harm’s way, provide shelter, or other necessessities in case of an emergency is extremely

24 | Smart Moves 3.0 — Strategies & Recommendations
important. The transit agencies should continue to work with emergency managers to integrate transit into plans for natural and man-made disasters.
Recommendation SS-3: Encourage transit providers to conduct internal emergency management exercises in order to practice emergency procedures to build and strengthen internal organizational knowledge and proficiency and also participate in emergency management exercises conducted by emergency response agencies.
Applies to: Where transit service is operated
Responsibility: Transit providers, emergency management agencies, MARC
Potential Partners: n/a
How to Implement: Emergency management agencies should include transit providers in the exercises they conduct to prepare for a disaster. These agencies should also assist transit providers in designing exercises that the transit providers can do on their own.

_____________________________________________________________________________________ Smart Moves 3.0: Regional Transit and Mobility Plan 1
VIII. Implementation This section provides guidance on carrying out the strategies outlined in Section 7 of this plan. Guidance in this section includes the following components:
• Recommended phasing of fixed-route and demand response services. • Recommended phasing of mobility hubs. • Costs summaries of service by phase. • Cost summaries of service by jurisdiction. • Funding opportunities. • Implementation strategies in the areas of leadership, staffing, service standards, marketing and
education, engagement, partnerships, and funding.
Phasing of Services The service recommendations outlined in this plan are extensive and it is important to recognize that it is not feasible to carry out all recommendations at once. Instead, this plan proposes a three-phase implementation approach that will assist the Smart Moves planning team and local governments in determining which projects should be advanced first. This approach will ensure that projects are implemented based on data and on priorities identified by the public, stakeholders and transit providers. The first phase contains projects for immediate implementation in years 0-5. The second phase (5-10 years) contains mid-term projects that build on the projects implemented in the first five years to expand the network and provide greater regional outcomes. The final phase contains projects for implementation in years 10-20, which reflects full build-out of the Smart Moves 3.0 system. Included in each phase are fixed-route services, demand response (ADA and non-ADA), community-based services, and mobility hubs. Each phase includes the network of projects that precede it. These services are described as “carryover” and evolve over the three phases as some of these routes or services are expanded. More information on each phase and the projects it contains can be found in Appendix A. Detailed costs for projects by phase can be found in Appendix B.
Fixed-Route and Demand-Response Projects Fixed-route implementation by phase is described below. The planning team recommends that the fixed-route strategies with the largest potential impact on job accessibility, and those currently underway, be implemented first. Phase One: 0-5 Years Implementation The first five years of Smart Moves 3.0 primarily focuses on expanding and enhancing fast-and-frequent corridors and enhancing frequencies and connectivity within the existing network. This strong foundation will set the stage for the success of new transit routes in the following 10 years. New or enhanced services in the first five years are focused in areas with high transit propensity, where

_____________________________________________________________________________________ Smart Moves 3.0: Regional Transit and Mobility Plan 2
outcomes related to job access and general enhanced mobility can achieve the most gains. Because of increased service hours, the annual operating costs for ADA paratransit increase Phase Two: 5-10 Years Implementation Implementation in years 5-10 of Smart Moves 3.0 focuses on building out the supporting network. With the strong foundation of core fast-and-frequent routes and cross-town 30-minute routes in place, the next five years focus on bringing transit to new parts of the metro, which begins to change the urban and suburban mobility landscape. With the Kansas City, Missouri system almost completely built out in the first five years, projects considered in the second five years are focused on Johnson, Wyandotte, Clay, Jackson, and Platte counties. Additions to the Fast-and-Frequent network further from the urban core are implemented during this time frame and supporting (30-minute) service upgrades and new routes bring additional mobility to a majority of the Kansas City metropolitan area.
Phase Three: 10-20 Years Implementation The final phase of implementation of Smart Moves 3.0 focuses on express bus services that will connect the far reaches of the Kansas City metropolitan area with the developed transit system via all day service. Additionally, expansion of the 30-minute, supporting network into Johnson, Clay and Platte counties will enhance east/west connections regionally. While many of these express services currently exist in some form, Smart Moves 3.0 suggests optimizing these routes through capital improvements such as slip ramps and priority lanes/shoulders where congestion exists to provide a travel-time benefit to the transit user. These specific enhancements are not included in cost estimates because they are not tied to specific projects. Operationally, these services would transition from peak hour to all day. The new 30-minute services will bring cross-town transit to high-growth areas of the region, further connecting the network and following through on the strategy of frequency and predictability.
Mobility Hubs Unlike transit and demand response projects, specific mobility hub projects are not identified in this plan. Instead, mobility hub locations, their typologies and desired components for each typology are identified. Each hub location will require further study and planning by local governments to determine needs. The phasing of mobility hubs suggests a general priority, but this plan acknowledges that planning and implementation of projects at mobility hub locations can occur sooner or later than the phase indicates, as desired by, and led by, community-based planning projects. A list of proposed mobility hubs by phase is located in Appendix A. Estimated costs for mobility hubs is located in Appendix B.
Phase One: 0-5 Years Implementation The first phase includes 21 mobility hubs. These selected locations either build on existing transit centers, have been identified for near-term implementation through recent studies, or are already

_____________________________________________________________________________________ Smart Moves 3.0: Regional Transit and Mobility Plan 3
mobility hubs that need only small investments. In several cases, these Phase One mobility hubs exist in areas that already include transit-supportive densities and may only require transportation and technology infrastructure to facilitate coordination among — or the addition of new — mobility options. Phase Two: 5-10 Years Implementation The second phase includes 26 mobility hubs. These hubs primarily fall along fast-and-frequent routes, and would likely serve more riders. Most of these hubs function as Destination or Junction hubs. Phase Three: 10-15 Years Implementation The third phase includes 16 mobility hubs and primarily serves corridors with 30-minute service or express routes. Most of these hubs function as Gateway or Local hubs.
Summary of Cost Estimates The Smart Moves 3.0 plan includes major investments in mobility throughout the metropolitan area. The following tables outline estimated costs by phase. The total costs are cumulative, including the totals from previous phases. The cost methodology can be found in Appendix C.
Summary: Operating Cost Operating costs include costs for general public transit, RideKC Freedom paratransit (ADA and non-ADA) and community-based transit services. Jurisdictions include all seven counties within the transit service area and the city of Kansas City, Missouri. The breakdown of costs by jurisdiction can be found in Appendix B.
Figure 21 : Cost Summary
IMPLEMENTATION PHASE ANNUAL OPERATIONS COST Existing Services $112M
Phase 1: 0-5 years $120.7 - 138.8M Phase 2: 5-10 years $163.2 - 196.7M Phase 3: 10+years $236.9 – 268.8M
Summary: Rolling Stock Cost In addition to existing vehicles, which have their own existing capital replacement cycles, additional vehicles will be needed to implement the routes in the Smart Moves 3.0 network. Vehicle types included in these estimates include over-the-road coaches, bus rapid transit vehicles, large buses, small buses and mini buses.
Figure 25: Rolling Stock Cost Summary
IMPLEMENTATION PHASE ROLLING STOCK COST Phase 1: 0-5 years $6.1M Phase 2: 5-10 years $7.7M Phase 3: 10+years $19.9M

_____________________________________________________________________________________ Smart Moves 3.0: Regional Transit and Mobility Plan 4
Summary: Mobility Hub Cost Mobility hubs will be implemented as routes are developed, and will be right-sized to meet the needs of each specific location. The following tables provide high-level cost ranges based on estimated average costs for components of mobility hubs, including planning, design, and supervision; land, site improvements and utilities; construction; and amenities. Mobility hub cost detail can be found in Appendix B.
Figure26: Destination Mobility Hub Cost Ranges
MOBILITY HUB ELEMEMT ELEMENT COST RANGE Planning, Design, and Supervision $200K-1M
Land $250K-1.2M Site Improvements and Utilities $400K-2M
Construction $1-5M Amenities $150-750K
Figure27: Junction Mobility Hub Cost Ranges
MOBILITY HUB ELEMEMT ELEMENT COST RANGE Planning, Design, and Supervision $150-600K
Land $187-750K Site Improvements and Utilities $300K-1.2M
Construction $750K-3M Amenities $112-450K
Figure27: Gateway Mobility Hub Cost Ranges
MOBILITY HUB ELEMEMT ELEMENT COST RANGE Planning, Design, and Supervision $50-200K
Land $62-250K Site Improvements and Utilities $100-400K
Construction $250K-1M Amenities $37-150K
Figure28: Local Mobility Hub Cost Ranges
MOBILITY HUB ELEMEMT ELEMENT COST RANGE Planning, Design, and Supervision $25-50K
Land $31-60K Site Improvements and Utilities $50-100K
Construction $125-150K Amenities $18-37K
_____________________________________________________________________________________ Smart Moves 3.0: Regional Transit and Mobility Plan 5
OTHER COSTS ASSOCIATED WITH TRANSIT IMPLEMENTATION Beyond operations and rolling stock costs, other costs related to the implementation of transit and mobility services will need to be assessed through further study. These costs include any amenities needed for stops and stations, such as shelters, bus pads, information kiosks, fiber installation, lighting, signage, and bike racks. Upgrades to regional technology systems will also be essential to the growth of the network. These upgrades will include dispatching and GPS technologies that connect vehicles with customer service, asset management software that optimizes maintenance of fleet and facilities, and all methods for communicating and transacting with the customer, including digital message signs, websites, mobile applications, fareboxes, media and mobility hub kiosks. The initial capital outlay, implementation, operating costs and replacement of these items will be a considerable cost regionally.
Funding The Kansas City metropolitan area is challenged by its numerous boundaries — two states, seven counties and more than 100 cities — and local transit funding typically follows municipal boundaries. The services identified in Smart Moves 3.0 focus on regional connectivity by crossing these boundaries, so the funding of this system will also need to involve multiple jurisdictions. A long-term strategy based on a county-by-county funding structure, will have the highest likelihood of acquiring sufficient funds to implement Smart Moves 3.0. Until then, the Smart Moves partners should work with local governments and the private sector to explore new funding opportunities. Choosing an Appropriate Funding Mechanism There are a variety of important considerations in the selection of potential revenue sources for transit and mobility operations and capital investments. Transit system managers often use some form of the following criteria to select from alternative revenue sources:
• Revenue yield — a measure of the level of revenues that can be generated from a given increment of a tax or charge (e.g., dollars per sales tax percentage or dollars per penny of a gas tax).
• Ease and efficiency of collection —net revenues are affected by costs associated with implementing the new or supplemental charge.
• Equity — a measure of the degree to which those who are subject to the new charge are those who will benefit from the investment, either directly or indirectly.
• Legal and institutional barriers — the extent to which there are statutory or administrative impediments to implementing a particular tax or charge.
Below are several funding mechanisms that can be used to implement elements of the Smart Moves Plan. Figure27: Funding Mechanisms

_____________________________________________________________________________________ Smart Moves 3.0: Regional Transit and Mobility Plan 6
Funding Opportunities
Fixe
d Ro
ute
(cap
ital)
Fixe
d Ro
ute
(o
pera
ting)
Mob
ility
on
Dem
and
Tech
nolo
gy
Mob
ility
Hub
s (C
apita
l)
Mob
ility
Hub
s (O
pera
ting)
Plan
ning
Mar
ketin
g. O
utre
ach,
&
Edu
catio
n
Local – General Revenues ⃝ ⃝ ⃝ ⃝ ⃝ ⃝ ⃝ ⃝
Local – Sales Tax ⃝ ⃝ ⃝ ⃝ ⃝ ⃝ ⃝ ⃝
Local – Property Tax ⃝ ⃝ ⃝ ⃝ ⃝ ⃝ ⃝ ⃝
State – General Revenues ⃝ ⃝ ⃝ ⃝ ⃝ ⃝ ⃝ ⃝
Federal – Discretionary Grants ⃝ ⃝ ⃝ ⃝ ⃝ ⃝
Federal – MARC Sub-Allocated ⃝ ⃝ ⃝ ⃝ ⃝ ⃝ ⃝
Federal – FTA 5307 Formula Funds ⃝ ⃝ ⃝ ⃝ ⃝ ⃝
Federal – FTA 5310 Formula Funds ⃝ ⃝ ⃝ ⃝ ⃝ ⃝ ⃝ ⃝
Federal – FTA 5311 Formula Funds ⃝ ⃝ ⃝ ⃝
Transit-Generated Revenues ⃝ ⃝ ⃝ ⃝
Public-Private Partnership ⃝ ⃝ ⃝ ⃝ ⃝ ⃝ ⃝ ⃝
Special Taxing District ⃝ ⃝ ⃝ ⃝ ⃝ ⃝ ⃝
Development Impact Fees ⃝ ⃝ ⃝ ⃝
Vehicle Registration and Rental Fees ⃝ ⃝ ⃝ ⃝ ⃝ ⃝
Parking Fees ⃝ ⃝ ⃝ ⃝ ⃝ ⃝
Tax Increment Financing ⃝ ⃝ ⃝
Local General Revenues These local revenues pay for functions of a public entity, usually with little or no restriction. Revenues can come from sales and property taxes and other sources. Cities and counties allocate funds in their budgets and contract for transit services. Sustaining this type of local funding to maintain a steady level of transit service from year to year can be challenged by other priorities. For local governments that use general funds to buy transit service, it is recommended that transit service be moved to a separate line item in the budget with revenue generated from a source dedicated to transit. Sales Tax Dedicated sales taxes are widely used as a funding source for transit services, typically at a levy of one-cent or less. Currently, Kansas City, Missouri, is the only jurisdiction in the region that collects sales tax revenues dedicated to transit. While this funding tool can yield high revenues, sales taxes can fluctuate from year to year depending on the state of the economy and are considered regressive. State or local governments may impose limitations on sales taxes, including caps or restrictions on uses. Property Tax Property tax is assessed by local governments on real estate and personal property, such as automobiles. Property tax is usually expressed as a mill levy or amount of tax per hundred currency units of property value, and usually contributes to local general funds which are widely applied to transit. This type of tax is generally considered regressive.

_____________________________________________________________________________________ Smart Moves 3.0: Regional Transit and Mobility Plan 7
State General Revenues Like city or county general revenues, state general revenues come primarily from sales and property taxes and other sources. These funds are mostly flexible and are budgeted through state legislative processes. Currently, state funding provided for transit in the region is very limited. Federal Funding – Discretionary Grants The New Starts/Small Starts Program is the traditional funding program for transit capital projects. It relies on transit propensity indicators, which can be challenging for regions that do not currently have high ridership or rail-based service. The Kansas City region has been successful in securing this funding for the MAX bus rapid transit services. In addition to the traditional federal funding sources through the Federal Transit Administration (FTA), the U.S. Department of Transportation (USDOT) has implemented unique funding programs to support projects that can be difficult to fund through traditional USDOT funding programs. The TIGER program, Transit Investments Generating Economic Recovery, has successfully funded transit projects across the country and here in the Kansas City region, including a portion of the KC Streetcar, as well as enhanced bus stops and transit centers on major bus corridors. If TIGER grants are continued in the future, developing a regional strategy to apply for funding for future transit projects will provide more likelihood for success. FTA and USDOT continue to pilot new funding programs related to technology, transit-oriented development and mobility. Those regions that can demonstrate a shared vision are more likely to benefit financially from these sources. Federal Funding – MARC Sub-allocated Funds Using USDOT funds that are sub-allocated to MARC through the Kansas and Missouri Departments of Transportation (KDOT and MoDOT) for multimodal projects is a good way to pilot new projects or build capital improvements. These programs include the Surface Transportation Program (the most flexible of all USDOT programs), Congestion Mitigation/Air Quality (CMAQ), and Transportation Alternatives (TA). Smart Moves 3.0 recommends that municipal partners be deliberate and ambitious in pursuing these funds for the implementation of these projects. Federal – FTA 5307 Funds The FTA 5307 Urbanized Area Formula Grants are allocated to designated recipients in each urbanized areas based on a formula. The Kansas City region includes two urbanized areas, and therefore two designated recipients: KCATA and the city of Lee’s Summit. These funds are primarily used for capital projects but can, in limited cases, be used for operations. The funding formula includes existing ridership so increasing ridership will increase the 5307 funds that come into the region. Federal – FTA 5310 Funds Like 5307 funds, 5310 funds are allocated to designated recipients based on a formula. These funds are for capital vehicle acquisition and operating projects that support mobility for seniors and individuals with disabilities. KCATA, as the designated recipient, has the flexibility to determine how these funds are distributed to subrecipient projects throughout the region. KCATA works with MARC to administer a competitive process for allocating these funds to local private nonprofits or local government projects that support the implementation of Smart Moves. Federal- FTA 5311 Funds The FTA 5311 Formula Grants for Rural Areas funds are allocated to states and may be useful for express or employer shuttle connections to outlying non-urban areas within the region.

_____________________________________________________________________________________ Smart Moves 3.0: Regional Transit and Mobility Plan 8
Transit-Generated Revenues These are revenues generated directly by the transit service or business activities of the transit provider. Traditionally, these include farebox and advertising revenues; however, revenues can also be generated through partnerships with private-sector businesses seeking direct access to transit riders and the lease or sale of capital assets. Public-Private Partnerships Other options for financing of transit could come from public-private partnerships. Participating in joint development ventures allows transit organizations to benefit from development near transit, as well as increased income for the agency. This works well with the mobility hub concept, which could be incorporated in a joint development on transit property. Additionally, mobility hubs, stops or other passenger amenities could be financed by the private sector as part of a development. Special Taxing Districts Taxing districts, such as Community Improvement Districts (CID) or Transportation Development Districts (TDD), can be used to pay for the upfront capital or ongoing operations of transportation projects in a given area. The success of the Kansas City Downtown Streetcar as a TDD showcases how this type of financing can be used to support multimodal investments. Development Impact Fees Impact fees are fees imposed by local governments on new or proposed developments to help pay for public services that serve the development, such as transit service that improves job access. Vehicle Registration and Rental Fees These fees are additional fees applied to the registration or rental of vehicles. The states of Kansas and Missouri collect vehicle registration fees and may have limitations on the use of these funds. Rental fees can be collected by local governments and states. Parking Fees Parking fees can be levied on users or parking space owners. For spaces owned by the transit agency, the full revenues can be applied to transit service. In other cases, an incremental tax could be applied on city-owned spaces, especially in areas where discouraging vehicle use is needed to relieve congestion or increase safety for pedestrians. Tax Increment Financing Tax Increment Financing (TIF) is used as subsidy for redevelopment and infrastructure projects. Future property tax revenues are diverted within a defined area to help pay for an economic development project. TIF should be used in areas where economic development supports and uplifts existing neighborhoods and builds vibrant places that integrate transit and mobility services.
Implementation Strategies The following section provides strategies to support the implementation of the strategies and recommendations in Section 7 of this plan. Specifically, these strategies provide guidance in the areas of leadership, service standards, engagement, marketing and education, engagement, partnerships, funding and accountability. Carrying out these strategies will require the continued collaboration and coordination of the Smart Moves partners and oversight of the Regional Transit Coordinating Council. Leadership Leadership strategies focus on mobilizing relevant committees to oversee and/or guide elements of Smart Moves implementation. In addition, this section recommends growing leadership in transit and

_____________________________________________________________________________________ Smart Moves 3.0: Regional Transit and Mobility Plan 9
mobility within other existing regionally-focused organizations, potential partners in the private sector, and at the neighborhood level.
Strategy: Charge the Regional Transit Coordinating Council (RTCC) with oversight and accountability of Smart Moves implementation. The RTCC, established in 2013, and the growing partnerships among KCATA, Johnson County Transit, Unified Government Transit, Kansas City Streetcar, and the city of Independence demonstrate increasingly effective models for agency coordination. The RTCC will be charged with implementation of the Smart Moves plan, including periodic review of the recommended investment strategies, and ensuring continuous progress. This responsibility will necessitate an evaluation of the council’s current membership, agenda structure, and general administration. The RTCC will continue its important role in regional coordination with a focus on identifying strategies to optimize transit administration, operations and services across municipal boundaries.
Responsibility: MARC and KCATA Strategy: Broaden the scope of the Mobility Advisory Committee (MAC). The MAC supports the work of the RTCC and provides guidance on matters related to older adults and individuals with disabilities. The scope of this committee should be expanded to include coordination of other mobility services, like Rideshare, vanpool and RideKC Freedom, and focus on issues related to innovative service coordination and models, funding, education and marketing. Broadening of the MAC’s scope will require evaluating and aligning the membership structure to adequately take on this charge.
Responsibility: MARC and KCATA Strategy: Charge the Sustainable Places Policy Committee (SPPC) with advisory oversight into land use and development-related elements of implementing the Smart Moves plan. The SPPC was formed in 2015 as an outgrowth of the four-year Creating Sustainable Places initiative. It provides leadership and policy advice to MARC’s Board of Directors on regional sustainable development. Under the guidance of the SPPC, MARC works with local communities to update and implement land-use strategies that support transportation, equity, environment and conservation principles. The SPPC and its members will be instrumental in developing a mobility hub planning model as well as developing new resources to encourage and promote transit-oriented development.
Responsibility: MARC Strategy: Identify local champions of transit within local government, civic organizations and the business community and engage as projects are developed for implementation. In order for the Smart Moves plan to be successful, the RTCC and planning team should identify new influential leaders who can act as advocates, generate new support for transit and mobility,

_____________________________________________________________________________________ Smart Moves 3.0: Regional Transit and Mobility Plan 10
and clearly communicate transit priorities. These champions will support and elevate the transit conversation within the region.
Responsibility: Smart Moves partners Strategy: Develop a leadership academy for area residents to nurture effective grassroots leadership. The Smart Moves planning team should collaborate with local transit advocacy or other groups to develop a transit-based leadership development program that builds deeper awareness of regional transit governance, operations, planning processes and regional challenges, and provides guidance on promoting and communicating about the Smart Moves plan.
Responsibility: MARC and KCATA
Service Standards Service standards help transit agencies make sure that the fixed-route and other services they provide run in the areas, for the times of day, and at the frequency that is warranted by demand, need, and other factors.
Strategy: Employ established standards and benchmarks to guide the evolution of transit service and technologies. KCATA has developed service standards that govern the growth of routes in its system. These standards serve as the benchmarks for determining if a route is ready to add frequency or hours of service. Below is a table that defines the KCATA’s current service types, as they are described in the Service Standards, and a comparison to the closest Smart Moves 3.0 service type.
Figure 28: Service Type
KCATA’s Service Guidelines Service Type Smart Moves 3.0 Service Type Key Corridor Routes Fast and Frequent Urban Local Routes 30-Minute Network
Suburban Local Routes 30-Minute and Local Network
Commuter Routes Express Service Lifeline Services Mobility On Demand
New services should be implemented following the guidelines in the KCATA Service Standards, based on service type, for service routing and route spacing. Considerations for service enhancements should be based on the benchmarks for each service type related to span of service, service frequency and passenger loadings. Following these parameters allows for a consistent and technical approach to introducing and enhancing services in the system.
Responsibility: KCATA

_____________________________________________________________________________________ Smart Moves 3.0: Regional Transit and Mobility Plan 11
Engagement, Marketing and Education The following strategies were identified by the Smart Moves planning team to respond to the need to create a strong, educated base of support for transit and mobility in the region. These strategies constitute action that will take place within the first 10 years of the plan with the intention to further engage with local leadership to refine the plan, engage in outreach activities, educate the community about the importance of transit, as well as how transit and mobility services can be tailored to meet specific needs in the region.
Strategy: Develop a coordinated marketing and education effort among Smart Moves partners. Information about the Smart Moves plan should be readily available and regularly presented through a variety of channels and formats in order to build broad understanding of the vision and build support. The Smart Moves team should jointly develop messaging that will resonate with target audiences including local leadership, businesses, civic groups and the public. These jointly-developed educational materials should be consistently used by Smart Moves partners at meetings and for outreach.
Responsibility: Smart Moves partners
Strategy: Establish an Engagement and Outreach Workgroup to oversee and execute an outreach and engagement plan that supports the implementation of Smart Moves. A new workgroup will be developed to audit and coordinate existing outreach and engagement efforts and implement new outreach strategies for Smart Moves. Members of this workgroup should include MARC, KCATA, and other members of the Smart Moves team. This work group will also identify new partnership opportunities through engagement activities.
Responsibility: MARC and KCATA Strategy: Convene local leadership through workshops or similar forums to advance the implementation of Smart Moves. Local government leaders will be convened to develop consensus on near-term priorities and begin developing a local funding roadmap to implement these priorities. The near-term roadmap for funding will include advancing projects through MARC’s competitive programming of sub-allocated funds, which will be coordinated through the Regional Transit Coordinating Council.
Responsibility: MARC Strategy: Develop and implement a series of transit field trips for elected officials and civic leaders. MARC and KCATA will develop informative field trips that will help inform elected and civic leaders about the benefits of transit in a hands-on setting. These leaders will learn about transit

_____________________________________________________________________________________ Smart Moves 3.0: Regional Transit and Mobility Plan 12
governance and operations, regional and local needs, and directly interact with the system by riding the bus.
Responsibility: MARC and KCATA Strategy: Continue and coordinate outreach and engagement with major employers or employer groups in the region. MARC and KCATA have regular contact with local employers, primarily to share information about programs, new services or service changes. When appropriate, MARC and KCATA should jointly participate in meetings with employers and regularly inform one another of upcoming employer engagement opportunities. Meeting outcomes should be shared with the Smart Moves team partners at technical team meetings.
Responsibility: Smart Moves partners Strategy: Continue to engage and inform civic organizations. The Smart Moves planning team will continue to work with the civic and non-profit communities to encourage organizations to advocate for mobility solutions that benefit the people and organizations they serve.
Responsibility: Smart Moves partners
Strategy: Continue to share information about the Smart Moves 3.0 vision and recommendations, and seek feedback on new concerns and priorities from the public. MARC and KCATA will seek opportunities to share information about the Smart Moves 3.0 plan and other transit initiatives with the public. These opportunities may include piggy-backing on other public participation or outreach activities (e.g. during metropolitan transportation planning, employments fairs), in-person and online Transit Stakeholder Forums, pop-up engagements along transit routes, etc. Smart Moves partners will continue to solicit feedback on transit and mobility needs in the region and on specific projects from users of public transit and other interested parties.
Responsibility: Smart Moves partners Partnerships Strategy: Build new partnerships with educational institutions to identify new mobility solutions. KCATA will continue to work with local universities, colleges and other places of education to maintain existing and build new programs that provide mobility options for current and future students.
Responsibility: KCATA

_____________________________________________________________________________________ Smart Moves 3.0: Regional Transit and Mobility Plan 13
Strategy: Explore partnerships with transportation networks companies (TNCs) and other private for-profit providers. KCATA should look for opportunities to partner with TNCs, such as Uber and Lyft, to fill niche mobility demand in areas where traditional bus service is not efficient or appropriate.
Responsibility: KCATA Strategy: Continue building partnerships with private nonprofit transportation providers. The Smart Moves planning partners should continue to build partnerships with private transportation providers in order to fill gaps in the system (e.g., first- and last-mile options and geographic gaps in service) and/or increase efficiency in areas where public and private service may overlap.
Responsibility: MARC and KCATA Strategy: Participate in and partner with employer and human resources roundtables throughout the region. The Smart Moves partners will continue to participate in employer roundtables to learn about mobility challenges and work to build partnerships with employers in ways that address those needs with innovative mobility solutions. Responsibility: Smart Moves partners Funding Strategy: Coordinate and develop a list of project priorities to submit for MARC’s sub-allocated program funds. The Smart Moves team partners, with input from the RTCC, will develop a list of project priorities. Priorities should be derived from the Smart Moves plan and in coordination with local governments. Staff should communicate this list of transit and mobility priority projects to the appropriate MARC programming committees.
Responsibility: MARC and KCATA Strategy: Increase general ridership and expand services for which ridership is counted and reported to increase formula funds coming in to the Kansas City region. The regional Smart Moves transit partners should work towards improving the accessibility, utility and ease of use of existing services in order draw new riders to the system. Additionally, KCATA should begin including the ridership of private, nonprofit transportation providers in reports to the National Transit database in order to increase federal formula funds allocations.
Responsibility: KCATA Strategy: Establish a funding taskforce to develop a roadmap for a sustainable funding structure to support near- and long-term public transit and mobility needs.

_____________________________________________________________________________________ Smart Moves 3.0: Regional Transit and Mobility Plan 14
MARC and KCATA will create a taskforce in cooperation with the Core 4 Initiative (a collaboration of Johnson County, the Unified Government of Wyandotte County/Kansas City, Kansas, Jackson County and Kansas City, Missouri) that will be charged with developing realistic funding scenarios to support the implementation of the Smart Moves 3.0 plan.
Responsibility: MARC Accountability Strategy: Track and report progress made toward implementing the Smart Moves plan. MARC and KCATA will track the implementation of important elements of the Smart Moves plan using metrics identified in Section VI. Defining the Smart Moves 3.0 System. These metrics will be reported to the Regional Transit Coordinating Council annually.
Responsibility: MARC and KCATA