smart webinar #6: moving goods in a smart mobility system
TRANSCRIPT

DECEMBER 3, 2020
MOVING GOODS IN A SMART MOBILITY SYSTEM
DAVID ANDERSONProgram ManagerEnergy Efficient Mobility Systems (EEMS)Vehicle Technologies Office U.S. Department of Energy
For more information, contact:[email protected]
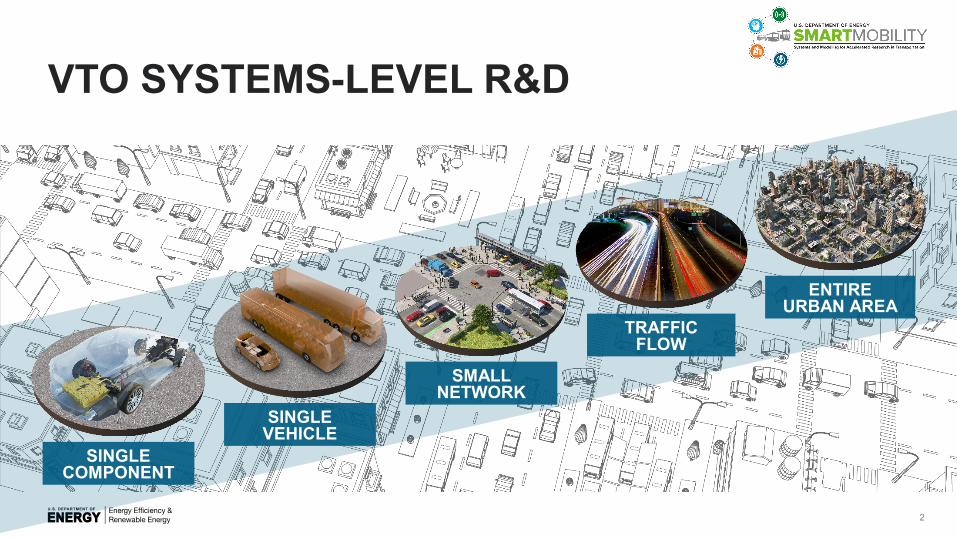
VTO SYSTEMS-LEVEL R&D
2
SINGLE COMPONENT
SMALL NETWORK
ENTIRE URBAN AREA
TRAFFIC FLOW
SINGLE VEHICLE
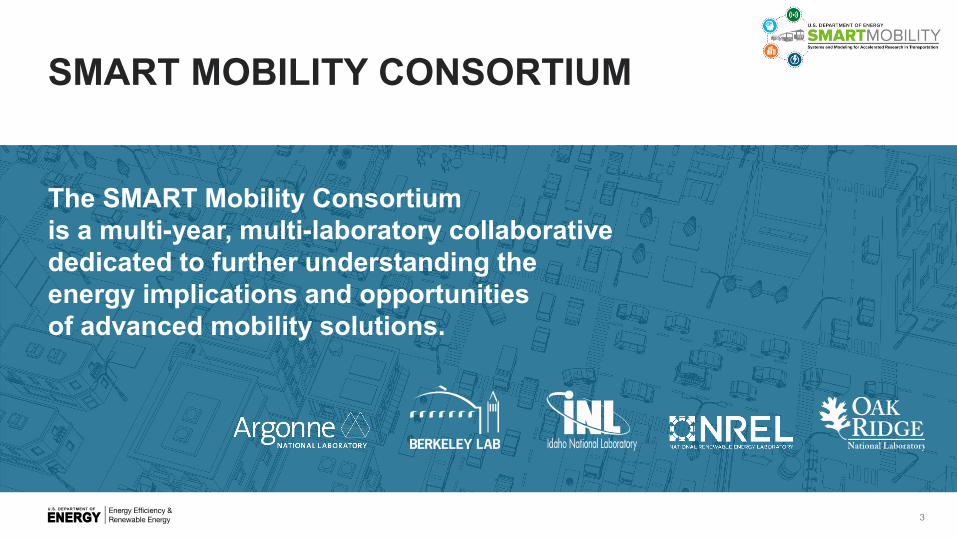
SMART MOBILITY CONSORTIUM
The SMART Mobility Consortium is a multi-year, multi-laboratory collaborative dedicated to further understanding the energy implications and opportunities of advanced mobility solutions.
3
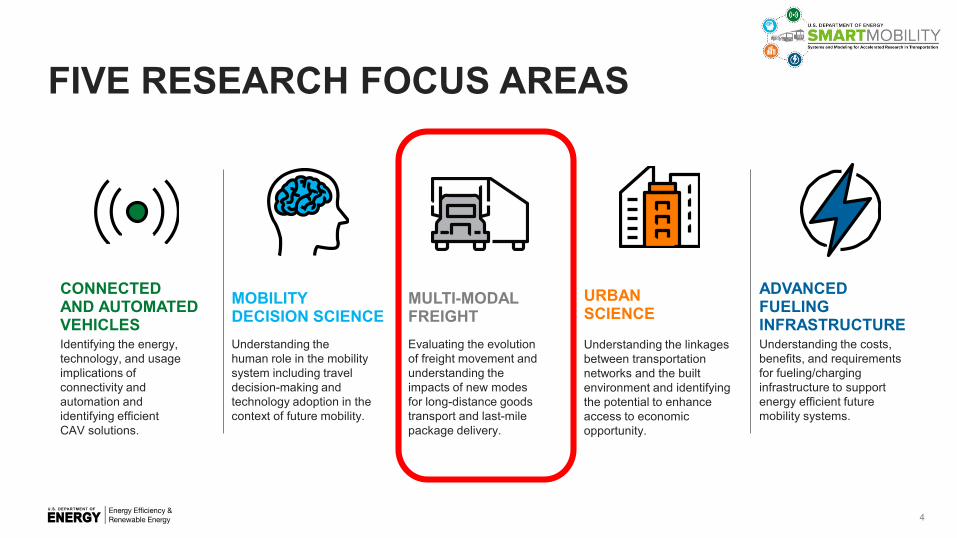
FIVE RESEARCH FOCUS AREAS
ADVANCED FUELINGINFRASTRUCTUREUnderstanding the costs, benefits, and requirements for fueling/charging infrastructure to support energy efficient future mobility systems.
URBANSCIENCE
Understanding the linkages between transportation networks and the built environment and identifying the potential to enhance access to economic opportunity.
MOBILITYDECISION SCIENCEUnderstanding the human role in the mobility system including travel decision-making and technology adoption in the context of future mobility.
CONNECTED AND AUTOMATEDVEHICLESIdentifying the energy, technology, and usage implications of connectivity and automation and identifying efficient CAV solutions.
MULTI-MODALFREIGHTEvaluating the evolution of freight movement and understanding the impacts of new modes for long-distance goods transport and last-mile package delivery.
4
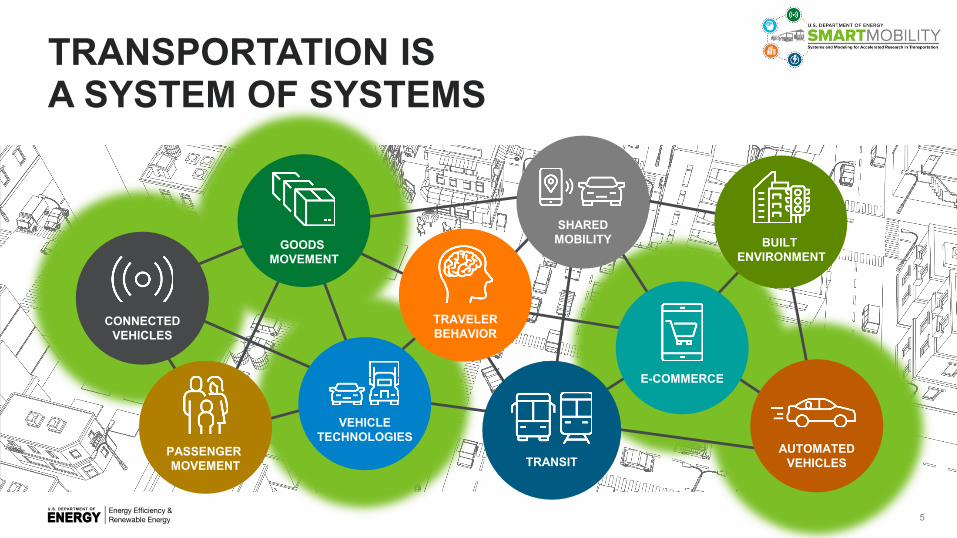
SHARED MOBILITY
TRANSIT
E-COMMERCE
TRAVELERBEHAVIOR
CONNECTEDVEHICLES
BUILT ENVIRONMENT
PASSENGER MOVEMENT
GOODS MOVEMENT
VEHICLE TECHNOLOGIES
AUTOMATEDVEHICLES
TRANSPORTATION IS A SYSTEM OF SYSTEMS
5

U.S. E-Commerce Sales as a Percent of Total SalesSource: Marketplace Pulse, U.S. Department of Commerce
Source: Kevork Djansezian/Getty Images

U.S. E-Commerce Sales as a Percent of Total SalesSource: Marketplace Pulse, U.S. Department of Commerce
Source: Kevork Djansezian/Getty Images
Source: iStock
Source: Shutterstock
Source: Kevork Djansezian/Getty Images
Source: Shutterstock Source: Kevork Djansezian/Getty Images
DOE’s Request for Information onMedium/Heavy Duty Truck R&D
Webinar on Key Findings:Tuesday, December 15, 20201:00 – 4:00pm ESThttps://www.energy.gov/eere/vehicles/events/webinar-discuss-key-findings-does-request-information-support-medium-and-heavy

FREIGHT MOVEMENT WILL BEINCREASINGLY IMPORTANTDue to increased light duty electrification and freight demand
33%CURRENT MD/HD
TRANSPORTATION ENERGY
CHICAGO
9

FREIGHT MOVEMENT WILL BEINCREASINGLY IMPORTANTDue to increased light duty electrification and freight demand
50%FUTURE MD/HD
TRANSPORTATION ENERGY
CHICAGO
10
11
MOVING GOODSIN ASMART MOBILITY SYSTEM

MOBILITY FOR OPPORTUNITY
FOR MORE INFORMATION
David AndersonProgram ManagerEnergy Efficient Mobility Systems (EEMS) Vehicle Technologies OfficeU.S. Department of [email protected]
12
DECEMBER 3, 2020
MOVING GOODS IN A SMART MOBILITY SYSTEM: NEW FREIGHT MODES AND TECHNOLOGIES
ALICIA BIRKYEmerging Freight TechnologiesCenter for Integrated Mobility SciencesNational Renewable Energy Laboratory
For more information, contact:[email protected]

MOVEMENT OF GOODS BY TRUCKS IS CRITICAL TO THE ECONOMY AND MOBILITYShare of highway energy is expected to grow
14
12.414.6
16.4
0
3
6
9
12
15
18
21
24
27
2020 2035 2045
Annu
al F
AF c
omm
odity
flow
(bill
ion
tons
)
Projected National Freight Movement (FAF)
Air (Includes Truck-Air)
Other & Unknown
Multiple Modes & Mail
Water
Rail
Pipeline
Truck
15.312.3 12.1
6.8
6.6 7.2
0
5
10
15
20
25
2020 2035 2050
Qua
ds
National Highway Energy by ModeAEO 2020
Commercial Trucks
Bus
Light Duty
Note: projections made pre-COVID

HOW WILL EMERGING FREIGHT TECHNOLOGIES IMPACT ENERGY CONSUMPTION?
New urban delivery modes– Drones– Vehicle electrification– Parcel lockers
Technologies for Class 7-8 regional to long-haul freight trucks– Truck platooning– Vehicle electrification
Individual Technology Assessments
15

NEW URBAN DELIVERY MODES
16

WALK
BIKE
DRIVE
INCREMENTALTRIP
PARCELLOCKER
DELIVERYWAREHOUSE
PARCEL LOCKERS MAY BE AN INNOVATIVE LAST MILE SOLUTIONConsumer transport choice may negate commercial EV impact
17
200%ENERGY 12%
ENERGY
30%ENERGYGAS SUV EV
EXACOPTERDRONE

LAST MILE DELIVERY MODES
Evaluate energy-saving potential:
Characterize drone energy consumption via testing
Use real world data to – Estimate parcel freight delivery demand– Establish freight delivery tour locations and routes
Model baseline and alternative scenarios using innovative modes and methods
Calculate energy consumption for each scenario
Support system level analysis by:
Modeling freight origin facilities and service areas
Estimating and modeling delivery tours for baseline energy usage
Estimating freight deliveries that are replacing passenger vehicle shopping trips within Chicago
Approach
18
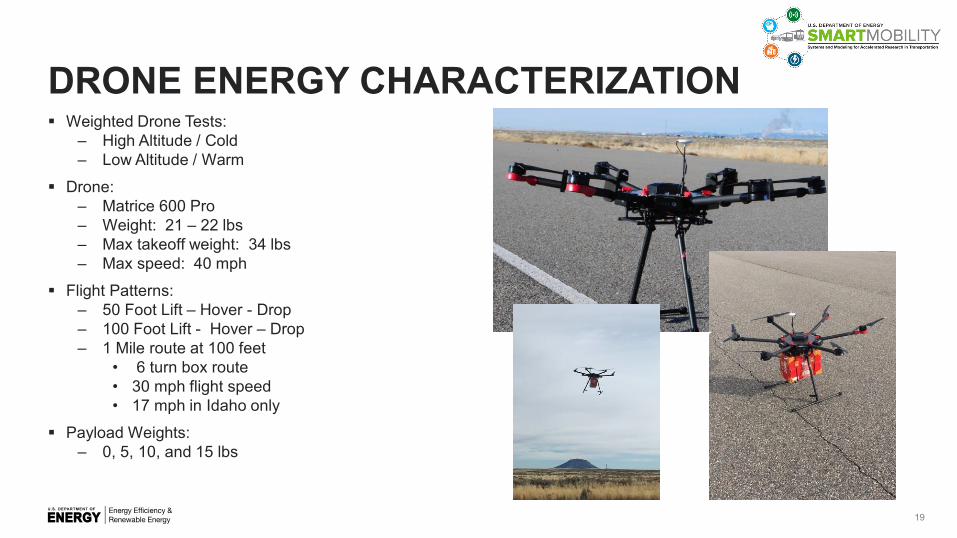
DRONE ENERGY CHARACTERIZATION Weighted Drone Tests:
– High Altitude / Cold– Low Altitude / Warm
Drone:– Matrice 600 Pro– Weight: 21 – 22 lbs– Max takeoff weight: 34 lbs– Max speed: 40 mph
Flight Patterns:– 50 Foot Lift – Hover - Drop– 100 Foot Lift - Hover – Drop– 1 Mile route at 100 feet
• 6 turn box route• 30 mph flight speed• 17 mph in Idaho only
Payload Weights:– 0, 5, 10, and 15 lbs
19
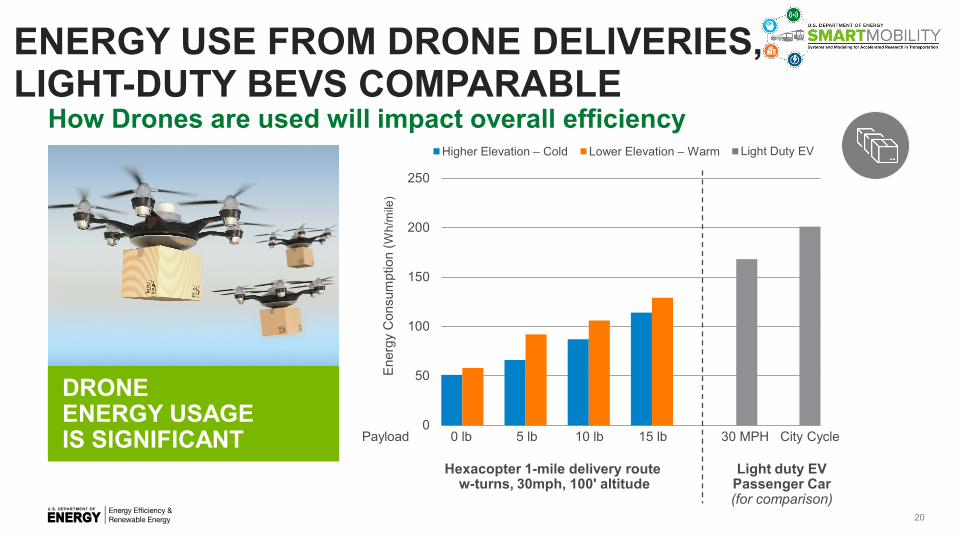
ENERGY USE FROM DRONE DELIVERIES, LIGHT-DUTY BEVS COMPARABLE
How Drones are used will impact overall efficiency
0
50
100
150
200
250
Higher Elevation – Cold Lower Elevation – Warm Light Duty EV
Ener
gy C
onsu
mpt
ion
(Wh/
mile
)
Payload 0 lb 5 lb 10 lb 15 lb 30 MPH City Cycle
Hexacopter 1-mile delivery routew-turns, 30mph, 100' altitude
Light duty EV Passenger Car (for comparison)
20
DRONE ENERGY USAGE IS SIGNIFICANT

EV
Tru
ck to
Loc
ker
Del
iver
y to
doo
r by
:
Cus
tom
er
Ret
rieve
s by
:
Die
sel T
ruck
to L
ocke
r
Del
iver
y to
doo
r by
:
Cus
tom
er
Ret
rieve
s by
:
PARCEL LOCKER ANALYSIS RESULTSEnergy impact depends on carrier and consumer transport choice
21
- Customers driving SI SUVs to pick up their package in a dedicated trip could increase energy by >200% (over standard diesel delivery to homes).
- Customers driving EVs to pick up their package in a dedicated trip could increase overall energy by ~10%.
- Home package deliveries by drone could reduce overall energy by 30%.
0.00 0.20 0.40 0.60 0.80 1.00
Diesel truck depot to doorFoot
Sedan (ICE)SUV (ICE)
EVQuadcopterHexacopter
BotEV truck depot to doorEV vans depot to door
FootSedan (ICE)
SUV (ICE)EV
QuadcopterHexacopter
Bot
Total Fleet-Wide Energy Usage (GWh)
Baseline
+ 205%+12%
-30%
-77%
-72%
+ 163%

TECHNOLOGIES FOR REGIONAL & LONG-HAUL FREIGHT
22
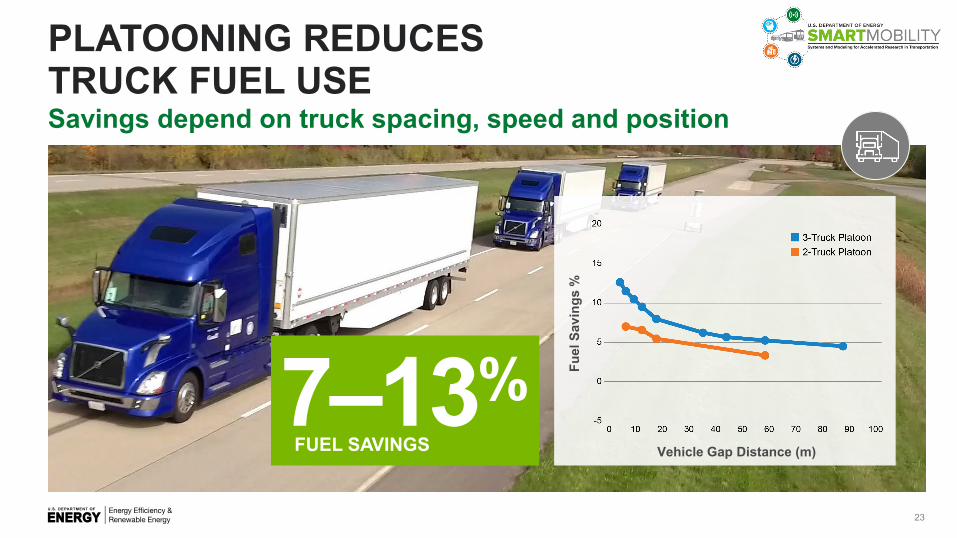
PLATOONING REDUCES TRUCK FUEL USE Savings depend on truck spacing, speed and position
7–13%FUEL SAVINGS
Fuel
Sav
ings
%
Vehicle Gap Distance (m)
23
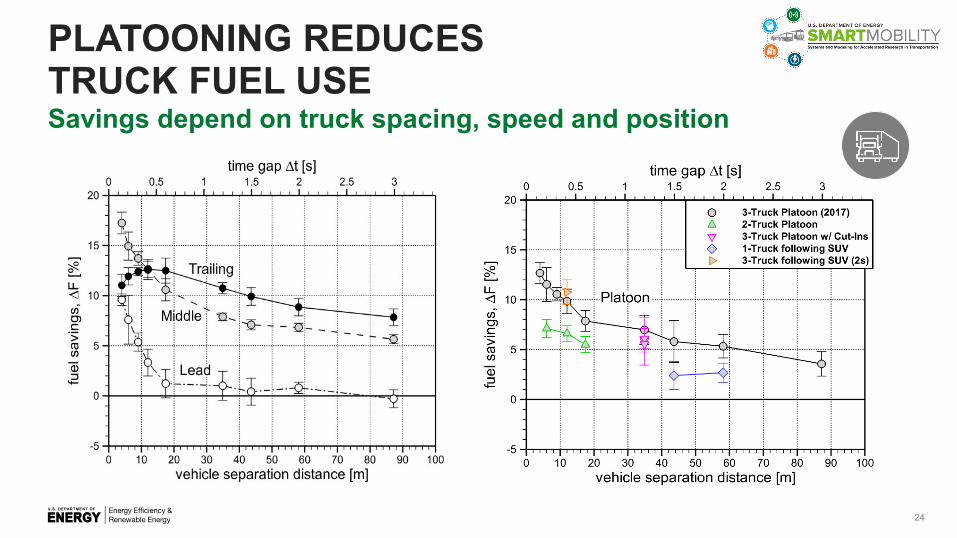
PLATOONING REDUCES TRUCK FUEL USE Savings depend on truck spacing, speed and position
24
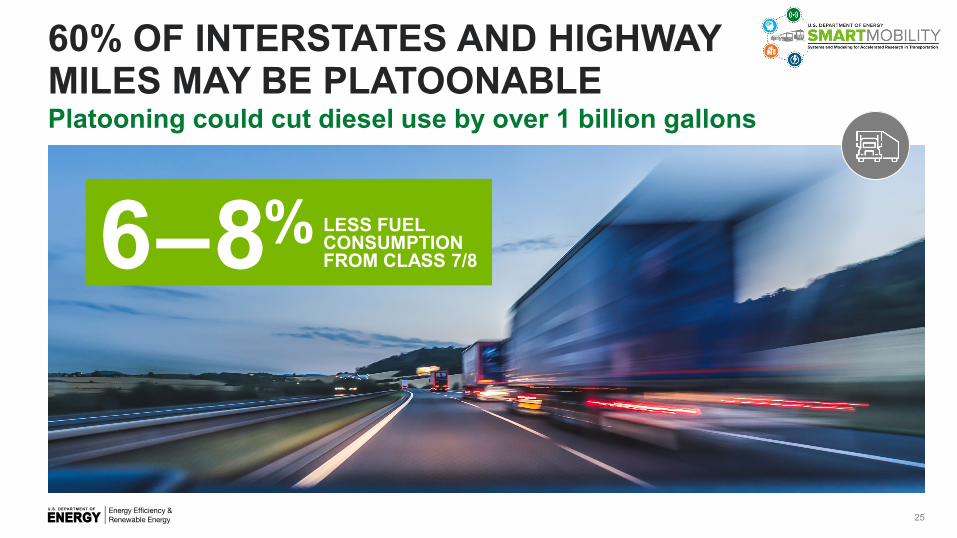
60% OF INTERSTATES AND HIGHWAY MILES MAY BE PLATOONABLEPlatooning could cut diesel use by over 1 billion gallons
LESS FUEL CONSUMPTION FROM CLASS 7/86–8%
25
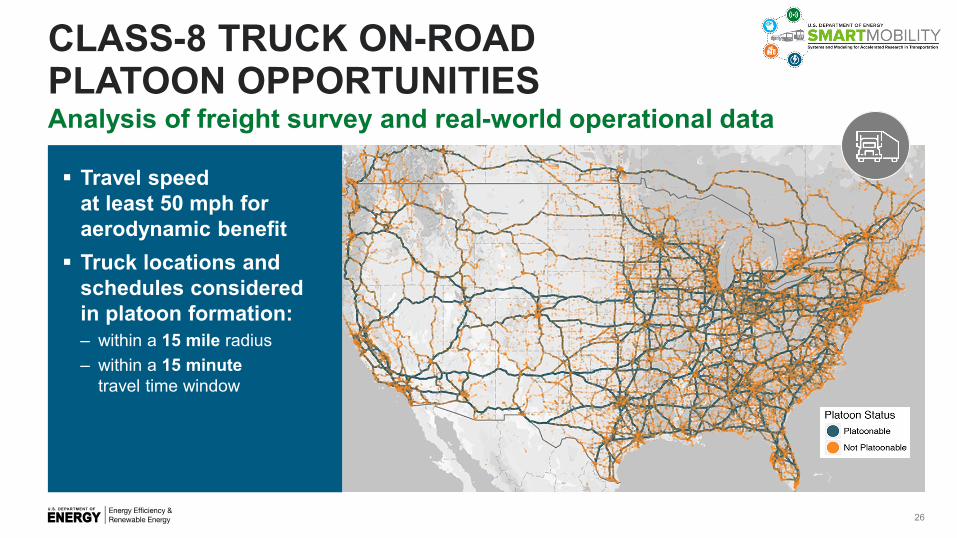
CLASS-8 TRUCK ON-ROAD PLATOON OPPORTUNITIESAnalysis of freight survey and real-world operational data
26
Travel speed at least 50 mph for aerodynamic benefit Truck locations and
schedules considered in platoon formation:– within a 15 mile radius– within a 15 minute
travel time window
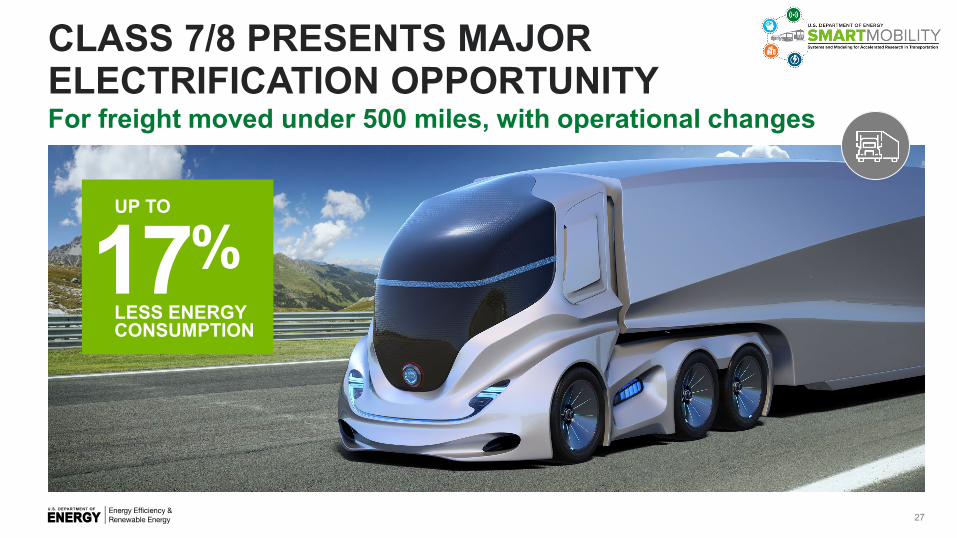
CLASS 7/8 PRESENTS MAJOR ELECTRIFICATION OPPORTUNITYFor freight moved under 500 miles, with operational changes
17%LESS ENERGYCONSUMPTION
UP TO
27
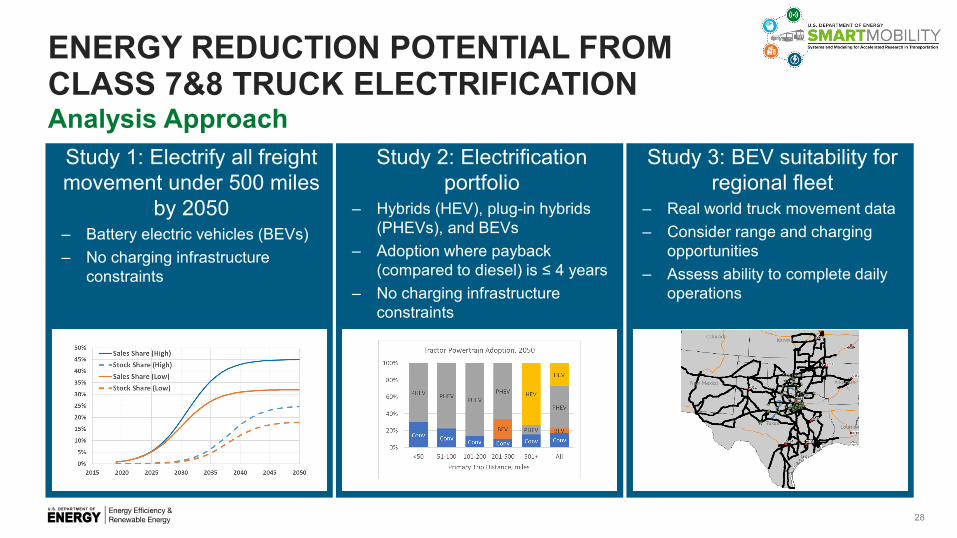
ENERGY REDUCTION POTENTIAL FROM CLASS 7&8 TRUCK ELECTRIFICATION
Study 1: Electrify all freight movement under 500 miles
by 2050– Battery electric vehicles (BEVs)– No charging infrastructure
constraints
Analysis Approach
28
Study 2: Electrification portfolio
– Hybrids (HEV), plug-in hybrids (PHEVs), and BEVs
– Adoption where payback (compared to diesel) is ≤ 4 years
– No charging infrastructure constraints
Study 3: BEV suitability for regional fleet
– Real world truck movement data– Consider range and charging
opportunities– Assess ability to complete daily
operations
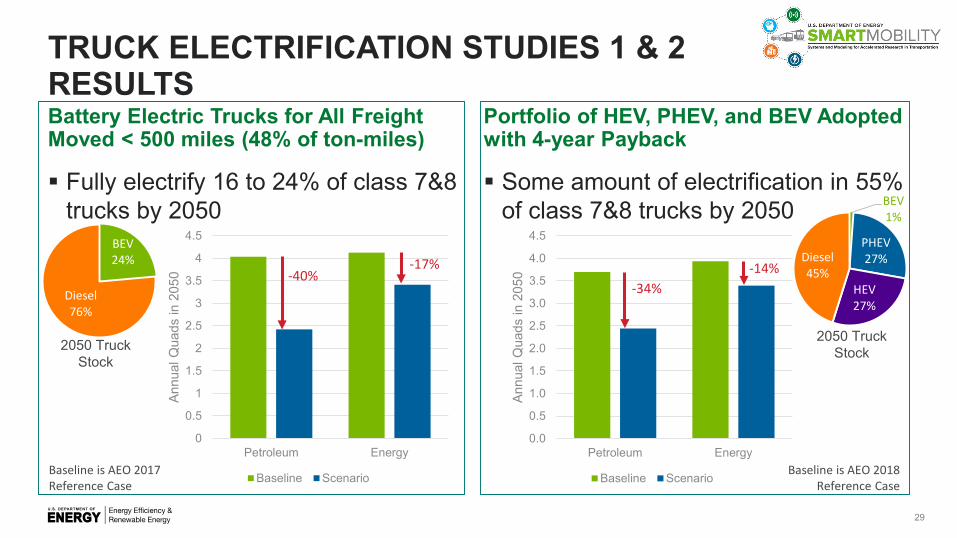
TRUCK ELECTRIFICATION STUDIES 1 & 2 RESULTS
Fully electrify 16 to 24% of class 7&8 trucks by 2050
Battery Electric Trucks for All Freight Moved < 500 miles (48% of ton-miles)
29
Some amount of electrification in 55% of class 7&8 trucks by 2050
Portfolio of HEV, PHEV, and BEV Adopted with 4-year Payback
BEV24%
Diesel76%
BEV1%
PHEV27%
HEV27%
Diesel45%
0
0.5
1
1.5
2
2.5
3
3.5
4
4.5
Petroleum Energy
Annu
al Q
uads
in 2
050
Baseline Scenario
0.0
0.5
1.0
1.5
2.0
2.5
3.0
3.5
4.0
4.5
Petroleum Energy
Annu
al Q
uads
in 2
050
Baseline ScenarioBaseline is AEO 2017 Reference Case
Baseline is AEO 2018 Reference Case
-40%-17% -14%
-34%
2050 Truck Stock
2050 Truck Stock
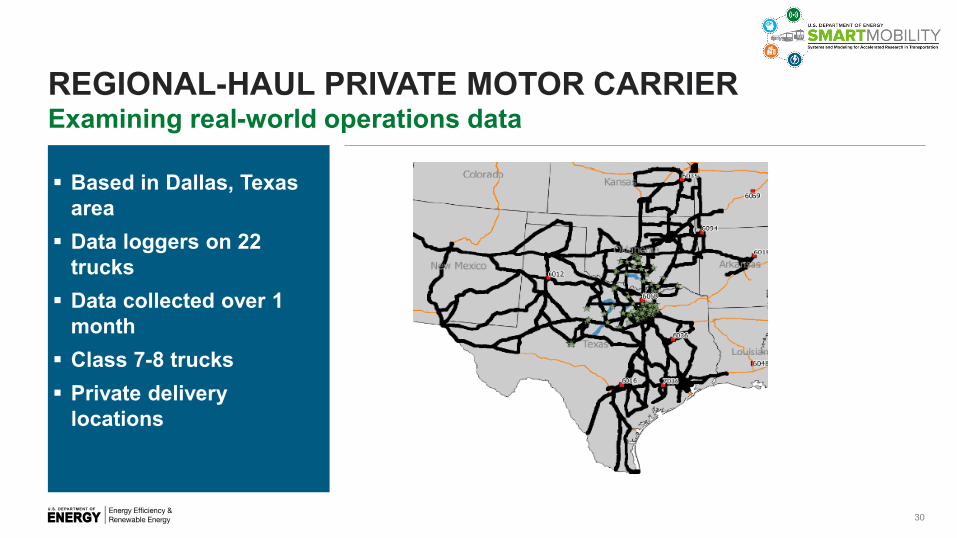
REGIONAL-HAUL PRIVATE MOTOR CARRIERExamining real-world operations data
Based in Dallas, Texas area Data loggers on 22
trucks Data collected over 1
month Class 7-8 trucks Private delivery
locations
30

REGIONAL-HAUL PRIVATE MOTOR CARRIERSingle vehicle used in varied ways
A trip is travel between delivery locations or regional distribution centers (RDC) A circuit is the group of
trips starting from and returning to the home RDC Assume charging entire
time stopped at an RDC
31
Summary of Single Truck Case Study
Total distance driven (miles) 3,733
Number of trips 24
Total dwell time (hours) 142
Number of trips exceeding 300-mile range
4
Number of trips exceeding 500-mile range
0
Circuits (trip chains starting and ending at home RDC)
6
Number of stops at home and other RDCs
11
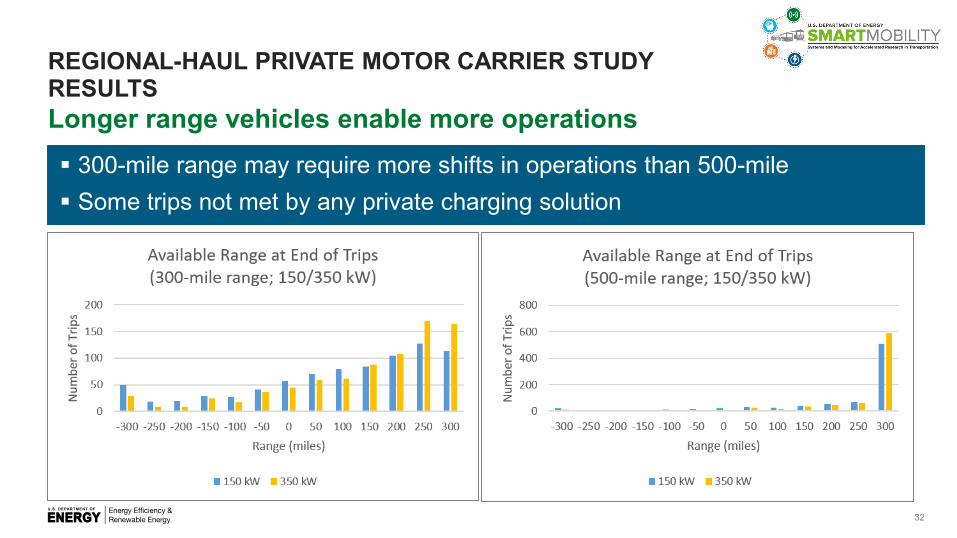
REGIONAL-HAUL PRIVATE MOTOR CARRIER STUDY RESULTS
300-mile range may require more shifts in operations than 500-mile Some trips not met by any private charging solution
Longer range vehicles enable more operations
32
THANKS TO THE MULTI-MODAL FREIGHT PILLAR LEAD AND PRINCIPAL INVESTIGATORS
David Smith, ORNLAmy Moore, ORNLVictor Walker, INLJoanne Zhou, ANL
Kyungsoo Jeong, NREL
33

MOBILITY FOR OPPORTUNITY
34
FOR MORE INFORMATION
Alicia BirkyEmerging Freight TechnologiesCenter for Integrated Mobility Sciences National Renewable Energy [email protected]

DECEMBER 3, 2020
MOVING GOODS IN A SMART MOBILITY SYSTEM:METROPOLITAN ANALYSIS
MONIQUE STINSONComputational Transportation ScientistVehicle and Mobility Systems (VMS) Energy Systems DivisionArgonne National Laboratory
For more information, contact:[email protected]
36
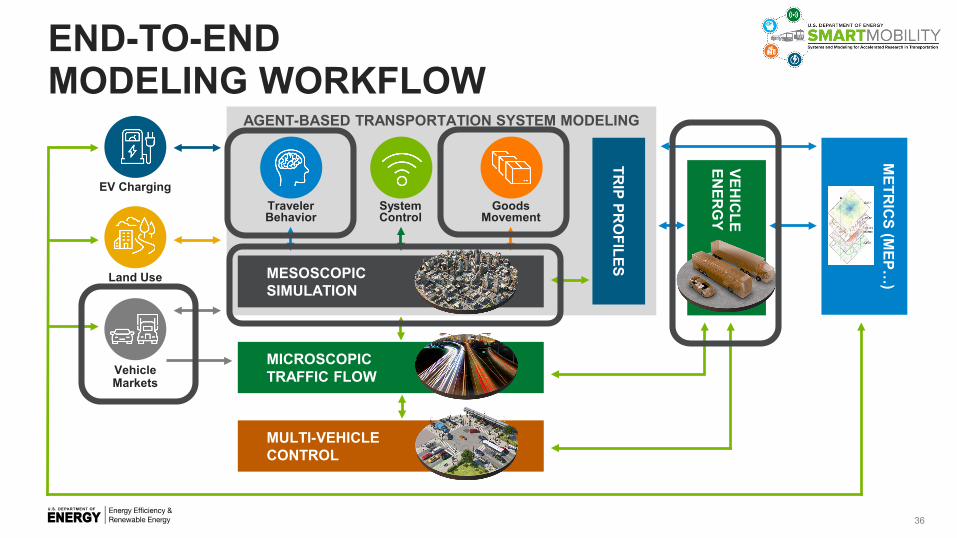
EV Charging
Land Use
VehicleMarkets
MICROSCOPIC TRAFFIC FLOW
MULTI-VEHICLE CONTROL
AGENT-BASED TRANSPORTATION SYSTEM MODELING
TRIP PR
OFILES
TravelerBehavior
SystemControl
GoodsMovement
METR
ICS (M
EP…)
VEHIC
LEEN
ERG
Y
MESOSCOPIC SIMULATION
END-TO-END MODELING WORKFLOW
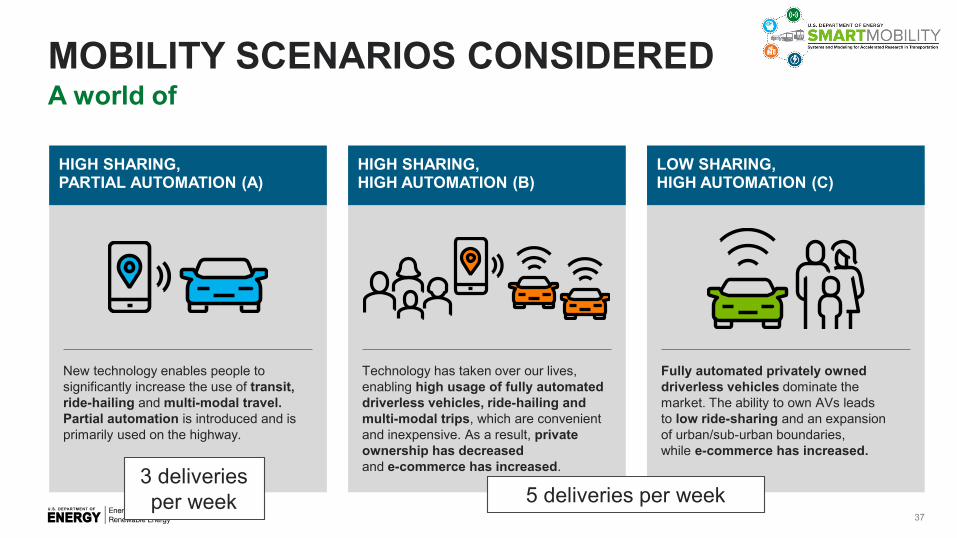
MOBILITY SCENARIOS CONSIDEREDA world of
New technology enables people to significantly increase the use of transit, ride-hailing and multi-modal travel. Partial automation is introduced and is primarily used on the highway.
Technology has taken over our lives, enabling high usage of fully automated driverless vehicles, ride-hailing and multi-modal trips, which are convenient and inexpensive. As a result, private ownership has decreased and e-commerce has increased.
Fully automated privately owned driverless vehicles dominate the market. The ability to own AVs leads to low ride-sharing and an expansion of urban/sub-urban boundaries, while e-commerce has increased.
LOW SHARING, HIGH AUTOMATION (C)
HIGH SHARING, HIGH AUTOMATION (B)
HIGH SHARING, PARTIAL AUTOMATION (A)
37
3 deliveries per week 5 deliveries per week
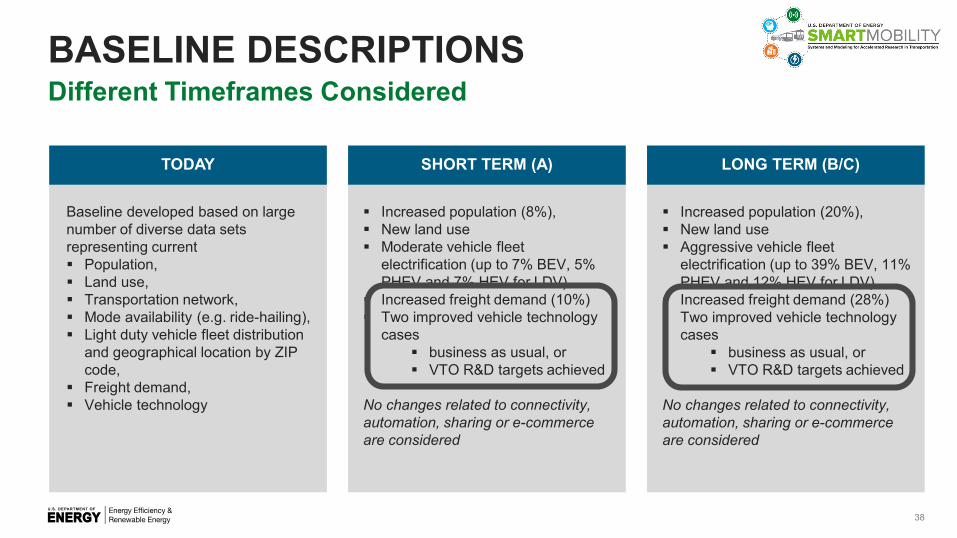
BASELINE DESCRIPTIONSDifferent Timeframes Considered
38
Baseline developed based on large number of diverse data sets representing current Population, Land use, Transportation network, Mode availability (e.g. ride-hailing), Light duty vehicle fleet distribution
and geographical location by ZIP code,
Freight demand, Vehicle technology
Increased population (20%), New land use Aggressive vehicle fleet
electrification (up to 39% BEV, 11% PHEV and 12% HEV for LDV)
Increased freight demand (28%) Two improved vehicle technology
cases business as usual, or VTO R&D targets achieved
No changes related to connectivity, automation, sharing or e-commerce are considered
LONG TERM (B/C)SHORT TERM (A)TODAY
Increased population (8%), New land use Moderate vehicle fleet
electrification (up to 7% BEV, 5% PHEV and 7% HEV for LDV)
Increased freight demand (10%) Two improved vehicle technology
cases business as usual, or VTO R&D targets achieved
No changes related to connectivity, automation, sharing or e-commerce are considered
RESEARCH QUESTIONS
39

RESEARCH QUESTION:NET EFFECT OF E-COMMERCE
40
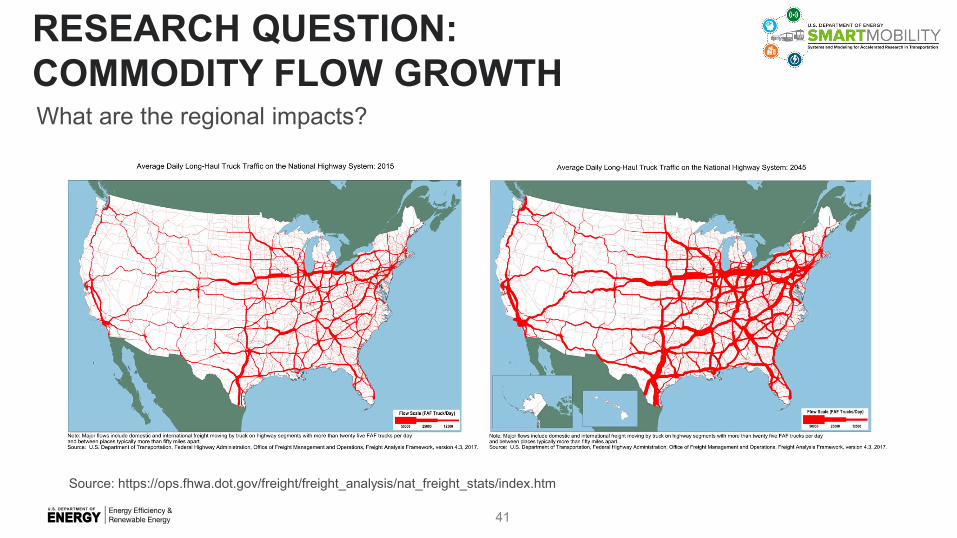
RESEARCH QUESTION:COMMODITY FLOW GROWTH
41
Source: https://ops.fhwa.dot.gov/freight/freight_analysis/nat_freight_stats/index.htm
What are the regional impacts?
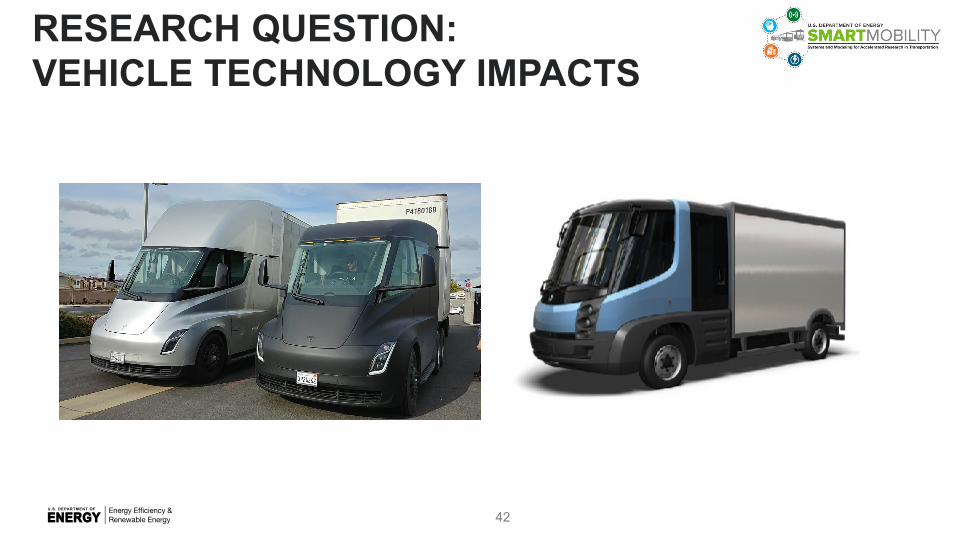
RESEARCH QUESTION:VEHICLE TECHNOLOGY IMPACTS
42
APPROACH
43

“TOP-DOWN” FREIGHT MODEL
44
CMAP: Chicago Metropolitan Agency for
PlanningCDOT: Chicago DOT
FHWA: Federal Highway Administration
FAF: Freight Analysis Framework
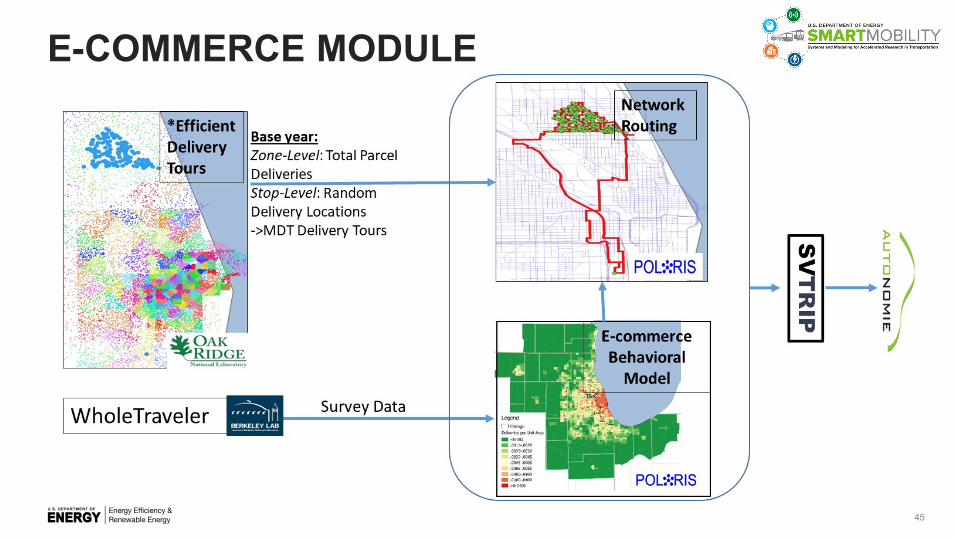
E-COMMERCE MODULE
45

HOUSEHOLD E-COMMERCE DEMAND BEHAVIORAL MODEL
46
Binary Choice: Whether Participates in E-commerce or not Variables Estimates t-stat Constant -0.103 -1.64 # of HH Children 0.104 1.39 HH income less than 25k -0.459 -2.33 HH income between 25k and 50k -0.54 -3.37 HH income between 50k and 100k -0.154 -1.41 HH income greater than 200k 0.355 3.32 Distance to nearest transit stop from home (in 100th of miles) 0.077 1.18
Ratio of Delivery to Retail Shopping Parameters to the latent propensity Constant 2.882 11.7 # of HH Adults -0.146 -2.49 HH income greater than 200k 0.369 3.29 Walk Score (Range 0 to 10) -0.057 -3 # of HH Vehicle -0.18 -2.8 Threshold Parameters
Theta 0 -ve
Infinity Fixed Theta 1 0 Fixed Theta 2 1.576 11.86 Theta 3 2.162 15.74 Theta 4 2.738 19.23 Theta 5 3.482 22.34
Theta 6 +ve
Infinity Fixed Summary Number of Observations 971 Final Log-likelihood -1362.45
More e-commerce demand for households with:• Higher incomes• More children
Less e-commerce demand for households with:• More vehicles• Fewer adults• Residence is walkable or
close to transit

REGIONAL FREIGHT IMPACTS
47

In the Chicago Area Today, *MDT and *HDT Make Up 10% VMT and One-Third of Energy
48
*MDT, HDT: Medium-duty truck, heavy-duty truck
Regional and long-haul HDT
Household shopping:6% of VMT
MDT-Other: landscaping, mail, and more
MDT-Retail:major, non-mail parcel carriers
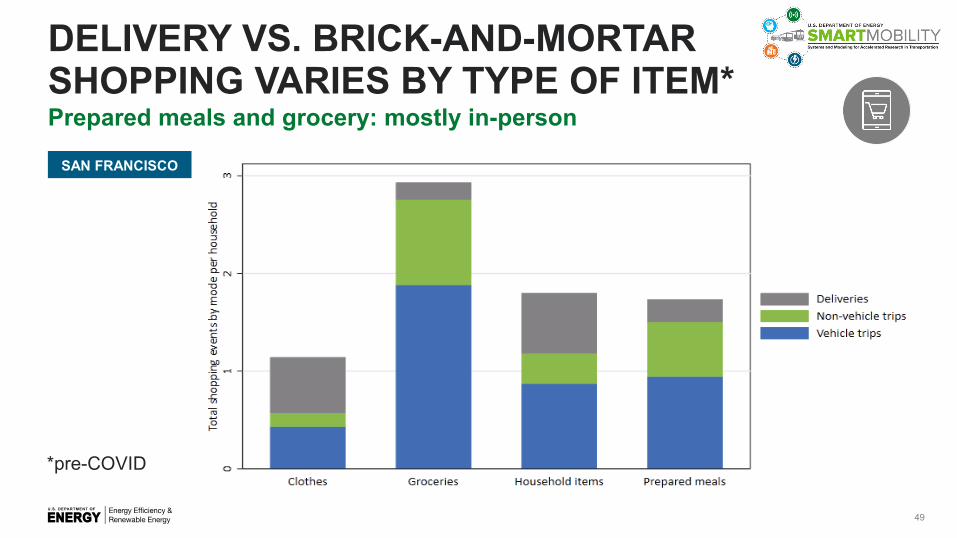
DELIVERY VS. BRICK-AND-MORTAR SHOPPING VARIES BY TYPE OF ITEM*Prepared meals and grocery: mostly in-person
49
SAN FRANCISCO
*pre-COVID

TODAY: 1 IN 7 SHOPPING EVENTS HAS BEEN REPLACED BY A DELIVERY TRIP Deliveries replace both vehicle trips and non-vehicle trips
50
Substitution
Induced demandSAN FRANCISCO
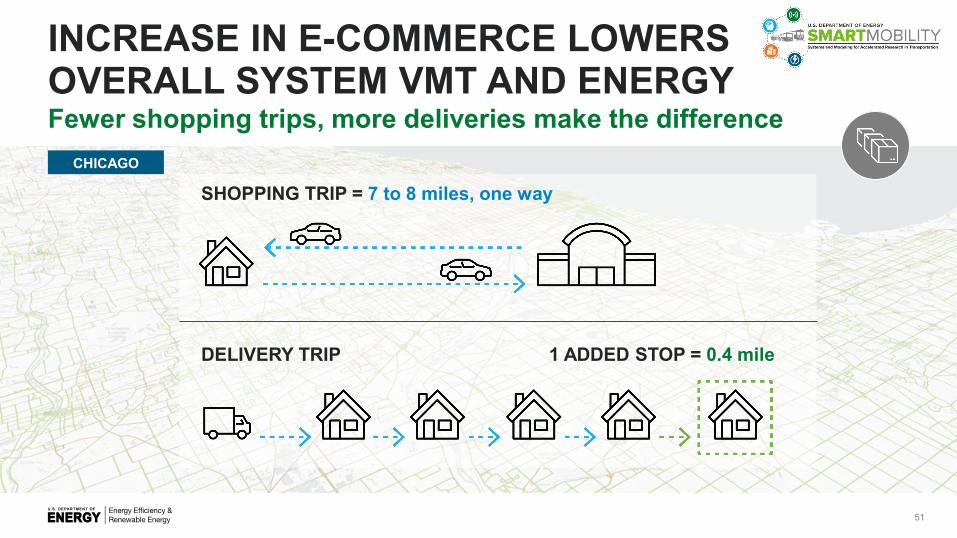
INCREASE IN E-COMMERCE LOWERS OVERALL SYSTEM VMT AND ENERGYFewer shopping trips, more deliveries make the difference
51
SHOPPING TRIP = 7 to 8 miles, one way
DELIVERY TRIP 1 ADDED STOP = 0.4 mile
CHICAGO

HOME DELIVERIES CAN DECREASE TRANSPORTATION ENERGY USE Energy savings from e-commerce and vehicle technologies
CHICAGO
52
0
5
10
15
20
25VMT IMPACT
VMT, MDT Delivery VMT, LDV Shopping
56% 41%
Ret
ail V
MT
(Mill
ion
Mile
s)
0
2
4
6
8
10
12
14
16ENERGY COMPARISON
Energy, MDT Delivery Energy, LDV Shopping
Ret
ail T
otal
Ene
rgy
(GW
h)
54% 29%
HIGH SHARINGHIGH AUTOMATION
LOW SHARINGHIGH AUTOMATIONBASE HIGH SHARING
HIGH AUTOMATIONLOW SHARING
HIGH AUTOMATIONBASE

FREIGHT MOVEMENT WILL BEINCREASINGLY IMPORTANTDue to increased light duty electrification and freight demand
CHICAGO
53
33%CURRENT MD/HD
TRANSPORTATION ENERGY
281,324,908
22,870,366
MD/HDLD
300M
200M
100M
0M 0
200
400
VMT
Tota
l GW
hr
308
150
VMT ENERGY
BASE
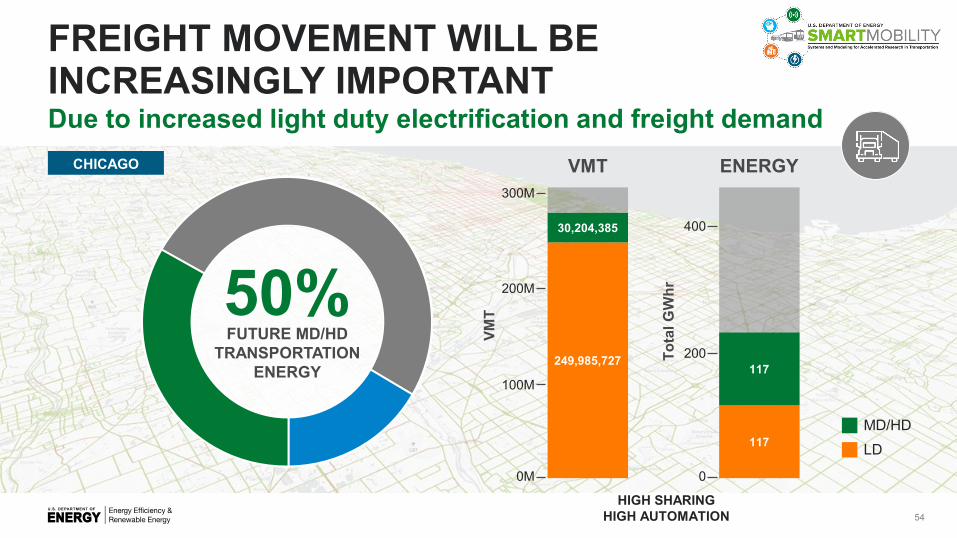
FREIGHT MOVEMENT WILL BEINCREASINGLY IMPORTANTDue to increased light duty electrification and freight demand
50%FUTURE MD/HD
TRANSPORTATION ENERGY
CHICAGO
54
249,985,727
30,204,385
MD/HDLD
300M
200M
100M
0M 0
200
400
VMT
Tota
l GW
hr
117
VMT ENERGY
117
HIGH SHARINGHIGH AUTOMATION
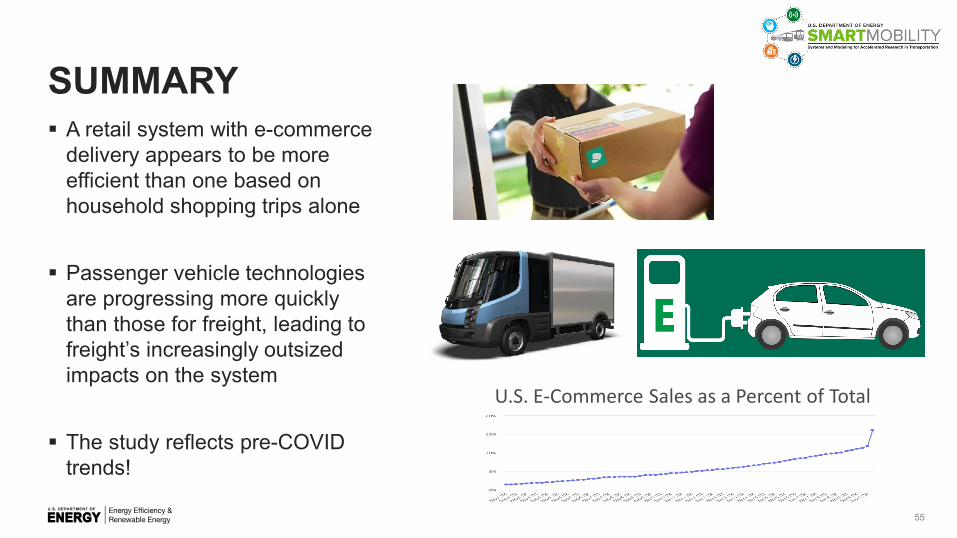
SUMMARY A retail system with e-commerce
delivery appears to be more efficient than one based on household shopping trips alone
Passenger vehicle technologies are progressing more quickly than those for freight, leading to freight’s increasingly outsized impacts on the system
The study reflects pre-COVID trends!
55
U.S. E-Commerce Sales as a Percent of Total Sales
Source: Marketplace Pulse, U.S. Department of Commerce

ACKNOWLEDGEMENTSAnnesha Enam, Argonne National LaboratoryVincent Freyermouth, Argonne National LaboratoryAmy Moore, Oak Ridge National LaboratoryAnna Spurlock, Lawrence Berkeley National LaboratoryVictor Walker, Idaho National Laboratory
56
MOBILITY FOR OPPORTUNITY
FOR MORE INFORMATION
Monique StinsonComputational Transportation ScientistVehicle and Mobility Systems (VMS) Energy Systems DivisionArgonne National [email protected]
57