smart products nigeria plc reports and …€¦ · dr. moses o. ajaja pastor akinrinola o. laoye,...
TRANSCRIPT
SMART PRODUCTS NIGERIA PLC
REPORTS AND FINANCIAL STATEMENTS
FOR THE YEAR ENDED 31 DECEMBER, 2017
SMART PRODUCT NIGERIA PLC
FINANCIAL STATEMENTS FOR THE
YEAR ENDED 31 DECEMBER, 2017
CONTENTS PAGE
Corporate information 1
Results at a glance 2
Report of the directors 3
Independent auditors’ report 10
Report of the audit committee 12
Statement of financial position 13
Statement of comprehensive income 14
Statement of changes in equity 15
Statement of cash flows 16
Notes to the financial statements 17
Other national disclosures
Statement of value added 37
Five-year financial summary 38

-Page 1-
SMART PRODUCTS NIGERIA PLC
CORPORATE INFORMATION
Directors: High Chief (Sir) Simeon O. Oguntimehin, OON, FCA - Chairman
Abiola A. Aderonmu, Esq.,
Dr. Moses O. Ajaja
Pastor Akinrinola O. Laoye,
Adejinle O. Adeniji, Esq., Company Secretaries: Alpha-Genasec Limited, Kresta Laurel Complex (4
th Floor),
376, Ikorodu Road, Maryland, Lagos. Tel: 01-7744873 E-mail: [email protected]
Registered office: 373, Agege Motor Road,
Challenge,
Mushin,
Lagos.
Tel: 01-8131274
Registration number: RC 4738
Independent Auditors: Baker Tilly Nigeria,
(Chartered Accountants),
Kresta Laurel Complex (4th Floor),
376, Ikorodu Road, Maryland,
Lagos.
Tel: 01-9501307
E-mail: [email protected]
Registrars: Meristem Registrars Limited,
213, Herbert Macaulay Street,
Adekunle, Yaba,
Lagos.
Tel: 01-2717350
E-mail: [email protected]

Bankers: Diamond Bank Plc
Sterling Bank Plc
-Page 2-
SMART PRODUCTS NIGERIA PLC
RESULT AT A GLANCE
2017 2016 Percentage
N N Change
Gross revenue 43,945,726 49,816,227 (11)
Profit before taxation 9,664,533 19,948,385 (51)
Profit after taxation 8,703,012 12,836,251 (33)
Share equity 22,500,000 22,500,000 -
Equity attributable to owners 92,382,677 76,433,738 (21)
Per share data:
Earnings (in kobo) 19.34 28.53
Net assets (in kobo) 205.29 169.85
Dividend declared (in kobo) 10 22.5

-Page 3-
SMART PRODUCTS NIGERIA PLC
REPORT OF THE DIRECTORS
1. The directors hereby submit their report and the financial statements of the company for
the financial year ended 31 December, 2017.
2. Result N
Profit before taxation 9,664,533
Income tax expense (2,212,897)
Deferred taxation 1,251,376
Profit after taxation 8,703,012
========
3. Legal form
The company as Associated Press Limited was incorporated on 11 January, 1966 as a
private limited liability company and commenced operation as a legal entity
immediately. The name was changed to Smurfit Print Nigeria Limited in 1987 and was
subsequently converted to a public limited liability company in 1991 which made it
change its name to Smurfit Print Nigeria Plc. The name was changed to Smart Products
Nigeria Plc on 25 September, 2005.
4. Principal activities
The company continued to rely on rental income and profit on investment during the
year under review.
5. Review of operational performance
A profit before tax of N9,664,533 was achieved in 2017 compared with a profit before
tax of N19,948,386 in the preceding year. The drop in rent was due to economy
downturn which affected the legacy tenant’s business and led to default in rent, coupled
with some unoccupied spaces.
6. Directors
The names of the directors of the company are as stated on page 1 of these reports and
financial statements.
7. Directors’ interests
(i) The directors’ interests in the company’s shares as at 31 December, 2017 were as
follows:-
No. of shares
2017 2016
High Chief (Sir) S. O. Oguntimehin, OON- indirect 106,750 106,750
(Anfani Investment)
Abiola Aderonmu, Esq., 24,783,579 24,783,579
Dr. M.O. Ajaja 250,000 250,000
Pastor Akinrinola O. Laoye 409,000 409,000
-Page 4-
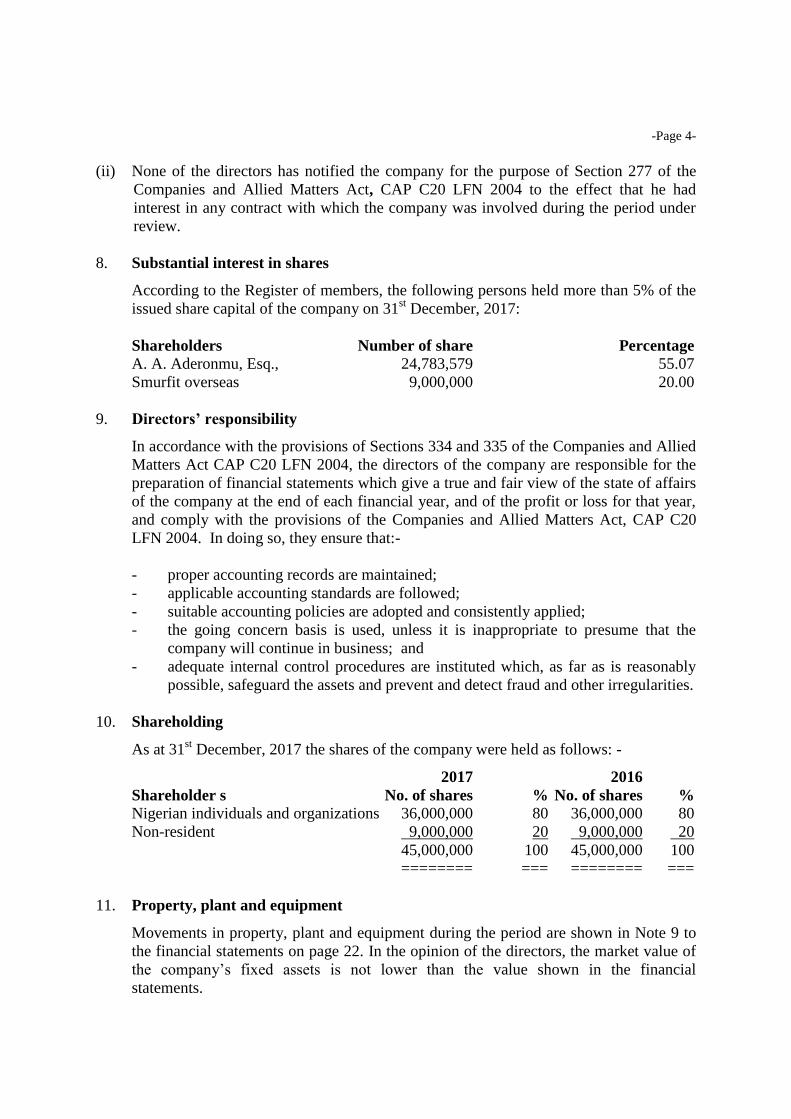
(ii) None of the directors has notified the company for the purpose of Section 277 of the
Companies and Allied Matters Act, CAP C20 LFN 2004 to the effect that he had
interest in any contract with which the company was involved during the period under
review.
8. Substantial interest in shares
According to the Register of members, the following persons held more than 5% of the
issued share capital of the company on 31st December, 2017:
Shareholders Number of share Percentage
A. A. Aderonmu, Esq., 24,783,579 55.07
Smurfit overseas 9,000,000 20.00
9. Directors’ responsibility
In accordance with the provisions of Sections 334 and 335 of the Companies and Allied
Matters Act CAP C20 LFN 2004, the directors of the company are responsible for the
preparation of financial statements which give a true and fair view of the state of affairs
of the company at the end of each financial year, and of the profit or loss for that year,
and comply with the provisions of the Companies and Allied Matters Act, CAP C20
LFN 2004. In doing so, they ensure that:-
- proper accounting records are maintained;
- applicable accounting standards are followed;
- suitable accounting policies are adopted and consistently applied;
- the going concern basis is used, unless it is inappropriate to presume that the
company will continue in business; and
- adequate internal control procedures are instituted which, as far as is reasonably
possible, safeguard the assets and prevent and detect fraud and other irregularities.
10. Shareholding
As at 31st December, 2017 the shares of the company were held as follows: -
2017 2016
Shareholder s No. of shares % No. of shares %
Nigerian individuals and organizations 36,000,000 80 36,000,000 80
Non-resident 9,000,000 20 9,000,000 20
45,000,000 100 45,000,000 100
======== === ======== ===
11. Property, plant and equipment
Movements in property, plant and equipment during the period are shown in Note 9 to
the financial statements on page 22. In the opinion of the directors, the market value of
the company’s fixed assets is not lower than the value shown in the financial
statements.
-Page 5-
12. Dividend
The directors recommend payment of dividend of 10 kobo per 50 kobo share amounting
to N4.5 million compared to dividend of 22.5k per 50 kobo share paid in 2016
(N10.125 million).
13. Personnel
(i) Employment of disabled persons:
The company does not discriminate in considering applications for employment
Including those from disabled persons. All employees are given equal
opportunities to develop their knowledge and skills within the organisation. As at
31 December, 2017 there were, however, no disabled persons in the company’s
employment.
(ii) Employee’s involvement and training:
The company is committed to keeping employees fully informed as far as
possible regarding its performance and progress and seeking their views whenever
practicable, on matters which particularly affect them as employees.
The company provides a range of training from time to time with potential
broadening opportunities for employees’ career development within the
organisation.
(iii) Staff welfare and safety at work:
The company places high premium on its human resources and there is existing
provision for lunch, rent and transport allowances. The company conducts its
activities in a way to take foremost account of the safety of its employees and other
persons.
14. Corporate Governance Report
Corporate Governance principles, rules and regulatory requirements of the Nigerian
Stock Exchange and Securities and Exchange Commission have indeed been an integral
part of the way Smart Products Nigeria Plc conducts its business.
The Company has always been guided by a strong conviction of adhering to
transparency, accountability, good management practices and integrity through the
adoption and monitoring of corporate strategies, goals and procedures to comply with
its legal and ethical responsibilities.
It believes that the implementation of global best practices and corporate governance
principles would help to achieve commitment and goals to enhance stakeholders’ value.
We therefore present in detail, the Board activities in the last financial year as follows:

-Page 6-
i. The Board Composition and its Committees
- The Board has overall responsibility for ensuring that the Company is
appropriately managed and achieves its strategic objectives.
- The company’s Articles of Association provide that the company’s Board
shall consist of not more than 8 Directors. During the year the Board
comprised of five non- executive Directors. - The Company’s Board comprises of a non- executive Chairman and Directors,
all bringing high levels of competencies and experience, with enviable records
of achievement in their respective fields. - The Board meets regularly to set broad policies for the Company’s business
and operations, and ensures that a professional relationship is maintained with
the Company’s auditors in order to promote transparency in financial and non-
financial reporting.
ii. Role of the Board
- The Board is responsible for the review of goals, major plans of action, annual
budget and business plans with overall strategies setting performance
objectives, monitoring implementation and corporate performance and
overseeing major capital expenditure in the approved budget.
- Ensuring proper accounting records which disclose with reasonable accuracy
at any time, the financial status of the company are maintained and that the
financial reporting systems comply with the Companies and Allied Matters
Act, CAP C20, LFN 2004.
- Through the establishment of the Board Committees, making
recommendations and taking decisions on issues of expenditure that may arise
outside the normal meeting schedule of the full Board.
- Ratifying duly approved recommendations and decisions of the Board
Committees.
- Periodic and regular review of actual business performance relative to
established objectives.
- The Board has supervisory responsibility for overall budgetary planning,
major treasury planning and commercial strategies.
- The Board has responsibility for review and approval of internal controls and
risk management policies and processes.
iii. Analysis of Shareholding as at 31 December, 2017
No. of
Range Holders Holders % Holders Units
Cumm Units Units % Cum.
1 - 1,000 1,430 63.92% 1,430 728,843 1.62% 728.843
1,001 - 5,000 651 29,10% 2,081 1,354,389 3.01% 2,083,232
5,001 - 10,000 62 2,77% 2,143 433,007 0.95% 2,516,239
10,001- 50,000 62 2,77% 2,205 1,230,697 2.74% 3,746,936
50,001 - 100,000 11 0.49% 2,216 750,345 1.67% 4,497,281
100,001 - 500,000 15 0.67% 2,231 3,349,980 7.45% 7,847,261
500,001 -1,000,000 1 0.04% 2,252 675,000 1.50% 8,522,261
1,000,001- above 5 0.22% 2,237 36,457,239 81.05% 44,979,500
Grand Total 2,237 100.00% 44,979,500 100%
==== ===== ======== =====
-Page 7-
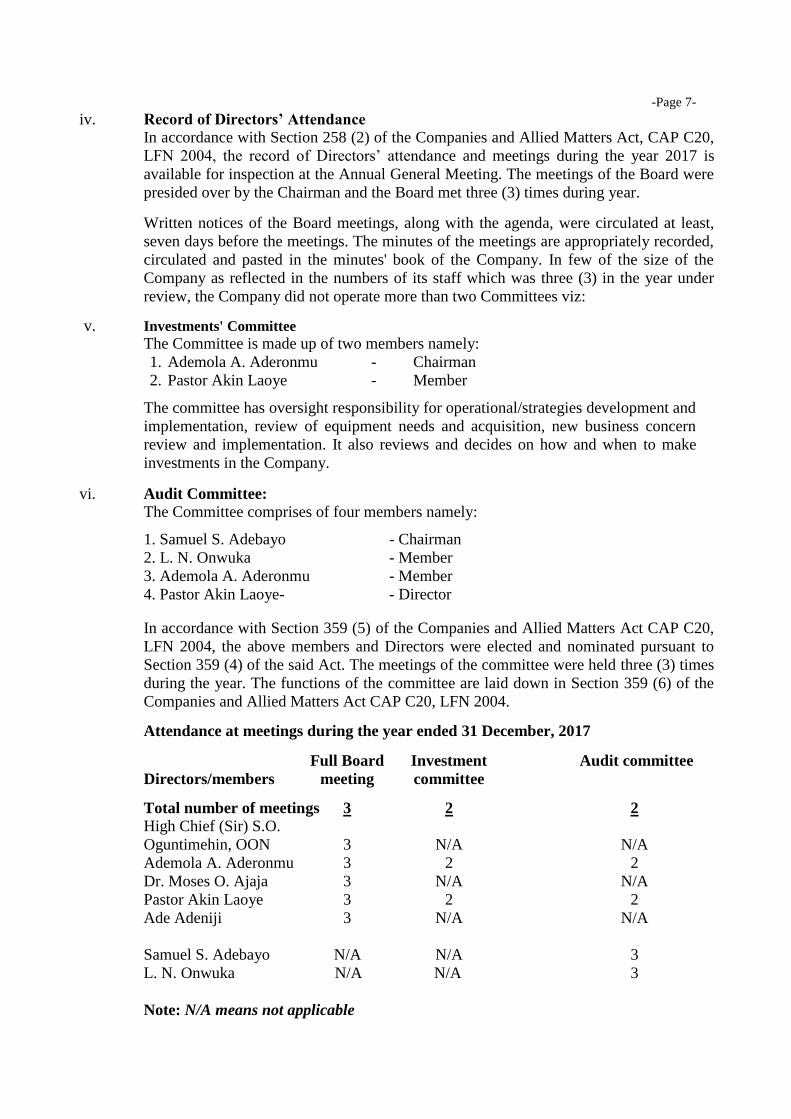
iv. Record of Directors’ Attendance
In accordance with Section 258 (2) of the Companies and Allied Matters Act, CAP C20,
LFN 2004, the record of Directors’ attendance and meetings during the year 2017 is
available for inspection at the Annual General Meeting. The meetings of the Board were
presided over by the Chairman and the Board met three (3) times during year.
Written notices of the Board meetings, along with the agenda, were circulated at least,
seven days before the meetings. The minutes of the meetings are appropriately recorded,
circulated and pasted in the minutes' book of the Company. In few of the size of the
Company as reflected in the numbers of its staff which was three (3) in the year under
review, the Company did not operate more than two Committees viz:
v. Investments' Committee The Committee is made up of two members namely:
1. Ademola A. Aderonmu - Chairman
2. Pastor Akin Laoye - Member
The committee has oversight responsibility for operational/strategies development and
implementation, review of equipment needs and acquisition, new business concern
review and implementation. It also reviews and decides on how and when to make
investments in the Company.
vi. Audit Committee: The Committee comprises of four members namely:
1. Samuel S. Adebayo - Chairman
2. L. N. Onwuka - Member
3. Ademola A. Aderonmu - Member
4. Pastor Akin Laoye- - Director
In accordance with Section 359 (5) of the Companies and Allied Matters Act CAP C20,
LFN 2004, the above members and Directors were elected and nominated pursuant to
Section 359 (4) of the said Act. The meetings of the committee were held three (3) times
during the year. The functions of the committee are laid down in Section 359 (6) of the
Companies and Allied Matters Act CAP C20, LFN 2004.
Attendance at meetings during the year ended 31 December, 2017
Full Board Investment Audit committee
Directors/members meeting committee
Total number of meetings 3 2 2
High Chief (Sir) S.O.
Oguntimehin, OON 3 N/A N/A
Ademola A. Aderonmu 3 2 2
Dr. Moses O. Ajaja 3 N/A N/A
Pastor Akin Laoye 3 2 2
Ade Adeniji 3 N/A N/A
Samuel S. Adebayo N/A N/A 3
L. N. Onwuka N/A N/A 3
Note: N/A means not applicable

-Page 8-
vii. Management Team
The day-to-day management of the business is the responsibility of the Manager
under the close supervision of the two Investments Committee members.
viii. Donations and Charitable Gifts: Although the Company did not make any donation or contribution to any charitable
organisations during the year, it is part of the policy of the Company to make such
donation(s) as and when necessary.
ix. Complaint Management:
This policy implements the Securities and Exchange Commission (SEC) Rules
relating to the Complaints Management Framework of the Nigerian Capital Market
which requires every listed Company to establish a clearly defined Complaints
Management Policy to handle and resolve complaints within the purview of the
Framework.
- Commitment:
The Management of the Company is committed to ensuring that complaints are dealt
with in responsive, efficient, effective, fair and economical way. A senior officer is
responsible for the operation of the system and the achievement of outcomes. The
Company acknowledges the right of the public and its staff to complain when
dissatisfied with a service and encourages feedback from customers, clients, staff and
the public generally wants staff to be ‘complaint friendly and not defensive or negative
about feedback and recognizes that if properly handled and analyzed, complaints and
feedback held the Company to improve its business processes, and therefore, time
spent on handling complaints is an investment in better service to the public.
Securities Trading Policy:
Insider trading and dealing in Company’s shares:
The Board has approved a securities Trading Policy which set out the guidelines on
the purchase and sale of securities by Directors, employees and associates. The policy
is to assist all Directors and employees to understand the restrictions placed on them
as insiders of the Company with respect to their securities transactions and to avoid
the conduct referred to as “insider trading” any period as may be specified by the
Company or the Exchange from time to time.
Also, Directors and employees and other insiders wishing to buy, sell or deal in the
Company’s securities must obtain approval from the Chairman through the Company
Secretary prior to any dealing in the Company’s securities. Request for approval must
state the volume of securities to be purchased and sold.
Share Capital History
Authorised share capital Issued and fully paid
Date Shares Value (N) Shares Increase Cumu. Value (N)
1964 100,000 200,000 42,837 42,837 85,674 Cash
1965 200,000 400,000 102,104 144,941 289,882 Cash
1976 500,000 1,000,000 257,552 402,493 804,986 Cash
1976 500,000 1,000,000 220,900 623,393 1,246,786 Scrip issue
1977 1,000,000 2,000,000 226,688 850,081 1,700,162 Cash
1977 4,000,000 2,000,000

-Page 9-
SUB-DIVISION OF THE
SHARE INTO 50K
EACH FROM N2 3,400,324 1,700,162
1986 8,000,000 4,000,000 377,814 3,778,138 1,889,069 Scrip issue
1987 8,000,000 4,000,000 1,889,027 5,667,165 2,833,583 Scrip issue
1989 32,000,000 16,000,000 2,883,583 8,550,748 4,275,374 Scrip issue
1990 32,000,000 16,000,000 1,889,055 10,439,803 5,219,902 Scrip issue
1991 40,000,000 20,000,000 3,778,110 14,217,913 7,108,957 Scrip issue
1992 40,000,000 20,000,000 8,450,747 22,668,660 11,334,330 Scrip issue
1993 100,000,000 50,000,000 9,067,464 31,736,124 15,868,062 Scrip issue (2for 5)
1993 100,000,000 50,000,000 7,934,032 39,670,156 19,835,078 Scrip issue (1 for 4)
1995 100,000,000 50,000,000 12,616,355 52,286,511 26,143,256 Rights issue
1995 100,000,000 50,000,000 13,851,499 66,138,010 33,069,005 Public issue
1996 100,000,000 50,000,000 8,904,800 75,042,810 37,521,406 Public issue
1997 100,000,000 50,000,000 14,957,188 90,000,000 45,000,000 Cash
1998 150,000,000 75,000,000 18,000,000 108,000,000 54,000,000 Scrip issue (1 for 5)
2003 200,000,000 100,000,000 43,200,000 151,200,000 75,600,000 Scrip issue (2 for 5)
2004 300,000,000 150,000,000 50,400,000 201,600,000 100,800,000 Scrip issue (1 for 3)
2008 500,000,000 250,000,000 100,800,000 302,400,000 151,200,000 Scrip issue (1 for 2)
2010 750,000,000 375,000,000 100,800,000 403,200,000 201,600,000 Scrip issue (1 for 3)
2011 750,000,000 375,000,000 100,800,000 504,000,000 252,000,000 Scrip issue (1 for 4)
Analysis of Shareholding as at 31 December, 2017
15. Auditors
Messrs. Baker Tilly Nigeria (Chartered Accountants) have indicated their willingness
to continue as auditors in accordance with Section 357(2) of the Companies and
Allied Matters Act, CAP C20 LFN 2004. A resolution will be proposed to authorise
the directors to fix their remuneration. By order of the Board
Alpha-Genasec Limited Company Secretaries Lagos, Nigeria FRC/2014/ICSAN/00000008037
10 April, 2018

INDEPENDENT AUDITORS' REPORT
TO THE MEMBERS OF
SMART PRODUCTS NIGERIA PLC
Report on the Audit of the Financial Statements
Opinion In our opinion, the accompanying financial statements give a true and fair view of the
financial position of Smart Products Nigeria Plc as at 31 December, 2017, its financial
performance and its cash flows for the year then ended in accordance with International
Financial Reporting Standards.
We have audited the financial statements of the Company, which comprise the statement of
financial position as at 31 December, 2017, and the statement of comprehensive income,
statement of changes in equity and statement of cash flows for the year then ended, and notes
to the financial statements, including a summary of significant accounting policies.
Basis of Opinion We conducted our audit in accordance with International Standards on Auditing (ISAs). Our
responsibilities under those standards are further described in the Auditor’s Responsibilities
for the Audit of the Financial Statements section of our report. We are independent of the
Company within the meaning of Nigerian Standards on Auditing (NSAs) issued by the
Institute of Chartered Accountants of Nigeria and have fulfilled our other responsibilities
under those ethical requirements. We believe that the audit evidence we have obtained is
sufficient and appropriate to provide a basis for our opinion.
Going Concern The Company’s financial statements have been prepared using the going concern basis of
accounting. The use of this basis of accounting is appropriate unless management either
intends to liquidate the Company or to cease operations, or has no realistic alternative but to
do so.
Management has not identified a material uncertainty that may cast significant doubt on the
entity’s ability to continue as a going concern, and accordingly none is disclosed in the
financial statements.
Based on our audit of the financial statements, we also have not identified such a material
uncertainty.
Key audit matter
The major tenant (ACE Cladding) which annually formed the bulk rental income in excess of
N24 million is facing challenges and had adversely affected the company’s income. The
tenant is owing the company in excess of N36 million as at 31 December, 2017.

-Page 11-
How the matter was addressed during the audit.
The Board had approved a 50% specific provision on rent due but unpaid in the sum of
N6.601 million at the beginning of the financial year.
Responsibilities of the Directors for the Financial Statements The Directors are responsible for the preparation and fair presentation of these financial
statements which are in compliance with the requirements of both Financial Reporting Council of
Nigeria Act, No. 6 of 2011, the Companies and Allied Matters Act, Cap C20 LFN, 2004 and
Bank and Other Financial Institutions Act Cap B3 LFN 2004. This responsibility includes:
designing, implementing and maintaining internal control relevant to the preparation and fair
presentation of the financial statements that are free from material misstatements, selecting and
applying appropriate accounting policies, and making accounting estimates that are reasonable in
the circumstances.
Auditors’ Responsibilities for the Audit of the Financial Statements Our responsibility is to express an independent opinion on these financial statements based on our
audit. We conducted our audit in accordance with Nigerian Standards on Auditing (NSAs) issued
by the Institute of Chartered Accountants of Nigeria. Those standards require that we comply
with ethical requirements and plan and perform the audit to obtain reasonable assurance that the
financial statements are free from material misstatement.
An audit involves performing procedures to obtain audit evidence about the amounts and
disclosures in the financial statements. The procedures selected depend on the auditors’
judgment, including the assessment of the risks of material misstatement of the financial
statements. In making those risk assessments, the auditor considers internal control relevant to
the entity’s preparation and fair presentation of the financial statements in order to design audit
procedures that are appropriate in the circumstances, but not for the purpose of expressing an
opinion on the effectiveness of the entity’s internal control. An audit also includes evaluating the
appropriateness of accounting policies used and the reasonableness of accounting estimates made
by the Directors, as well as evaluating the overall presentation of the financial statements.
We believe that the audit evidence we have obtained is sufficient and appropriate to provide a
basis for our opinion.
Report on Other Legal and Regulatory Requirements The Companies and Allied Matters Act, CAP C20 LFN, 2004 requires that in carrying out
our audit we consider and report to you on the following matters. We confirm that: -
i) we have obtained all the information and explanations which to the best of our
knowledge and belief were necessary for the purpose of our audit;
ii) in our opinion, proper books of accounts have been kept by the Company; and
iii) the Company’s statement of financial position and profit or loss and other
comprehensive income are in agreement with the books of accounts.
Oluwole O. Ogundeji
FRC/2013/ICAN/00000002825
On behalf of
Baker Tilly Nigeria
(Chartered Accountants)
Lagos, Nigeria
11 April, 2018

- Page 12-
SMART PRODUCTS NIGERIA PLC
AUDIT COMMITTEE REPORT
To the shareholders
We, the Audit Committee members of Smart Products Nigeria Plc in accordance with the
provision of Section 359 (6) of the Companies and Allied Matters Act, Cap C20 LFN 2004,
have carried out the following statutory functions:-
a. Confirmed that the accounting and reporting policies of the company are in accordance
with the legal requirements and agreed ethical practices;
b. Reviewed the scope and plan of the audit for the year ended 31 December, 2017; and
c. Reviewed the external and internal auditors’ recommendations on accounting
procedures and internal controls and management’s responses thereon.
In our opinion, the scope and planning of the audit for the year ended 31 December, 2017
were adequate and management’s responses to the Auditors’ findings were satisfactory.
Ade Adeniji, Esq
FRC/2013/ICAN/0000002245
For: CHAIRMAN
Members of the committee
1. Mr. Samuel Sunday Adebayo - Chairman
2. Mr. L. N. Onwuka
3. Mr. A. A. Aderonmu
4. Pastor Akin Laoye
Dated this: 10 April, 2018

-Page 13-
SMART PRODUCTS NIGERIA PLC
STATEMENT OF FINANCIAL POSITION
AS AT 31ST DECEMBER 2017
Assets: 2017 2016
Non-current: Note N N
Property, plant and equipment 9 202,522 1,752,060
Investment property 10 99,389,542 92,942,015
Available for sale financial assets 11.1 610,980 1,362,526
Deferred tax asset 7.4 1,251,376 -
101,454,420 96,056,601 ------------------ -----------------
Current:
Loans and receivables 12 51,273,217 37,750,263
Cash and cash equivalent 13 10,062,659 15,160,405
61,335,876 52,910,668 ----------------- ----------------
Total assets 162,790,296 148,967,269 =========== ==========
Liabilities
Non-current
Deferred tax liabilities 7.3 - 19,353,183
19,353,183 ----------- ----------------
Current:
Trade and other payable 14.1 18,325,555 17,161,112
Deferred income 15 16,930,195 2,989,166
Current tax payable 7.2 35,151,869 33,030,070
70,407,619 53,180,348
---------------- ----------------
Total liabilities 70,407,617 72,533,531
Equity
Issued share capital 16 22,500,000 22,500,000
Share premium 17 1,151,920 1,151,920
Asset revaluation reserve 18 81,018,020 80,663,444
Retained earnings 19 (12,287,263) (27,881,626)
Equity attributable to owners 92,382,677 76,433,738
Total liabilities and equity 162,790,296 148,967,269 ============= =============
The financial statements were approved by the Board of Directors on 10 April, 2018 and signed on its behalf by:
High Chief (Sir) Simeon O. Oguntimehin, OON, FCA Mr. Abiola A. Aderonmu Mr. Amin A. Amzat
Chairman Director Chief Finance Officer FRC/2013/ICAN/00000003428 FRC/2014/NIM/00000007253 FRC/2014/ICAN/00000006914
The accounting policies and notes on pages 17 to 37 form an integral part of these financial statements

-Page 14-
SMART PRODUCTS NIGERIA PLC
STATEMENT OF COMPREHENSIVE INCOME
FOR THE YEAR ENDED 31ST DECEMBER 2017
Note 2017 2016
N N
Revenue 3 39,292,098 44,277,693
Other income 4 4,653,628 5,538,534
Total revenue 43,945,726 49,816,227
Personnel expenses 5 (6,628,566) (7,349,198)
Other operating expenses 6 (16,464,737) (16,618,379)
Depreciation 9 & 10 (4,586,602) (5,900,264)
Specific bad debt provision (6,601,288) -
Profit before tax 9,664,533 19,948,386
Income tax expenses 7.1 (2,212,897) (5,801,834)
Deferred tax expenses 7.3 1,251,376 (1,310,301)
Profit after tax 19 8,703,012 12,836,251
Other comprehensive income
Appreciation on available for sale financial assets 11.1 354,576 16,114
Total comprehensive income for the year 9,054,788 12,852,365
======= ========
Earnings per share
Basic profit for the year attributable to
Ordinary equity holders (in kobo) 8 19.34 28.56
===== =====
The accounting policies and notes on pages 17 to 37 form an integral part of these financial statement

-Page 15-
SMART PRODUCTS NIGERIA PLC
STATEMENT OF CHANGES IN EQUITY
FOR THE YEAR ENDED 31ST DECEMBER, 2017
Issued share Share Asset Retained Total
Capital Premium Revaluation Earnings Equity
N N N N N
Balance at 1st January, 2017 22,500,000 1,151,920 80,663,444 (27,881,626) 76,433,738
Statement of comprehensive income - - 354,576 8,703,012 9,057,588
Dividend paid - - - (9,296,751) (9,296,751)
Deferred tax liability written back - - - 19,353,183 19,353,183
Back duty assessment (LIRS) - - - (3,165,081) (3,165,081)
Balance at 31st December, 2017 22,500,000 1,151,920 81,018,020 (12,287,263) 92,382,677
======== ======= ======== ========= ========
Balance as 1st January, 2016 22,500,000 1,151,920 80,647,330 (31,357,877) 72,941,373
Statement of comprehensive income - - 16,114 12,836,251 12,852,365
Dividend paid - - - (9,360,000) (9,360,000)
Balance at 31st December, 2016 22,500,000 1,151,920 80,663,444 (27,881,626) 76,433,738
======== ======= ======== ========= ========
The accounting policies and notes on pages 17 to 37 form an integral part of these financial statements
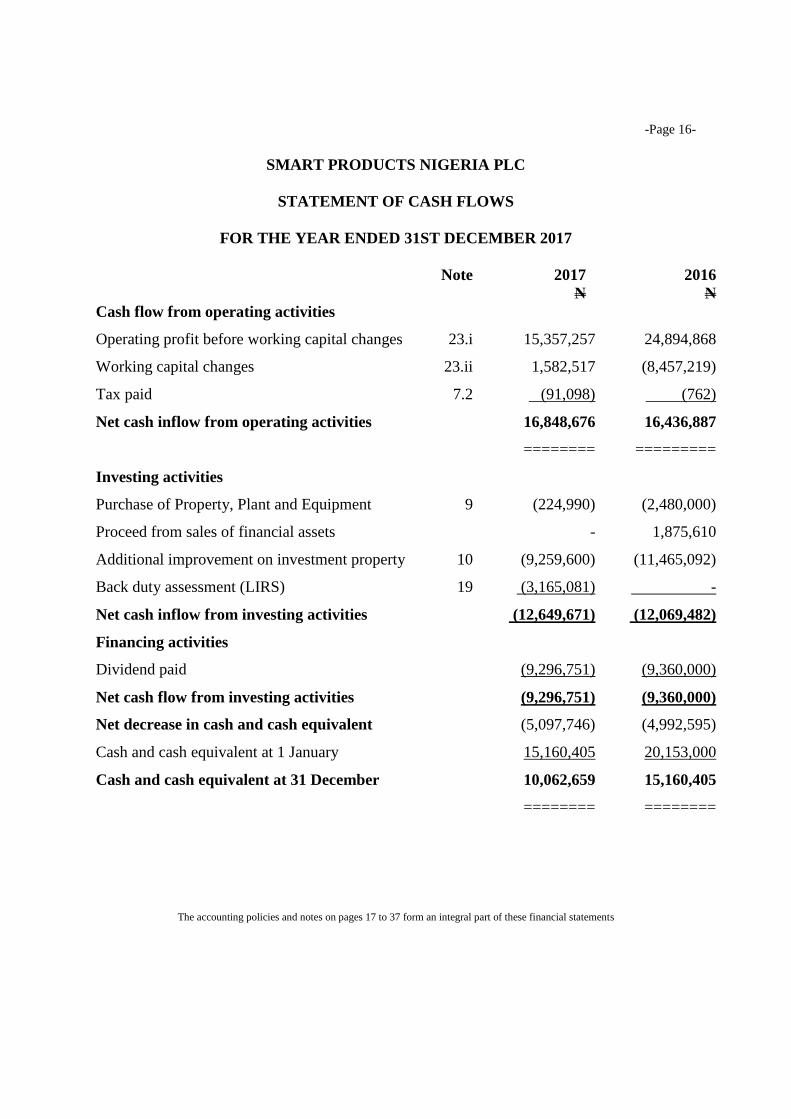
-Page 16-
SMART PRODUCTS NIGERIA PLC
STATEMENT OF CASH FLOWS
FOR THE YEAR ENDED 31ST DECEMBER 2017
Note 2017 2016
N N
Cash flow from operating activities
Operating profit before working capital changes 23.i 15,357,257 24,894,868
Working capital changes 23.ii 1,582,517 (8,457,219)
Tax paid 7.2 (91,098) (762)
Net cash inflow from operating activities 16,848,676 16,436,887
======== =========
Investing activities
Purchase of Property, Plant and Equipment 9 (224,990) (2,480,000)
Proceed from sales of financial assets - 1,875,610
Additional improvement on investment property 10 (9,259,600) (11,465,092)
Back duty assessment (LIRS) 19 (3,165,081) -
Net cash inflow from investing activities (12,649,671) (12,069,482)
Financing activities
Dividend paid (9,296,751) (9,360,000)
Net cash flow from investing activities (9,296,751) (9,360,000)
Net decrease in cash and cash equivalent (5,097,746) (4,992,595)
Cash and cash equivalent at 1 January 15,160,405 20,153,000
Cash and cash equivalent at 31 December 10,062,659 15,160,405
======== ========
The accounting policies and notes on pages 17 to 37 form an integral part of these financial statements

-Page 17-
SMART PRODUCTS NIGERIA PLC
NOTES TO THE FINANCIAL STATEMENTS
1. Corporate information
The company, Smart Product Nigeria Plc (formerly Associated Press Limited) was
incorporated on 11 January, 1966 as a limited liability company and commenced
business as a legal entity immediately. It was converted to a public limited liability
company in 1991. The registered office is located at 373, Agege Motor Road,
Challenge, Mushin, Lagos. The principal activity of the company is the management
and administration of the company’s properties and investments from where it derives
income.
The financial statements for the year ended 31st December 2017 were authorised for
issue in accordance with the resolution of the directors on 10 April, 2018.
2. Accounting policies
The principal accounting policies adopted in the preparation of these financial
statements are set out below. These policies have been consistently applied to all the
years presented, unless otherwise stated.
2.1 Basis of preparation
The financial statements have been prepared on an historical cost basis, except for
those available-for-sale financial assets that have been measured at fair value. The
financial statements values are presented in the Nigerian Naira (N), which is the
Company’s presentation currency, unless otherwise indicated.
2.1.1 Statement of compliance
The financial statements of the Company have been prepared in accordance with
International Financial Reporting Standards (IFRS) as issued by the International
Accounting Standards Board (IASB). Additional information required by national
regulations is included where appropriate.
The Company presents its statement of financial position with necessary analysis of
the items presented in the respective notes. An analysis regarding recovery or
settlement within 12 months after the reporting date (current) and more than 12
months after the reporting date (non-current) form an integral part of each of the notes
where applicable.
Financial assets and financial liabilities are offset and the net amount reported in the
statement of financial position only when there is a legally enforceable right to offset
the recognized amount and there is an intention to settle on a net basis, or to realize
the assets and settled the liability simultaneously.

-Page18-
2.2 Summary of significant accounting policies
The following are the significant accounting policies adopted by the Company in
preparing of its financial statements:
2.2.1 Property, plant and equipment
Property, plant and equipment are stated at cost less accumulated depreciation and
accumulated impairment losses (if any). The cost of property, plant and equipment
includes expenditure incurred during construction, delivery and modification. Other
subsequent expenditure is capitalised only when it increases the future economic
benefits associated with the asset to which it relates. Where a substantial period of
time is required to bring the asset into use, attributable finance costs are capitalised
and included in the cost of the relevant asset. Depreciation is provided on straight line
basis to allocate the cost/revalued amounts less their residual values over the
estimated useful lives of the various classes of assets.
The principal rates used are:
Plant and machinery 10 years
Motor vehicles 4 years
Furniture, fixtures and equipment 10 years
Generator 3 years
Depreciation is charged based on usage in the year of purchase.
The asset’s residual values, useful lives and method of depreciation are reviewed at
each financial year end and adjusted prospectively if appropriate to reflect the relevant
market conditions and expectations, obsolescence and normal wear and tear.
Impairment review is carried out when events or changes in circumstances indicate
that the carrying value may not be recoverable. Impairment losses on non-revalued
assets are recognised in the income statement as an expense, while reversals of
impairment losses are also stated in the income statement.
An item of property, plant and equipment and any significant part initially recognised
is derecognised upon disposal or when no future economic benefits are expected from
its use or disposal. Any gain or loss arising on derecognition of the asset (calculated
as the difference between the net disposal proceeds and the carrying amount of the
asset) is included in the income statement when the asset is derecognised.
2.2.2 Investment properties
Leasehold property
The company has opted to use the carrying cost of its investment property as deemed
cost upon transition to IFRS and subsequently measure it using the cost model.
Investment properties (including borrowing cost attributable to their construction,
acquisition and production) are capitalised and are initially measured at cost;
-Page 19-
subsequently, they are amortised over the remaining leasehold life of the lease
agreement (less any accumulated impairment losses). The company however
discloses the fair value of its investment properties as at the end of the financial period
in compliance with paragraph 79 of IAS 40. The fair value is determined every three
years by external independent valuers who are registered with the Financial Reporting
Council (FRC) of Nigeria. Increase in their carrying amount are credited to
revaluation reserve in shareholder’s equity. Decreases that offset previous increases
of the same properties are charged against revaluation reserve while, all other
decreases are charged to the income statement. Revaluation surplus on disposed
properties are written back to income in line with the provisions of IAS 40. The
company’s investment property is amortised over the remaining life of the lease
agreement. The lease expires by 2052.
2.2.3 Intangible assets
Intangible assets acquired separately are measured on initial recognition at cost. After
initial recognition, intangible assets are carried at cost less accumulated amortisation
and accumulated impairment losses (if any).
Capitalization of expenditure ceases when the asset is in the condition necessary for it
to be capable of operating in the manner intended by management.
Depreciable amount is allocated on a systematic basis over its useful life using the
straight line basis in which charges for each period are recognised in the profit or loss.
Direct computer software development costs recognised as intangible assets are
amortised on a straight line basis over four years and are carried at cost less any
accumulated amortisation and any accumulated impairment losses.
The useful life of the asset is reviewed at each financial year end. If the expected
useful life is different from the previous estimates, the amortisation period will
change. And if there is a change due to the expected pattern of consumption of the
future economic benefits embodied in the asset, the amortisation period will be
changed to reflect the pattern which will be accounted for as a change in accounting
estimate. However, the company did not have any intangible asset as at 31 December,
2016.
2.2.4 Taxation
a) Current income tax
Current income tax liabilities and assets for the current and prior periods is measured
at the amount expected to be paid to or recovered from the taxation authorities, using
the tax rates and tax laws that have been enacted or substantively enacted at the
reporting date. Current income tax assets and liabilities also include adjustments for
tax expected to be payable or recoverable in respect of previous periods.
b) Deferred tax
Deferred tax is provided using the liability method on temporary differences at the
reporting date between the tax bases of assets and liabilities and their carrying
amounts for financial reporting purposes. Deferred tax assets and liabilities are
calculated in respect of temporary differences using the balance sheet liability
method.
-Page 20-
Deferred tax assets are recorded only to the extent that it is probable that taxable
profit will be available against which the deferred tax asset will be realized or if it can
be offset against existing deferred tax liabilities. The carrying amount of deferred tax
assets is reviewed at each reporting date and reduced to the extent that it is no longer
probable that sufficient taxable profit will be available to allow all or part of the
deferred income tax asset to be utilized. Unrecognised deferred tax assets are
reassessed at each reporting date and are recognised to the extent that it has become
probable that future taxable profit will allow the deferred tax asset to be recovered.
Deferred tax liabilities are recognised for all taxable temporary differences, except
when the deferred tax liability arises from the initial recognition of goodwill or of an
asset or liability in a transaction that is not a business combination and, at the time of
the transaction, affects neither the accounting profit nor taxable profit or loss.
Deferred tax assets and liabilities are measured at tax rates that are expected to apply
to the period when the asset is realized or the liability is settled, based on tax rates that
have been enacted or substantively enacted at the reporting period. Such assets and
liabilities are not recognised if the temporary difference arises from goodwill or from
initial recognition (other than in a business combination) of other assets and liabilities
in a transaction that affects neither the taxable profit nor the accounting profit.
Deferred tax assets and deferred tax liabilities are offset, if a legally enforceable right
exists to set off current tax assets against current income tax liabilities and the
deferred taxes relate to the same taxable entity and the same taxation authority.
2.2.5 Employee’s retirement benefits
Defined contribution
The Company operates a funded defined contributory scheme with some Pension
Fund Administrators. This is in compliance with the provisions of the Pension Reform
Act, 2004 whereby employer and employees contribute minimum of 10% and 8%
respectively of the employees’ eligible emoluments. Staff contributions to the scheme
are funded through payroll deductions, while the Company’s contribution is charged
to the income statement.
When an employee has rendered service to an entity during a period, the company
recognises the contribution payable to a defined contribution plan in exchange for that
service (a) as a liability (accrued expenses), after deducting any contribution already
paid, (b) as an expense.
2.2.6 Revenue
Revenue is recognised to the extent that it is probable that the economic benefits will
flow to the company and the revenue can be reliably measured, regardless of when the
payment is being made. Revenue is measured at the fair value of the consideration
received or receivable, taking into account contractually defined terms of payment and
excluding taxes. The following specific recognition criteria must also be met before
revenue is recognised for each of the two major income sources available to the
company as follows:-

-Page 21-
Rental income
This income is generated from rent paid by tenants on the company’s property and is
being recognised on time basis. Rent received for the period is recognised in the
income statement as turnover for the period while amount relating to the period yet to
expire is deferred and recognised as payable in the statements of financial position.
Investment income
Investment income is generated through dividend from equity investment. This
income is recognised in the statement of comprehensive income as income when the
company’s right to receive the payment is established.
2.2.7 Financial Instruments
i) Financial assets
Initial recognition and measurement
Financial assets within the scope of IAS 39 are classified as financial assets at fair
value through profit or loss, loans and receivables, held-to-maturity investments,
available-for-sale financial assets, as appropriate.
The company’s financial assets include cash and short-term deposits, fixed deposits,
loans and other receivables, quoted equity investment. The company recognises three
classes of financial assets:
a) Available for sale financial investments
b) Held to maturity investment
c) Loans and receivables
All financial assets are recognised initially at fair value plus transaction costs.
Subsequent measurement
The subsequent measurement of financial assets depends on their classification as
follows:
Available for sale financial investments
Equity investments classified as available-for-sale are those that are neither classified
as held for trading nor designated at fair value through profit or loss.
After initial measurement, available-for-sale financial investments are subsequently
measured at fair value with unrealised gains or losses recognised in the available-for-
sale reserve through other comprehensive income until the investment is
derecognised, at which time the cumulative gain or loss is recognised in other
operating income or the investment is determined to be impaired, when the
cumulative loss is reclassified from the available-for sale reserve to the income
statement.

-Page 22-
Investments in unquoted equity instruments that do not have an active market and
whose fair value cannot be reliably measured and or derivatives that is linked to and
must be settled by delivery of such unquoted equity instruments are measured at cost.
For a financial asset reclassified out of the available-for-sale category, any previous
gain or loss on that asset that has been recognised in equity is amortised to profit or
loss over the remaining life of the investment using the Effective Interest Rate (EIR).
Any difference between the new amortised cost and the expected cash flows is also
amortised over the remaining life of the asset using the EIR. If the asset is
subsequently determined to be impaired, then the amount recorded in equity is
reclassified to the income statement.
Held –to- maturity investments
Non-derivative financial assets with fixed or determinable payments and fixed
maturities are classified as held-to maturity when the Company has the positive
intention and ability to hold them to maturity. After initial measurement, held-to-
maturity investments are measured at amortised cost using the EIR, less impairment.
Amortised cost is calculated by taking into account any discount or premium on
acquisition and fees or costs that are an integral part of the EIR. The EIR amortisation is
included in finance income in the income statement. Gains and losses are recognised in the
income statement when the investments are derecognised or impaired, as well as through
the amortisation process.
Included in this classification are Investments in Treasury bills and Bonds issued by
federal government and state government. However, the company did not have any held -
to -maturity investments as at 31 December, 2017.
Loans and receivables
Loans and receivables are non-derivative financial assets with fixed or determinable
payments that are not quoted in an active market. After initial measurement, such financial
assets are subsequently measured at amortised cost using the EIR method, less
impairment. Amortised cost is calculated by taking into account any discount or premium
on acquisition and fees or costs that are an integral part of the EIR. The EIR amortisation is
included in finance income in the income statement. Gains and losses are recognised in the
income statement when the investments are derecognised or impaired, as well as through
the amortisation process.
Included in this classification are personal loans, car loan and mortgage loan given to
employees.
Derecognition
A financial asset (or, where applicable, a part of a financial asset or part of a group of
similar financial assets) is derecognised when:
The right to receive cash flows from the asset have expired; and
-Page 23-
The Company has transferred its rights to receive cash flows from the asset or has
assumed an obligation to pay the received cash flows in full without material delay
to a third party under a ‘pass-through’ arrangement; and either (a) the Company
has transferred substantially all the risks and rewards of the asset, or (b) the
Company has neither transferred nor retained substantially all the risks and
rewards of the asset, but has transferred control of the asset.
When the Company has transferred its rights to receive cash flows from an asset or has
entered into a pass-through arrangement, it evaluates if and to what extent it has retained
the risks and rewards of ownership. When it has neither transferred nor retained
substantially all of the risks and rewards of the asset, nor transferred control of the asset,
the asset is recognised to the extent of the Company’s continuing involvement in the asset.
In that case, the Company also recognises an associated liability. The transferred asset and
the associated liability are measured on a basis that reflects the rights and obligations that
the Company has retained.
ii) Impairment of financial assets
The company assesses at each reporting date whether there is any objective evidence that a
financial asset or a group of financial assets is impaired. A financial asset or a group of
financial assets is deemed to be impaired if, and only if, there is objective evidence of
impairment as a result of one or more events that has occurred after the initial recognition
of the asset (an incurred ‘loss event’) and that loss event has an impact on the estimated
future cash flows of the financial asset or the group of financial assets that can be reliably
estimated. Evidence of impairment may include indications that the debtors or a group of
debtors is experiencing significant financial difficulty, default or delinquency in interest or
principal payments, the probability that they will enter bankruptcy or other financial
reorganisation and where observable data indicate that there is a measurable decrease in
the estimated future cash flows, such as changes in arrears or economic conditions that
correlate with defaults.
Financial assets carried at amortised cost
For financial assets carried at amortised cost, the company first assesses whether
objective evidence of impairment exists individually for financial assets that are
individually significant, or collectively for financial assets that are not individually
significant. If the company determines that no objective evidence of impairment exists
for an individually assessed financial asset, whether significant or not, it includes the
asset in a group of financial assets with similar credit risk characteristics and
collectively assesses them for impairment. Assets that are individually assessed for
impairment and for which an impairment loss is, or continues to be, recognised are
not included in a collective assessment of impairment.
If there is objective evidence that an impairment loss has been incurred, the amount of the
loss is measured as the difference between the asset’s carrying amount and the present
value of estimated future cash flows (excluding future expected credit losses that have not
yet been incurred). The present value of the estimated future cash flows is discounted at
the financial asset’s original effective interest rate. If a loan has a variable interest rate, the
discount rate for measuring any impairment loss is the current EIR.
-Page 24-
The carrying amount of the asset is reduced through the use of an allowance account and
the amount of the loss is recognised in the income statement. Interest income continues to
be accrued on the reduced carrying amount and is accrued using the rate of interest used to
discount the future cash flows for the purpose of measuring the impairment loss. The
interest income is recorded as part of investment income in the income statement. Loans
together with the associated allowance are written off when there is no realistic prospect of
future recovery and all collateral has been realised or has been transferred to the Company.
If, in a subsequent year, the amount of the estimated impairment loss increases or
decreases because of an event occurring after the impairment was recognised, the
previously recognised impairment loss is increased or reduced by adjusting the allowance
account. If a future write-off is later recovered, the recovery is recognised in the income
statement.
Available for sale financial investments
For available-for-sale financial investments, the Company assesses at each reporting date
whether there is objective evidence that an investment or a group of investments is
impaired.
In the case of equity investments classified as available-for-sale, objective evidence would
include a significant or prolonged decline in the fair value of the investment below its cost.
‘Significant’ is evaluated against the original cost of the investment and ‘prolonged’
against the period in which the fair value has been below its original cost. When there is
evidence of impairment, the cumulative loss – measured as the difference between the
acquisition cost and the current fair value, less any impairment loss on that investment
previously recognised in the income statement – is removed from other comprehensive
income and recognised in the income statement. Impairment losses on equity investments
are not reversed through the income statement; increases in their fair value after
impairment are recognised directly in other comprehensive income.
A threshold of 20% is applied consistently to conclude whether or not the decline in
fair value is significant.
iii) Financial liabilities
Initial recognition and measurement
Financial liabilities within the scope of IAS 39 are classified as financial liabilities at fair
value through profit or loss, loans and borrowings, or as derivatives designated as hedging
instruments in an effective hedge, as appropriate. The company determines the
classification of its financial liabilities at initial recognition.
All financial liabilities are recognised initially at fair value and, in the case of loans and
borrowings, carried at amortised cost, this includes directly attributable transaction costs.
The company’s financial liabilities include trade and other payables.
Derecognition
A financial liability is derecognised when the obligation under the liability is discharged or
cancelled or expires.
When an existing financial liability is replaced by another from the same lender on
substantially different terms, or the terms of an existing liability are substantially modified,
-Page 25-
such an exchange or modification is treated as the derecognition of the original liability
and the recognition of a new liability. The difference in the respective carrying amounts is
recognised in the income statement.
iv) Offsetting of financial instruments
Financial assets and financial liabilities are offset and the net amount reported in the
statement of financial position if, and only if:
There is a currently enforceable legal right to offset the recognised amounts; and
There is an intention to settle on a net basis, or to realise the assets and settle the
liabilities simultaneously
v) Fair value of financial instruments
The fair value of financial instruments that are traded in active markets are determined at
each reporting date by reference to quoted market prices or dealer price quotations.
For financial instruments not traded in an active market, the fair value is determined using
appropriate valuation techniques. Such techniques may include:
Using recent arm’s length market transactions
Reference to the current fair value of another instrument that is substantially the
same
A discounted cash flow analysis or other valuation models.
2.2.8 Cash and cash equivalent
Cash and cash equivalent in the statement of financial position comprise cash at banks and
on hand and short-term deposits with a maturity of three months or less.
For the purpose of statement of cash flows, cash and cash equivalents consist of cash and
short-term deposits as defined above, net of outstanding bank overdrafts (if any).
2.2.9 Provision
A provision is recognised if as a result of past event the Company has a present legal or
constructive obligation that can be estimated reliably, and it is probable that an outflow of
economic benefits will be required to settle the obligation. Amounts are recorded based on
management’s best estimate of the amount needed to settle the obligation, which includes,
among other things, management’s experience in similar transactions.
Where the effect of the time value of money is significant, the provision is discounted at a
rate that reflects the estimated timing of payment, if the timing can be reasonably
determined, as well as the risk associated with the liability.

-Page 26-
2.2.10 Leasing
(i) Finance Lease
A lease arrangement under which substantially all the risks and rewards incidental to
ownership of the leased item rest with the lease are capitalised at the inception of the lease
at the lower of the fair value of the related item or the present value of the minimum lease
payments.
Lease payments are apportioned between finance charges and a reduction in the lease
liability so as to achieve a constant rate of interest on the remaining balance of the liability.
Finance charges are expensed to the income statement.
Capitalised leased assets are depreciated over the shorter of the lease term and the
estimated useful life of the asset.
(ii) Operating Lease
Leases where the lessor retains substantially all the risks and rewards of ownership are
classified as operating leases. Lease payments under operating leases are charged on a
straight line basis over the lease term.
2017 2016
3. Turnover N N
Rental income 38.381,121 44,270,070
Dividend received 910,977 7,623
39,292,098 44,277,693
======== ========
4. Other income
Profit on disposal of assets - 507,327
Service charge reimbursement 3,199,385 3,592,990
Interest on commercial paper 1,454,243 1,438,217
4,653,628 5,538,534
======= =======
5. Personnel expenses
Pension contribution 483,458 503,448
Staff welfare and medical (National Health Insurance Scheme) 100,000 111,500
Directors fees and allowances 2,350,000 2,625,000
Salaries and wages 3,695,108 4,109,250
6,628,566 7,349,198
======= =======
6. Other operating expenses
Annual general meeting expenses 3,064,700 2,540,288
Security service 1,645,250 1,577,880
Other professional fees 690,000 1,715,000
Entertainment/refreshment 225,430 398,510
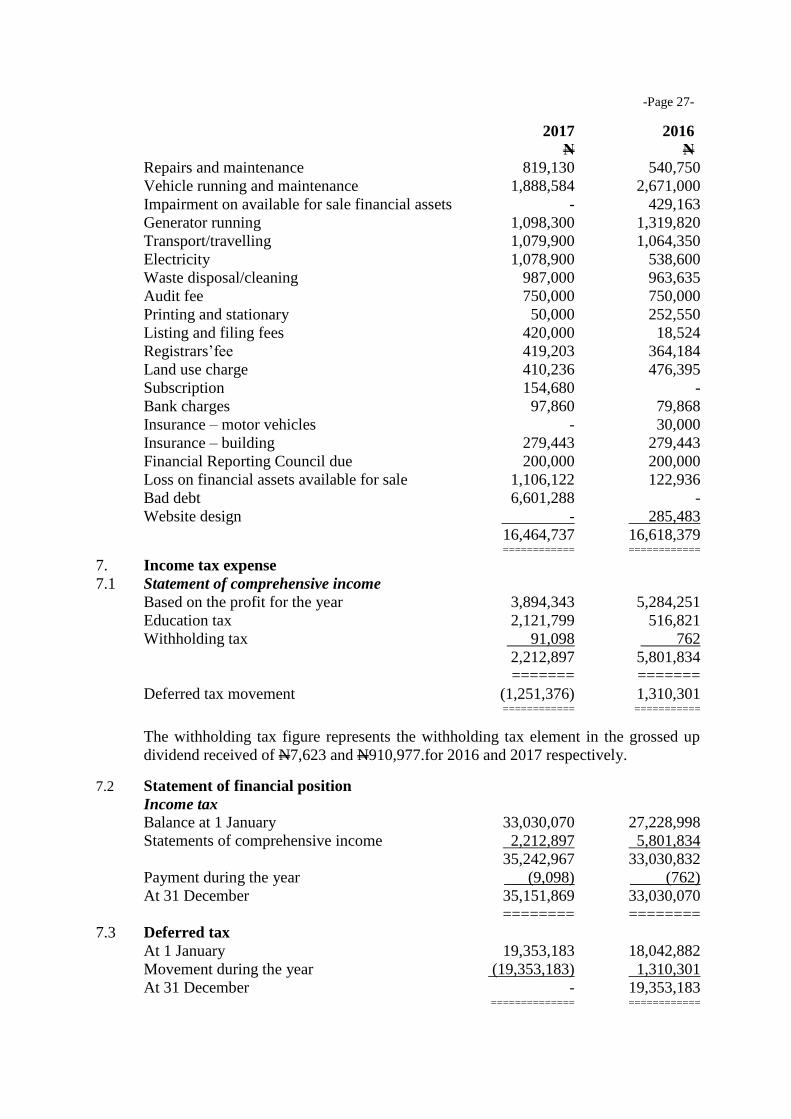
-Page 27-
2017 2016
N N Repairs and maintenance 819,130 540,750
Vehicle running and maintenance 1,888,584 2,671,000
Impairment on available for sale financial assets - 429,163
Generator running 1,098,300 1,319,820
Transport/travelling 1,079,900 1,064,350
Electricity 1,078,900 538,600
Waste disposal/cleaning 987,000 963,635
Audit fee 750,000 750,000
Printing and stationary 50,000 252,550
Listing and filing fees 420,000 18,524
Registrars’fee 419,203 364,184
Land use charge 410,236 476,395
Subscription 154,680 -
Bank charges 97,860 79,868
Insurance – motor vehicles - 30,000
Insurance – building 279,443 279,443
Financial Reporting Council due 200,000 200,000
Loss on financial assets available for sale 1,106,122 122,936
Bad debt 6,601,288 -
Website design - 285,483
16,464,737 16,618,379 ============ ============
7. Income tax expense
7.1 Statement of comprehensive income
Based on the profit for the year 3,894,343 5,284,251
Education tax 2,121,799 516,821
Withholding tax 91,098 762
2,212,897 5,801,834
======= =======
Deferred tax movement (1,251,376) 1,310,301 ============ ===========
The withholding tax figure represents the withholding tax element in the grossed up
dividend received of N7,623 and N910,977.for 2016 and 2017 respectively.
7.2 Statement of financial position
Income tax
Balance at 1 January 33,030,070 27,228,998
Statements of comprehensive income 2,212,897 5,801,834
35,242,967 33,030,832
Payment during the year (9,098) (762)
At 31 December 35,151,869 33,030,070
======== ========
7.3 Deferred tax
At 1 January 19,353,183 18,042,882
Movement during the year (19,353,183) 1,310,301
At 31 December - 19,353,183 ============== ============

-Page 28-
2017 2016
N N
7.4 Deferred tax asset 1,251,376 -
======= =====
The company had deferred tax asset of N1,251,376 representing the company’s
deferred tax gain on unrelieved losses and capital allowances as at the year end which
has not been recognised in this financial statements for prudency sake.
7.5 The company income tax was based on the provision of the Company Income Tax
Act (Cap. 60 LFN 1993) and the education tax Act 1993 as amended to date. The
income tax expense for the year ended can be reconciled to the accounting profit.
Profit before tax from continuing operations 9,664,533 19,948,386
======= ========
Expected tax base on statutory rate of 32% 3,092,651 6,383,484
Effect of disallowed expenses 926,582 1,888,083
Effect of capital allowance (1,514,823) (2,468,057)
Effect of non-taxable income (291,513) (2,439)
Income tax expense recognised in income statements 2,212,897 5,801,072
======== ========
8. Earnings per share
Basic earnings per share amounts is calculated by dividing the net profit for the year
attributable to ordinary shareholders by the weighted average number of ordinary
shares outstanding at the reporting date. The following reflects the income and share
data used in the basic earnings per share computations.
Net profit attributable to ordinary shareholders
for basic earnings 8,703,012 12,836,251
Weighted average number of ordinary shares 45,000,000 45,000,000
Basic earnings per ordinary share (in kobo) 19.34 28.56
====== ========
9. Property, plant and equipments Furniture Motor Generator
Fixtures & Vehicles
Equipment Total
Cost valuation N N N N
As at 1st January, 2017 5,479,004 2,027,000 5,449,050 13,005,054
Additions 224,990 - - 224,990
As at 31st December, 2017 5,479,004 2,027,000 5,499,050 13,230,044
======== ======== ======== =========
As at 1st January, 2017 5,478,994 1,928,466 3,845,534 11,252,994
Charge for the year 22,499 98,524 1,653,506 1,774,529
As at 31st December, 2017 5,501,493 2,026,990 5,499,040 13,027,523
======== ======== ======== =========
Net book value
At 31st December, 2017 202,501 10 10 202,522
====== ===== ===== ======
At 31st December, 2016 10 98,534 1,653,516 1,752,060
===== ===== ======= =======

-Page 29-
10. Investment property-Leasehold building
2017 2016
N N
1st January 126,853,343 115,388,251
Additions during the year 9,259,600 11,465,092
31st December, 2017 136,112,943 126,853,343
========= =========
Amortisation
1st January 33,911,328 30,459,696
Charge during the year 2,812,073 3,451,632
31st December 36,723,401 33,911,328
======== ========
NBV as at 31 December 99,389,542 92,942,015
======== ========
The leasehold investment property is located at KM12, Agege Motor Road, Mushin,
Lagos and is being amortised over the remaining term of the lease. The lease term will
expire in 2052.
11. Financial assets
Available for sale financial assets (11.1) 610,980 1,362,526
Loans and other receivables (12) 51,273,217 37,750,263
51,884,197 39,112,779
======== ========
11.1 Available for sale financial assets
Listed securities
Dangote Flour Mills Plc (Tiger Brands) 21,787 5,673
Unilever Plc 1,084,335 1,339,928
First Bank of Nigeria Plc 151,952 260,707
PZ 38,424 68,105
Ecobank Plc 66,028 101,152
Total available for sale financial asset 1,362,526 1,775,565
======= =======
Impairment allowance
Loss/Impairment charge for the year (1,106,122) (429,153)
Appreciation 354,576 16,114
(751,546) (413,039
At 31 December 610,980 1,362,526
======= ========
11.2 Available for sale financial assets
The fair value of the quoted equity shares is determined by reference to published
price on the Nigeria Stock Exchange.
In the case of equity investments classified as available-for-sale, objective evidence
would include a significant or prolonged decline in the fair value of the investment
below its cost. The determination of what is ‘significant’ or ‘prolonged’ requires
judgment. In making this judgment, the company evaluates, among other factors, the
duration or extent to which the fair value of an investment is less than its cost.
-Page 30-
Based on these criteria, the Company identified an impairment of N1,106,122 on
available-for-sale investment —quoted equity securities, which is recognised within
other operating expenses in the income statement.
Determination of fair value and fair values hierarchy
The Company used the following hierarchy for determining and disclosing the fair
value of financial instruments by valuation technique:
Level 1: Quoted (unadjusted) prices in active markets for identical assets or
liabilities;
Level 2: Other techniques for which all inputs which have a significant effect
on the recorded fair value are observable, either directly or indirectly; and
Level 3: Techniques which use inputs which have a significant effect on the
recorded fair value that are not based on observable market data.
Financial assets and liabilities measured using a valuation technique based on
assumptions that are supported by prices from observable current market transactions
are assets and liabilities for which pricing is obtained via pricing services, but where
prices have not been determined in an active market, financial assets with fair values
based on broker quotes, investments in private equity funds with fair values obtained
via fund managers and assets that are valued using the Company’s own models
whereby the majority of assumptions are market observable.
Non market observable inputs means that fair values are determined, in whole or in
part, using a valuation technique (model) based on assumptions that are neither
supported by prices from observable current market transactions in the same
instrument, nor are they based on available market data. The main asset classes in this
category are unlisted equity investments and debt instruments. Valuation techniques
are used to the extent that observable inputs are not available, thereby allowing for
situations in which there is little, if any, market activity for the asset or liability at the
measurement date. However, the fair value measurement objective remains the same,
that is, an exit price from the perspective of the Company.
Therefore, unobservable inputs reflect the Company’s own assumptions about the
assumptions that market participants would use in pricing the asset or liability
(including assumptions about risk). These inputs are developed based on the best
information available, which might include the Company’s own data.
The following table shows an analysis of financial instruments recorded at fair value
by level of the fair value hierarchy:
-Page 31-
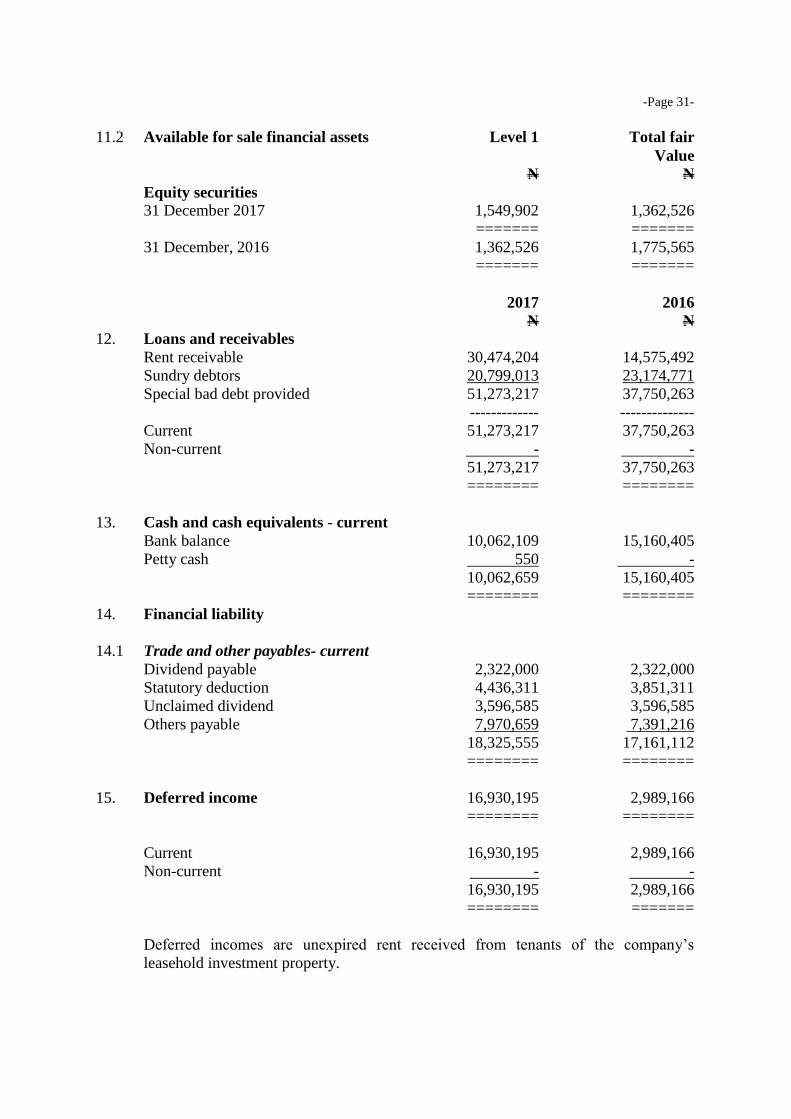
11.2 Available for sale financial assets Level 1 Total fair
Value
N N
Equity securities 31 December 2017 1,549,902 1,362,526
======= =======
31 December, 2016 1,362,526 1,775,565
======= =======
2017 2016
N N
12. Loans and receivables
Rent receivable 30,474,204 14,575,492
Sundry debtors 20,799,013 23,174,771
Special bad debt provided 51,273,217 37,750,263
------------- --------------
Current 51,273,217 37,750,263
Non-current - -
51,273,217 37,750,263
======== ========
13. Cash and cash equivalents - current
Bank balance 10,062,109 15,160,405
Petty cash 550 -
10,062,659 15,160,405
======== ========
14. Financial liability
14.1 Trade and other payables- current
Dividend payable 2,322,000 2,322,000
Statutory deduction 4,436,311 3,851,311
Unclaimed dividend 3,596,585 3,596,585
Others payable 7,970,659 7,391,216
18,325,555 17,161,112
======== ========
15. Deferred income 16,930,195 2,989,166
======== ========
Current 16,930,195 2,989,166
Non-current - -
16,930,195 2,989,166
======== =======
Deferred incomes are unexpired rent received from tenants of the company’s
leasehold investment property.

-Page 32-
16. Share capital 2017 2016
Authorised N N
50,000,000 ordinary shares of N0.50 each 25,000,000 25,000,000
======== ========
Issued and fully paid
45,000,000 ordinary shares of N0.50 each 22,500,000 22,500,000
======== ========
17. Share premium
At 31 December 1,151,920 1,151,920
======= =======
18. Asset revaluation reserve
At 1 January 80,663,444 80,647,330
Transfer from statement of other comprehensive income 354,576 16,114
81,018,020 80,663,444
======== ========
Of this opening balance of asset revaluation reserves, N70,866,857 represents the
appreciation in the value of the leasehold land and buildings which arose from the
revaluation of the assets done in April, 1999 by Jagun Dosumu and Company, whilst
the balance of N3,979,851 is in respect of excess revaluation on the buildings prior to
April, 1999. The transfer of N116,114 and N354,756 from statement of other
comprehensive income represent the appreciation in the market value of available for
sale financial assets as at 31 December, 2016 and 2017 respectively.
Restated
19. Retained earnings 31/12/2017 31/12/2016 31/12/2016
N N N
At 1 January (11,693,524) (27,881.626) (31,357,877)
Retained profit for the year 8,703,012 - 12,836,251
Dividend paid (9,296,751) - (9,360,000)
Back duty assessment (note 19.1) - (3,165,081) -
Deferred tax liability written back (note 19.2) - 19,353,183 -
(12,287,263) (11,693,524) (27,881,626)
========= ========= =========
19.1 Back duty assessment
This represents the back-duty assessment in respect of PAYE, WHT Business and
Development levy for 2009 to 2014 (6 years).
19.2 Deferred tax liability written back
The deferred tax liability provision in the sum of N19,353,183 has been written back
as a result of the set-off of net asset from revaluation reserve in respect of leasehold
land and buildings in the sum of N74,846,708 against net book value before
computing deferred tax on the assets which resulted in a deferred tax asset in the sum
of N1,251,376 as reflected in the financial statements.
19.3 In respect of the current year, the directors propose that a dividend of 10 kobo per
ordinary share will be paid to the shareholders. The dividend is subject to approval by
the shareholders at the Annual General Meeting and has not been included as a
liability in these financial statements.
-Page 33-
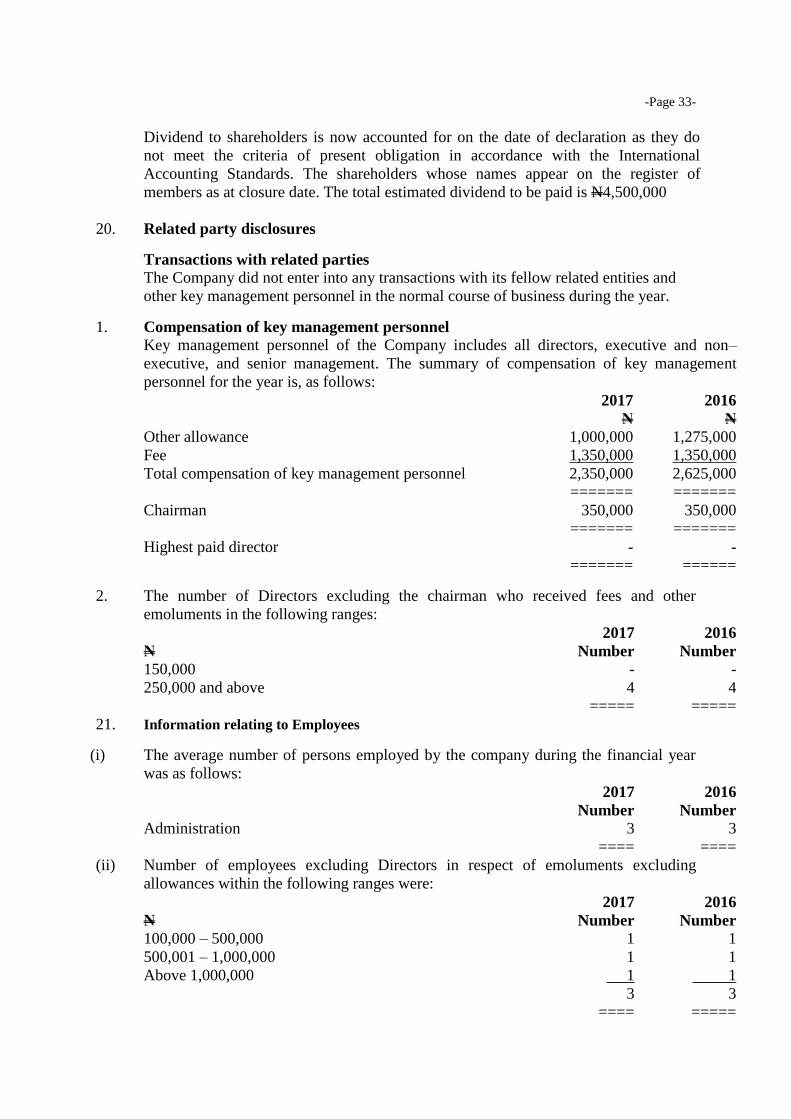
Dividend to shareholders is now accounted for on the date of declaration as they do
not meet the criteria of present obligation in accordance with the International
Accounting Standards. The shareholders whose names appear on the register of
members as at closure date. The total estimated dividend to be paid is N4,500,000
20. Related party disclosures
Transactions with related parties
The Company did not enter into any transactions with its fellow related entities and
other key management personnel in the normal course of business during the year.
1. Compensation of key management personnel
Key management personnel of the Company includes all directors, executive and non–
executive, and senior management. The summary of compensation of key management
personnel for the year is, as follows:
2017 2016
N N
Other allowance 1,000,000 1,275,000
Fee 1,350,000 1,350,000
Total compensation of key management personnel 2,350,000 2,625,000
======= =======
Chairman 350,000 350,000
======= =======
Highest paid director - -
======= ======
2. The number of Directors excluding the chairman who received fees and other
emoluments in the following ranges:
2017 2016
N Number Number
150,000 - -
250,000 and above 4 4
===== =====
21. Information relating to Employees
(i) The average number of persons employed by the company during the financial year
was as follows:
2017 2016
Number Number
Administration 3 3
==== ====
(ii) Number of employees excluding Directors in respect of emoluments excluding
allowances within the following ranges were:
2017 2016
N Number Number
100,000 – 500,000 1 1
500,001 – 1,000,000 1 1
Above 1,000,000 1 1
3 3
==== =====

-Page 34-
22. Risk management policies
(a) Governance framework
The primary objective of the Company’s risk and financial management framework is
to protect the Company’s shareholders from events that hinder the sustainable
achievement of financial performance objectives, including failing to exploit
opportunities. Key management recognizes the critical importance of having efficient
and effective risk management systems in place.
Risk management structure
The company’s Investment Committee is responsible for identifying and controlling
risks. The Board of Directors supervises the Investment Manager and is ultimately
responsible for the overall risk management of the Fund. The principle that guides the
management on risk are:
1. Effective balancing of risk and reward by aligning risk appetite with business
strategy, diversifying risk, pricing appropriately for risk, mitigating risk through
preventive and detective controls.
2. Shared responsibility for risk management as business segments are responsible
for active management of their risks, with direction and oversight provided by
company Risk Management and other corporate support groups.
3. Business decisions are based on an understanding of risk as we perform rigorous
assessment of risks in relationships, products, transactions and other business
activities.
4. Avoid activities that are not consistent with our Values, Code of Conduct or
Policies, which contributes to the protection of our reputation.
5. Proper focus on clients reduces our risks by knowing our clients and ensuring that
the services we provide are suitable for and understood by our clients.
Risk mitigation
The company has investment guidelines that set out its overall business strategies, its
tolerance for risk and its general risk management philosophy.
The company uses instruments for trading purposes and in connection with its risk
management activities.
The Investment Manager assesses the risk profile before entering into economic
investment transactions. The effectiveness of investment is assessed by the Board of
Directors. In situations of ineffectiveness, the Investment Manager is instructed to
enter into a new investment to mitigate risk on a continuous basis, thereby
restructuring or closing out the already existing investment.
Market risk
Market risk is the risk that the fair value of future cash flows of a financial instrument
will fluctuate because of changes in market prices. Market prices comprise four types
of risk: interest rate risk, currency risk, commodity price risk and other price risk,
such as equity price risk. Financial instruments affected by market risk include loans
and borrowings, deposits, and available-for-sale investments.
-Page 35-
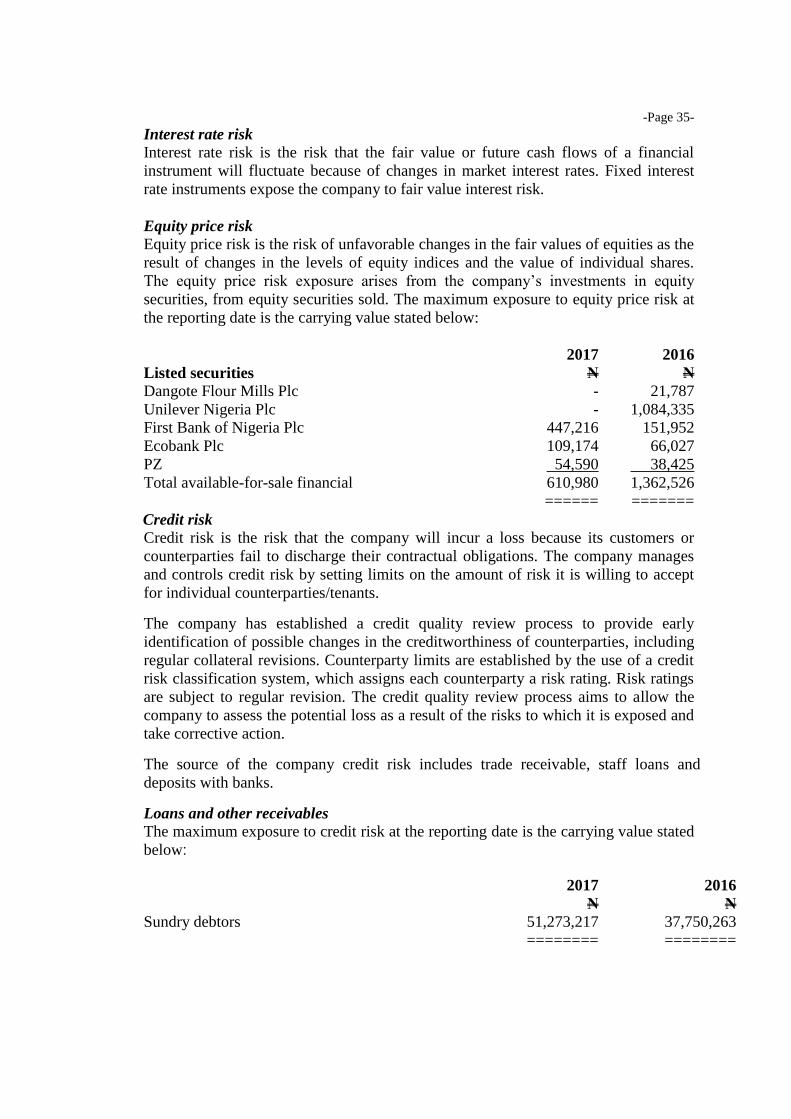
Interest rate risk
Interest rate risk is the risk that the fair value or future cash flows of a financial
instrument will fluctuate because of changes in market interest rates. Fixed interest
rate instruments expose the company to fair value interest risk.
Equity price risk
Equity price risk is the risk of unfavorable changes in the fair values of equities as the
result of changes in the levels of equity indices and the value of individual shares.
The equity price risk exposure arises from the company’s investments in equity
securities, from equity securities sold. The maximum exposure to equity price risk at
the reporting date is the carrying value stated below:
2017 2016
Listed securities N N
Dangote Flour Mills Plc - 21,787
Unilever Nigeria Plc - 1,084,335
First Bank of Nigeria Plc 447,216 151,952
Ecobank Plc 109,174 66,027
PZ 54,590 38,425
Total available-for-sale financial 610,980 1,362,526
====== =======
Credit risk
Credit risk is the risk that the company will incur a loss because its customers or
counterparties fail to discharge their contractual obligations. The company manages
and controls credit risk by setting limits on the amount of risk it is willing to accept
for individual counterparties/tenants.
The company has established a credit quality review process to provide early
identification of possible changes in the creditworthiness of counterparties, including
regular collateral revisions. Counterparty limits are established by the use of a credit
risk classification system, which assigns each counterparty a risk rating. Risk ratings
are subject to regular revision. The credit quality review process aims to allow the
company to assess the potential loss as a result of the risks to which it is exposed and
take corrective action.
The source of the company credit risk includes trade receivable, staff loans and
deposits with banks.
Loans and other receivables
The maximum exposure to credit risk at the reporting date is the carrying value stated
below:
2017 2016
N N
Sundry debtors 51,273,217 37,750,263
======== ========

-Page 36-
Operational risks
The primary responsibility for the development and implementation of controls over
operational risk rests with the board of directors. This responsibility is supported by
the development of overall standards for the management of operational risk, which
encompasses the controls and processes at the service providers and the establishment
of service levels with the service providers, in the following areas:
requirements for appropriate segregation of duties between various functions,
roles and responsibilities
requirements for the reconciliation and monitoring of transactions
compliance with regulatory and other legal requirements
documentation of controls and procedures
requirements for the periodic assessment of operational risks faced, and the
adequacy of controls and procedures to address the risks identified
contingency plans
ethical and business standards
risk mitigation, including insurance where this is effective.
23. Cash flow reconciliation
i. Operating profit before working capital changes:
2017 2016
N N
Profit before tax 9,664,533 19,948,386
Adjustments for items not involving movement of cash:
Depreciation of property, plant and equipment 9 1,774,529 2,448,633
Amortization of leasehold investment property 10 2,812,073 3,451,631
Impairment on available for sale financial assets 11 1,106,122 429,163
Profit on disposal of property plant and equipment - (1,382,945)
15,357,257 24,894,868
======== ========
ii. Working capital changes:
Increase in loans and receivables 12 (13,522,954) (15,470,400)
Decrease in trade and other payables 14 1,164,443 6,203,539
Increase / (decrease) in deferred income 15 13,941,029 809,642
1,582,517 (8,457,219)
======== ========
24. Events after the reporting period
There were no events after the reporting period which could have a relevant impact on the
financial statements of the company that had not been adequately provided for or
disclosed in the financial statements.
25. Capital commitments and contingent liabilities
There were no commitments or contingent liabilities as at 31st December, 2017.
26. Approval of financial statements
The Board of Directors approved these financial statements on 10 April, 2018.

OTHER NATIONAL DISCLOSURES

-Page 37-
SMART PRODUCTS NIGERIA PLC
STATEMENT OF VALUE ADDED
2017 2016
N % N %
Total revenue 43,945,726 49,816,227
Bought-in-materials and services (13,769,274) (7,258,379)
Value added 30,176,452 100 42,557,848 100
======== === ======== ===
Distribution:
Employees -
Personnel cost 6,628,566 22 7,349,198 17
Government -
Current taxation 2,212,897 7 5,801,834 14
In payment to providers of capital -
Dividend to shareholders 9,296,751 31 9,360,000 22
Retained for the Future -
Depreciation and amortization 4,586,602 15 5,900,264 14
Deferred taxation (1,251,376) (4) 1,310,301 3
Retained profit 8,703,012 29 12,836,251 30
Value added 30,176,452 100 42,557,848 100
======== ==== ======== ===
Value added is the wealth the company has been able to create by its own and its employees’
efforts. This statement shows the allocation of that wealth among the employees, shareholders,
government and that re-invested for the future creation of more wealth.
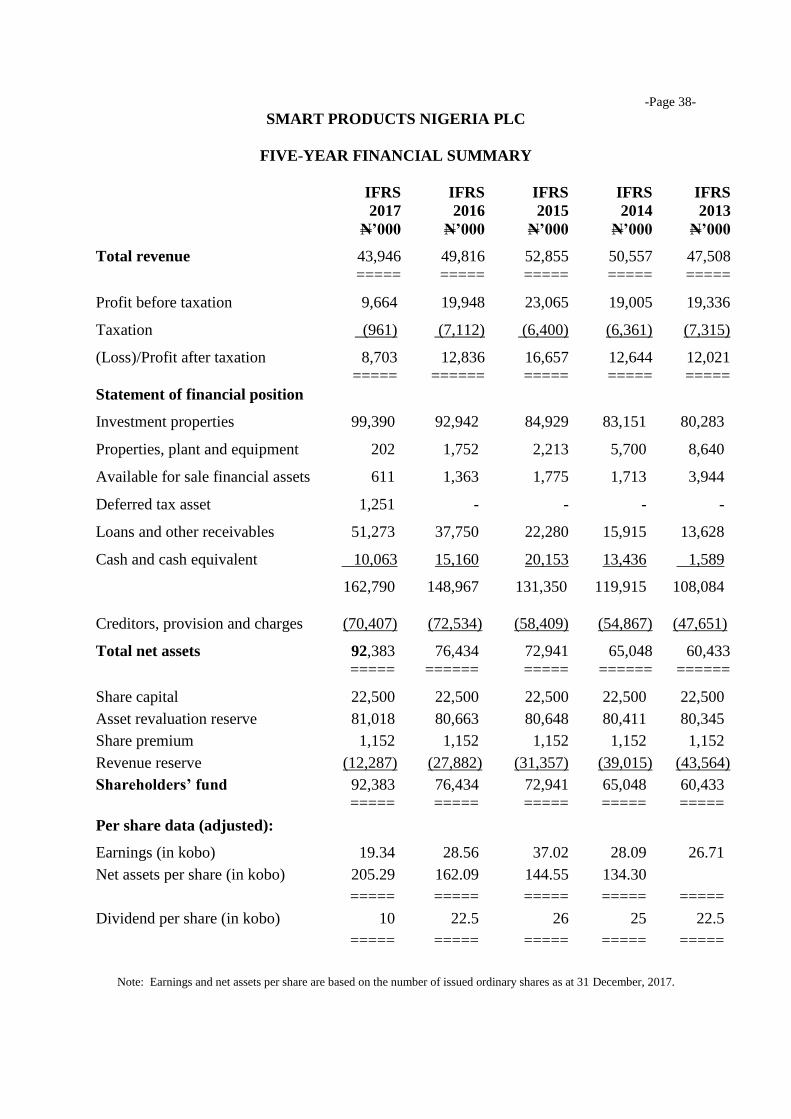
-Page 38-
SMART PRODUCTS NIGERIA PLC
FIVE-YEAR FINANCIAL SUMMARY
IFRS IFRS IFRS IFRS IFRS
2017 2016 2015 2014 2013
N’000 N’000 N’000 N’000 N’000
Total revenue 43,946 49,816 52,855 50,557 47,508
===== ===== ===== ===== =====
Profit before taxation 9,664 19,948 23,065 19,005 19,336
Taxation (961) (7,112) (6,400) (6,361) (7,315)
(Loss)/Profit after taxation 8,703 12,836 16,657 12,644 12,021
===== ====== ===== ===== =====
Statement of financial position
Investment properties 99,390 92,942 84,929 83,151 80,283
Properties, plant and equipment 202 1,752 2,213 5,700 8,640
Available for sale financial assets 611 1,363 1,775 1,713 3,944
Deferred tax asset 1,251 - - - -
Loans and other receivables 51,273 37,750 22,280 15,915 13,628
Cash and cash equivalent 10,063 15,160 20,153 13,436 1,589
162,790 148,967 131,350 119,915 108,084
Creditors, provision and charges (70,407) (72,534) (58,409) (54,867) (47,651)
Total net assets 92,383 76,434 72,941 65,048 60,433
===== ====== ===== ====== ======
Share capital 22,500 22,500 22,500 22,500 22,500
Asset revaluation reserve 81,018 80,663 80,648 80,411 80,345
Share premium 1,152 1,152 1,152 1,152 1,152
Revenue reserve (12,287) (27,882) (31,357) (39,015) (43,564)
Shareholders’ fund 92,383 76,434 72,941 65,048 60,433
===== ===== ===== ===== =====
Per share data (adjusted):
Earnings (in kobo) 19.34 28.56 37.02 28.09 26.71
Net assets per share (in kobo) 205.29 162.09 144.55 134.30
===== ===== ===== ===== =====
Dividend per share (in kobo) 10 22.5 26 25 22.5
===== ===== ===== ===== =====
Note: Earnings and net assets per share are based on the number of issued ordinary shares as at 31 December, 2017.