smart connections - final
TRANSCRIPT

SMART CONNECTIONS Can Technology-Enabled Mobility Help Improve Social Mobility By Overcoming Barriers to Physical Mobility?
Jerel ConstantinoUniversity of California, Santa BarbaraUniversity of California Center SacramentoGovernor’s Office of Planning and Research, State of California
PAGE �1

Introduction 3 The Importance of Mobility 4 So Close, Yet so Far: The Suburbanization of Poverty An Issue of Transportation Equity Leveraging Technology to Enable Social Equity 9 Shared Mobility: Cooking Up Something Good Not a Direct Connection: Accessibility is a Speed Bump The Case for Sacramento 15 Demographic Findings Designing the Pilot Simulation Results Preparing for the Future 28 Lessons from the Past, for Tomorrow Shared Mobility Today, an Autonomous and Electrified Future From Fixed-Line Providers to Mobility Managers Conclusion 33 References 34
PAGE �2
ACKNOWLEDGEMENTS
To my parents, Ariel and Malou; aunts and uncles: Jean and Mark, Merle and Junny, Grace.To my mentors and internship hosts from the Governor’s Office of Planning and Research;
Sahar Shirazi and Chris Ganson, Scott Morgan, Taryn, Sid, Kathy, Darwin, and Greta. To the UC Center Sacramento faculty and staff; Professor Kristina Victor, Cindy Simmons.
To the generous benefactors of the UCSB Public Service Award; Dr. and Mrs. Roger and Nancy Davidson.
COVER PHOTO: Original photos by myself and use of open-source map imagery. I ran the images through an artificial intelligence software which spends hours looking at paintings of modernist and impressionist painters. This app ’learns' art styles and emulates colors, shadows, and brush strokes.

Introduction Over 30 million trips are made every day using public transit. Almost all of these trips
occur in the nation’s 100 largest metro areas, which account for over 95 percent of all transit
passenger miles traveled. (Tomer, et.al) Demographic shifts favoring urbanization, especially
among the relatively-affluent in the Millennial generation, have increased demand and
investment for high quality public transit. Politicians and policy-makers have taken notice;
America’s metropolitan areas have undertaken massive projects to renovate inner-city
neighborhoods and improve public transit service. (APTA)
There is great benefit for overall investment in public transit. However, are these
investments helping those who are in need of mobility the most? Literature on gentrification
point to the displacement of lower-income residents in inner-cities, and an exodus to sprawling
suburbs. (Kneebone) The automobile-heavy suburbs lack established public transit lines, and are
mostly served by fixed bus lines.
This phenomenon does not just produce a great irony, it can worsen economic and social
injustices. Physical distance from social services and the opportunities of employment centers
are barriers to upward social mobility. A weak public transportation system erects barriers to the
opportunities and benefits available to those who are less-likely to own private vehicles —
lower-income residents and disadvantaged groups such as newly-arrived immigrants and the
disabled.
Concurrently, access to on-demand transportation have perhaps never been easier. Today,
a user of shared-ride providers, such as Uber and Lyft, can source a ride from a complete
stranger within a few taps on their wrist, via a smartwatch, or smartphone, or by simply asking
PAGE �3
their digital assistant like Siri or Alexa to request a ride. These new shared-ride services offer
transit agencies the opportunity to experiment with pilot programs that focus on connecting
under-served and lower-income residents with first-and-last mile connections to transit stations
and employment centers.
With the advent of three revolutions in transportation: shared, autonomous, and
electrified mobility, transit agencies should reassess their roles to prepare for a smarter,
connected, and cleaner transportation system. Today, transit agencies are fixed-route providers.
The future requires them to harness new tools to become mobility managers. New technologies
that offer greater flexibility and accessibility to transportation, starting with today’s shared-ride
applications should be studied. Transit agencies should create pilot programs that will offer
greater accessibility to public transport for lower-income residents outside of service areas.
Governments and policy should offer greater flexibility with their funding to public transit
agencies to encourage these pilots. Finally, transit agencies should evolve from their current roles
of fixed-route ride providers to mobility managers; to identify areas of need of transit
connections, to leverage new technologies to work in their mission to transport the public, and to
prepare cities for a smarter, more sustainable, and accessible transportation system of the future.
The Importance of Mobility America’s urban areas are, quite literally, defined by its residents’ journey to work.
Metropolitan and micropolitan statistical areas are defined by the Office of Management and
Budget (OMB) for use by Federal statistical agencies. Cities and communities included within
these metro and micro areas are defined by their degree of social and economic integration (as
PAGE �4

measured by commuting to work) with the urban core. (US Census) Therefore, a transportation
system that establishes accessible connections to labor markets, social activities, education, and
services is critical to the success of a region. Raj Chety, a professor of economics at Stanford
University, found that geographic isolation—as measured by lengthy commute times— was a
significant factor in one’s social mobility. (Chety)
Public transit is an important way for people to get to where they need to go within a
metro area. While most still rely on private vehicles, recent statistics show that Americans are
increasingly relying on public transit. This trend that started in the 2000s and is predicted to
grow even more with demographic shifts that favor urbanization, evolving cultural attitudes on
car-ownership and ride-sharing, and rising costs of personal transport. (Sakaria) Governments
and constituents have taken notice. Funding for public transportation have increased in federal
and state budgets. (Mcwither) Local measures, such as Los Angeles’ Measure M, have been
overwhelmingly approved by voters to raise sales taxes to invest in public transit. Communities
in Los Angeles county are adopting incentives for transit-oriented development to increase transit
usage and encourage infill development. (Walker)
So Close, Yet so Far: The Suburbanization of Poverty
Greater investments to infill development coincides with an influx of relatively-affluent
newcomers. This phenomenon, commonly known as gentrification, is defined as “a general term
for the arrival of wealthier people in an existing urban district, a related increase in rents and
property values, and changes in the district’s character and culture.” (Grant) The former residents
of gentrified inner-city neighborhoods are mostly lower-income, identify as ethnic minorities,
PAGE �5

and/or are newly-arrived immigrant families. Literature on gentrification point to trends that
those displaced are moving to the suburbs. (Kneebone)
An analysis from the Federal Reserve Bank of San Francisco found that sky-rocketing
housing prices in the Bay Area have led to dramatic population growth in Central Valley metros
such as Stockton and Modesto. Displaced Bay Area workers endured multi-hour commutes in
exchange for more affordable living circumstances. Yet, public transit did not meet this shift: the
percent of lower-income people living within walking distance of a rail station decreased 1.5%,
and over 3% for those living within four miles of rail. (Soursourian) Despite being so close to the
wealth of Silicon Valley, Stockton and Modesto were among the hardest hit by the late-2000s
financial crises. At the peak of the Great Recession, both cities had among the highest
foreclosure rates in the nation, over 15% unemployment, and house prices down over 30%. (Van
Zile) The San Joaquin Valley became a face of the Great Recession.
This trend is not exclusive to California. According to a national Brookings Study, poor
suburban residents tend to reside in less jobs-rich communities than their non-poor counterparts.
Most who reside in lower-income suburbs must now commute out for work, increasingly to the
higher-income suburbs and the inner-city. (Holzer and Stoll)
Households in poverty have lower vehicle ownership rates. The high sticker price of
vehicles, the cost of insurance, maintenance and upkeep of vehicles, and increased prices of gas,
all pose a financial burden to the mobility of all households, especially those in poverty.
Households who do own a vehicle spend a higher proportion of their income on transportation
expenses. (FHWA) Limited vehicle availability, affecting households which require more than
one breadwinner, afflict this cost-sensitive group.
PAGE �6

These trends present an alarming dichotomy. The growth of America’s suburbs in the
latter half of the twentieth century were enabled because of personal transport through the
automobile. Many suburban communities were developed with single-use zoning, also known as
Euclidean zoning. This form of zoning encourage segregation of land uses into specified
geographic districts. (Infastructure) As a result, retail and industrial zones — and the job
opportunities which many depend on — are often not within walking distance from residential
areas. Sprawling suburbs were not designed for walking or bicycling, and are often served by bus
lines which are of lower quality than fixed-rail lines. Living in suburbia requires a greater
reliance on automobiles. However, those who are moving into suburbs today, many displaced by
gentrification, do not own or can barely afford a personal vehicle.
Growing poverty in the suburbs should raise alarm for policy-makers. Despite renewed
interest and investment in transit, those who have historically relied on public transit for mobility
— the economically and socially disadvantaged — may not reap these benefits because of their
displacement to cheaper housing options in suburbia. A case can be argued that lower-income
residents in suburbs are worse off today than when they were in pre-gentrified neighborhoods.
The lack of built infrastructure and spatial distance in suburbia discourages low-cost and healthy
alternatives such as walking or biking. Access to opportunities for social mobility: labor markets,
colleges and universities, hospitals and social services, and fresh markets are limited in suburbs
without an automobile, which is cost-prohibitive to most of the new lower-income residents
moving in.
PAGE �7
An Issue of Transportation Equity
Any solutions to address the suburbanization of poverty must be viewed from the lens of
transportation equity. Transportation equity considers cost to the user, the benefit the users
receive, and whether such benefits enable the user to more fully participate in society. (Bullard)
Ultimately, transportation equity breaks down physical and spatial barriers, and the costs
associated with it, so that the user may enjoy a higher quality of life.
As an example, public investments in highway widening projects are often framed as a
project that will spur economic growth. Proponents will often cite how a project that can reduce
commute times during peak hours. According to proponents, even reduction of a few minutes on
the highway can yield more productive hours, therefore, a greater return in investment for the
local economy. A transportation equity lens to this issue will find that while it may be true that
there is a greater increase in the gross domestic product of a metro area, the greatest increase of
output are mostly from white-collar professionals commuters and who already own private
vehicles. To these professionals, shaving minutes from their commute only offer a marginal
benefit, considering their already relatively high-incomes. Meanwhile, those who are lower-
income and are less likely to own a car are left with little benefit and still do not have many
options for access to employment centers.
A transportation equity lens towards the allocation of transportation funding would find
that there is greater societal benefit in investing in public transit to reach underserved
communities. For example, allocating an equivalent amount of public funds to improve transit
can provide an unemployed transit rider access to previously inaccessible employment centers.
Highway funds can instead be allocated towards programs such as late-night transit service, more
PAGE �8

transit trips per hour, to extend service areas to exurban and rural areas, or to invest in fixed-rail
service to suburbs. A slight shift of priority can yield a more dramatic change in the quality of
life for this previously unemployed transit rider, compared to shaving minutes from a white-
collar professional’s commute.
Policy and planning mistakes are in part to blame for the suburbanization of poverty, and
the transportation inequity associated with this trend. Government incentives for transit-oriented
development, without requirements for reduced-rents or affordable housing to those being
displaced, contribute to the exodus of lower-income households to suburbs. (SANDAG) The lack
of foresight in planning for environmentally sustainable development lead to unmanageable
suburban sprawl and negative externalities to the environment. Historically tepid investments in
public transit, and the promotion of the private automobile; reflected in decades of investment in
highways, incentives such as parking minimums, and Euclidean zoning codes; erected spatial
barriers to opportunity. Policy and planning mistakes helped create this problem; therefore, there
is a role for public investment in solving the issue of transportation equity in suburbia.
Leveraging Technology to Enable Social Equity Transportation investments are an important policy tool which can improve or worsen
transportation equity, therefore, social mobility. The current solution for transit agencies to
provide service in low-density suburbs is to extend bus lines to corridors with a higher density of
jobs and residents. These bus lines are forced to travel down already congested arteries and leave
those in the periphery. It is not cost-effective, nor time-effective, for transit agencies to extend
bus service into side-streets and outside of major road arteries. (Joblinks) According to federal
PAGE �9
program guidelines, the average person is typically willing to walk a quarter-mile to access bus
service and a half-mile for rail. (FTA) The low-density and sprawl which define suburbia means
that there is a substantial population that are not within walking distance of bus and rail lines and
have limited options outside of owning their own car.
This is problematic, considering the recent trends which point to the suburbanization of
poverty. Transit agencies must come up with alternatives beyond the traditional choices in their
toolkit of extending bus lines and frequency of service. Any solution must consider cost to the
user, the benefit the users receive, and whether such benefits enable the user to more fully
participate in society. Instead of investing in inefficient fixed bus lines, transit agencies should
look to new technologies to enable transportation equity.
Subsidies for ride-shares can be a novel solution to extending the reach of transit, without
high up-front investments in capital infrastructure and human resources. Assuming that costs to
the user remains the same, or is lessened, the user can benefit from shorter walking distances and
lessened commute times, while gaining access to previously inaccessible employment
opportunities. A pilot can explore a direct connection, from the users’ doorstep to their place of
employment; or as a first-and-last mile connection, from doorstep to the nearest fixed-rail transit
stop. Such a pilot can be dynamic based on the availability of funding, and the participants’
income and length of commute; ride subsidies can cover the full or partial cost.
Ride-share applications gives transit agencies new levers to control their service. A user
can be instantly included or withdrawn from the program without increased administrative
burdens because the subsidy will be wired directly to the users’ account. Since these ride-
sourcing apps are GPS based, the transit authority can enforce a geo-fence to only allow service
PAGE �10

within their transit boundaries, or to only originate or end at transit stops. A transit authority can
even only permit ride credits to be only used to take users to their place of employment, or on
certain weekdays. Ride-share services are often available twenty-four hours a day, seven days a
week; those who work graveyard shifts or have irregular work hours, most of whom are lower-
income, will have access to transportation. (Golden) These user-applications would either be
impossible or be very costly for transit agencies to implement with fixed bus-lines.
California’s public transportation system is receiving increased attention and investment.
Improving and extending rail-line service should remain the focus and core service of transit
agencies. However, transit agencies should ask themselves: Are we doing enough? Are there
better ways to move people? The possibilities opened up by subsidizing ride-shares offer an
intriguing alternative to investing in traditional fixed-bus routes. With increased budgets for new
projects, transit agencies should cease on their wider pockets and invest in pilot programs that
venture to unexplored applications of new technologies and may complement their services.
Shared Mobility: Cooking Up Something Good
Breakthroughs in mobile computing and telecommunications, and a cultural shift —
especially among Millennials — which favor “access over ownership” enabled ride-sourced
ride-shares such as Uber and Lyft to emerge as a convenient and lower-cost option for getting
around in metro areas. (Goldman Sachs) These new companies offer its users the ability to
source a ride using their smartphone application. The requestor will be matched with a driver,
and pricing for the ride-share is based on distance and demand for drivers. Shared-ride providers,
notably Uber and Lyft, did not exist prior to 2011. Yet, they already pose an existential threat to
PAGE �11
taxi-cab companies who have imposed a century-long monopoly over vehicle for hire services in
cities.
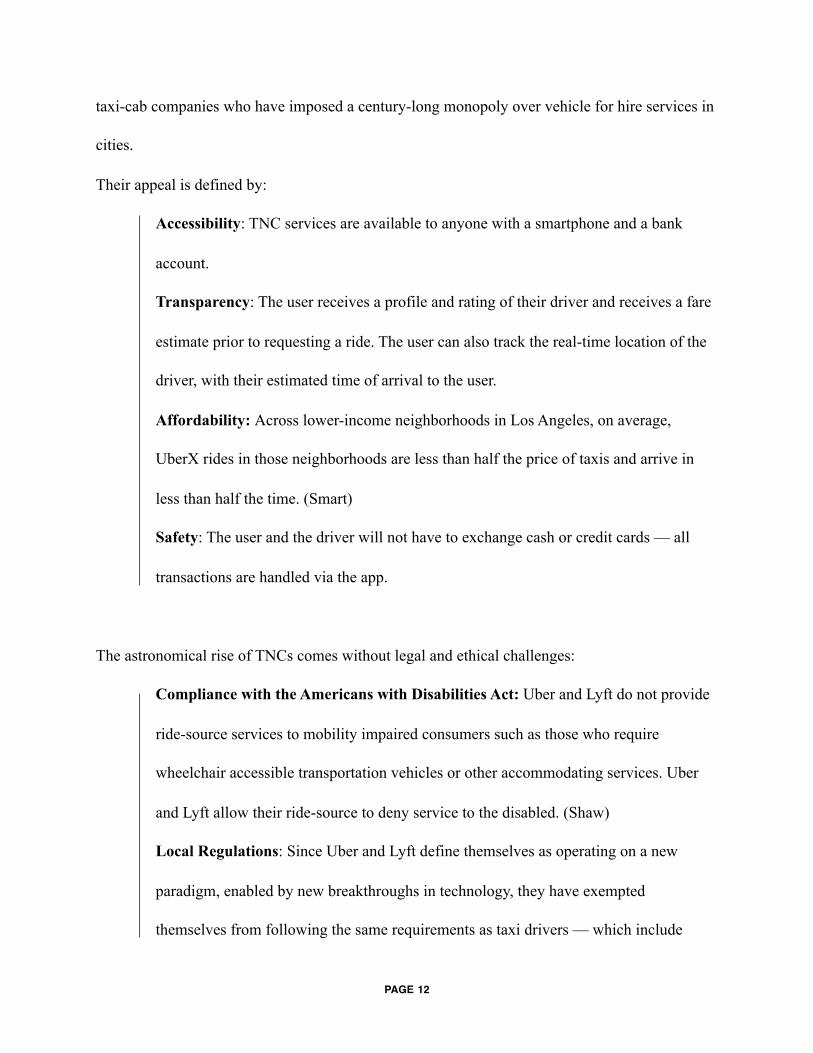
Their appeal is defined by:
Accessibility: TNC services are available to anyone with a smartphone and a bank
account.
Transparency: The user receives a profile and rating of their driver and receives a fare
estimate prior to requesting a ride. The user can also track the real-time location of the
driver, with their estimated time of arrival to the user.
Affordability: Across lower-income neighborhoods in Los Angeles, on average,
UberX rides in those neighborhoods are less than half the price of taxis and arrive in
less than half the time. (Smart)
Safety: The user and the driver will not have to exchange cash or credit cards — all
transactions are handled via the app.
The astronomical rise of TNCs comes without legal and ethical challenges:
Compliance with the Americans with Disabilities Act: Uber and Lyft do not provide
ride-source services to mobility impaired consumers such as those who require
wheelchair accessible transportation vehicles or other accommodating services. Uber
and Lyft allow their ride-source to deny service to the disabled. (Shaw)
Local Regulations: Since Uber and Lyft define themselves as operating on a new
paradigm, enabled by new breakthroughs in technology, they have exempted
themselves from following the same requirements as taxi drivers — which include
PAGE �12
licensing fees, commercial insurance laws, uniform rates and other requirements.
(Seattle)
Insurance and the issue of independent contractors: TNCs such as Uber and Lyft
consider their product to be the ride-source service, not the rides itself. Therefore,
TNCs maintain that drivers using their app are not their employees; but rather, are
independent contractors. In the case of an accident, as independent contractors, the
drivers are solely liable for property damage and bodily injury caused while
transporting passengers or while driving in search of passengers. (Ehtridge)
These ride-source services present an intriguing possibility for mobility solutions that
have not been possible prior to breakthroughs in mobile computing and telecommunications. At
the same time, these risks are important to consider while designing pilot studies, especially for
governments, as they may create unexpected externalities.
With these considerations in mind, transit agencies can leverage new ride-share
technologies to offer mobility solutions for populations beyond their areas and times of service.
Not a Direct Connection: Accessibility is a Speed Bump
While subsidies for ride-shares can enable transit agencies to reach even more users,
there are barriers to reaching those intended to benefit from the pilot program. In theory, these
ride-share services are available to anyone with a smartphone. In practice, requesting a ride is not
as easy as a few taps, especially for lower-income residents.
While smartphone adoption have been rapid, even among low-income Americans, the
ongoing cost of ownership can be a financial hardship. According to a Pew Research poll, 23%
PAGE �13

of user have had to cancel or shut off their cell phone service
for a period of time because it was too expensive to maintain.
African Americans and Latinos are around twice as likely as
whites to have canceled or cut off their smartphone service.
Lower-income Americans are also more likely to subscribe to
lower-cost plans, which often mean lower data caps, and
slower connections speeds; 37% of smartphone owners reach
the maximum amount of data that they are allowed to use as
part of their plan at least on occasion. (Smith) Further, lower-income Americans are more likely
to own older or of lower quality smartphone hardware, making it more likely for them to own a
device that may not support ride-sourcing applications. Sourcing a ride requires interface with a
smartphone application. This requires a user to have language and technical proficiency to
navigate the application.
Using Uber and Lyft also requires users to own a bank account. This is problematic,
considering that only 76% of Americans have access to banking services. (Greunberg) Among
immigrants, defined as individuals living in the United States who were born elsewhere, only
63% have access to banking services. (Paulson)
While these barriers must be considered in order to have a successful pilot program, there
are workarounds. Mobile network performance in the US is improving: consumers can expect
faster and reliable service as a baseline. (Rootmetrics) For affordable access to smartphone
hardware, there are programs such as the Universal Service Fund, by the Federal
Communications Commission, intended to promote universal access to mobile phones. (FCC)
PAGE �14
FIGURE 1 SOURCE: PEW RESEARCH CENTER

Newly formed banking services such as Simple allow users to sign-up for a FDIC-insured
checking account directly on their smartphones. Simple does not charge for overdraft or monthly
fees, no fees for maintenance, card replacement, or minimum balance. (Wortham) Prepaid and
reloadable debit cards, available at most check-out counters in pharmacies and grocery stores,
are being used by unbanked Americans as a mechanism for electronic payments and as an
alternative to traditional bank accounts. (Zywicki)
In any case, transit authorities must make prudent efforts to engage with targeted lower-
income and vulnerable communities to not just study their mobility trends and success of the
pilot, but to also ensure proficiency with the process and readiness by coordinating trainings and
preparing accounts.
The Case for Sacramento
Sacramento is the capital city of the state of California. Sacramento’s metropolitan area
has a population of almost 2.5 million people. Sacramento is served by Regional Transit (RT).
RT’s Light-rail system consists of three lines over 40 miles of track. Light-rail operates from
4:30 AM to 12:30 AM. It is the eleventh busiest light-rail system in the United States. RT’s
fixed-bus system operates 67 bus routes, with service between 5:00 a.m. and 11:00 p.m. daily,
and ending much earlier on weekends. (Sacramento RT) Using ArcGIS, a CalEnviroScreen
demographic layers, and a network analysis for walking distance from transit, the findings
summarized below show that there are many disadvantaged communities that fall outside of the
PAGE �15
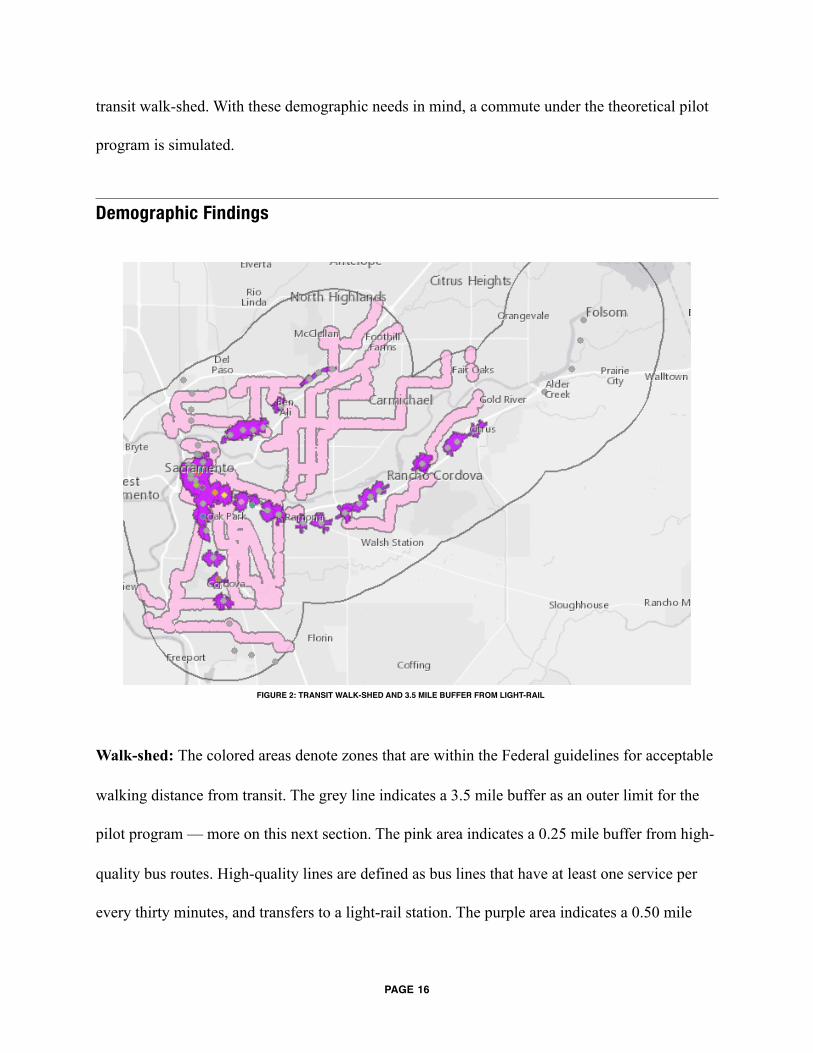
transit walk-shed. With these demographic needs in mind, a commute under the theoretical pilot
program is simulated.
Demographic Findings
Walk-shed: The colored areas denote zones that are within the Federal guidelines for acceptable
walking distance from transit. The grey line indicates a 3.5 mile buffer as an outer limit for the
pilot program — more on this next section. The pink area indicates a 0.25 mile buffer from high-
quality bus routes. High-quality lines are defined as bus lines that have at least one service per
every thirty minutes, and transfers to a light-rail station. The purple area indicates a 0.50 mile
PAGE �16
FIGURE 2: TRANSIT WALK-SHED AND 3.5 MILE BUFFER FROM LIGHT-RAIL

walk distance, derived from an agent-based network analysis which takes in account geography
and street layout. The combined purple and pink areas make-up the ‘walk-shed’, areas that fall
beyond a reasonable walking distance from transit. As the visualization indicates, there are large
areas within the RT’s service area that are not within the walk-shed of transit.
CalEnviroScreen Score: Disadvantaged communities are identified using the California
Communities Environmental Health Screening Tool, also known as CalEnviroScreen 2.0.
CalEPA identifies a disadvantaged community with authority from SB 535. Census tracts is used
as the geographic scale. A comprehensive socio-economic score is derived using data from the
2014 American Community Survey. The measures include: the poverty rate, unemployment rate,
PAGE �17
FIGURE 3: CALENVIROSCREEN LAYER AND TRANSIT WALK-SHED

low levels of home ownership, high rent burden, sensitive populations, or low levels of
educational attainment. Further, environmental justice measures are factored in, defined as: areas
disproportionately affected by environmental pollution and other hazards that can lead to
negative public health effects, exposure, or environmental degradation. As the visualization
shows, there are many disadvantaged communities, defined with a high CESScore and these
census tracts are colored in red, that are not within the transit walk-shed.
Unemployment rate is a factor commonly used in describing disadvantaged communities. On
an individual level, unemployment is a source of stress, which is implicated in poor health
reported by residents of such communities. Areas with a high unemployment rate, indicated with
dark orange are underserved by transit lines. Furthermore, areas in dark orange (Figure 4) do not
fall within the transit walk-shed.
PAGE �18
FIGURE 4: UNEMPLOYMENT RATE LAYER AND TRANSIT WALK-SHED
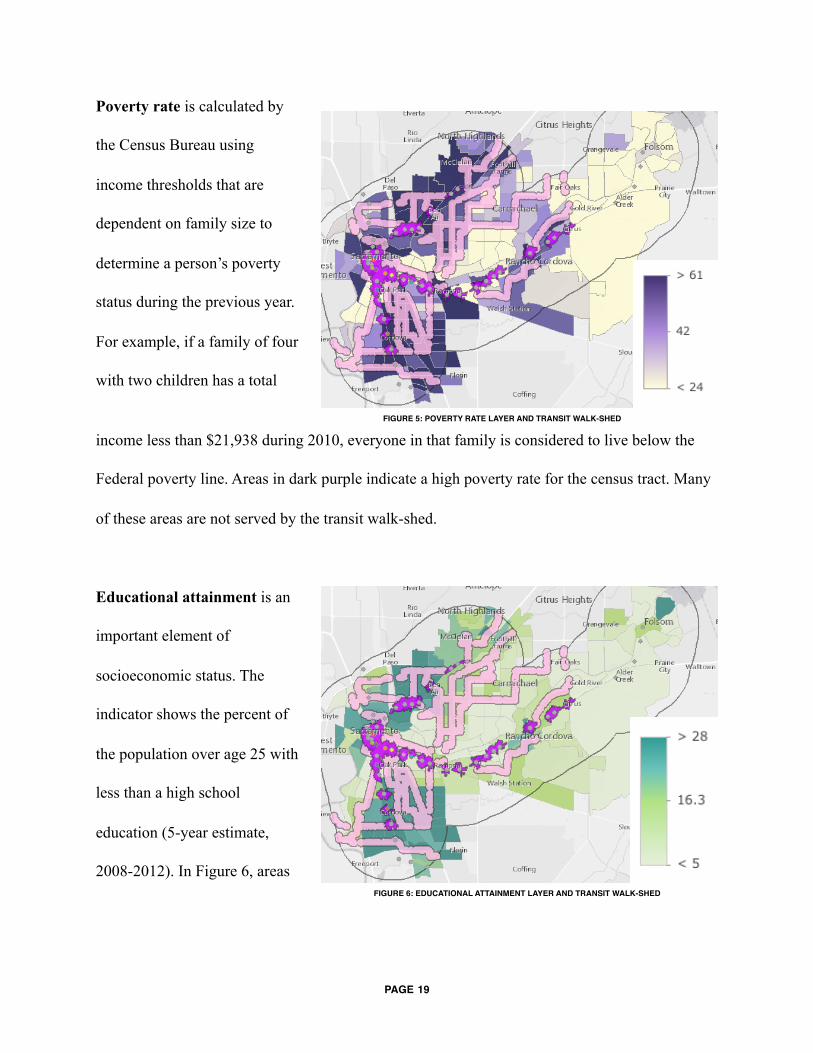
Poverty rate is calculated by
the Census Bureau using
income thresholds that are
dependent on family size to
determine a person’s poverty
status during the previous year.
For example, if a family of four
with two children has a total
income less than $21,938 during 2010, everyone in that family is considered to live below the
Federal poverty line. Areas in dark purple indicate a high poverty rate for the census tract. Many
of these areas are not served by the transit walk-shed.
Educational attainment is an
important element of
socioeconomic status. The
indicator shows the percent of
the population over age 25 with
less than a high school
education (5-year estimate,
2008-2012). In Figure 6, areas
PAGE �19
FIGURE 5: POVERTY RATE LAYER AND TRANSIT WALK-SHED
FIGURE 6: EDUCATIONAL ATTAINMENT LAYER AND TRANSIT WALK-SHED

in dark green have a high percentage of low educational attainment. There are copious areas
which fall outside of the transit walk-shed.
Access to jobs: Like many American cities, Sacramento was developed using single-use
“Euclidean” zoning, which divides the community into homogeneous land use zones. As a result,
commercial and industrial zones are excluded from residential zoning. Research has shown that
Euclidean zoning has perpetuated specific economic and social notions that have only served to
widen inequalities. (Mason)
As an example, the South Sacramento Industrial Area is not served by any high-quality
transit line and is at least one mile of the nearest transit walk-shed. (Figure 7) The lack of transit
options to this area means that residents without a car do not have access to the employment
opportunities within the industrial area. This is especially concerning considering that the
industrial and manufacturing sectors have historically been a major source of employment for the
working class. Because the industrial area falls within the 3.5 mile eligibility area, a pilot
program for ride-share subsidies will be able to bring commuters from light-rail stations and
express bus lines to jobs within the industrial area.
PAGE �20
FIGURE 7: SOUTH SACRAMENTO INDUSTRIAL AREA

Designing the Pilot
A theoretical test case for Sacramento, CA is structured after the Center for American
Progress’ policy brief on shared-ride subsidies. This process would involve three components:
geographic coverage, eligibility, and subsidy level.
Defining boundaries: Geographic boundaries for the pilot program should be limited to those
not within the walk-shed from light-rail stops and corridors with frequent bus service (defined as
at least one trip frequency every thirty minutes). The pilot program should consider the cost to
the user after the subsidy remains around the current bus fare of $2.75. The transit authority
might also want most rides to end or originate from a light-rail station. Therefore, an outer limit
of three-and-a-half miles from a light-rail station is applied, as indicated by the grey line in
Figure 2.
Determining eligibility: A pilot program meant to serve residents under an income level or
unemployment status will mean that, unfortunately, there will be a large number of people
eligible. Therefore, participation in the pilot must be targeted toward communities not within the
transit walk-shed, and to those individuals for whom the subsidy would have the greatest impact.
In this test case, ‘impact’ is based on a measure of social equity. The screening method will be
based on CalEnviroScreen 2.0. Communities identified as ‘disadvantaged’ may include, but are
not limited to: areas disproportionately affected by environmental pollution and other hazards
that can lead to negative public health effects, exposure, or environmental degradation; and areas
with concentrations of people that are of low income, high unemployment, low levels of home
ownership, high rent burden, sensitive populations, or low levels of educational attainment.
(CALEPA)
PAGE �21

Regional Transit can further refine the targeted pilot participants to maximize impact;
they can choose to only include individuals without access to any vehicle, or those with children,
or those who commute to areas that are inaccessible from any transit lines. For example,
providing subsidies for eligible participants that commute to the South Sacramento Industrial
Area, as defined in Figure 7.
Setting the Subsidy: Regional Transit District would have to work backwards from a budget
number to determine breadth of eligibility. Since this pilot program is focused on connecting
individuals to employment opportunities, rides can only be used for commuting. A full-time
employee commutes to and from work approximately 20 days per month, for a total of 40 trips
per month, and 480 trips per year.
Funding: According to the National Transit Database, Regional Transit operated at 548,446
revenue hours in 2014. The same database provides that the fully allocated cost of providing one
hour of revenue bus service is $142.09. Assuming a per ride subsidy of $3.00, RT could provide
47 subsidized rides for every one-hour reduction in revenue bus service. Annually, a one percent
reduction in revenue bus service yields a cost savings of $830,440, which is sufficient to provide
for 276,813 rides. This total would allow Regional Transit to subsidize a full year’s worth of
commutes—480 rides—for 576 people. 1
RT’s current operating expenses per unlinked bus passenger trip is $5.70. Providing a
$3.00 subsidy instead could translate to a 47.36% savings per trip. At the same time, extending
Result firn National Transit Database, “Table 12: Transit Operating Expenses by Mode, Type of Service and Function,” available at http://www. ntdprogram.gov/1
ntdprogram/data.htm (last accessed January 2016); National Transit Database, “Table 19: Transit Operating Statistics: Service Supplied and Consumed.”
PAGE �22

transit’s range outside of bus corridors, coverage for late-night service, and an on-demand
mobility solution.
In terms of new revenue sources, local governments can also be creative with new
funding sources. TNCs offer premium tiers, such as UberBlack and Lyft Premier, for those who
desire to ride in higher-end vehicles and are willing to pay more for luxury. Given that
transportation equity is a matter of social equity, municipalities should explore levying taxes on
premium-tier ride-share services. Revenue from such a luxury tax should be redistributed to
benefit subsidies for lower-income residents who are in most need of mobility solutions provided
by ride-shares.
There is some funding available through the Federal Transit Administration’s (FTA)
Mobility on Demand Sandbox program (MOD). According to the FTA, the program is “part of a
larger research effort at DOT [US Deparment of Transportation] that supports transit agencies
and communities as they integrate new mobility tools like smart phone apps, bike- and car-
sharing, and demand-responsive bus and van services. MOD projects help make transportation
systems more efficient and accessible, particularly for people who lack access to a
car.” (Mobility on Demand) The FTA can aid in this process by loosening barriers for pilots, and
coordinating with to transit agencies serving mid-sized cities for their pilot proposals.
Simulation Results A commute was simulated to demonstrate the potential effect of a ride-share subsidy to a
low-income commuter. The commute originates at the intersection of Vallejo Way and 5th Street
in Upper Land Park, a tract with the highest average percentile CalEnviroScreen and is mostly
outside of the defined transit walk-shed, with the destination at the intersection of Florin Perkins
PAGE �23

Road and Elder Creek Road in the South Sacramento Industrial Area. Four types of commute
were simulated: a transit-only commute, which serves as the independent variable; transit with a
last-mile connection via ride-share; a direct, ride-share only, carpool commute between two pilot
participants; and transit with a last-mile connection via bike. Transit trip suggestions are from
Google Transit — assuming the fastest trip suggestion to arrive to the destination by 9 AM. Trip
costs are from Regional Transit’s fare rate, as of December 2016, and are from the Lyft fare
calculator — assuming no surge pricing.
THIS MODEL IS DESIGNED TO ILLUSTRATE THE WAYS IN WHICH A PILOT PROGRAM FOR RIDE-SHARE SUBSIDIES MAY IMPROVE COMMUTES FOR BENEFICIARIES. IT IS NOT DESIGNED AS AN ACCURATE FORECASTING TOOL.
Table 1. Comparison between Commute Times and Modes for each Commute Type. Note: Cost total includes applied ride-share subsidy, if applicable.
Mode ID: Transit Only DV: Transit and Ride-Share
DV: Ride-Share Only
DV: Transit and Bike
Walking 21 12
Transit 63 33 33
Ride-Share 6 16
Bicycle 17
Total Commute Time in minutes
84 51 16 50
Total cost for individual passenger
RT Fare: $2.75
RT Fare + Lyft Fare: $5.23
Lyft Fare Only: $9.40
RT Fare: $2.75
Total cost for shared ride (after
subsidy, carpool between two pilot
participants)
N/A $2.75 $3.20 N/A
PAGE �24

Transit Only: Today, the suggested commute via public transit involves riding fixed-bus lines
and walking. The commuter will walk a short distance to the bus stop at Vallejo Way and 5th
Street. Then, the commuter will take bus lines 38 and 65 which for 56 minutes which will take
them to Eldercreek Rd & Power Inn Rd. Then, the commuter will walk for 20 minutes over a
distance of a mile to the final destination. It must be noted that Elder Creek Rd. carry high-speed
traffic and contains sections without sidewalks, as depicted in the streetscape in Figure 8. The
transit only option for commute presents problems not just with the overall duration of the trip
(over 84 minutes, if wait-times between bus transfers are included), but also increased stress in
walking a considerable distance on a high-speed road without proper pedestrian infrastructure.
Transit and Ride-Share: This commute type is compromised of using transit for most of the
trip, and a last-mile connection to the final destination to eliminate most of the walking in the
independent variable. The commuter will walk 12 minutes to transit, then ride a bus to transfer to
light rail. The transit leg of the commute totals 33 minutes and costs $2.75 for the RT fare. After
arrival at the College Greens Light Rail station, a Lyft ride would be used for the last-mile
connection to the final destination; this leg will take approximately 6 minutes, at a cost of $3.73
after the subsidy. While this mode takes advantage of RT’s transit system and , the total cost of
the trip, at $5.23, almost doubles.
Ride-Share Only: This commute type offers a direct connection via Lyft from origin to
destination, thus offering the shortest commute times out of all types. The total commute time is
16 minutes, assuming light traffic. Two types are simulated: an individual ride and a share-ride.
An individual ride may be the most convenient, but it is also the least environmentally
sustainable; single occupancy vehicle commutes contribute more greenhouse gas emissions and
PAGE �25

decrease energy efficiency of transportation. The alternative, which is a shared ride via carpool, 2
may involve more coordination and some walking to a meet-up spot. Carpooling reduces the
number of cars on the road and reduces pollution. Sharing a ride via carpool will yield the same
time-savings, and will also be the most economical, as two pilot participants can combine their
commute and subsidies to cut costs for each participant in half.
Transit and Bicycle: This commute type is compromised of using transit for most of the trip,
and substituting bicycling for the walking involved in the independent variable. The commuter
will bike about a minute to transit. Then, ride a bus to transfer to light rail, for a total of 33
minutes and a $2.75 RT fare. The commuter will then ride a bicycle from the College Greens
Light Rail station to the end destination, a trip which would take 17 minutes. The commute
duration for this commute type compare well with the commute type with a ride-share
connection for the last-mile. However, since the commuter will only have to pay for the RT fare,
costs are slashed in half. With little vehicle miles travelled added, and an active form of
transportation substituted, this commute may present itself as the best option at first glance.
However, a look at the streetscape for
Florin-Perkins Road, where most of
the bike ride will take place, reveals
unideal conditions for bicycles. (Figure
8) A trip which utilizes transit and
active modes of transport such as
http://www.nwarpc.org/pdf/Transportation/Sustainable_Mobility/Maximizing_Exchange_Minimizing_Travel.pdf2
PAGE �26
FIGURE 8. CORNER OF ELDER CREEK RD. AND FLORIN-PERKINS RD. GOOGLE MAPS STREET VIEW.
bicycling would be the most cost-efficient and environmentally sustainable way to travel.
However, physical improvements to sidewalks and bicycle paths must first be made to improve
safety; only then will commuters consider active transport as an alternative to automobile travel.
The results from commute simulations show how a pilot program which subsidizes ride-
share rides can improve the commute times and connections to employment opportunities,
without a significant increase in cost. Taking transit and active transport (such as walking and
bicycling) is, in theory, the most cost-effective and sustainable way to travel. However,
improvements in physical infrastructure or investments in mobility services such as bike-shares
must first be made to promote active transport. Investments in active transportation-related
infrastructure is a critical component in connecting all parts of the city. In any case, such
improvements are subject to political support and years of construction. In the meantime, ride-
sharing services offer transit authorities opportunities to experiment with alternative ways to
expand transportation equity and mobility. Rides that are shared, in either a fist-and-last mile
connection or a direct connection, should be favored by Regional Transit to reduce costs for
users and minimize traffic and environmental impact. To facilitate this, RT can potentially use
information, with consent from participants, on commute times, and places of origin and
destination to offer pilot participants a selection of ride partners with a similar commute.
Extending a ride-share subsidy to disadvantaged individuals and families would deliver a
qualitatively different level of daily mobility. Outside of extending light rail to this part of
Sacramento, the only alternative RT can resort to is to uniformly reduce bus wait times. While
uniformly reducing bus wait times may benefit a greater share of transit riders, such a move will
only benefit those who already have access to transit. A transportation equity lens to this issue
PAGE �27

will favor the allocation of funds to those are who do not have easy access to transit. Providing
ride-share subsidies to those outside of the transit walk-shed would provide mobility to portions
of the population who are largely excluded and would provide a major improvement in their
ability to access employment.
Preparing for the Future While Uber and Lyft today are in the business of connecting riders and drivers with ride-
shares, the future of technology-enabled mobility is to provide the same rides, but through
FAVES: fleets of autonomous vehicles that are electric and shared. (Chase) Uber has begun to
carry passengers around Pittsburgh in autonomous vehicles with a human backup driver. Lyft is
testing autonomous vehicles on the streets of San Francisco in partnership with General Motors.
John Zimmer, Lyft’s co-founder and president, predicted that within five years from 2016, a
majority of Lyft's rides will be through self-driving cars. (Mitchell) Greater savings are expected
to be recorded in future years. According to Emily Castor, Director of Policy for Lyft, FAVES
can potentially reduce the cost of a ride-share by 90%. (Castor)
Lessons from the Past, for Tomorrow The fast-evolving industry for autonomous vehicles has been compared to the Wild West.
While deployment of Level 4 and 5 autonomous vehicles are years away, a few engineers and
safety advocates have aired caution over government endorsements of self-driving technology.
(Lowy) In any case, governments taking a stance of indifference, even inaction, towards this
PAGE �28

burgeoning revolution in personal and public transport can prove to be costly. The United States
should look to the lessons of the last revolution in transportation: the personal automobile.
In the early 20th century, automobiles only went as far as the dirt roads took them.
(FHWA) Groups like the American Automobile Association lead the way to pressure the Federal
and state governments to embark on road building programs. (Rivlin) Wherever roads were built,
people followed. After World War II, suburban housing developments sprung up away from city
centers. Thanks to the automobile, people were enabled to commute from distances never before
acceptable. The convenience and freedom of the automobile appealed to the national
individualistic ethos and America’s vast geography. (Humes) the automobile has come to
represent the American way of life. Today, every metropolitan area faces worsening traffic
congestion and longer commutes. Suburban America is experiencing a brain drain, as the young
and educated are moving back to city centers. (Dure) Automobile crashes are the leading causes
of avoidable injury and death. The burning of inefficient and expensive fossil fuels result in tons
of toxins and particulate waste that are spewed into the atmosphere and induce health risks.
America’s addiction to fossil fuels lead to indirect costs to the environment, public health, and
national-security risks of being dependent to fossil fuels.
Public policy could not have stopped all of the harmful effects of the automobile. The
shift from horse-power to pistons shifted the world onto a new paradigm. Nobody could have
been able to foresee how much the automobile would have changed society. But there are lessons
to be learned from this revolution in transportation. While it will not solve every problem, public
policy must play a role to mitigate negative externalities, and to make sure that the fruits of
innovation are within reach to even more people.
PAGE �29

Shared Mobility Today, an Autonomous and Electrified Future
Public policy has a role to play in the deployment of autonomous vehicles outside of
providing answers on regulation and standards, and liability. According to the National
Association of City Transportation Officials’ Policy Statement on Automated Vehicles that if left
unchecked, like the automobile, autonomous vehicles can worsen our cities. AVs will decrease
the impedance to vehicle travel. (NACTO) Early assessments show that if AVs are privately
owned, they would cause substantial additional vehicle miles travelled and green house gasses,
additional sprawl, and less biking, walking, and transit use. (Lowy) With attention to the road no
longer needed, demand for larger vehicles that could be used as offices, kitchens, movie theaters
may increase, increasing energy use and emissions. (Javelosa) Without policy intervention,
driverless vehicle routing and parking could disproportionately burden low income communities
with traffic or vehicle storage. These are just some examples in which AVs can potentially
worsen cities. In any case, public policy can play a role in preventing these scenarios. The
response will be dependent on the amount of insight and influence government would have.
Governments today must consider their positions, investments, and applications to
maximize the benefits of technology-enabled mobility. Providing public subsidies for ride-
shares is one example in which governments can do today to better prepare and position
themselves for the likely future where FAVES rule the roads. Furthermore, engaging with
transportation network companies today can build the public-private relationships and
negotiating leverage that can place government in a more advantageous position to positively
influence the deployment of autonomous vehicles.
PAGE �30
Fleets of autonomous vehicles that are electric and shared will begin to blur the lines
between public and private transportation options. FAVES could help achieve efficient and
affordable mobility that improves social equity goals of access to employment and social
services. Supporting pilot programs which explore deployment opportunities for technology-
enabled mobility, such as ride-share subsidies for first and last mile connections, is one way
governments and transit agencies can be ready for FAVES.
From Fixed-Line Providers to Mobility Managers With increasing demand for public transportation, public transit agencies must recognize
the need for highly coordinated and multi-modal options for mobility. While emerging mobility
services should not replace high-quality, fixed-line transit, this existing system can be overlaid
with more transportation options for customers. (Tsay) Through innovations, such as ride-sharing
enabled by apps like Uber and Lyft, bike-share, car-shares, and —someday— fleets of
autonomous vehicles which are shared and electric, technology-enabled mobility can
complement fixed-route public transit service to move large numbers of people.
According to a policy brief from the American Public Transportation Association, the
concept of transit authorities as mobility management seeks to:
“create and coordinate a full range of well synchronized mobility services within a
community—“a one-stop shop for mobility options,” according to one public transit
agency general manager. It begins with the development of partnerships among
transportation providers in a particular region, expanding the range of viable
choices.” (APTA)
PAGE �31

The main components of a successful mobility management program include: (APTA)
Multi-agency partnerships: Which can reduce costs through efficient and effective
coordination to reach people who are not within reach of fixed-line transit.
Customer-driven approach: Mobility on-demand options, such as ride-share services
from Uber and Lyft, which offers a variety of individualized travel options.
Use of information technology systems: Communications sensors in technology-
enabled mobility allows for the implementation of one-stop travel information and trip
planning systems. Transit authorities can take advantage of new modes as an
opportunity to integrate ride-share payments with their mobile ticketing and trip planner
resources.
Collecting and sharing data: Data generated from technology-enabled trips can be
used to enhance traffic management strategies and coordination of public transportation
with infrastructure and land-use policies. Transit can help promote applications which
can serve as trip planners by building and maintain high-quality open datasets and make
them easy for the public to access.
The concept of mobility management moves transit authorities beyond establishing and
operating traditional fixed route transit systems to fostering and organizing a network of diverse
transportation services. Integrating an overlay of mobility services which complement fixed-
route transit can improve customer choice, and offer agencies new tools to provide better service,
and extend the reach of transit.
PAGE �32

Conclusion
This paper should motivate and guide action in favor of subsidizing ride-shares to extend
the coverage of transit. As suburbs experience rising poverty rates, solutions for mobility within
these geographic areas must be accounted for. American suburbs are built for cars; transit
coverage is often limited to fixed-line busses. Infrastructure that encourages active
transportation, such as biking or walking, are lacking in suburbs. The lack of accessible modes of
transport cuts off entire neighborhoods towards opportunities which enable upward social
mobility.
The emergence of technology-enabled mobility, such as the ride-sourcing services of
Uber and Lyft, presents the possibility of a partnership between public transit authorities and
private transportation network companies. In the commute simulation presented, a ride-share
subsidy can reduce commute times, level of stress in a commute, with only a slight increase to
the passenger. Encouraging—or requiring— the use of subsidies as shared rides through carpools
will reduce cost to the user, vehicle miles travelled, and greenhouse emissions.
In the long view, the strategy of collaborating with transportation network companies to
extend the coverage signals a redefinition of the role of public transit. Transit authorities can
utilize tools, enabled by technology, to complement fixed-rail line systems. These overlays of
diverse and coordinated transportation networks will enhance the public transportation system
that will connect people to opportunities.
PAGE �33
References America's Highways 1776-1976, Federal Highway Administration, Washington, D.C., 1976.
Bullard, Robert. "Addressing Urban Transportation Equity in the United States." Fordham Urban Law Journal 31, no. 5 (2003). http://ir.lawnet.fordham.edu/cgi/viewcontent.cgi?article=2193&context=ulj.
Chase, Robin. “On FAVES." Keynote speaker, Policies for the Revolutions of Shared, Autonomous, and Electric tranpsortaiton, Davis, CA, November 16, 2016.
Castor, Emily. “Policies for Shared Mobility." Panel discussion, Policies for the Revolutions of Shared, Autonomous, and Electric tranpsortaiton, Davis, CA, November 16, 2016.
Dure, Beau. "Millennials Continue Urbanization Of America, Leaving Small Towns." NPR. October 21, 2014. Accessed December 06, 2016. http://www.npr.org/2014/10/21/357723069/millennials-continue-urbanization-of-america-leaving-small-towns.
Ethridge, Michael. "Legal Liability and Insurance Coverage in a Social Media World - Insurance Coverage Corner." Insurance Coverage Corner. 2016. Accessed December 06, 2016. http://www.insurancecoveragecorner.com/legal-liability-and-insurance-coverage-in-a-social-media-world/.
"FDIC: Speeches & Testimony - 9/8/2016." September 8, 2016. Accessed December 06, 2016. https://fdic.gov/news/news/speeches/spsep0816.html.
Federal Transit Administration, “Final Policy Statement on the Eligibility of Pedestrian and Bicycle Improvements Under Federal Transit Law,” Federal Register (2011), available at https://federalregister.gov/a/2011-21273.
"Flag Wars." PBS. Accessed December 06, 2016. http://www.pbs.org/pov/flagwars/what-is-gentrification/.
"Gentrification in America Report." Governing Magazine: State and Local Government News for America's Leaders. Accessed December 06, 2016. http://www.governing.com/gov-data/census/gentrification-in-cities-governing-report.html.
Golden, Lonnie. “Irregular Work Scheduling and Its Consequences”. Economic Policy Institute. 2015. Accessed December 5, 2016. http://www.epi.org/publication/irregular-work-scheduling-and-its-consequences/
Grant, Benjamin. "Flag Wars." PBS. Accessed December 06, 2016. http://www.pbs.org/pov/flagwars/what-is-gentrification/.
Gruenberg, Martin. "Federal Deposit Insurance Corporation." FDIC: Speeches & Testimony - 9/8/2016. Accessed December 06, 2016. https://fdic.gov/news/news/speeches/spsep0816.html.
Harry J. Holzer and Michael A. Stoll, “Where Workers Go, do Jobs Follow? Metropolitan Labor Markets in the U.S., 1990–2000” (Washington: Brookings, 2007).
Humes, Edward. Door to Door: The Magnificent, Maddening, Mysterious World of Transportation. New York, NY: Harper, an Imprint of HarperCollins, 2016. Print.
Joblinks Employment Transportation. “Fixed-Route Services and the Trip to Work”. Accessed Dec, 2016. http://web1.ctaa.org/webmodules/webarticles/articlefiles/FixedRouteServices.pdf
Kneebone, Elizabeth, and Emily Garr. "The Suburbanization of Poverty: Trends in Metropolitan America, 2000 to 2008." Brookings. 2016. Accessed December 06, 2016. https://www.brookings.edu/research/the-suburbanization-of-poverty-trends-in-metropolitan-america-2000-to-2008/.
Lowy, Joan. "Experts Caution Self-driving Cars Not Ready for Roads." PBS. PBS, 8 Apr. 2016. Web. 27 Nov. 2016.
Lowy, Joan. "Will Robot Cars Drive Traffic Congestion off a Cliff?" The Big Story. Accessed December 06, 2016. http://bigstory.ap.org/article/51735cf4975d4d2a8a31fc7ed1a95372/will-robot-cars-drive-traffic-congestion-cliff.
Maciag, Michael. "Gentrification in America Report." Governing Magazine: State and Local Government News for America's Leaders. Accessed December 06, 2016. http://www.governing.com/gov-data/census/gentrification-in-cities-governing-report.html.
PAGE �34

Mcwither, Cameron. "Transit Funding Is Set to Grow." The Wall Street Journal. 2016. Accessed December 06, 2016. http://www.wsj.com/articles/transit-funding-is-set-to-grow-1474934201.
"Metropolitan and Micropolitan Statistical Areas Main." U.S. Census Bureau, Demographic Internet Staff. Accessed December 06, 2016. https://www.census.gov/population/metro/.
"Millennials Infographic." Goldman Sachs. Accessed December 06, 2016. http://www.goldmansachs.com/our-thinking/pages/millennials/.
Mitchell, Russ. "Uber Is about to Start Giving Self-driving Car Rides." Los Angeles Times. Accessed December 06, 2016. http://www.latimes.com/business/la-fi-uber-self-driving-cars-20160818-snap-story.html.
"Mobile Network Performance in the US." Rootmetrics. Accessed December 06, 2016. http://www.rootmetrics.com/us/blog/special-reports/2015-2h-national-us.
Raj Chetty, et al. “Where Is the Land of Opportunity? The Geography of Intergenerational Mobility in the United States.”Working Paper 19843 (National Bureau of Economic Research, 2014), available at http://www.equality-of-oppor- tunity.org/ les/mobility_geo.pdf.
Rivlin, Michael A. "The Secret Life of AAA." Colorado Springs Independent. N.p., 12 Apr. 2001. Web. 27 Nov. 2016.
Tomer, Adie, Elizabeth Kneebone, Robert Puentes, and Alan Berube. "Missed Opportunity: Transit and Jobs in Metropolitan America." Brookings. May 11, 2014. Accessed December 06, 2016. https://www.brookings.edu/research/missed-opportunity-transit-and-jobs-in-metropolitan-america/.
American Public Transportation Association (APTA). Public Transportation Investment Background Data, 11th Edition. Washington, DC, November 2015.
Tsay, Shin-pei, and Zak Accuardi. Private Mobility, Public Interest: How Public Agencies Can Work with Emerging Mobility Providers. Report. September 8, 2016. Accessed December 5, 2016. http://transitcenter.org/wp-content/uploads/2016/10/TC-Private-Mobility-Public-Interest-20160909.pdf.
Mobility Challenges for Households in Poverty. Issue brief. Washington, D.C.: Federal Highway Administration, 2014.
Mobility Management. Report. March 2012. Accessed December 5, 2016. http://www.apta.com/resources/reportsandpublications/Documents/APTA-Mobility-Management-Brochure-March-2012.pdf.
Paulson, Anna, Jeremy Smith, Robin Newberger, and Audrey Singer. "Financial Access for Immigrants: Lessons from Diverse Perspectives." Brookings. 2016. Accessed December 06, 2016. https://www.brookings.edu/research/financial-access-for-immigrants-lessons-from-diverse-perspectives/.
Shaw, Seyfarth. "Accessible Websites and Mobile Apps: Hot Topics at CSUN’s International Technology and Persons with Disabilities Conference." March 24, 2014. Accessed December 06, 2016. http://www.adatitleiii.com/2014/03/accessible-websites-and-mobile-apps-hot-topics-at-csuns-international-technology-and-persons-with-disabilities-conference/.
Smart, Rosanna, and Brad Rowe. "Faster and Cheaper: How Ride-Sourcing Fills a Gap in Low ..." Accessed December 6, 2016. Faster and Cheaper: How Ride-Sourcing Fills a Gap in Low-Income Los Angeles Neighborhoods.
Smith, Aaron. "A Portrait of Smartphone Ownership." Pew Research Center: Internet, Science & Tech. 2015. Accessed December 06, 2016. http://www.pewinternet.org/2015/04/01/chapter-one-a-portrait-of-smartphone-ownership/.
Soursourian, Matthew. "The Suburbanization of Poverty in the San Francisco Bay Area." Building Resilient Regions The Suburbanization of Poverty in the San Francisco Bay Area Comments. Accessed December 06, 2016. http://brr.berkeley.edu/2012/03/the-suburbanization-of-poverty-in-the-san-francisco-bay-area/.
Sakaria, Neela, and Natalie Stehfest. "Millenials and Mobility." Accessed December 5, 2016. http://www.apta.com/resources/reportsandpublications/Documents/APTA-Millennials-and-Mobility.pdf.
PAGE �35
San Diego Association of Governments (SANDAG). “Social Equity and Environmental Justice Assessment”. Accessed Dec, 2016. http://www.sandag.org/rcp_revised_draft/chapter6.pdf
State of California. California Environmental Protection Agency. Secretary of Environmental Protection. DESIGNATION OF DISADVANTAGED COMMUNITIES PURSUANT TO SENATE BILL 535 (DE LEÓN). October 14, 2014. Accessed December 5, 2016. http://www.calepa.ca.gov/EnvJustice/GHGInvest/Documents/SB535DesCom.pdf.
"Universal Service." Federal Communications Commission. 2016. Accessed December 06, 2016. https://www.fcc.gov/general/universal-service.
Van Zile, Max. "The New Faces of U.S. Poverty." U.S. News & World Report. July 6, 2016. Accessed December 06, 2016. http://www.usnews.com/news/articles/2016-07-06/the-new-faces-of-us-poverty.
Walker, Alissa. "Measure M: Angelenos Vote to Tax Themselves for Better Public Transit." Curbed LA. 2016. Accessed December 06, 2016. http://la.curbed.com/2016/11/9/13573924/measure-m-los-angeles-public-transit-results.
Wortham, Jenna. "A Financial Service for People Fed Up With Banks." The New York Times. 2013. Accessed December 06, 2016. http://www.nytimes.com/2013/01/09/technology/a-financial-service-for-people-fed-up-with-banks.html.
Zwyicki, Todd. “THE ECONOMICS AND REGULATION OF NETWORK BRANDED PREPAID CARDS.” Mercatus Center. George Mason University. January 2013. https://www.mercatus.org/system/files/Zywicki_Prepaid_v2_1.pdf.
PAGE �36