smallholder farming systems in the digital age: smartphone app to study the intra-household effects...
TRANSCRIPT

Research on Smallholder Farming Systems in the Digital AgeA Smartphone App to Study the Social Effects of Mechanisation in Zambia
Thomas DaumInstitute of Agricultural Science in the Tropics (Hans-Ruthenberg-Institute)

men & women (& children) have different workloads & duties
• based on crops & tasks• land clearing & ploughing
often by men• weeding, processing &
marketing by women (Bardasi &
Wodon, 2008)
women considered time poor (Bardasi &
Wodon, 2008)
policies & new technologies “target” different crops & tasks
development strategies which overlook dynamics can fail or have negative effects 2
Gendered Agriculture

Mechanization
Stagnating labor productivity (Incomes)
Seasonal labor shortages
Sustainable Intensification
Mechanization neglected but new focus
State-led & market-led
Change in productivity from 1961- 2013 (Pardey, 2015) 3

4
Renewed Focus on
Mechanization
intra-household effects ambiguous
potential positive effects • land ↑ + yield ↑ income ↑• labor ↓ required food ↓
potential negative effects• land ↑ labor for non-
mechanized activities (e.g., weeding & harvesting), carried by women and children ↑ households & children’s nutrition ↓
analyses requires collection of time use & nutrition data from different household members over entire season

5
household survey: large recall & social desirability biases
diaries: burdensome & difficult when respondents are illiterate / lack modern concept of time
direct observations: expensive & presence of researchers may effect behaviors
similar challenges for nutrition data collection
lack of reliable time use and nutrition data difficult to prioritize, design and evaluate development strategies
Challenges of conventional
methods
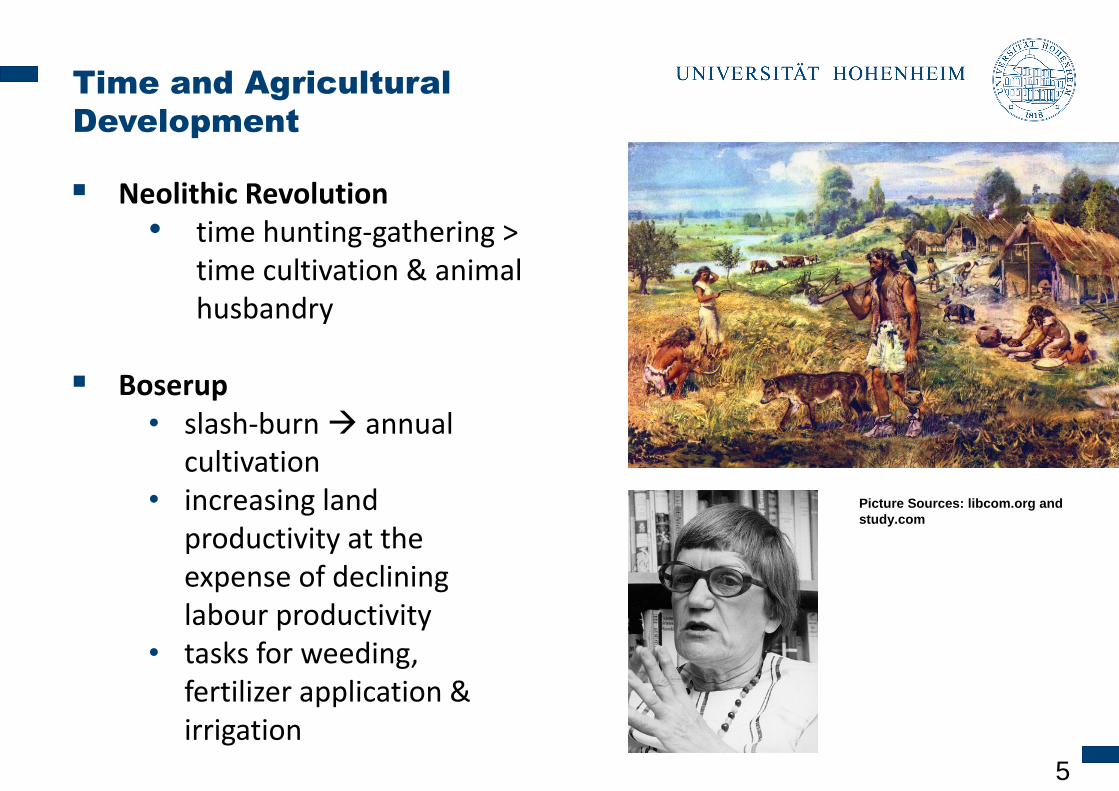
Time and Agricultural
Development
Neolithic Revolution• time hunting-gathering >
time cultivation & animal husbandry
Boserup• slash-burn annual
cultivation• increasing land
productivity at the expense of declining labour productivity
• tasks for weeding, fertilizer application & irrigation
5
Picture Sources: libcom.org and
study.com
7
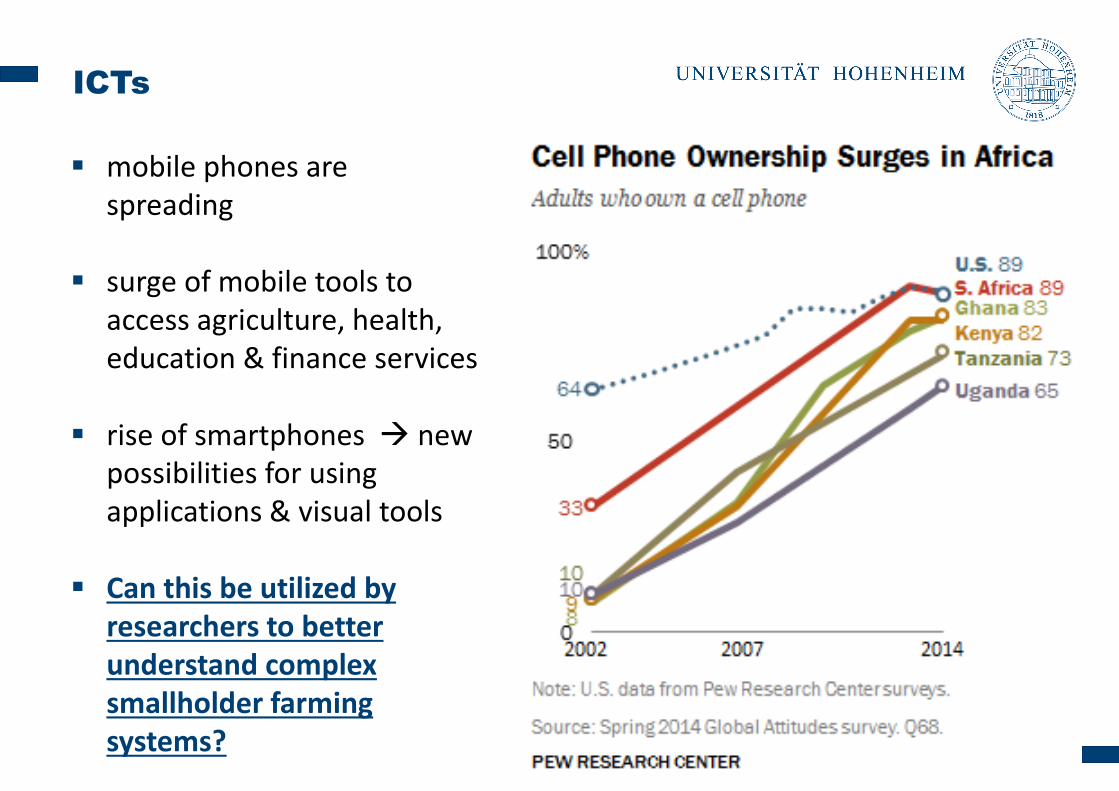
mobile phones are spreading
surge of mobile tools to access agriculture, health, education & finance services
rise of smartphones new possibilities for using applications & visual tools
Can this be utilized by researchers to better understand complex smallholder farming systems?
ICTs

8
respondents record time use & nutrition data in real-time based on visuals
avoid recall biases reasonable sample size illiterate people can use appmore precise than time use
diaries not directly observed by a
researcher
offline (data transfer via laptop) smartphone are blocked battery-life: up to five days
Smartphone App
9
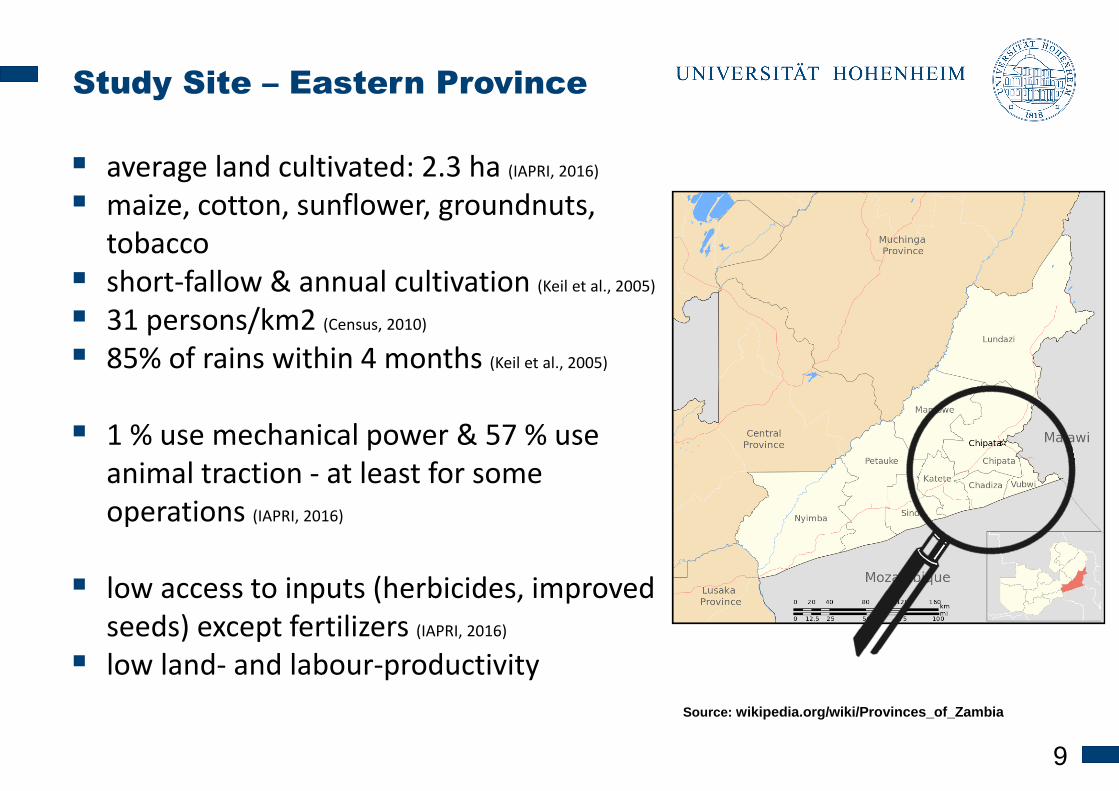
Study Site – Eastern Province
Source: wikipedia.org/wiki/Provinces_of_Zambia
average land cultivated: 2.3 ha (IAPRI, 2016)
maize, cotton, sunflower, groundnuts, tobacco
short-fallow & annual cultivation (Keil et al., 2005)
31 persons/km2 (Census, 2010)
85% of rains within 4 months (Keil et al., 2005)
1 % use mechanical power & 57 % use animal traction - at least for some operations (IAPRI, 2016)
low access to inputs (herbicides, improved seeds) except fertilizers (IAPRI, 2016)
low land- and labour-productivity
10
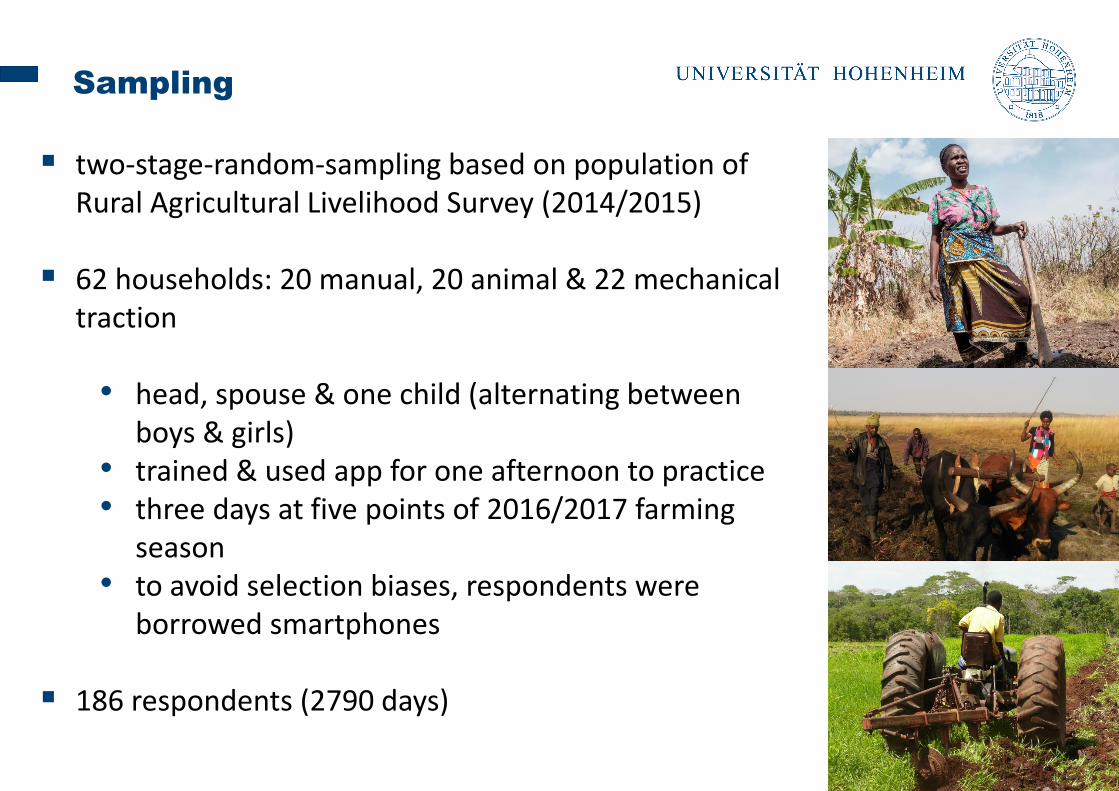
Sampling
two-stage-random-sampling based on population of Rural Agricultural Livelihood Survey (2014/2015)
62 households: 20 manual, 20 animal & 22 mechanical traction
• head, spouse & one child (alternating between boys & girls)
• trained & used app for one afternoon to practice • three days at five points of 2016/2017 farming
season• to avoid selection biases, respondents were
borrowed smartphones
186 respondents (2790 days)
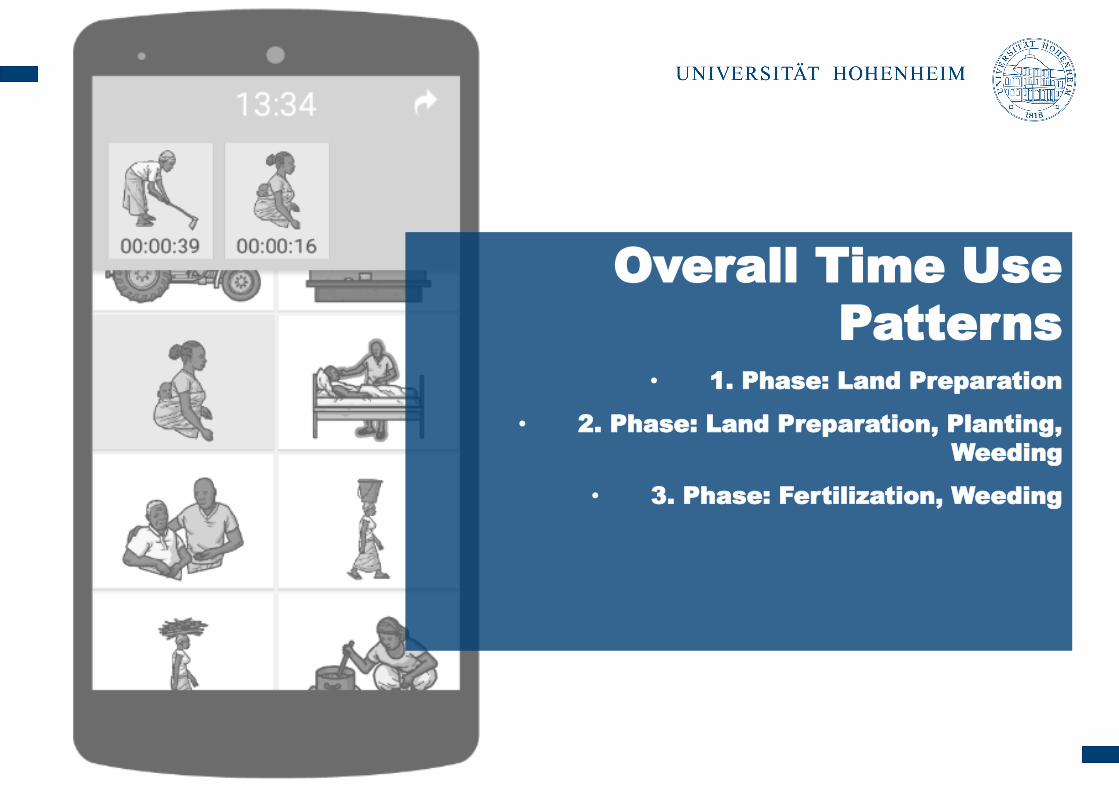
Overall Time Use
Patterns
• 1. Phase: Land Preparation
• 2. Phase: Land Preparation, Planting,
Weeding
• 3. Phase: Fertilization, Weeding
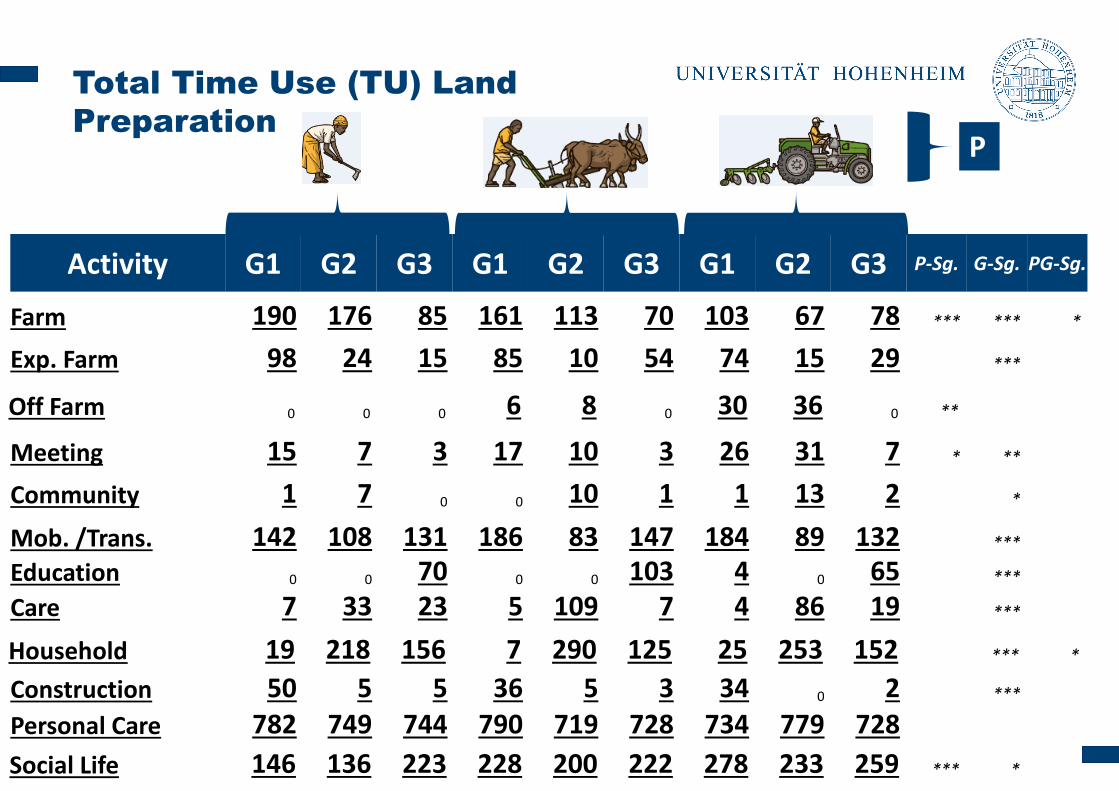
Activity G1 G2 G3 G1 G2 G3 G1 G2 G3 P-Sg. G-Sg. PG-Sg.
P
Social Life 146 136 223 228 200 222 278 233 259 *** *
Personal Care 782 749 744 790 719 728 734 779 728Construction 50 5 5 36 5 3 34 0 2 ***
Household 19 218 156 7 290 125 25 253 152 *** *
Care 7 33 23 5 109 7 4 86 19 ***
Education 0 0 70 0 0 103 4 0 65 ***
Mob. /Trans. 142 108 131 186 83 147 184 89 132 ***
Community 1 7 0 0 10 1 1 13 2 *
Meeting 15 7 3 17 10 3 26 31 7 * **
Farm 190 176 85 161 113 70 103 67 78 *** *** *
Exp. Farm 98 24 15 85 10 54 74 15 29 ***
Off Farm 0 0 0 6 8 0 30 36 0 **
Total Time Use (TU) Land
Preparation
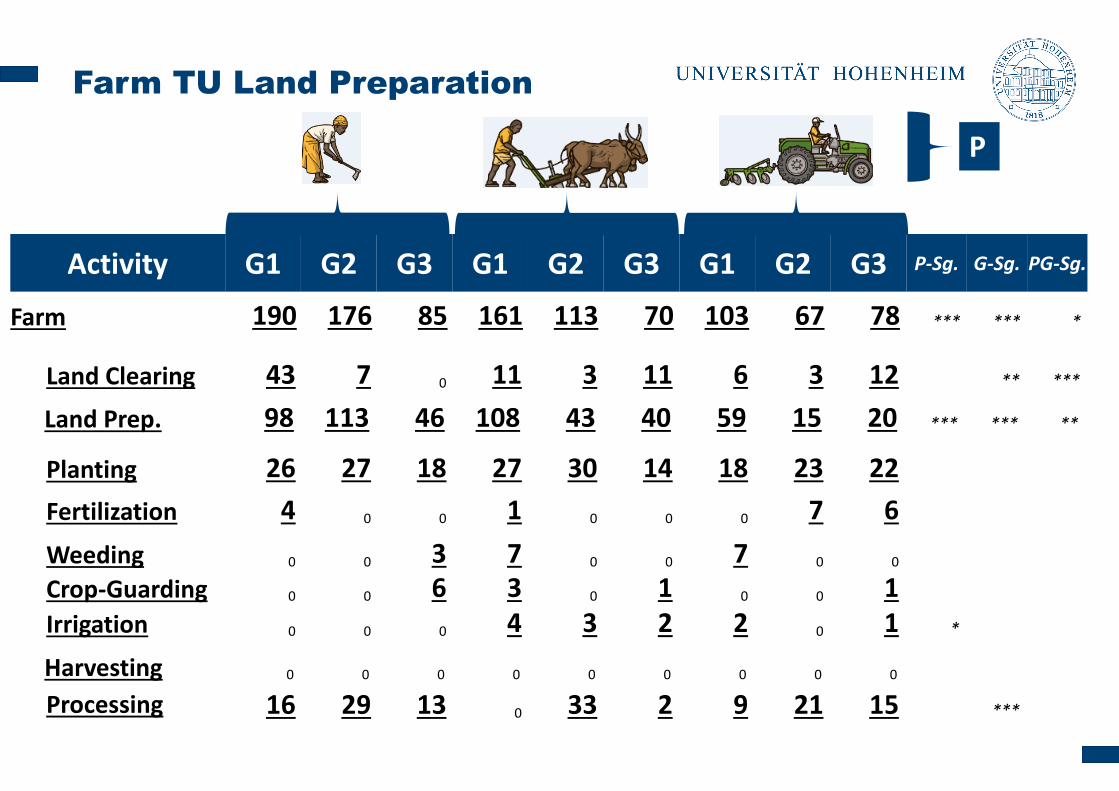
Farm TU Land Preparation
Activity G1 G2 G3 G1 G2 G3 G1 G2 G3 P-Sg. G-Sg. PG-Sg.
P
Processing 16 29 13 0 33 2 9 21 15 ***
Harvesting 0 0 0 0 0 0 0 0 0
Irrigation 0 0 0 4 3 2 2 0 1 *
Crop-Guarding 0 0 6 3 0 1 0 0 1Weeding 0 0 3 7 0 0 7 0 0
Fertilization 4 0 0 1 0 0 0 7 6
Planting 26 27 18 27 30 14 18 23 22
Farm 190 176 85 161 113 70 103 67 78 *** *** *
Land Clearing 43 7 0 11 3 11 6 3 12 ** ***
Land Prep. 98 113 46 108 43 40 59 15 20 *** *** **

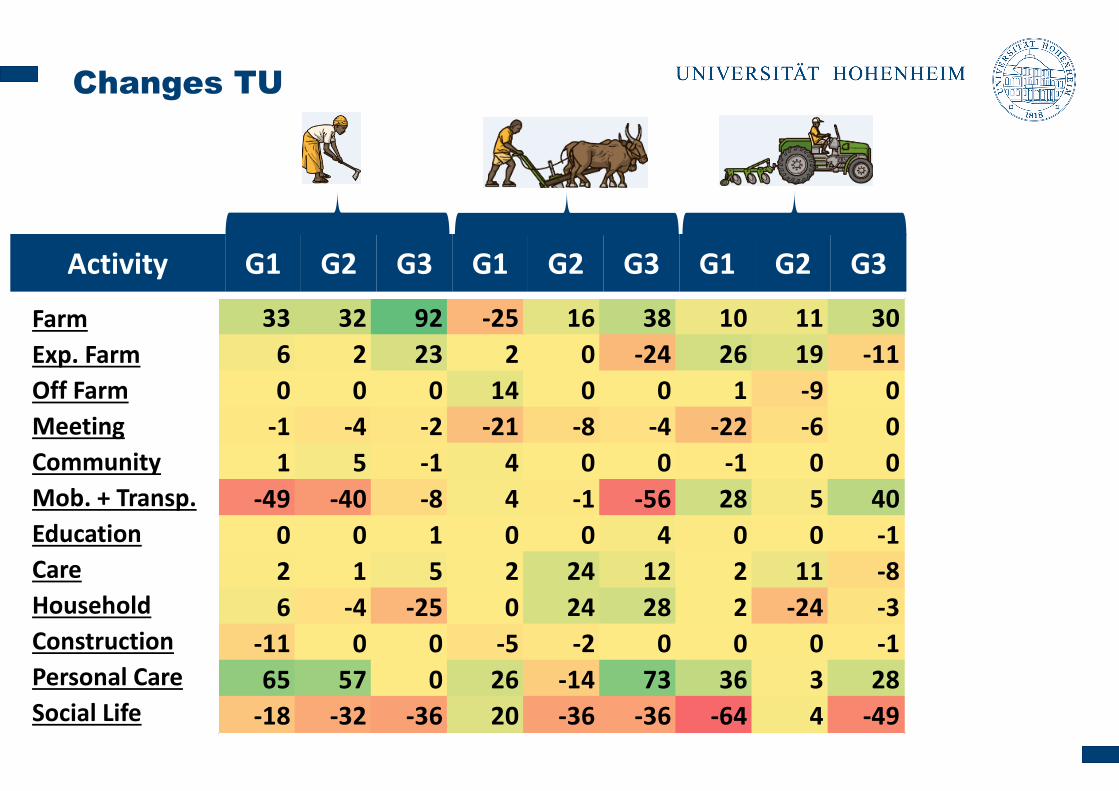
Changes TU
Activity G1 G2 G3 G1 G2 G3 G1 G2 G3
Farm
Exp. Farm
Off Farm
Meeting
Community
Mob. + Transp.
Education
Care
Household
Construction
Personal Care
Social Life
73 73 85 93 106 145 93 124 78
-64 -14 -15 -21 -3 -17 -12 -4 4
0 0 0 -6 -8 0 -30 -4 0
-14 -7 -1 -17 -10 -3 -25 -31 -7
4 -2 2 27 -2 3 29 -7 0
25 41 -2 31 20 41 11 16 -14
0 0 -70 0 0 -100 -4 0 -63
-7 -2 20 -2 -31 -1 -2 -79 -2
-7 -22 -5 0 -76 -40 -9 -53 -30
-35 -5 -5 -32 -3 -3 -34 0 -1
-11 -28 45 -49 24 -19 6 5 61
42 -20 -44 -60 -34 41 -7 -73 3

Activity G1 G2 G3 G1 G2 G3 G1 G2 G3 P-Sg. G-Sg. PG-Sg.
P
Social Life 188 115 180 167 166 263 271 160 261 ** ***
Personal Care 772 721 789 741 744 709 740 784 789 *
Construction 15 0 0 5 2 0 0 0 1 *
Household 12 196 151 7 214 85 16 200 122 ***
Care 0 31 43 3 78 5 2 7 17 * *** ***
Education 0 0 0 0 0 3 0 0 2 **
Mob. /Trans. 168 148 130 217 103 188 196 105 117 *** **
Meeting 5 6 2 27 9 4 31 6 2 ***
Community 1 0 2 0 0 0 1 0 0
Farm 263 249 170 255 219 215 196 191 157 ** **
Exp. Farm 35 9 1 64 7 37 62 11 33 * ***
Off Farm 0 0 0 0 0 0 0 32 0 * * **
Total TU Land Prep. / Planting
/ Weeding
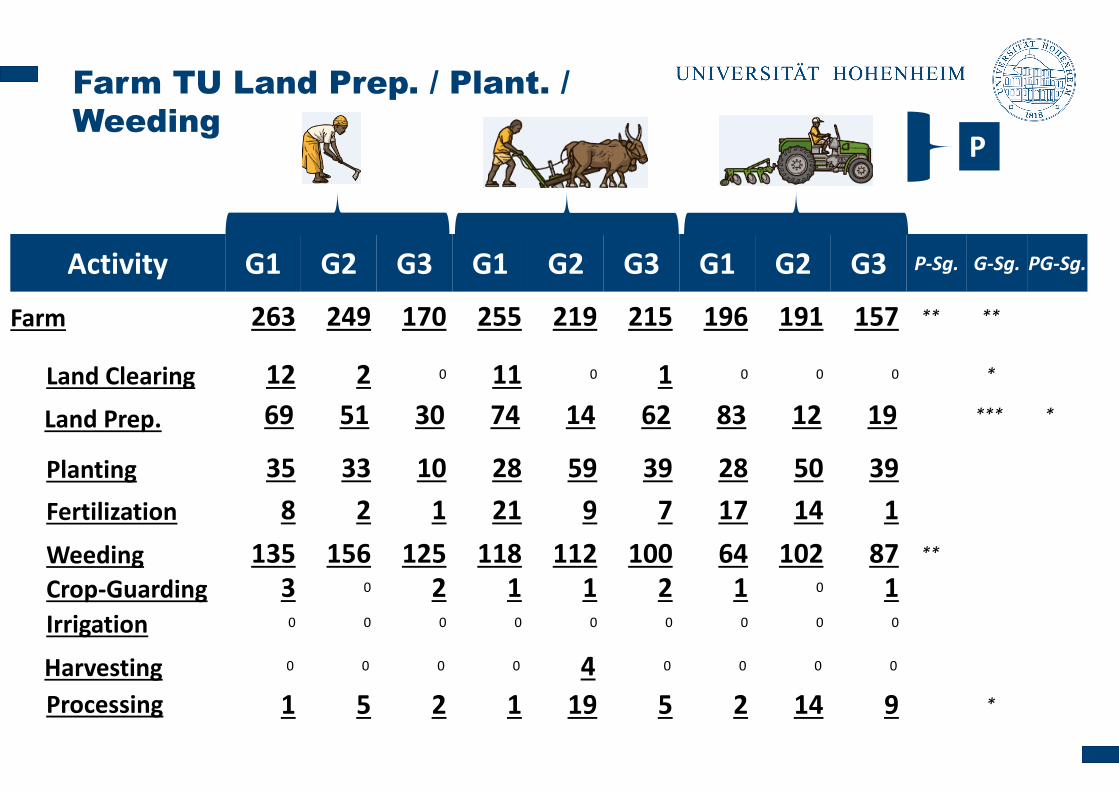
Farm TU Land Prep. / Plant. /
Weeding
Activity G1 G2 G3 G1 G2 G3 G1 G2 G3 P-Sg. G-Sg. PG-Sg.
P
Processing 1 5 2 1 19 5 2 14 9 *
Harvesting 0 0 0 0 4 0 0 0 0
Irrigation 0 0 0 0 0 0 0 0 0
Crop-Guarding 3 0 2 1 1 2 1 0 1Weeding 135 156 125 118 112 100 64 102 87 **
Fertilization 8 2 1 21 9 7 17 14 1
Planting 35 33 10 28 59 39 28 50 39
Farm 263 249 170 255 219 215 196 191 157 ** **
Land Clearing 12 2 0 11 0 1 0 0 0 *
Land Prep. 69 51 30 74 14 62 83 12 19 *** *
Changes TU
Activity G1 G2 G3 G1 G2 G3 G1 G2 G3
Farm
Exp. Farm
Off Farm
Meeting
Community
Mob. + Transp.
Education
Care
Household
Construction
Personal Care
Social Life
33 32 92 -25 16 38 10 11 30
6 2 23 2 0 -24 26 19 -11
0 0 0 14 0 0 1 -9 0
-1 -4 -2 -21 -8 -4 -22 -6 0
1 5 -1 4 0 0 -1 0 0
-49 -40 -8 4 -1 -56 28 5 40
0 0 1 0 0 4 0 0 -1
2 1 5 2 24 12 2 11 -8
6 -4 -25 0 24 28 2 -24 -3
-11 0 0 -5 -2 0 0 0 -1
65 57 0 26 -14 73 36 3 28
-18 -32 -36 20 -36 -36 -64 4 -49
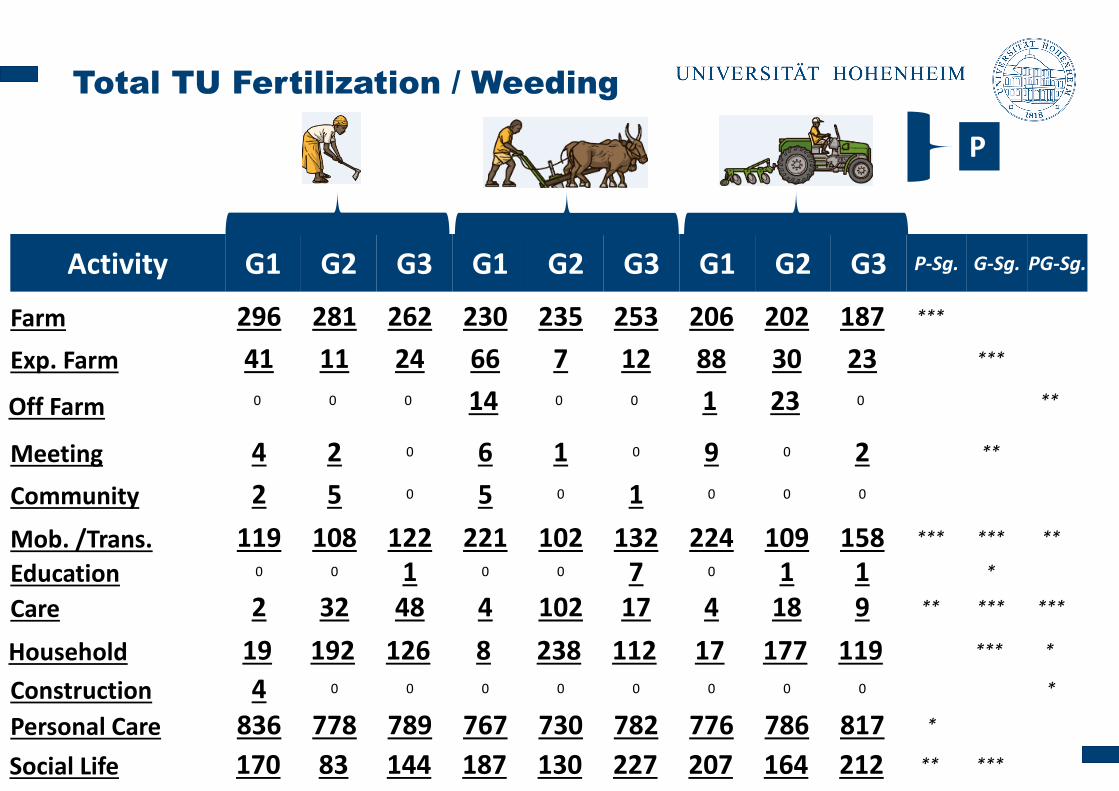
Activity G1 G2 G3 G1 G2 G3 G1 G2 G3 P-Sg. G-Sg. PG-Sg.
P
Social Life 170 83 144 187 130 227 207 164 212 ** ***
Personal Care 836 778 789 767 730 782 776 786 817 *
Construction 4 0 0 0 0 0 0 0 0 *
Household 19 192 126 8 238 112 17 177 119 *** *
Care 2 32 48 4 102 17 4 18 9 ** *** ***
Education 0 0 1 0 0 7 0 1 1 *
Mob. /Trans. 119 108 122 221 102 132 224 109 158 *** *** **
Community 2 5 0 5 0 1 0 0 0
Meeting 4 2 0 6 1 0 9 0 2 **
Farm 296 281 262 230 235 253 206 202 187 ***
Exp. Farm 41 11 24 66 7 12 88 30 23 ***
Off Farm 0 0 0 14 0 0 1 23 0 **
Total TU Fertilization / Weeding

Farm TU Fertilization / Weeding
Activity G1 G2 G3 G1 G2 G3 G1 G2 G3 P-Sg. G-Sg. PG-Sg.
P
Processing 0 8 6 2 15 5 1 15 3 **
Harvesting 0 2 0 0 0 0 0 0 0
Irrigation 0 0 2 0 0 0 0 0 0
Crop-Guarding 2 0 0 0 0 0 0 0 10 *
Weeding 234 224 219 147 158 172 120 151 120 ***
Fertilization 22 9 10 40 39 25 25 14 10 *
Planting 10 12 8 4 20 11 10 14 13
Farm 296 281 262 230 235 253 206 202 187 ***
Land Clearing 14 0 4 2 0 4 2 0 0
Land Prep. 14 25 13 35 3 35 49 9 31 *

Overall Time Use
Patterns – Key
Findings
• men: construction,
transport./mobility,
social life & personal
care
• women: household &
care
• farming gendered but
not strongly
• role of children
• time-buffers

Overall Time Use
Patterns – Key
Findings
• mechanized
households spend less
time farming
• … and more on
extended farming,
transport/mobility, &
social life (also
women)
• mechanization seems
to reduce workload for
women & children

Overall Nutrition
Patterns
• 1. Phase: Land Preparation
• 2. Phase: Land Preparation,
Planting, Weeding
• 3. Phase: Fertilization, Weeding

Daily Nutrition Land Preparation
Food Group G1 G2 G3 G1 G2 G3 G1 G2 G3 P-Sg. G-Sg. PG-Sg.
P
Cereals 1,8 1,9 2,0 2,0 2,0 2,1 1,8 2,1 2,0Vegetables 1,6 1,6 1,7 1,7 1,7 1,6 1,6 1,7 1,6Roots/tubers 0 0,1 0 0 0 0,1 0,1 0,1 0,1 *
Fruits 0,3 0,3 0,3 0,6 0,7 0,6 0,5 0,4 0,6 ***
Meats 0,3 0,2 0,2 0,4 0,3 0,4 0,6 0,5 0,6 ***
Eggs 0,3 0,3 0,3 0,4 0,4 0,4 0,4 0,4 0,4Fish/seafood 0,3 0,2 0,3 0,2 0,3 0,3 0,2 0,2 0,3Pulses/legumes/nuts 0,1 0,1 0,1 0,1 0,2 0,2 0,2 0,2 0,2Milk products 0 0 0,1 0,2 0,1 0,2 0,2 0,2 0,2 ***
Oils/fats 0,2 0,2 0,2 0,3 0,4 0,4 0,5 0,4 0,5 ***
Sugar/honey 0,1 0,1 0,1 0,1 0,1 0,2 0,1 0,2 0,2Condiments 0,1 0,1 0 0,1 0,1 0,2 0,1 0,1 0,1 *
DD Score 3,2 3,4 3,6 4,3 4,0 4,2 4,4 4,3 4,4 ***
Portion Sum 1,1 1,2 1,4 1,4 1,5 1,6 1,4 1,6 1,6 *** *

Changes Daily Nutrition
Food Group G1 G2 G3 G1 G2 G3 G1 G2 G3
Cereals
Vegetables
Roots/tubers
Fruits
Meats
Eggs
Fish/seafood
Pulses/legumes/nuts
Milk products
Oils/fats
Sugar/honey
Condiments
DD Score
Portion Sum
-0,1 0,0 -0,1 -0,5 -0,3 -0,3 -0,1 -0,2 -0,3
-0,1 -0,1 -0,2 -0,3 -0,2 -0,1 -0,1 -0,3 -0,2
0,1 0,0 0,0 0,3 0,3 0,2 0,0 0,1 0,0
0,0 -0,1 -0,1 0,1 -0,1 0,1 -0,1 -0,1 -0,2
-0,1 0,0 0,0 0,1 0,1 0,1 0,1 0,1 0,1
0,0 0,0 0,1 -0,1 0,1 0,1 0,1 0,1 0,2
-0,1 0,0 -0,1 -0,1 -0,1 -0,1 0,0 0,0 0,0
-0,1 -0,1 -0,1 0,1 0,0 0,0 0,0 0,0 0,0
0,0 0,0 0,0 0,0 0,0 0,0 0,0 -0,1 -0,1
-0,1 0,0 -0,1 0,1 0,1 0,1 0,0 0,1 0,0
-0,1 -0,1 0,0 -0,1 0,0 -0,1 0,0 0,0 0,0
0,0 0,0 0,1 -0,1 0,0 -0,1 0,0 0,0 0,0
-0,3 -0,3 -0,5 -0,3 0,2 0,1 -0,1 0,0 0,0
0,0 0,0 -0,2 -0,1 -0,1 -0,1 -0,1 -0,2 -0,1
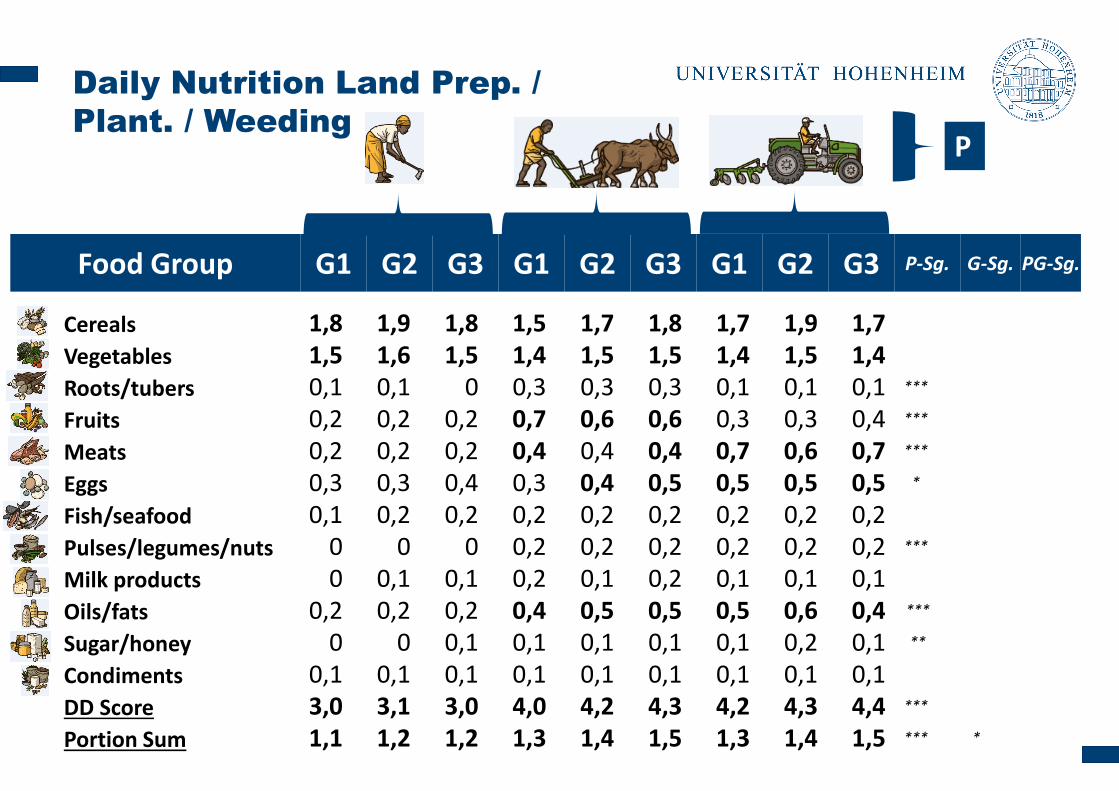
Daily Nutrition Land Prep. /
Plant. / Weeding
Food Group G1 G2 G3 G1 G2 G3 G1 G2 G3 P-Sg. G-Sg. PG-Sg.
P
Cereals 1,8 1,9 1,8 1,5 1,7 1,8 1,7 1,9 1,7Vegetables 1,5 1,6 1,5 1,4 1,5 1,5 1,4 1,5 1,4Roots/tubers 0,1 0,1 0 0,3 0,3 0,3 0,1 0,1 0,1 ***
Fruits 0,2 0,2 0,2 0,7 0,6 0,6 0,3 0,3 0,4 ***
Meats 0,2 0,2 0,2 0,4 0,4 0,4 0,7 0,6 0,7 ***
Eggs 0,3 0,3 0,4 0,3 0,4 0,5 0,5 0,5 0,5 *
Fish/seafood 0,1 0,2 0,2 0,2 0,2 0,2 0,2 0,2 0,2Pulses/legumes/nuts 0 0 0 0,2 0,2 0,2 0,2 0,2 0,2 ***
Milk products 0 0,1 0,1 0,2 0,1 0,2 0,1 0,1 0,1Oils/fats 0,2 0,2 0,2 0,4 0,5 0,5 0,5 0,6 0,4 ***
Sugar/honey 0 0 0,1 0,1 0,1 0,1 0,1 0,2 0,1 **
Condiments 0,1 0,1 0,1 0,1 0,1 0,1 0,1 0,1 0,1DD Score 3,0 3,1 3,0 4,0 4,2 4,3 4,2 4,3 4,4 ***
Portion Sum 1,1 1,2 1,2 1,3 1,4 1,5 1,3 1,4 1,5 *** *
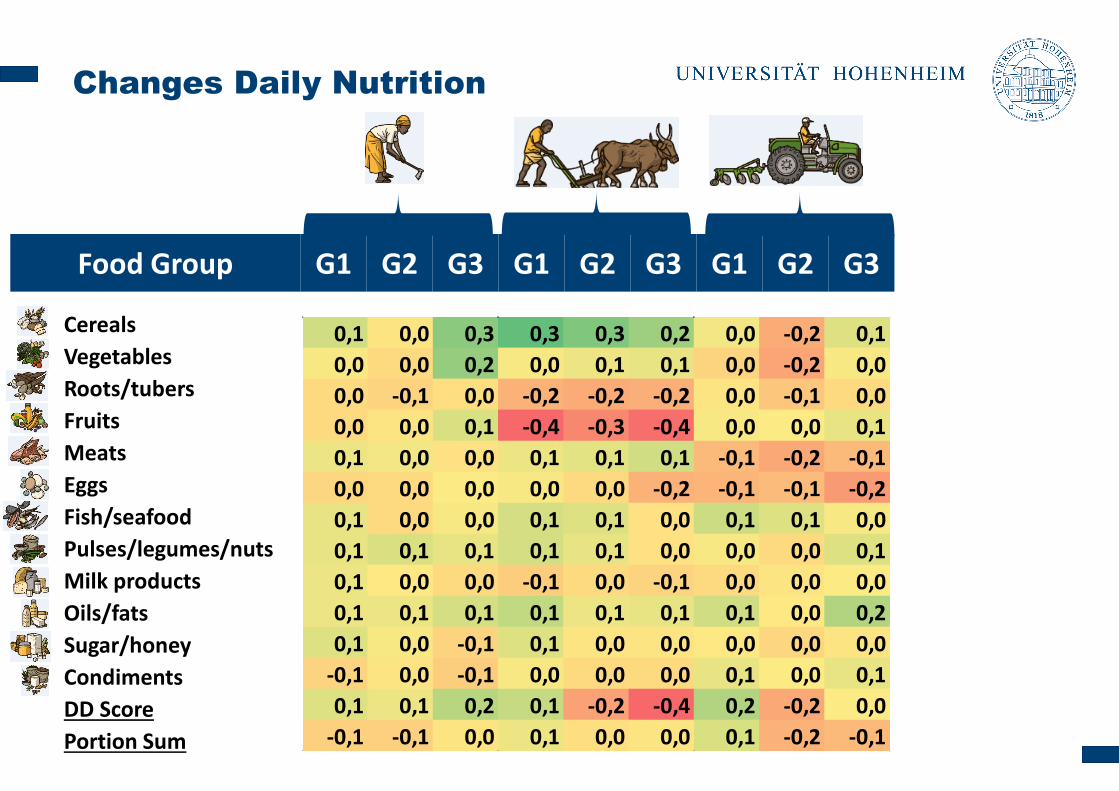
Changes Daily Nutrition
Food Group G1 G2 G3 G1 G2 G3 G1 G2 G3
Cereals
Vegetables
Roots/tubers
Fruits
Meats
Eggs
Fish/seafood
Pulses/legumes/nuts
Milk products
Oils/fats
Sugar/honey
Condiments
DD Score
Portion Sum
0,1 0,0 0,3 0,3 0,3 0,2 0,0 -0,2 0,1
0,0 0,0 0,2 0,0 0,1 0,1 0,0 -0,2 0,0
0,0 -0,1 0,0 -0,2 -0,2 -0,2 0,0 -0,1 0,0
0,0 0,0 0,1 -0,4 -0,3 -0,4 0,0 0,0 0,1
0,1 0,0 0,0 0,1 0,1 0,1 -0,1 -0,2 -0,1
0,0 0,0 0,0 0,0 0,0 -0,2 -0,1 -0,1 -0,2
0,1 0,0 0,0 0,1 0,1 0,0 0,1 0,1 0,0
0,1 0,1 0,1 0,1 0,1 0,0 0,0 0,0 0,1
0,1 0,0 0,0 -0,1 0,0 -0,1 0,0 0,0 0,0
0,1 0,1 0,1 0,1 0,1 0,1 0,1 0,0 0,2
0,1 0,0 -0,1 0,1 0,0 0,0 0,0 0,0 0,0
-0,1 0,0 -0,1 0,0 0,0 0,0 0,1 0,0 0,1
0,1 0,1 0,2 0,1 -0,2 -0,4 0,2 -0,2 0,0
-0,1 -0,1 0,0 0,1 0,0 0,0 0,1 -0,2 -0,1
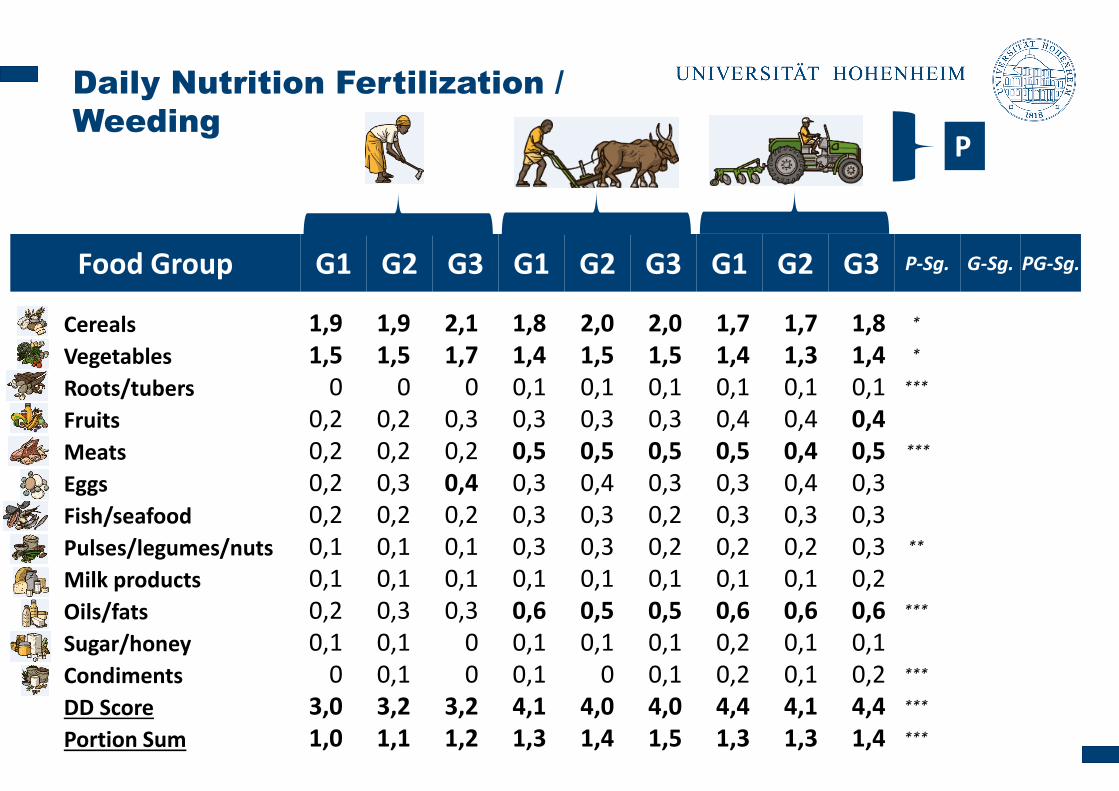
Daily Nutrition Fertilization /
Weeding
Food Group G1 G2 G3 G1 G2 G3 G1 G2 G3 P-Sg. G-Sg. PG-Sg.
P
Cereals 1,9 1,9 2,1 1,8 2,0 2,0 1,7 1,7 1,8 *
Vegetables 1,5 1,5 1,7 1,4 1,5 1,5 1,4 1,3 1,4 *
Roots/tubers 0 0 0 0,1 0,1 0,1 0,1 0,1 0,1 ***
Fruits 0,2 0,2 0,3 0,3 0,3 0,3 0,4 0,4 0,4Meats 0,2 0,2 0,2 0,5 0,5 0,5 0,5 0,4 0,5 ***
Eggs 0,2 0,3 0,4 0,3 0,4 0,3 0,3 0,4 0,3Fish/seafood 0,2 0,2 0,2 0,3 0,3 0,2 0,3 0,3 0,3Pulses/legumes/nuts 0,1 0,1 0,1 0,3 0,3 0,2 0,2 0,2 0,3 **
Milk products 0,1 0,1 0,1 0,1 0,1 0,1 0,1 0,1 0,2Oils/fats 0,2 0,3 0,3 0,6 0,5 0,5 0,6 0,6 0,6 ***
Sugar/honey 0,1 0,1 0 0,1 0,1 0,1 0,2 0,1 0,1Condiments 0 0,1 0 0,1 0 0,1 0,2 0,1 0,2 ***
DD Score 3,0 3,2 3,2 4,1 4,0 4,0 4,4 4,1 4,4 ***
Portion Sum 1,0 1,1 1,2 1,3 1,4 1,5 1,3 1,3 1,4 ***
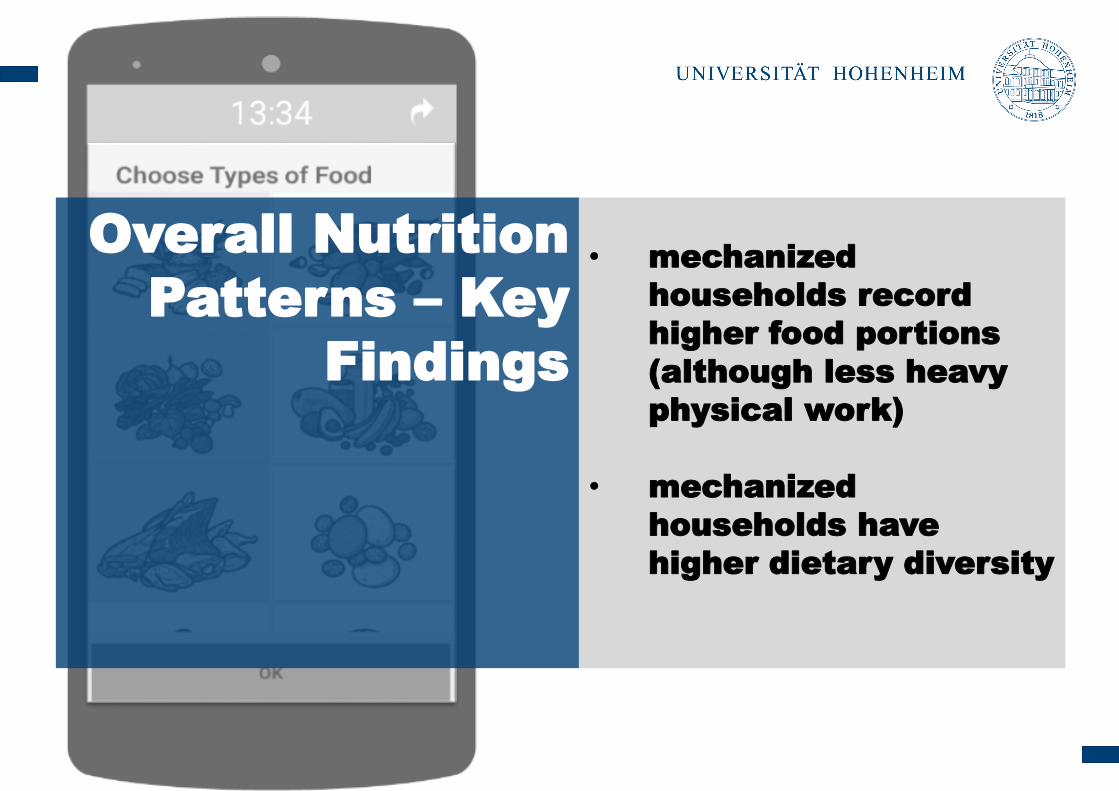
• mechanized
households record
higher food portions
(although less heavy
physical work)
• mechanized
households have
higher dietary diversity
Overall Nutrition
Patterns – Key
Findings
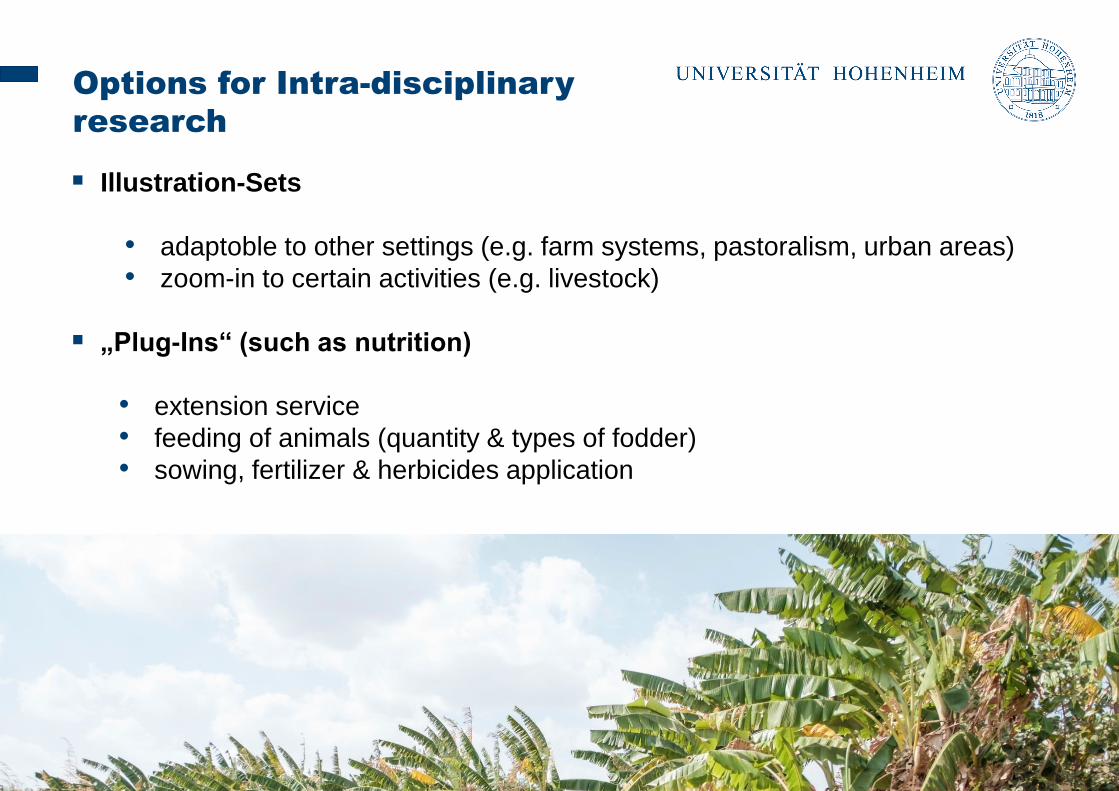
Illustration-Sets
• adaptoble to other settings (e.g. farm systems, pastoralism, urban areas)
• zoom-in to certain activities (e.g. livestock)
„Plug-Ins“ (such as nutrition)
• extension service
• feeding of animals (quantity & types of fodder)
• sowing, fertilizer & herbicides application
29
Options for Intra-disciplinary
research

Pictures
• e.g. of pests plant production
Equipped-In Sensors
• position
• migration patterns
• social and economic reach
• measuring plot-sizes (prepared, sown,
harvested etc.)
• motion
• environmental
• links with humidity, rainfall optimal
sowing dates, application of fertilizer etc.
External Sensors
30
Options for Intra-disciplinary
research

well designed apps can serve as a reliable, affordable & participatory tool for
collection of different types of data…
…. that might be otherwise difficult to obtain
wide & untapped potential for further transdisciplinary uses
promising example of new approach for research on agricultural systems in the
digital age
31
Conclusion
Agricultural mechanization
and time use
A smartphone app study in Zambia Thank you!