small hydropower technology and market assessment
TRANSCRIPT

SMALL HYDROPOWER TECHNOLOGY AND
MARKET ASSESSMENT
Submitted To:
Energy Trust of Oregon
January 26, 2009
Final Report

Submitted to: Betsy Kauffman and Jed Jorgensen Energy Trust of Oregon 851 SW Sixth Avenue, Suite 1200 Portland, OR 97204 Submitted by: Summit Blue Consulting, LLC 1722 14th Street, Ste. 230 Boulder, CO 80302 720.564.1130 With assistance from Golder Associates Contact: Jane Pater Salmon 720.564.1130 [email protected] Patricia Thompson 925.935.0270 [email protected]

ACKNOWLEDGEMENTS The authors would like to acknowledge the assistance and support that was provided by personnel at Energy Trust of Oregon, as well as the input generously provided by key staff at regulatory agencies, consulting and engineering firms, and organizations considering or already developing small hydro projects. In particular, the following individuals provided input into this report: Brett Bauer, Canyon Hydro; Jerry Bryan, Farmers Irrigation District; John Croockewit, BC Hydro; John Hargrove, NV Energy; Craig Kohanek, Oregon Water Resources Department; Randy Landolt, PacifiCorp; Jan Lee, Swalley Irrigation District; Kent Madison, 3RValve; Glenn McDonnell, Sigma Engineering; Cherise Oram, Stoel Rives; Jim Pendleton, Talent Irrigation District; Hal Simms, Oregon Department of Energy; Alan Soneda, Pacific Gas and Electric; Cliff Malm, CF Malm Engineers; Mark Wharry, Winzler & Kelly.
Summit Blue Consulting, LLC i

TABLE OF CONTENTS E! Executive Summary............................................................................................ 3!
E.1! Resource Assessment ...................................................................................... 3!
E.2! Technology Assessment................................................................................... 4!
E.3! Market Assessment.......................................................................................... 4!
E.4! Opportunities and Actions Needed to Move the Market Forward ......................... 5!
1! Introduction ....................................................................................................... 7!
1.1! Scope of Work ................................................................................................ 7!
1.2! Small Hydro Site Characteristics ....................................................................... 8!
1.3! Report Organization ........................................................................................ 9!
2! Resource Assessment ........................................................................................ 10!
2.1! Major Water Rights Holders ............................................................................ 10!
2.1.1! “First Tier” Assessment ........................................................................ 13!
2.1.2! “Second Tier” Assessment.................................................................... 14!
2.2! Survey of Second Tier Rights Holders .............................................................. 15!
2.2.1! Survey Methodology ............................................................................ 15!
2.2.2! Resource-Related Survey Results.......................................................... 16!
3! Technology Assessment .................................................................................... 19!
3.1! Overview of Small Hydropower Technology...................................................... 19!
3.1.1! Major Classes of Small Hydropower Turbines ........................................ 20!
3.1.2! Matching Hydro Technologies to Resources........................................... 23!
3.2! Low Head Hydro ............................................................................................ 24!
3.2.1! Challenges of Low-Head Hydro Applications .......................................... 25!
3.2.2! Low-Head Technology Options ............................................................. 25!
3.3! Specialized Applications of Small Hydro............................................................ 27!
3.3.1! In-Conduit Technology: Pressure Reducing Valves................................. 27!
3.3.2! Aquifer Storage and Recovery (ASR)..................................................... 28!
3.4! Operating and Implementation Improvements ................................................. 29!
3.5! Small Hydro Costs: Extremely Site Dependent.................................................. 31!
3.5.1! Capital Costs ....................................................................................... 33!
3.5.2! Operations and Maintenance Costs ....................................................... 36!
3.5.3! Effect of Production Tax Credit on Project Economics ............................ 37!
Summit Blue Consulting, LLC 1
4! Market Assessment............................................................................................ 39!
4.1! Current Market Activity ................................................................................... 39!
4.2! Barriers to New Development.......................................................................... 44!
4.2.1! Internal Expertise Is Lacking ................................................................ 44!
4.2.2! Permitting Process............................................................................... 45!
4.2.3! Interconnection ................................................................................... 55!
4.2.4! Lack of Familiarity with Available Resources .......................................... 55!
5! Opportunities and Actions Needed to Move the Market Forward..................... 57!
5.1! Opportunities for New Development ................................................................ 57!
5.1.1! Piggyback on Existing Diversions .......................................................... 57!
5.1.2! Leverage Planned Construction Projects................................................ 58!
5.1.3! Access Year-Round Water for Irrigation District Projects ........................ 60!
5.2! Short-Term Actions Needed to Move the Market Forward.................................. 61!
5.2.1! Provide an Expert to Help Interested Organizations Navigate the Process 61!
5.2.2! Raise Awareness about Energy Trust’s Support ..................................... 62!
5.2.3! Create a Road Map of All Permitting Requirements ................................ 63!
5.2.4! Create Long-Term Certainty in Incentive Levels..................................... 63!
5.3! Long-Term Actions Needed to Move the Market Forward .................................. 64!
5.3.1! Align State and Federal Exemptions...................................................... 64!
5.3.2! Centralize Permitting ........................................................................... 65!
Summit Blue Consulting, LLC 2

E EXECUTIVE SUMMARY The state of Oregon is rich in hydropower resources. When developed on a small scale, these resources provide a clean electricity source with minimal environmental impact. With increasing concerns about greenhouse gas emissions, energy security, and fossil fuel prices, these resources are becoming more attractive.
Energy Trust has offered incentives for hydro projects smaller than 20 MW through its Open Solicitation program in the form of funding of feasibility studies and above-market costs and limited technical assistance to organizations interested in developing a project. Energy Trust sought to determine what is needed to move the market forward. This report presents an assessment of the market for the development of small hydropower projects in Oregon and the technology available to deploy in that market.
Specifically, the overall goals of this assessment are as follows:
! To develop an understanding of the technologies, project types, configurations, and associated costs appropriate for hydropower development in Oregon.
! To develop an understanding of the current conditions, barriers, and opportunities related to the formation of a functional hydropower installation market in Oregon.
E.1 Resource Assessment A total of approximately 41,500 water rights within the PGE and Pacific Power service areas were identified and classified to determine the largest water rights holders in PacifiCorp and Portland General Electric (PGE) service territories. Maps were created to identify the location of all water rights holders within these geographic regions, and database analysis was used to identify the largest water rights holders in each territory, segmented into five groups: agricultural uses, industrial/manufacturing uses, irrigation uses, municipal uses, and storage uses. The largest water rights holders were found to be in the irrigation and municipal categories.
The Summit Blue team conducted a survey of a sample of the users having estimated annual water allocations greater than 10,000 acre-feet and a priority date of 1980 or earlier. The survey population focused on municipal and irrigation uses. The survey responses provided further detail about the resource characteristics, internal organizational capacity to manage a hydro project development, and familiarity with Energy Trust’s hydro project assistance.
The results of the resource-related components of the survey led to four resource-related main findings:
! Sites with storage appear to be an untapped opportunity for development.
! The market for small hydro development in Oregon is fragmented in terms of site characteristics.
! Several of the survey respondents appear to have sites with characteristics favorable for project development: North Unit Irrigation District, Vale Oregon Irrigation District, City of Corvallis, City of Coquille, City of Adair Village.
Summit Blue Consulting, LLC 3
! Of the sites with incomplete information, it would be worthwhile to find out the additional information from the City of Banks, the City of Saint Helens, and Tualatin Valley Irrigation District.
E.2 Technology Assessment Since the market for hydro is fairly mature, most of the technologies available have been in the market place for a long time. The background provided in this section provides a framework for understanding the factors that are included in the selection of technology for a given project as well as some of the more common types of technologies available in the marketplace today.
The technology assessment begins with an overview of the concepts that provide the foundation for small hydropower projects and technologies, including the physics of small hydro and technology classifications. Following the discussion of the fundamentals, the section continues with more in-depth discussions of the technologies that are appropriate for two types of more recent projects: low-head sites and in-conduit applications. Then, a discussion of recent developments and improvements to technology implementation follows. Finally, the section concludes with information on the current capital cost of developing small hydro systems as well as the associated operations and maintenance (O&M) costs.
E.3 Market Assessment The market assessment builds on the results of the resource assessment. The resource assessment identified the largest water rights holders as primarily irrigation districts and municipalities, and the market assessment sought input from critical market actors that interface with these types of organizations. Input from several market actors led to further investigation of the opportunity for incremental hydro upgrades in Oregon.
The market assessment found that the market for small hydro development in Oregon is fragmented and, as a result, served by a small number of in-state resources. Small hydro development is driven primarily by site-specific characteristics, and no two sites are identical. Further, the segmentation of the market for small hydro creates several niche markets but fails to create the types of economies of scale needed to incentivize private-sector involvement in the market. Several organizations offer financial assistance for small hydro projects in Oregon, but these are not sufficient to overcome the primary barriers outlined in Table E-1.
Summit Blue Consulting, LLC 4

Table E-1. Barriers to a Robust Market for Small Hydro in Oregon
Barrier Description
Internal Expertise Is Lacking
One of the most critical components of a successful project is an internal champion with the ability to coordinate the effort and lead parts of project development. Generally speaking, these resources are lacking among the irrigation districts and municipalities in Oregon.
Permitting The permitting process is the most complex part of the development cycle. Market actors highlighted these issues as most critical:
! Market perceives process as time-consuming and expensive: The paperwork, the time, and the financial commitments required to navigate the permitting process deter many organizations from starting the process.
! Oregon’s “No Dead Fish” rule: New run-of-river hydro projects and upgrades to existing facilities must prove that they do not result in any net loss of fish. The result is additional costs in terms of studies and time.
! Seasonal water rights hurt project economics: A project’s economic feasibility is compromised by water rights that are only valid for part of the year, such as those held by irrigation districts.
! Certificated water rights: Organizations that would otherwise be good candidates for project development may not hold certificated water rights, which are pre-requisites for hydro development. The risks associated with obtaining certificated water rights may deter such organizations from pursuing hydro development.
! Lack of appropriate city and county land use ordinances: Only one county in the state has an appropriate land use ordinance in place. Future projects will have to lobby for the passage of similar ordinances in order to move forward.
! Other permitting issues: Aquifer storage and recovery facilities are not able to install hydro facilities during initial construction under existing permitting rules. Retrofitting the facilities with the hydro equipment increases costs significantly.
Interconnection The process for interconnecting small renewable energy systems was described as more difficult than it needs to be.
Lack of Familiarity with Available Resources
More than 70% of survey respondents reported one of the two lowest levels of awareness of the Business Energy Tax Credit (BETC) and Energy Trust’s assistance.
E.4 Opportunities and Actions Needed to Move the Market Forward
Development of a market for small hydro projects driven by the private sector will be difficult under existing permitting requirements. The long time horizons required to develop projects require higher rates
Summit Blue Consulting, LLC 5

of return for private market actors than can be achieved in the absence of additional incentives. Within this current framework, three types of opportunities can be identified by leveraging existing processes:
! Piggybacking on Existing Diversions: Organizations that already have the right to divert water can bypass the need to obtain new water rights, significantly shortening the permitting process.
! Leveraging Planned Construction Processes: Small hydro systems can be added to new piping systems and pump replacement projects at minimal incremental cost. Identifying such capital projects early in their development can enable an alignment of the timeline of the hydro project with the timeline for the primary capital project.
! Accessing Year-Round Water for Irrigation District Projects: It appears possible that seasonal water rights holders (e.g., irrigation districts) are able to access water year round to supply their projects. This approach requires that several conditions are met, but it can lead to favorable project economics for projects that would not otherwise be economically viable.
With these opportunities in mind, several short-term actions can be taken to help stimulate the market for small hydro:
! Provide an Expert to Help Interested Organizations Navigate the Development Process: A paid expert could be dispatched to multiple organizations interested in developing projects to help navigate the development process, addressing one of the primary barriers to project development.
! Raise Awareness about Energy Trust’s Support: Increasing outreach to key market actors would aid in transferring knowledge about the feasibility of and support for small hydro projects and would highlight additional benefits gained by participants in Energy Trust programs.
! Create a Road Map of All Permitting Requirements: A series of concise guides targeted at specific market actors would outline the information required, timelines, and tips for preparing successful permitting applications.
! Create Long-Term Certainty in Incentive Levels: A commitment to a standard incentive offer on the horizon of five to ten years would reduce the risk that project economics would change partway through the development process.
To promote a stable market driven by the private sector over the long term, changes to the permitting process are necessary. Affecting these policy-focused changes will require the commitment of significant time and resources over a longer period of time. The ability to affect change in these areas is, for the most part, out of the control of Energy Trust, but these changes would help to address some of the primary barriers to the development of small hydro:
! Align State and Federal Exemptions: Alignment between the trigger points for expediting the permitting process at the state and federal level would further streamline the permitting process, reducing cost and confusion.
! Centralize Permitting: Creating one point of contact for permitting small hydro projects that addresses federal, state, county, and local issues would make the permitting process even more accessible. This central permitting body would need to address the needs of all relevant permitting agencies while creating a process that is manageable for project developers.
Summit Blue Consulting, LLC 6
1 INTRODUCTION The state of Oregon is rich in hydropower resources. When developed on a small scale, these resources provide a clean electricity source with minimal environmental impact. With increasing concerns about greenhouse gas emissions, energy security, and fossil fuel prices, these resources are becoming more attractive.
Energy Trust has offered incentives for hydro projects smaller than 20 MW through its Open Solicitation program in the form of funding of feasibility studies and above-market costs and limited technical assistance to organizations interested in developing a project. Energy Trust sought to determine what is needed to move the market forward. This report presents an assessment of the market for the development of small hydropower projects in Oregon and the technology available to deploy in that market.
Specifically, the overall goals of this assessment are as follows:
! To develop an understanding of the technologies, project types, configurations, and associated costs appropriate for hydropower development in Oregon.
! To develop an understanding of the current conditions, barriers, and opportunities related to the formation of a functional hydropower installation market in Oregon.
Towards these ends, the Summit Blue Consulting and its subcontractor, Golder Associates (together the Summit Blue team) conducted research that tapped into a broad base of knowledge about small hydro development. Interviews of market actors that are, or have been, involved in small hydro projects in Oregon provided insight into the current state of the market. Surveys with potential project hosts elicited information about the character of the sites available for small hydro development and about the characteristics of the organizations that could serve as hosts. A literature review drew on decades of accumulated knowledge about this relatively mature industry.
The results of the assessment include a more current knowledge of the state of the industry and indications about the awareness in the marketplace regarding Energy Trust’s efforts to support this industry. Feedback from market actors and analysis of the opportunities and barriers in the marketplace present several options for Energy Trust’s role in the marketplace going forward. As the Summit Blue team collected this information, dozens of individuals from potential host sites were engaged on behalf of Energy Trust. Through discussions about their organizational goals and capabilities, the Summit Blue team deepened these market actors’ knowledge about the resources that Energy Trust offers to assist in promoting small hydro development.
1.1 Scope of Work This assessment used a three step approach to provide a sketch of the current market for small hydro development. First, a resource assessment identified the largest water rights holders in the PacifiCorp and Portland General Electric (PGE) service territories. Second, a literature review was identifying technologies appropriate for the types of resources found in Oregon. Finally, a market assessment pulled together the findings of the resource assessment and market assessment to create a picture of the business environment for small hydro in Oregon.
The resource assessment was conducted in advance of the technology and market assessments to use the resources allocated for the subsequent tasks in a more targeted manner. By understanding the resources available, the Summit Blue Team could filter out the technologies that do not apply to the region,
Summit Blue Consulting, LLC 7

Summit Blue Consulting, LLC 8
allowing more time to focus on the technologies and market conditions that are relevant to the PGE and PacifiCorp service territories.
The technology assessment followed the resource assessment to target those technologies that can be effectively deployed in the region. Technologies reviewed were either fully commercially available or were in the early commercialization phase of development; technologies still in the research and development (R&D) phase were not considered. For these reasons, neither tidal nor wave power technologies were included in the review.
Building on the resource and technology assessments, the market assessment provides insight into current perspectives on the marketplace for small hydro development. The interviews and surveys provided a mixture of perspectives, including individuals whose organizations are currently developing hydro projects as well as those who are open to the idea but have not begun pursuing it as of yet.
Finally, the Summit Blue team identifies and describes opportunities to bolster the hydropower development market. The interviews draw lessons for small hydro development from a successful market in a relatively similar context, British Columbia, as a benchmark for the characteristics that are required for a thriving marketplace. The opportunity assessment leverages that benchmark as well as the project team’s existing knowledge of the broader context for renewable energy in Oregon and the cultural context in which water districts operate.
1.2 Small Hydro Site Characteristics1 Figure 1 depicts the fundamental elements of a run-of-river small hydro system. The “run-of-river” indicates that they system does not utilize a storage facility and that the turbine operates within the stream. The fundamental elements include the following:
! The weir regulates the flow through the intake.
! The settling tank, or forebay, removes particulate matter from the water entering the turbine; a protective trash rack, or a group of metal bars, is typically found near the forebay to protect it from the larger materials that may be found in the stream, such as leaves, sticks, and refuse.
! The penstock is a pipe through which the water flows from the highest point to the lowest point of the system; it carries the water from the forebay to the turbine.
! A small canal or “leat” carriers water to the forebay for medium- and high-head installations.
1 This section is based on Oliver Parish, "Small Hydro Power: Technology and Current Status," Renewable and Sustainable Energy Reviews 6(2002): 537-556.

Figure 1. Typical Small Hydro Site Layout
Source: Oliver Parish, "Small Hydro Power: Technology and Current Status," Renewable and Sustainable Energy Reviews 6(2002): 537-556.
1.3 Report Organization This report is comprised of four main sections; resource assessment in Section 2, technology assessment in Section 3, market assessment in Section 4, and opportunities and recommendations in Section 5.
Summit Blue Consulting, LLC 9

2 RESOURCE ASSESSMENT The resource assessment served as the foundation for the technology and market characterizations. The findings from an initial search of the Oregon Water Resource Department’s water rights database) guided further investigation into the types of site characteristics found at these organizations’ facilities. The Summit Blue team deployed a survey to gather more information about these sites, their water rights, and organizational characteristics that are important for small hydro project development.
2.1 Major Water Rights Holders At Energy Trust’s direction, the Summit Blue team identified major rights holders in the PGE and PacifiCorp service territories. The largest water rights holders are the most likely to have access to the flows necessary to create a viable small hydro project because volumetric flows are one of the critical components of project economics. The publicly available data provides a high level view of the types of entities that may have access to the resource needed to develop a small hydro project, but they do not include the more detailed information needed to calculate the energy potential of a given site. The results of this analysis can be used to engage the major water rights holders on small hydro development in an effort to identify specific sites that have developable potential.
Major water rights holders within the PGE and PacifiCorp service areas were identified through spatial analyses using geographic data obtained from ETO and the Oregon Water Resources Department (OWRD). The analyses were performed using geographic information system (GIS) software, and used Energy Trust of Oregon geospatial data describing the extent of each service area and water right point-of-diversion (POD) locations from OWRD’s Water Rights Information System (WRIS) database. Water rights information contained in the WRIS database includes useful information related to the resource, including:
! Water right point of diversion (POD) location;
! Type of water right (e.g., surface water, groundwater, and storage);
! Name or business name of water right holder;
! Approved water right use (e.g., municipal, irrigation, industrial/manufacturing, and agriculture);
! Instantaneous amount of water that may be applied at any time from POD;
! Maximum storage volume;
! Name of source stream (for surface water POD) or well (for groundwater appropriation);
! Priority date (date identifying which users have priority to water during periods of water shortage; the more senior the water right, the longer water is available during periods of shortage); and
! Period of use (dates identifying allowed use under water right).
Summit Blue Consulting, LLC 10

Summit Blue Consulting, LLC 11
The analyses resulted in identification of approximately 25,766 PODs within the PacifiCorp service area and approximately 15,728 PODs within the PGE service area. As can be seen in Figure 2, most of the sites are in the western part of the state, although there are significant portion in the northeast.
The water rights holders identified within each service area were further analyzed to identify preliminary candidate hydro projects, or “First Tier” projects. Results of the “First Tier” assessment were used to refine projects with a higher likelihood of development potential, or “Second Tier” projects, based on additional modifications to the WRIS database queries. Results of the “First Tier” and “Second Tier” assessments are described in Sections 2.1.1 and 2.1.2.

Figure 2. Water Rights Points of Diversion by Service Area
Source: Summit Blue Team
Summit Blue Consulting, LLC 12

2.1.1 “First Tier” Assessment
The Summit Blue team used the WRIS database water rights identified during the geospatial analyses to develop a “First Tier” list of potential water rights holders within each service area. Results of the “First Tier” assessment represent a preliminary evaluation of potential small-scale hydropower projects. The following selection criteria were used in developing the “First Tier” list:
! Approved water right use; and
! Estimated annual water right allocations greater than 5,000 acre-feet (based on WRIS instantaneous rate and period of use).
The “First Tier” database query results are discussed further in the following two sections.
PacifiCorp Service Area
Of the total 25,766 water rights listings identified in the PacifiCorp service area, 810 listings under 696 different users had annual water right allocations greater than 5,000 acre-feet. The most common POD type is surface water, as summarized in Table 1.
Table 1. Summary of “First Tier” Assessment
Number of Water Rights Listings Within Service Area
Water Right POD Type PacifiCorp PGE
Surface Water 781 149
Ground Water 14 12
Storage 15 2
Total 810 163
!"#$%&#'(&)*+,(&-*,.(/&*0(&/,12'),3&,45(0&)'*6&161)1*,,3&0(740)(8&+3&94,8(0&:;<<=>&8.(&)4&*6&*??4.6)162&8*)*+*/(&(0040&5'(0(+3&/4@(&,1/)162/&5(0(&?4.6)(8&@40(&)'*6&46?(A&
Source: Summit Blue Team
Appendix B presents results of the “First Tier” WRIS database query for the PacifiCorp service area and lists the name or business name of the water right holder, approved usage, estimated annual allocation quantity, and priority date for the 20 greatest (when available) allocation quantities by the following uses: agriculture, industrial/manufacturing, irrigation, and municipal. Irrigation uses includes primary and supplemental use categories.
Appendix B also presents the percentage share of the 20 greatest allocation quantities (when available) for each use when compared to the total allocation for that use. The results indicate that there could be some more potential opportunities under the “Irrigation” use category since the top 20 has only accounted for approximately 62 percent of the total and that the low-end of the range (36,198 acre-feet) is near or above the top-end of the range for some of the other use categories.
Summit Blue Consulting, LLC 13

Summit Blue Consulting, LLC 14
The worksheet contains results of the entire database query categorized by usage type.2 The calculated annual allocation quantity, priority date, and name of water rights holder can be accessed for each usage type by clicking on the plus sign to the left of the usage type name. Currently, the results of the search criteria are expanded for the following usage types: agriculture, industrial/manufacturing, irrigation, and municipal. Statistics on the WRIS database results are included in Appendix B.
PGE Service Area
Of the 15,728 water rights listings identified in the PGE service area 163 listings under 153 different users had annual water right allocations greater than 5,000 acre-feet. The 163 listings categorized by water right type are summarized in Table 1. As with PacifiCorp, most of the listings are for surface water rights.
Appendix B presents results of the “First Tier” WRIS database query for the PGE service area and lists the name or business name of the water right holder, approved usage, estimated annual allocation quantity, and priority date for the 20 greatest (when available) allocation quantities for the following uses: agriculture, industrial/manufacturing, irrigation, and municipal. Irrigation uses includes primary and supplemental use categories.
Appendix B also presents the percentage share of the 20 greatest allocation quantities (when available) for each use when compared to the total allocation for that use. The results indicate that the top 20 for each use category has accounted for approximately 91 percent of the total allocation or greater.
Additional information and complete results of the database query are included in the RESULTS worksheet of the electronic spreadsheet titled PGE-FirstTierResults.xlsx. The worksheet contains results of the entire database query categorized by usage type. The calculated annual allocation quantity, priority date, and name of water rights holder can be accessed for each usage type by clicking on the plus sign to the left of the usage type name. Currently, the results of the search criteria are expanded for the following usage types: agriculture, municipal, irrigation, and industrial/manufacturing. Metadata describing the contents of the WRIS database results are included in Appendix B.
2.1.2 “Second Tier” Assessment
The Summit Blue team further evaluated the “First Tier” results to refine best probable hydropower targets, or “Second Tier” projects. A list of “Second Tier” water rights holders was developed by modifying the initial search criteria to include the following:
! Seniority: A water right priority date of 1980 or earlier;
! Threshold water right allocations for surface and ground water diversions: Estimated annual water right allocations for surface water and ground water types greater than 10,000 acre-feet (based on WRIS instantaneous rate and period of use); and
2 Additional information and complete results of the database query are included in the RESULTS worksheet of the electronic spreadsheet titled PacificPower-FirstTierResults.xlsx.
Summit Blue Consulting, LLC 15
! Threshold water right allocations for storage facilities: Estimated annual water right allocations for storage types greater than 5,000 acre-feet (based on WRIS reported storage quantities) with no priority date limitation.
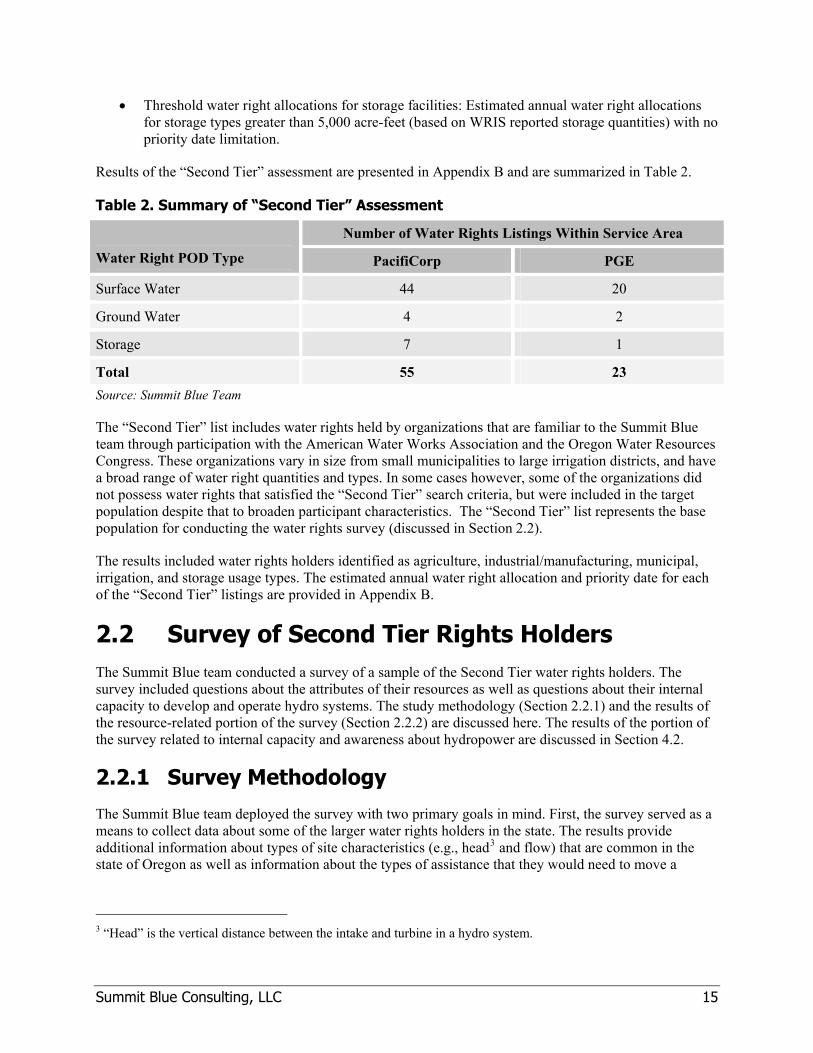
Results of the “Second Tier” assessment are presented in Appendix B and are summarized in Table 2.
Table 2. Summary of “Second Tier” Assessment
Number of Water Rights Listings Within Service Area
Water Right POD Type PacifiCorp PGE
Surface Water 44 20
Ground Water 4 2
Storage 7 1
Total 55 23 Source: Summit Blue Team
The “Second Tier” list includes water rights held by organizations that are familiar to the Summit Blue team through participation with the American Water Works Association and the Oregon Water Resources Congress. These organizations vary in size from small municipalities to large irrigation districts, and have a broad range of water right quantities and types. In some cases however, some of the organizations did not possess water rights that satisfied the “Second Tier” search criteria, but were included in the target population despite that to broaden participant characteristics. The “Second Tier” list represents the base population for conducting the water rights survey (discussed in Section 2.2).
The results included water rights holders identified as agriculture, industrial/manufacturing, municipal, irrigation, and storage usage types. The estimated annual water right allocation and priority date for each of the “Second Tier” listings are provided in Appendix B.
2.2 Survey of Second Tier Rights Holders The Summit Blue team conducted a survey of a sample of the Second Tier water rights holders. The survey included questions about the attributes of their resources as well as questions about their internal capacity to develop and operate hydro systems. The study methodology (Section 2.2.1) and the results of the resource-related portion of the survey (Section 2.2.2) are discussed here. The results of the portion of the survey related to internal capacity and awareness about hydropower are discussed in Section 4.2.
2.2.1 Survey Methodology
The Summit Blue team deployed the survey with two primary goals in mind. First, the survey served as a means to collect data about some of the larger water rights holders in the state. The results provide additional information about types of site characteristics (e.g., head3 and flow) that are common in the state of Oregon as well as information about the types of assistance that they would need to move a
3 “Head” is the vertical distance between the intake and turbine in a hydro system.

Summit Blue Consulting, LLC 16
project forward. Second, the survey provided the team with the opportunity to reach out to potential project hosts to engage them on Energy Trust’s behalf. The survey also served the purpose of providing an additional entrée for additional contact by Energy Trust. A copy of the survey is available in Appendix C.
To achieve these goals, the survey had four parts:
1. Participant Characterization – basic information about the individual and his organization;
2. Technical Questions for Storage Facilities – data that are useful in identifying promising projects at organizations with storage facilities;
3. Technical Questions for Open Channel Flow, Ditch Flow, or Waste Water Discharge – data that are useful in identifying promising projects at organizations with open channel flow, ditch flow, or waste water discharge; and
4. Project Development Issues – information about the individual’s familiarity with the resources available to assist in hydro project development and about organizational issues that affect the likelihood that the organization would be able to develop a project.
The 78 “Second Tier” water rights holders were considered the base population for conducting the survey. Approximately 45 percent of the population base (35 of 78) was contacted directly for an interview or indirectly through an online survey. Approximately 57 percent (20 of 35) of those targeted completed the survey.
2.2.2 Resource-Related Survey Results
The results of the resource-related components of the survey led to four main findings:
! Sites with storage appear to be an untapped opportunity for development. Of the sites with storage facilities with certificated water rights, the head and flow characteristics tended to be more favorable than those of the in-conduit resources.
! The market for small hydro development in Oregon is fragmented in terms of site characteristics. Of the nine possible combinations of head and flow characteristics, only one of them (medium head/low flow) could be used to describe more than three of the 25 sites described through the surveys. If these results are representative of all of the potential hydro sites in Oregon, it would be difficult for an independent developer to attempt to create any economies of scale local to Oregon.
! Several of the survey respondents appear to have sites with characteristics favorable for project development: North Unit Irrigation District, Vale Oregon Irrigation District, City of Corvallis, City of Coquille, City of Adair Village. These organizations were selected because they had at least one of the following combinations of site characteristics for a storage or open flow with certificated water rights: high head/medium flow or medium head/medium flow.4 Further, the irrigation districts have significant levels of annual water rights, in the range of 100,000 to
4 See the discussion of the challenges to low-head hydro in Section 3.2.1 for an explanation of why the low-head projects were not prioritized.
Summit Blue Consulting, LLC 17
500,000 acre-feet per year; this type of volume over the course of a year is an important consideration in project economics.
! Of the sites with incomplete information, it would be worthwhile to find out the additional information from the City of Banks, the City of Saint Helens, and Tualatin Valley Irrigation District. These sites included information about either head or flow that was either high or medium but failed to include information about the other metric.
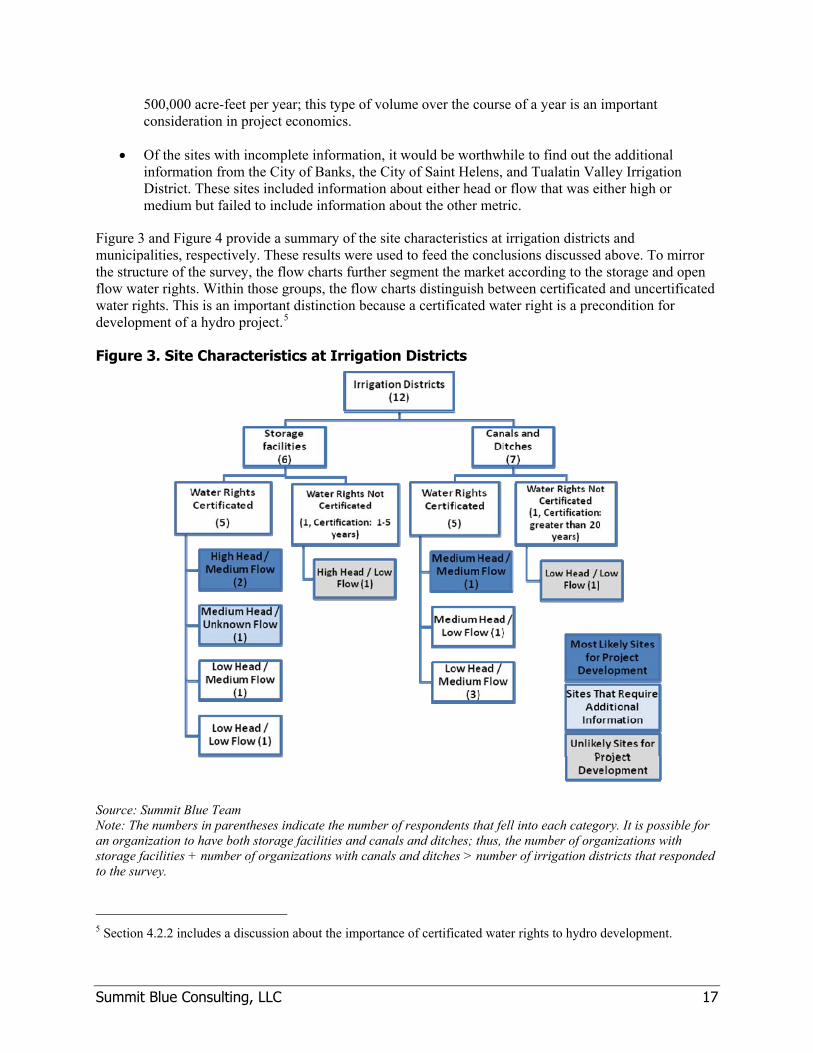
Figure 3 and Figure 4 provide a summary of the site characteristics at irrigation districts and municipalities, respectively. These results were used to feed the conclusions discussed above. To mirror the structure of the survey, the flow charts further segment the market according to the storage and open flow water rights. Within those groups, the flow charts distinguish between certificated and uncertificated water rights. This is an important distinction because a certificated water right is a precondition for development of a hydro project.5
Figure 3. Site Characteristics at Irrigation Districts
Source: Summit Blue Team Note: The numbers in parentheses indicate the number of respondents that fell into each category. It is possible for an organization to have both storage facilities and canals and ditches; thus, the number of organizations with storage facilities + number of organizations with canals and ditches > number of irrigation districts that responded to the survey.
5 Section 4.2.2 includes a discussion about the importance of certificated water rights to hydro development.
Summit Blue Consulting, LLC 18
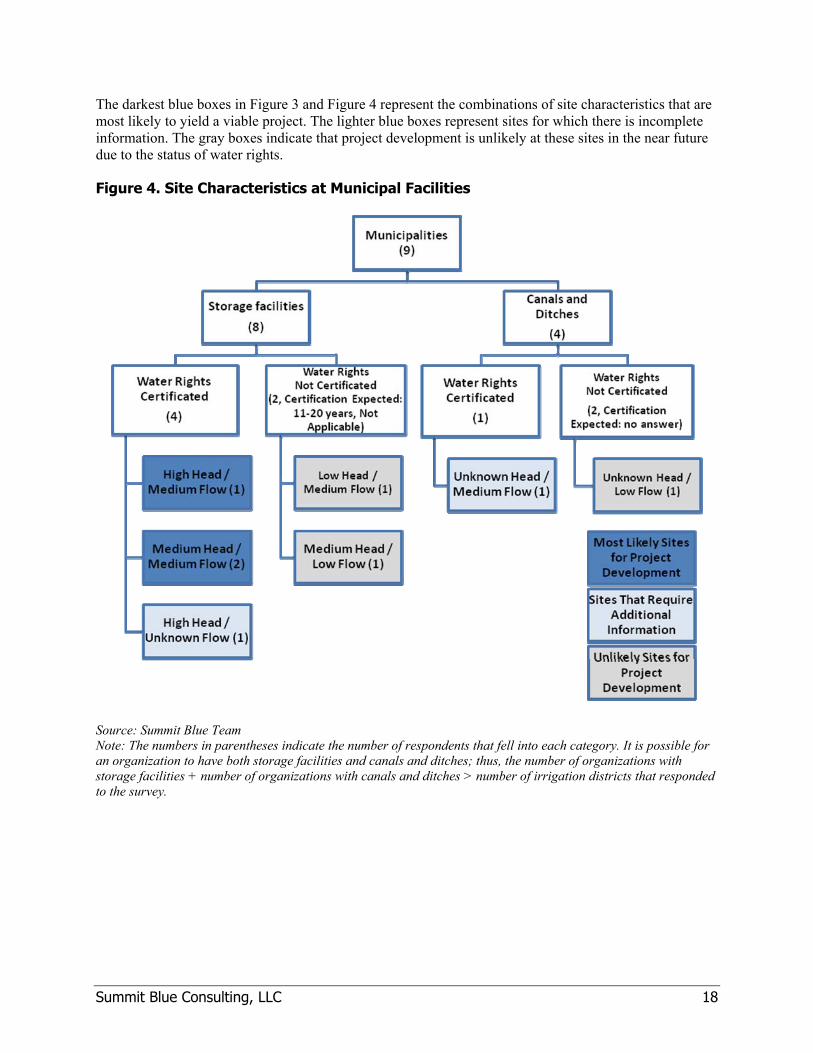
The darkest blue boxes in Figure 3 and Figure 4 represent the combinations of site characteristics that are most likely to yield a viable project. The lighter blue boxes represent sites for which there is incomplete information. The gray boxes indicate that project development is unlikely at these sites in the near future due to the status of water rights.
Figure 4. Site Characteristics at Municipal Facilities
Source: Summit Blue Team Note: The numbers in parentheses indicate the number of respondents that fell into each category. It is possible for an organization to have both storage facilities and canals and ditches; thus, the number of organizations with storage facilities + number of organizations with canals and ditches > number of irrigation districts that responded to the survey.

Summit Blue Consulting, LLC 19
3 TECHNOLOGY ASSESSMENT The goal of this section is to provide a framework for understanding the small hydro technologies that have potential application in Oregon. The section begins with an overview of the concepts that provide the foundation for small hydropower projects and technologies, including the physics of small hydro and technology classifications. Following the discussion of the fundamentals, the section continues with more in-depth discussions of the technologies that are appropriate for two types of more recent projects: low-head sites and in-conduit applications. Then, a discussion of recent developments and improvements to technology implementation follows.6 Finally, the section concludes with information on the current capital cost of developing small hydro systems as well as the associated operations and maintenance (O&M) costs.
Since the market for hydro is fairly mature, most of the technologies available have been in the market place for a long time. The background provided in this section provides a framework for understanding the factors that are included in the selection of technology for a given project as well as some of the more common types of technologies available in the marketplace today. At the direction of the Energy Trust the Summit Blue team excerpted many of the following from existing publications to conserve project resources for current market analytics, such as surveying.
3.1 Overview of Small Hydropower Technology7 Hydro turbines convert water pressure into mechanical shaft power, which can be used to drive an electricity generator or other machinery. The power produced by the turbine is proportional to the product of pressure head and volume flow rate, as shown in the following formula:
P = " *# * g * Q * H Where: P is the mechanical power produced at the turbine shaft (Watts)
" is the hydraulic efficiency of the turbine (%)
# is the density of water (kg/m3)
g is the acceleration due to gravity (m/s2)
Q is the volume flow rate passing through the turbine (m3/s)
H is the effective pressure head of water across the turbine (m)
6 More detail is included in Appendix D. The appendix includes a discussion of micro-hydro technology options, examples of in-conduit and incremental hydro installations, and new products in the low head hydro space. 7 Three literature resources were used in developing this section of the report: C. Dragu, T. Sels, "Small Hydro Power State of The Art and Applications," IEEE. Navigant Consulting, Inc., Statewide Small Hydropower Resource Assessment for State of California (Sacramento, California, 2006) Oliver Parish, "Small Hydro Power: Technology and Current Status," Renewable and Sustainable Energy Reviews 6(2002): 537-556.

Summit Blue Consulting, LLC 20
The best turbines have hydraulic efficiencies in the range of 80% to over 90%, although this decreases with smaller turbine size. Micro-hydro systems, which are typically characterized as those smaller than 100 kW, tend to have efficiencies in the range 60% to 80%, and capacity factors can range from 30% to 70%, depending on the availability of water throughout the year.
3.1.1 Major Classes of Small Hydropower Turbines
Three types of classifications are frequently used to describe the technologies available for hydropower projects. The first classification is dependent on a dominant site characteristic: the head available at the site. The second classification is dependent on a characteristic of the particular technology selected for a given site: the power rating of the turbine. The third classification system depends on the turbine’s fundamental operating system, the type of mechanics it uses. This section describes each classification system in further detail.
Classification by Head8
The major classifications of turbines by head are high head, medium head, low head, or very low head. This classification is relative to the size of machine, for what is low head for a large turbine may be considered to be high head for a small turbine. Different types of turbines are used for resources with different heads, because the speed of a turbine tends to decrease in proportion to the square-root of the head, and electricity generation requires a shaft speed as close as possible to 1500 rpm, so that the speed change between the turbine and generator is minimized. Thus, the lower the head the faster the turbine needs to turn.
Classification by Power
Turbines can also be classified according to their power rating. There are differences in how this classification is done in different countries. The classification in Table 3 is used for small hydro in Canada.
Table 3. Small Hydro Classifications by Power Rating
Classification Size Range Typical Use
Micro 100 kW or less Supply for one or two houses
Mini 100 kW to 1 MW Supply for a small factory or isolated community
Small 1 MW to 30 MW Low end of range for supply to a regional or state power grid Source: Natural Resources Canada
8 This section excerpted from Oliver Parish, "Small Hydro Power: Technology and Current Status," Renewable and Sustainable Energy Reviews 6(2002): 537-556.
Summit Blue Consulting, LLC 21
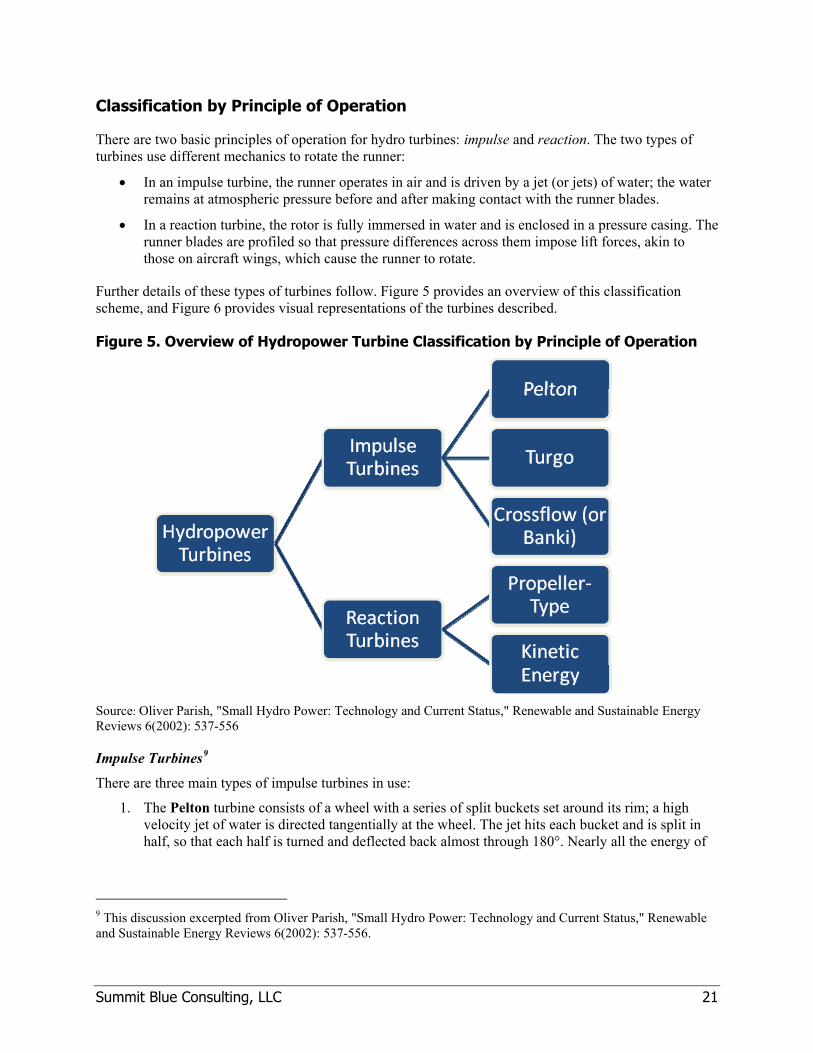
Classification by Principle of Operation
There are two basic principles of operation for hydro turbines: impulse and reaction. The two types of turbines use different mechanics to rotate the runner:
! In an impulse turbine, the runner operates in air and is driven by a jet (or jets) of water; the water remains at atmospheric pressure before and after making contact with the runner blades.
! In a reaction turbine, the rotor is fully immersed in water and is enclosed in a pressure casing. The runner blades are profiled so that pressure differences across them impose lift forces, akin to those on aircraft wings, which cause the runner to rotate.
Further details of these types of turbines follow. Figure 5 provides an overview of this classification scheme, and Figure 6 provides visual representations of the turbines described.
Figure 5. Overview of Hydropower Turbine Classification by Principle of Operation
Source: Oliver Parish, "Small Hydro Power: Technology and Current Status," Renewable and Sustainable Energy Reviews 6(2002): 537-556
Impulse Turbines9
There are three main types of impulse turbines in use:
1. The Pelton turbine consists of a wheel with a series of split buckets set around its rim; a high velocity jet of water is directed tangentially at the wheel. The jet hits each bucket and is split in half, so that each half is turned and deflected back almost through 180°. Nearly all the energy of
9 This discussion excerpted from Oliver Parish, "Small Hydro Power: Technology and Current Status," Renewable and Sustainable Energy Reviews 6(2002): 537-556.

Summit Blue Consulting, LLC 22
the water goes into propelling the bucket and the deflected water falls into a discharge channel below.
2. The Turgo turbine is similar to the Pelton, but the jet is designed to strike the plane of the runner at an angle (typically 20°) so that the water enters the runner on one side and exits on the other. Therefore, the flow rate is not limited by the discharged fluid interfering with the incoming jet. As a consequence, a Turgo turbine can have a smaller diameter runner than a Pelton for an equivalent power.
3. The Crossflow (or Banki) turbine has a drum-like rotor with a solid disk at each end and gutter-shaped “slats” joining the two disks. A jet of water enters the top of the rotor through the curved blades, emerging on the far side of the rotor by passing through the blades a second time. The shape of the blades is such that on each passage through the periphery of the rotor the water transfers some of its momentum, before falling away with little residual energy.
Figure 6. Pictures of Different Types of Turbines (from left to right, Pelton, Kaplan, Francis, Bulb, Propeller)
Source: Navigant Consulting, Inc., Statewide Small Hydropower Resource Assessment for State of California (Sacramento, California, 2006)
Reaction Turbines10
The runner in reaction turbines always functions within a completely water-filled casing. All reaction turbines have a diffuser known as a “draft tube” below the runner, through which the water discharges. The draft tube slows down the discharged water and reduces the static pressure below the runner, thereby increasing the effective head.
Reaction turbines require more sophisticated fabrication than impulse turbines, because they involve the use of more intricately profiled blades, together with carefully profiled casings. However, because reaction turbines can be used at low-head sites and low-head sites are generally quite numerous and close to where the power is needed, research is being done to develop designs for these types of turbines that are simpler to construct.
There are two main types of reaction turbines:
1. Propeller-type turbines are similar in principle to the propeller of a ship, but operating in reverse mode. There are several different types of propeller turbines:
a. Bulb turbine: The turbine and generator are housed in a sealed unit placed directly in the water stream.
10 This section excerpted from Oliver Parish, "Small Hydro Power: Technology and Current Status," Renewable and Sustainable Energy Reviews 6(2002): 537-556.

Summit Blue Consulting, LLC 23
b. Straflo: The generator is attached directly to the perimeter of the turbine.
c. Tube turbine: The penstock bends just before or after the runner, allowing a straight line connection to the generator
A key feature of propeller turbines is that the water needs to be given some swirl before entering the turbine runner. Methods for adding inlet swirl include fixed guide vanes mounted upstream of the runner and a “snail shell” housing for the runner, in which the water enters tangentially and is forced to spiral in to the runner.
In some cases, the blades of the runner can also be adjusted, in which case the turbine is called a Kaplan. The mechanics for adjusting turbine blades and guide vanes can be costly and, thus, are normally economical only in larger systems, but they can greatly improve efficiency over a wide range of flows.
The Francis turbine is essentially a modified form of propeller turbine in which water flows radially inwards into the runner and is turned to emerge axially. The runner is most commonly mounted in a spiral casing with internal adjustable guide vanes.
2. Kinetic energy turbines, also called “free-flow turbines,” generate electricity from the kinetic energy present in flowing water, rather than the potential energy from the head. The systems may operate in rivers, man-made channels, tidal waters, or ocean currents. Kinetic systems utilize the water stream's natural pathway and do not require the diversion of water through man-made channels, riverbeds, or pipes; they may have applications in such conduits, however. Kinetic systems do not require large civil works; they can use existing structures such as bridges, tailraces, and channels.
3.1.2 Matching Hydro Technologies to Resources11
The selection of the best turbine for any particular hydro site depends upon a variety of factors, including, but not limited to:
! The characteristics of the water resource, of which the most important are head and flow;
! The desired running speed of the generator or other device loading the turbine;
! Whether the turbine will be expected to produce power under reduced flow conditions or not; and
! The optimal head and flow for the particular turbine, to enable it to run at its best efficiency during the course of a year.
The approximate ranges of head, flow, and power applicable to the different turbine types are summarized in Figure 7 for installations of up to 500 kW. The diagram shows that Francis turbines can operate over a fairly wide range of heads as long as there is enough flow, whereas Pelton turbines require a high head, and Kaplan turbines require a high flow. Crossflow turbines can operate both at low head and low flow. For certain minimum power outputs, the graph areas to the right of the corresponding diagonal line show the suitability of each turbine design. For example, if a turbine of at least 100 kW is required, then for a site with less than 10 meters (m) of head, either a propeller or Kaplan or Crossflow turbine would be suitable.
11 This section is excerpted from Oliver Parish, "Small Hydro Power: Technology and Current Status," Renewable and Sustainable Energy Reviews 6(2002): 537-556.

Summit Blue Consulting, LLC 24
Figure 7. Head-Flow Ranges of Small Hydro Turbines
Source: Oliver Parish, "Small Hydro Power: Technology and Current Status," Renewable and Sustainable Energy Reviews 6(2002): 537-556.
Pelton and axial flow (propeller and Kaplan) turbines generally have broader ranges of operating efficiencies12 than other turbine types. Efficiencies exhibited by Kaplan turbines (varying by local site and installation conditions) range from 72% at 40% of flow capacity to almost 93% at 100% of flow capacity. Below 30% to 40% percent of flow capacity, all turbine technologies lose efficiency rapidly as the percent of flow capacity diminishes. Generator efficiencies are normally independent of the driver (i.e., turbine) efficiency.
3.2 Low Head Hydro13 The classification of low head is typically used for schemes with an available head of less than 5 m. Sites with less than 3 m of head are often referred to as “ultra low head.” Low-head hydro is almost always run-of-river; that is, the system operates without a reservoir. Under this configuration, the system operates when the river provides enough flow but may have to shut down during periods of low flow (e.g., low rainfall). There are many of these sites in the PacifiCorp and PGE service territories; provided that they have sufficient flow to make the project economics favorable, these sites can prove adequate for small hydro systems. They are more challenging to develop than high head systems, however, and this section discusses those barriers.
12 This is the efficiency of converting the energy in the water to mechanical power. 13 The following literature resources were used in developing this section of the report: Ian Bacon and Ian Davison, Low Head Hydro Power in the South-East of England –A Review of the Resource and Associated Technical, Environmental and Socio-Economic Issues. (2004)

3.2.1 Challenges of Low-Head Hydro Applications
Low head hydro projects have several features that can introduce different problems than those posed by high or medium head sites:
! Utilizing existing structures: A potential advantage of low-head sites is that the fall already exists due to an existing structure, i.e., a weir or sluice. However, the design of these existing structures may also restrict the volume of flow that can be utilized by the hydropower scheme. The most common solution is to construct the hydro plant around the edge of the weir. This may require major civil engineering costs, however, and, thus, is often not viable for smaller projects.
! Low head, high flow: The power produced by the turbine is proportional to both head and flow. If the head is very low, then high volume flow rates are needed to achieve the same power output. High flow rates require large flow passages, so low-head turbines normally have a large diameter, yet they need to be accommodated within a small vertical height. This creates a number of engineering challenges. One approach to this problem has been the use of siphons. (See section 3.2.2 for a description.)
! Loss of head during high flows: During times of high river flow, tail-water levels will rise significantly at low-head hydro schemes installed in rivers. This will cause major variations in the amount of available head. Under such conditions, a 3 m head might be cut to 1.5 m for part of the rainy season. The reduced head also reduces the flow through the turbine; even though there is plenty of water, a 50% loss of head can lead to a 65% loss of power.
! Low power-to-weight ratio: The weight of the runner will have an influence on the amount of power obtained from the water. The power of a turbine increases as a function of the square of the runner diameter (D2), but the weight of a turbine increases as a function of the cube of the runner diameter (D3). Thus, as turbines get larger to absorb high flows at low-head sites, less power is obtained for the weight of material deployed.
! Trash: Large rivers carry a heavy load of natural and man-made debris. During times of high river flow, trash can build up at a very fast rate, and trash removal can represent a significant part of the total operating costs. Trash racks are needed to stop large items, such as tree trunks, but the resistance to flow that the trash rack adds must be low enough to keep head loss to no more than a few cm. In addition, fish must be kept out of the turbine unless they are small enough to pass through unscathed. Implementing both fish and trash screening is a critical task for any new project, and it can potentially add a great amount of cost to the project.
3.2.2 Low-Head Technology Options
The turbine options that are currently applied to low head schemes include the following:
1. Propeller-type turbines, with four main variations, as described in Table 4.
Summit Blue Consulting, LLC 25

Table 4. Variations of the Propeller Turbine Used in Low-Head Applications
Type of Turbine Rotor Blade Configuration Guide Vane Configuration
Basic Propeller Fixed Fixed
Kapellar (Hybrid propeller and Kaplan)
Fixed Adjustable
Semi-Kaplan Adjustable Fixed
Full Kaplan Adjustable Adjustable
2. Crossflow (Banki) turbines (adjustable inlet vanes).
3. Open-flume Francis turbines (adjustable guide vanes).
Two main characteristics of these turbines should be considered when designing a low-head scheme: the specific speed and the part-flow performance.
Specific Speed: The specific speed of a turbine describes the performance characteristics of the turbine design. It is purely a factor of the geometry of the turbine and does not depend on its size. All turbines run more slowly when used with lower heads, and this is generally a disadvantage when an electrical generator needs to be driven to produce electricity at 60 Hz. A high specific speed implies a smaller, faster turbine, and this design can save on the cost of the shaft, generator, and gearbox; however, a high specific speed leads to a faster flow velocity through the rotor, thereby increasing friction losses. Propeller turbines are the most suitable turbines for low head sites, because they have the highest specific speeds of all turbine types.
Part-flow Performance: Turbines running at their designed speed will draw a particular flow of water, but if there is insufficient water flow to meet this demand, the turbine will start to drain the river or conduit, and its performance will rapidly degrade. In that case, it would either have to be shut down or its internal geometry would have to be changed – a process known as regulation. In regulated turbines, the inlet guide vanes and/or runner blades can be adjusted to increase or reduce the amount of water flow they draw. These types of turbines generally cost more, because they are more complex, but this additional cost is often justified, because of their superior part-flow performance. The efficiency of different turbine designs in part-flow conditions is shown in Figure 8.
Summit Blue Consulting, LLC 26

Figure 8. Efficiency of Different Turbines at Reduced Flows
Source: Ian Bacon and Ian Davison, Low Head Hydro Power in the South-East of England –A Review of the Resource and Associated Technical, Environmental and Socio-Economic Issues. (2004)
The best turbines for small hydro schemes with available head of less than 3 m are propeller-type turbines, either as a fixed geometry machines or as a full-Kaplan or semi-Kaplan variants. For larger schemes with individual turbine sizes of more than 500kW, which can bear higher capacity costs, the bulb-turbine and vertical-shaft Kaplan are well-proven solutions. Schemes with less than 3 m of head and with turbine sizes of less than 300 kW are the most challenging, as then it becomes uneconomic simply to scale down these large hydro solutions.
3.3 Specialized Applications of Small Hydro There are two specialized technology applications for small hydro that are particularly relevant for the resources within Energy Trust’s service territory. The first is one for which funding has already been approved by the Energy Trust dollars (though no projects have yet been completed): the pressure reducing valve. The second technology has yet to be deployed using Energy Trust dollars, but there is a pending application with the OWRD. Since there are other sites with the same type of resource, a discussion of the technology is provided here.
3.3.1 In-Conduit Technology: Pressure Reducing Valves
Pressure reducing values (PRVs) are commonly used in water systems to reduce the pressure of water flowing between zones of the water system, and to reduce pressure to a level appropriate for use by water system customers. PRVs can be applied in man-made water conduits – canals, irrigation ditches,
Summit Blue Consulting, LLC 27

Summit Blue Consulting, LLC 28
aqueducts, pipelines – which are prevalent in the list of large water rights holders included in Appendix B. Energy Trust agreed to provide funding for a 40 kW hydro project at Farmers Irrigation District using GPRVs in 2005, but the project was later tabled by Farmers.14
Community Hydro15 is a consulting company that specializes in generating electricity from raw or finished water flowing through municipal water supplies and treated effluent from wastewater treatment systems. The company offers a proprietary technology called a "generating pressure reducing valve", which runs in parallel with existing pressure reducing valves, to generate power within existing conduits. Community Hydro uses technology produced by SOAR Technologies of Washington. The technology combines two standard devices: an impulse (Pelton) hydroelectric turbine-generator and components from a standard pressure reducing valve.
According to Community Hydro, GPRV is best suited for pressure differentials of at least 25 pounds per square inch (psi), and flows of over 1 million gallons a day; this equates to roughly a 4 kW system. Lower flows can work if the pressure differential is more than 25 psi.
Other companies that sell similar types of technologies include Rentricity (New York, NY), Mechanology (Attleboro, MA), and Canadian Hydro Components Ltd. (Ontario, Canada).
3.3.2 Aquifer Storage and Recovery (ASR)
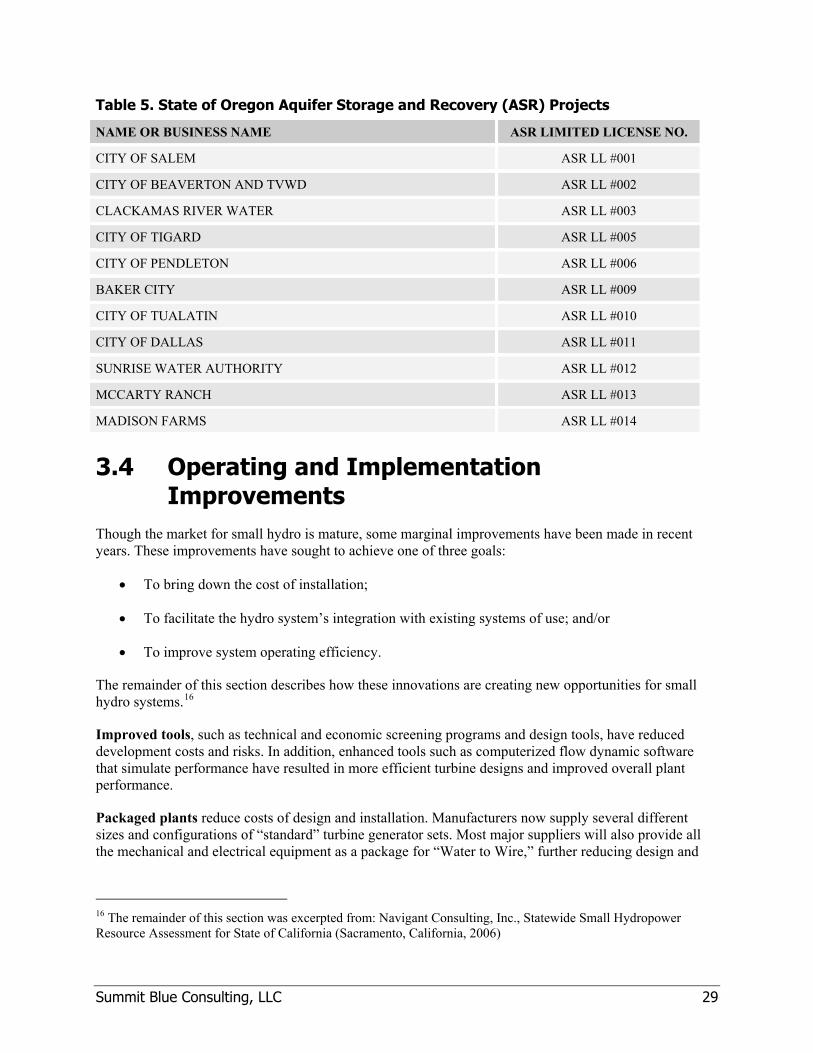
Some municipalities are finding Aquifer Storage and Recovery (ASR) to be a feasible and favorable alternative to water storage (e.g., City of Dallas, City of Beaverton, and the Tualatin Valley Water District), and are considering options to expand their current operations to increase storage capacities. Recharge to the aquifer during ASR operations generally takes place during winter and spring when water demand is low and supply is high. The water is then pumped from the aquifer during summer and fall when demand is greater and supplies limited.
Hydro-turbines installed in the recharge piping prior to injection into the aquifer could provide a long-term (e.g., 6-months) and relatively constant source for power generation. Recharge to the aquifer is by means of pressure head with the aquifer generally receiving water via a large diameter pipeline extending to the well from a storage tank. The recharge rate depends upon the physical characteristics of the aquifer, but is regulated to maintain a relatively constant rate by an automated flow control valve that adjusts to system pressure changes. The long-term and constant recharge rate could provide a relatively continuous source of power that is independent of diurnal or seasonal variations in flow depending resulting from changes in demand. ASR projects currently underway in the State of Oregon are listed in Table 5.
14 Energy Trust of Oregon. July 7, 2005. Briefing Paper: Farmers Irrigation Small-Scale Hydroelectric Project. Available: http://energytrust.org/meetings/board/2005/050706/6c_OS_Farmers.pdf 15The remainder of this section is excerpted from Community Hydro. “There’s Power in Your Pipes!” Available: www.communityhydro.biz/watersystems.html
Summit Blue Consulting, LLC 29
Table 5. State of Oregon Aquifer Storage and Recovery (ASR) Projects
NAME OR BUSINESS NAME ASR LIMITED LICENSE NO.
CITY OF SALEM ASR LL #001
CITY OF BEAVERTON AND TVWD ASR LL #002
CLACKAMAS RIVER WATER ASR LL #003
CITY OF TIGARD ASR LL #005
CITY OF PENDLETON ASR LL #006
BAKER CITY ASR LL #009
CITY OF TUALATIN ASR LL #010
CITY OF DALLAS ASR LL #011
SUNRISE WATER AUTHORITY ASR LL #012
MCCARTY RANCH ASR LL #013
MADISON FARMS ASR LL #014
3.4 Operating and Implementation Improvements
Though the market for small hydro is mature, some marginal improvements have been made in recent years. These improvements have sought to achieve one of three goals:
! To bring down the cost of installation;
! To facilitate the hydro system’s integration with existing systems of use; and/or
! To improve system operating efficiency.
The remainder of this section describes how these innovations are creating new opportunities for small hydro systems.16
Improved tools, such as technical and economic screening programs and design tools, have reduced development costs and risks. In addition, enhanced tools such as computerized flow dynamic software that simulate performance have resulted in more efficient turbine designs and improved overall plant performance.
Packaged plants reduce costs of design and installation. Manufacturers now supply several different sizes and configurations of “standard” turbine generator sets. Most major suppliers will also provide all the mechanical and electrical equipment as a package for “Water to Wire,” further reducing design and
16 The remainder of this section was excerpted from: Navigant Consulting, Inc., Statewide Small Hydropower Resource Assessment for State of California (Sacramento, California, 2006)

Summit Blue Consulting, LLC 30
supply costs. Some new unit configurations require little or no custom civil support structures. For example, some units are now designed to be installed into or in front of existing hydraulic drop structures. Some ultra low head turbines that utilize only the available current at a site have no support structures at all, and are only anchored to their relative location. This “no powerhouse” concept allows for mass-production of multiple small turbines or generating arrays that can further reduce total installed costs.
Integration of support technologies, such as Programmable Logic Controllers (PLC), annunciators, and governors designed with off-the-shelf products have reduced equipment space requirements and operating costs while increasing functionality. PLCs can now control, monitor, and provide alarms for all functions of a small hydro facility using a single device. Most water agencies have personnel that can readily program and make control changes to these standard PLCs. Standardized PLC programming reduces training costs and results in improved plant availability. Most new controls equipment now use Windows based software for streamlined integration into existing controls and monitoring systems. Companies that market these types of technologies include the following17:
! Mercer Management (Albany, NY) - http://www.mercer-mgmt.com/mgnthydro.html
! Envitech (Canada) - http://www.envitech.com/html/English/automationPLC.html
! ABB (nationwide) - http://www.abb.ca/product/us/9AAC111995.aspx?country=CA
! Pigler Automation (Steamboat Springs, CO) - http://www.piglerautomation.com/
Standardized communications protocols now allow for easy integration of unit monitoring into existing Supervisory Control and Data Acquisition systems. Most electronic governor packages now use standardized components and designs which reduce both first costs and maintenance costs, increase availability, enable quicker turnaround on spares, reduce training costs, and significantly simplify changes to control parameters. In addition, remote controls via the internet are adding another dimension of sophistication to equipment controls. Some small hydro operators now monitor and control units solely via the Internet, and cell phones and PDAs can also be used to remotely monitor units. Companies that market these types of technologies include the following:
! L&S Electric (headquartered in Wausau, WI) - http://lselectric.com/
! North American Phoenix Energy Services (Monroe, WA) - http://www.napenergy.com/#/scadasystems/4527432303
! Russelectric (Hingham, MA) - http://www.russelectric.com/CustomSCADA.htm
Standardized generator exciters are now designed to match the required output of standard generators. In the area of small turbine generators, there is increased use of induction type generators (vs. synchronous units). The use of induction “motors as generators” is becoming more popular for
17 This section includes several lists of potential vendors for some of the technologies discussed here. Their inclusion is intended only for illustrative purposes and not an endorsement of any of these companies. Hydro Review maintains a database of companies active in different aspects of the hydro industry; it includes a more comprehensive list of potential vendors. This database can be found at http://www.hcipub.com/directory/search.asp?type=hr&cat=435&name=Programmable+Logic+Controllers&main=products&pcat=p
installations up to 1000 kW. Use of motors and generators is very cost efficient, since excitation and governor equipment are not needed.
Improved electronic monitoring packages increase the ability to employ predictive maintenance through computer based monitoring and trending. Monitoring devices for the operation of plant are now a fraction of the costs as compared to 20 years ago. Low cost monitoring and remote sensors have further increased the reliability and availability of small hydro plants. Small hydro plant instrumentation typically includes site security, vibration, temperature, flow, pressures, levels, and alarms. Companies that market these types of technologies include the following:
! Russelectric (Hingham, MA) – http://www.russelectric.com/CustomSCADA.htm
! ABB (nationwide) - http://www.abb.ca/product/us/9AAC111995.aspx?country=CA
! MSE-Tetragenics (Richland, WA; Butte, MT; Idaho Falls, ID) - http://www.tetragenics.com/
! HED (Hartford, WI) - http://www.hedonline.com/
3.5 Small Hydro Costs: Extremely Site Dependent Many have tried to create simple rules of thumb in small hydro, but Summit Blue’s research points to the fact that the best rule of thumb for the costs to develop and operate small hydro systems is that there is no rule of thumb. The costs of development are site-specific, and the long-term costs of ownership are dependent on the characteristics of the turbine, generator, and the installed system as a whole. As with most energy investments, small hydro costs can be examined in two primary categories:
! Capital costs – the costs of developing a site, purchasing and installing hydroelectric equipment, and interconnection, expressed in terms of $/kW capacity.
! Operations and Maintenance (O&M) Costs –both fixed O&M costs (stable throughout the year) and variable (may vary from year to year), expressed in terms of $/kWh generated.
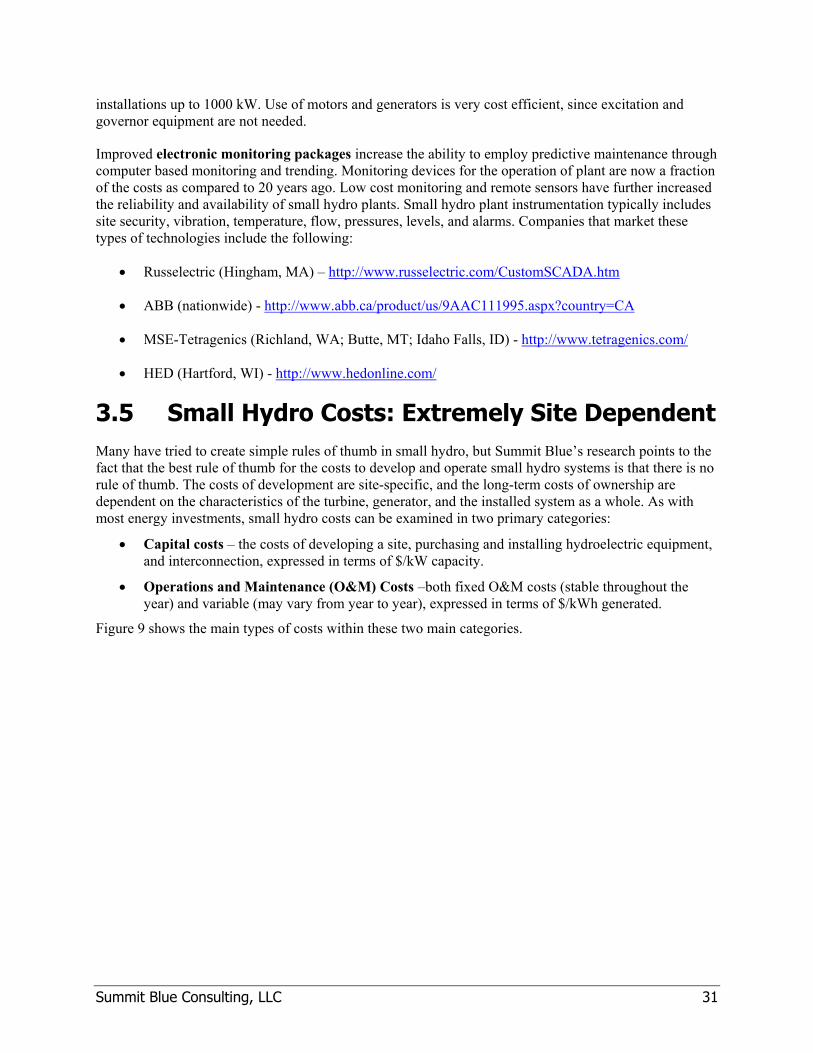
Figure 9 shows the main types of costs within these two main categories.
Summit Blue Consulting, LLC 31
Figure 9. Components of Capital and O&M Costs
Together with the tax benefits created through the federal Production Tax Credit (PTC), the capital and O&M costs can be combined to produce a levelized cost of energy (LCOE), in $/kWh. The LCOE includes all project costs and equates them with a constant (or levelized) price of electricity over the lifetime of the unit.
The remainder of this section will provide more detail on the results of the literature review and anecdotal accounts of capital costs (Section 0), O&M costs (Section 3.5.2), and the effect of the PTC on project economics (Section 3.5.3).
Summit Blue Consulting, LLC 32

Summit Blue Consulting, LLC 33
3.5.1 Capital Costs
Similar to many other renewable energy technologies, hydropower projects incur high initial capital costs and relatively lower lifetime operating costs. The cost of development varies substantially from one site to another due to the variation in types of site alteration, in cost of permitting and land acquisition, in distance to transmission, and in fundamental site characteristics – flow and head.
Recent estimates of small hydro project costs indicate that newer system costs diverge from a rule of thumb that states that roughly 75% of the capital cost of a small hydro project is variable and roughly 25% is fixed (power station). One source of data, a 2006 statewide assessment of California’s market for small hydro, indicates that equipment costs can range from 35-55% of total project costs; this estimate is based on the study team’s professional experience and judgment.18 A second set of data points are found in the Hood River Fatal Flaw Studies, completed in 2008. The Fatal Flaw Studies estimated costs for five of the six the sites that were deemed feasible after the fatal flaw analysis; the combination of the forebay, penstock, and turbine equipment ranged from 49% to 71% of overall project costs estimated by the study.19
The other factors that contribute to overall project costs can be grouped as land costs, technical services, balance of plant costs, and feasibility study costs. Using the California and Hood River County studies as sources, these categories were defined in the following ways:
! Land costs: Cost of acquiring land and/or right-of-way;
! Technical Services: Cost of legal and engineering (including feasibility study) services (together, called “indirect costs” in the Hood River Study);
! Equipment costs: turbine and related equipment, including forebay and penstock; and
! Balance of plant costs: civil site development costs (called site and access in the Hood River Study), transmission and substation improvements, on-site buildings, and tailrace improvements.
As shown in Table 6, there is some variation in the breakdown of capital costs associated with small hydro projects. The main cost driver is the equipment costs.20 Together, the technical services and balance of plant costs can make up just as much or more of the project costs, but alone, these components are expected to be less significant than the equipment costs.
18 Navigant Consulting, Inc., Statewide Small Hydropower Resource Assessment for State of California (Sacramento, California, 2006) 19 Anderson Perry & Associates, Hood River County: Farmers Irrigation District Powerhouse 4, Hood River County: Middle Fork Irrigation District Powerhouse 4, and Hood River County: City of Hood River Dee Bridge. Prepared for Hood River County Public Works Department (February 2008) SJO Consulting Engineers, Hood River County: East Fork Irrigation District: Dukes Valley Pipeline and Hood River County: East Fork Irrigation District: Neal Creek Pipeline Site B, Prepared for Hood River County Public Works Department (February 2008). 20 Some users on the Yahoo! Groups Microhydro list-serv report that capital costs can be significantly reduced by negotiating a price directly with overseas manufacturers. The viability of this strategy for the average party interested in development, however, is questionable.

Summit Blue Consulting, LLC 34
Table 6. Capital Cost Breakdown !
Capital Cost Category State of California Study (Range) Hood River County Fatal Flaw Study (Range)
Land/Site 7-9% 2-3%
Technical Services 19-30% 15-24%
Equipment 35-55% 49-71%
Balance of Plant 10-40% 12-29%
Note that there may be some inconsistencies in the costs that were included in each category; the Navigant study did not detail all of the component costs included in each category. Some judgments were made regarding which costs components in the Hood River Study were subsumed into the broader categories given by Navigant. Sources: Anderson Perry & Associates, Hood River County: Farmers Irrigation District Powerhouse 4, Hood River County: Middle Fork Irrigation District Powerhouse 4, and Hood River County: City of Hood River Dee Bridge. Prepared for Hood River County Public Works Department (February 2008) Navigant Consulting, Inc., Statewide Small Hydropower Resource Assessment for State of California (Sacramento, California, 2006) SJO Consulting Engineers, Hood River County: East Fork Irrigation District: Dukes Valley Pipeline and Hood River County: East Fork Irrigation District: Neal Creek Pipeline Site B, Prepared for Hood River County Public Works Department (February 2008).
There are two main factors that drive the per-MW cost of a project:
! Plant capacity – total generating capacity of the facility; and
! Site characteristics – head and flow characteristics, distance to transmission, infrastructure already installed (e.g., penstock).
The cost per installed capacity generally decreases as plant capacity increases. There is essentially a fixed component of the equipment that is incurred regardless of system size; the impact on this cost on the overall system cost diminishes as the size increases. A study conducted for BC Hydro on hydro potential within its territory modeled available hydro sites, estimating costs and generation at each site.21 Figure 10 shows these estimated capacity costs plotted against the plant capacity.
21 Sigma Engineering Ltd., Green Energy Study for British Columbia Phase 2: Mainland (Vancouver, B.C. Canada, 2002)
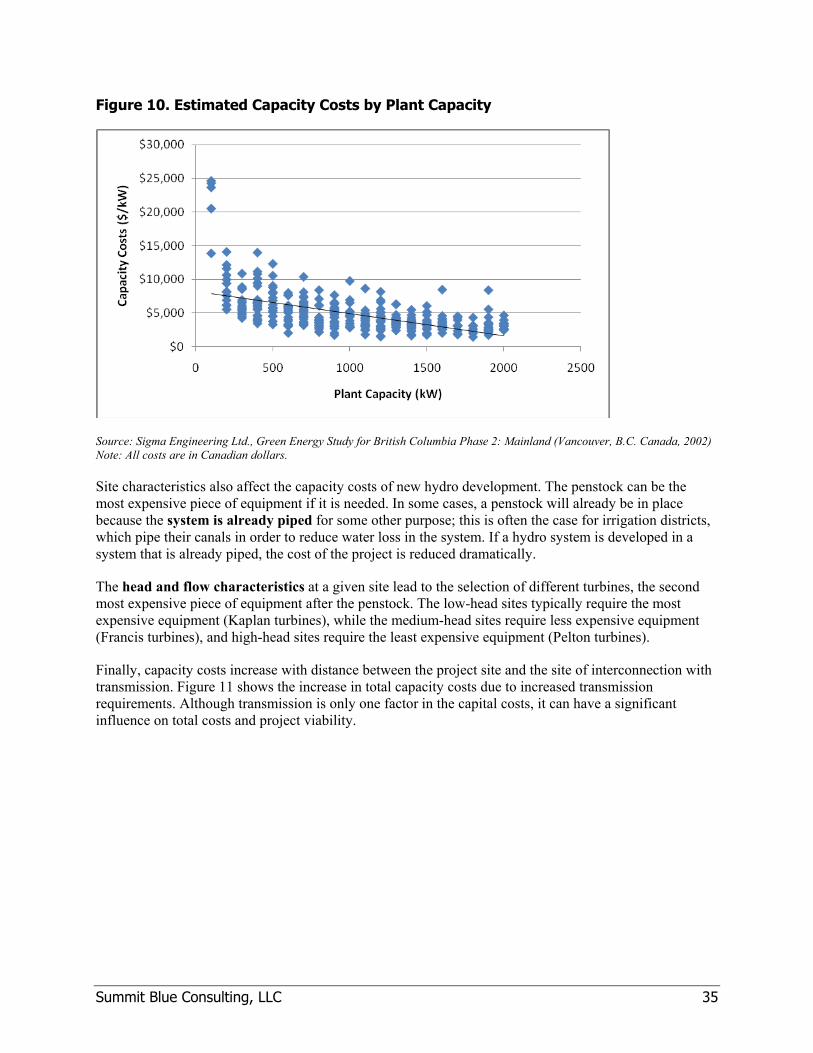
Figure 10. Estimated Capacity Costs by Plant Capacity
Source: Sigma Engineering Ltd., Green Energy Study for British Columbia Phase 2: Mainland (Vancouver, B.C. Canada, 2002) Note: All costs are in Canadian dollars.
Site characteristics also affect the capacity costs of new hydro development. The penstock can be the most expensive piece of equipment if it is needed. In some cases, a penstock will already be in place because the system is already piped for some other purpose; this is often the case for irrigation districts, which pipe their canals in order to reduce water loss in the system. If a hydro system is developed in a system that is already piped, the cost of the project is reduced dramatically.
The head and flow characteristics at a given site lead to the selection of different turbines, the second most expensive piece of equipment after the penstock. The low-head sites typically require the most expensive equipment (Kaplan turbines), while the medium-head sites require less expensive equipment (Francis turbines), and high-head sites require the least expensive equipment (Pelton turbines).
Finally, capacity costs increase with distance between the project site and the site of interconnection with transmission. Figure 11 shows the increase in total capacity costs due to increased transmission requirements. Although transmission is only one factor in the capital costs, it can have a significant influence on total costs and project viability.
Summit Blue Consulting, LLC 35

Summit Blue Consulting, LLC 36
Figure 11. Estimated Capacity Costs by Distance to Transmission
Source: Sigma Engineering Ltd., Green Energy Study for British Columbia Phase 2: Mainland (Vancouver, B.C. Canada, 2002)
3.5.2 Operations and Maintenance Costs
O&M costs are also highly variable from one site to another. The design and complexity of the facility, site-specific hydrology, environmental characteristics, and the remoteness of the site all affect the annual budget required for O&M.22 Since these vary so dramatically from one site to another, estimating O&M budget is guesswork at best.
Figure 12 shows the range of O&M costs that are documented based on actual systems. Interviewees reported anecdotally that some projects were estimating that annual O&M costs would be 4-5% of equipment costs; organizations with more experience in the operation of hydro projects may reduce that amount to 2% of equipment costs.
22 Navigant Consulting, Inc., Statewide Small Hydropower Resource Assessment for State of California (Sacramento, California, 2006).

Summit Blue Consulting, LLC 37
Figure 12. Survey of Small Hydro O&M Expenses
Source: Navigant Consulting, Inc., Statewide Small Hydropower Resource Assessment for State of California (Sacramento, California, 2006). Original source: Hydro Review, “Using Benchmarking to Assess, Improve Hydro Plant Performance.” (October 2002)
Individuals interviewed for this project reported that most irrigation districts in Oregon that own existing systems operate and maintain them using internal staff. These internal staff members’ time is not typically considered in the O&M calculation. As a result, the O&M calculation makes some assumptions about the cost of the parts and equipment that will be needed to maintain the systems.
3.5.3 Effect of Production Tax Credit on Project Economics
Another important component of small hydro project economics can be the PTC. The PTC is paid to project owners on the basis of renewable energy project production and sale of electricity to an unrelated party. The federal bailout (also called the Emergency Economic Stabilization Act of 2008): (1) extended the deadline for project completion that small hydro projects must meet in order to take advantage of the PTC, (2) expanded the list of qualifying resources to include marine and hydrokinetic resources, such as wave, tidal, current, and ocean thermal; and (3) changed the definitions of several qualifying resources and facilities.23
The 2007 tax credit amount for qualifying hydroelectric and hydrokinetic projects was 1.0¢/kWh for projects that are implemented by the technology-specific deadline.24 For hydroelectric projects, the current deadline is December 31, 2010; for qualifying marine and hydrokinetic projects, the deadline is December 31, 2011.
23 United States House of Representatives, “H.R. 1424: Emergency Economic Stabilization Act of 2008,” signed by President G.W. Bush on October 3, 2008. Available: http://www.govtrack.us/congress/billtext.xpd?bill=h110-1424 24 Database of State Incentives for Renewables and Efficiency, “Renewable Energy Production Tax Credit,” updated October 9, 2008. Available: http://www.dsireusa.org/library/includes/incentive2.cfm?Incentive_Code=US13F&State=Federal%C2%A4tpageid=1

In addition to the definition of qualifying technology under the PTC regulations, small hydro project developers must consider two additional factors as they assess their project’s eligibility for the PTC. First, they must be aware of the part of the regulation that requires the energy to be sold to an unrelated person. Where small hydro systems are net metered, the owner is generally assumed to consume the energy generated. In these cases, the project owner is not eligible for the PTC benefits.
Second, small hydro project developers must be aware of the requirement that the PTC benefit go to the project owner. The project owner must have sufficient tax appetite to absorb the benefits of the PTC. This can be a hurdle to public agencies taking advantage of the PTC, because they may need to find a third party with sufficient tax appetite to own the project. Such investors are typically available (as evidenced by the proliferation of third-party ownership in the wind industry), but this arrangement can increase the cost of the project. Project developers must discuss the tradeoffs inherent in such arrangements with relevant stakeholders in order to determine the most appropriate course of action. In addition the project must be able to take advantage of the PTC before it expires. With the average time to complete a project of this type running 4 to 5 years, it is a real concern that projects begun, may not complete in time to receive the PTC.
Summit Blue Consulting, LLC 38

Summit Blue Consulting, LLC 39
4 MARKET ASSESSMENT The market assessment builds on the results of the resource assessment. The resource assessment identified the largest water rights holders as primarily irrigation districts and municipalities, and the market assessment sought input from critical market actors that interface with these types of organizations. Input from several market actors led us to investigate further the opportunity for incremental hydro upgrades in Oregon, and the results of that pursuit are also included here.
The Summit Blue team relied heavily on interviews to capture the most current information about the market for small hydropower development in Oregon. Conversations with individuals representing a cross section of organizations that is or was involved in or has expressed interest in developing small hydro projects provided the team with insights into market barriers as well as opportunities to move the market forward. Representatives of the following organizations contributed to this assessment:
! 3R Valve
! BC Hydro
! Canyon Hydro
! Farmers Irrigation District
! Oregon Department of Energy
! Oregon Water Resources Department
! Pacific Gas and Electric
! PacifiCorp
! Sigma Engineering
! Stoel Rives
! Swalley Irrigation District
! Talent Irrigation District
! Winzler & Kelly
As described previously, the Summit Blue team conducted a survey of a subset of the Second Tier water rights holders as part of the market assessment. This survey collected data on internal processes, staff experience, and interest in developing small hydropower in an effort to identify gaps in the marketplace. Results of the surveys are discussed throughout this section.
This section is organized to provide a snapshot of the current market for small hydropower development in Oregon. Section 4.1 describes the market participants that are currently active in Oregon. Section 4.2 provides a description of the current barriers to the market’s further development; these range from permitting issues to more practical considerations such as internal staff experience and engagement with available resources.
4.1 Current Market Activity This section begins by describing the key actors in the Oregonian market for small hydro development and operation. Following this discussion, the section continues to discuss the in-state financial resources that are available from public or quasi-public agencies to help encourage the development of small hydro systems. Finally, we consider how the market actors approach segmentation of this marketplace.

Key Market Actors
Few experts in small hydro development are easily accessible from the eastern part of Oregon, where many of the largest water rights holders are located. Several individuals who are currently or were at one point involved in small hydro development made comments such as, “There’s no one locally for us to use. We had to go to Portland.” Even in Portland and other cities west of the Cascades, the amount of knowledge regarding small hydropower development is limited to a few organizations.
Figure 13 includes a listing of market actors who are active in Oregon’s market for small hydropower project development. The “supply chain” shown greatly simplifies the process of developing a project to provide a representation of the market actors. In reality, these steps are often pursued in parallel and may appear in many different forms throughout the project’s development.
Figure 13. Active Participants in Oregon's Market for Small Hydro Development
Developers
•Symbiotics(Incremental!Hydro)!(ID,!UT,!OR,!TX,!FL)•Irrigation!District!Staff!(OR)
Feasibility!
•CH2MHill!(OR)•Winzlerand!Kelly!(OR)
System!Engineering
•CH2MHill!(OR)•Ted!Sorenson!(ID)•CF!MalmEngineers!(WA)
Legal!Advice
•Stoel Rives!(Incremental!Hydro)!(WA)•Internal!Staff!(OR)
Financing
•Energy!Trust!of!Oregon•OR!Dept.!of!Energy•OR!Dept.!of!Environmental!Quality•Irrigation!District!Patrons!(OR)
Manufacture!of!Equipment
•Canyon!Hydro!(WA)•3RValve
System!Construction
•Several!local!contractors
O&M
•System!owners
One of the most important conclusions drawn from the interviews is that successful projects require that the project host (for example an irrigation district) take an active role in several areas of the supply chain. Projects that have reached completion typically have an internal champion who is able to oversee the entire process and has the capability to fill several of the needed roles. These individuals may have experience in developing hydro projects in the past, or they may have a certain set of skills (e.g., grant/permit application writing, management training, financial background) that enable them to learn on the fly and accomplish the tasks required to make a project successful. These internal skills make the project more cost-effective by reducing the need for outsourced help and by providing a consistent coordinator for the project’s multiple efforts.
The areas of expertise that can be outsourced most successfully are engineering, equipment manufacturing, and construction. Of the engineers listed in Figure 13, CH2MHill has the most robust
Summit Blue Consulting, LLC 40

Summit Blue Consulting, LLC 41
experience. One of the principals at Winzler & Kelly was the lead on the Hood River Fatal Flaw Study, which was completed earlier this year. While hydro is not one of Winzler & Kelly’s core practice areas, the firm’s civil engineering expertise enables it to provide the services needed in the feasibility and potentially the design phase.
Manufacturer Canyon Hydro was mentioned by most of the individuals interviewed about available technology. Canyon Hydro custom designs and manufactures the equipment based on each site’s characteristics; its customers are all over the United States. Individuals interviewed from British Columbia mentioned that the equipment needed for small hydro development is available from manufacturers around the globe, but the proximity of Canyon Hydro to Oregon’s sites seemed to put it in the front running for most development in Oregon.
The technology manufactured by 3RValve is discussed earlier in the technology assessment section. Appropriate for aquifer storage and recovery (ASR) sites, 3RValve likely has other competitors at this time, but it is not clear who they are. The company’s founder lives in Echo, OR, and is discussing pilot projects with the City of Beaverton and the City of Pendleton in Oregon as well as other cities around the country. While the technology is not yet commercially available, it may fill a niche market need.
In the area of construction, it appears that it is fairly straightforward to identify a contractor to install the system designed by the manufacturer. The construction phase only lasts a couple of months, and this is one of the more straightforward components of project development. Even contractors with little experience can complete the projects. Conversely, in British Columbia, where there is appreciably more labor specifically experienced in small hydro project construction, it is difficult to find a contractor with enough time to build these small jobs. In the past couple of years, there has been a crunch in the skilled labor market as Vancouver prepares for the 2010 Winter Olympics. One engineering firm has taken the approach to hire contractors with home bases very close to the projects and closely supervise them while they construct systems. In these cases, the engineering firm assigns one of its own engineers to the job site to make real-time decisions and provide guidance to the contractors as the system is developed. This requires that the on-site engineer have significant experience in project construction, and it does introduce additional risk, but this engineering firm has been successful in getting projects built using this model.
In-State Financial Resources
One other area in which external assistance has been important is in the area of financing. One of the irrigation district managers who has been involved in hydro development stressed the importance of arranging financing so as to avoid the need for an election to earn patron approval of a bond issue. That said, however, the interviewees that have completed (or are close to completing) hydro projects have not brought in third parties to finance the projects; the internal cost of capital for these public or quasi-public organization is significantly less than the cost of capital for private financiers. The project developer often pieces together the needed funds from several different sources. Table 7 summarizes the most popular sources of external funding for small hydro projects.

Table 7. Sources of Public Funds from Oregon Organizations Available for Small Hydro Projects
Organization Program Description of Resources
Feasibility study funding Energy Trust will pay up to 50 percent of study costs; Energy Trust’s share usually reaches a maximum of $30,000.
Energy Trust of Oregon
Above-market cost funding Incentive levels are based on a project’s costs in comparison to the project’s revenues include the market value of the energy produced (above-market cost); no cap. In return, Energy Trust asks for a negotiated share of the project’s green tags.
Business Energy Tax Credit (BETC)
BETC provides a state tax credit to businesses with sufficient in-state tax liability of 50% of project costs over five years. BETC may be passed through to an eligible in-state business in exchange for a one-time payment of 33.5% of the cost of the project.
State Energy Loan Program (SELP)
SELP offers low-interest loans to support renewable energy and energy efficiency projects. SELP loans are tied only to the revenues associated with the project, not to the broader assets of the loan recipient.
Oregon Department of Energy
Community Energy Feasibility Fund
Community Energy Feasibility Fund provides feasibility study funding, primarily for entities other than municipalities (e.g. private sector businesses).
Oregon Department of Environmental Quality (DEQ)
Clean Water State Revolving Fund (SRF)
Funding provided by U.S. Environmental Protection Agency to DEQ for clean water investments; some irrigation district improvements are eligible for low-interest loans through this program
Oregon Economic and Community Development Department
Renewable Energy Feasibility Fund
Renewable Energy Feasibility Fund provides feasibility study funding for municipalities.
U.S. Department of Agriculture
Renewable Energy Assessment Project (REAP)
The REAP grant program provides funding for projects for rural businesses; farms and ranches would be the likely audience for this.
Summit Blue Consulting, LLC 42

All of the programs listed in Table 7 except for SELP have provided funding in support of new hydro projects in the last couple of years. SELP’s last loan in support of a hydropower project was made in the early 1990s. More recent projects that applied to SELP for loans have not received approval; SELP will only consider a project for a loan once the project has received all necessary permits. It does appear that Swalley Irrigation District will receive a loan from SELP in early 2009, pending the success of the bond sale by ODOE to raise the necessary capital.
It appears that these sources of funding, when coupled with some capital from the project host, are robust enough to promote development of small hydro projects. The key is the project host’s internal capacity to take advantage of these sources. This requires, first, awareness of the funding sources and, second, the knowledge and ability to take necessary steps to take advantage of the resources. Sections 4.2.1 and 4.2.4 discuss where potential project hosts are on the path to meeting these requirements.
Market Segmentation
The market actors in this space tend to segment the market along two lines: the type of entity that is hosting the project and the type of resource that is being developed. By understanding who the target market is, vendors can target their marketing to address the key drivers for each type of organization as well as the unique characteristics of each organization. Some motivations are consistent across groups, but each segment has at least one unique driver; these are outlined in Table 8.
Table 8. Key Development Drivers by Market Segment (Type of Host and Resource)
Type of Host Incremental In-Conduit ASR
Residential N/A Environmental consciousness; electricity price risk mitigation
N/A
Agricultural N/A Revenue creation; reputational benefits of green electricity
Cost reduction; reputational benefits of green electricity
Municipal N/A Revenue creation; reputational benefits of green electricity; electricity price risk mitigation
Cost reduction; reputational benefits of green electricity
Private Developer Facility maintenance and revenue generation
N/A N/A
Understanding the characteristics of the organization that will be targeted enables the vendors to align their timelines and expectations with those of the project host. Relevant organizational characteristics include the complexity of budgeting, internal approval processes, goals of the organization, and types of professionals who will be leading the internal efforts. Generally speaking, these characteristics are similar among municipalities and among irrigation districts; that is, many municipalities will exhibit similarities in the level of complexity in budgeting, the internal approval processes, etc., relative to other
Summit Blue Consulting, LLC 43

municipalities. The residential market is highly fragmented, which likely explains the reason that it receives minimal attention from vendors.
4.2 Barriers to New Development Despite the existence of viable small hydro resources in the state of Oregon and financial resources to make the projects viable, few projects have been completed in recent years. The barriers to development are diverse, and some of them are relatively complex. This section discusses the barriers in the order of perceived importance based on the interviews, the survey, and the Summit Blue team’s industry experience.
4.2.1 Internal Expertise Is Lacking
As discussed in Section 4.1, one of the most critical components of a successful project is an internal champion with the ability to coordinate the effort and take over parts of project development. Generally speaking, these resources are lacking among the irrigation districts and municipalities in Oregon. Without these internal leaders, there is little interest in the projects because of the complexity of taking the project from concept to completion. Figure 14 summarizes the survey respondents’ assessment of their staff’s previous experience with hydro development. Municipalities are more likely than irrigation districts to have absolutely no internal experience with hydro development. Two of the irrigation districts that responded have been involved as an organization in small hydro development in the past, but beyond these, only two of the other irrigation districts have any internal experience with small hydro development in the past.
Figure 14. Internal Organizational Experience with Small Hydro Development
0 2 4 6 8 10
Construction
Financial!Knowledge
Legal!Knowledge
Engineering
None
Irrigation!Districts
Municipalities
Source: Survey conducted by the Summit Blue team.
Because the process for developing hydro resources is relatively complex, the presence of an internal champion with the right combination of the above skill sets is important. While it is possible to teach market actors how to navigate the process, as the guidebook co-sponsored by Energy Trust and the Northwest Hydro Association endeavors to do, there are few substitutes for experience. Further, the need
Summit Blue Consulting, LLC 44

to outsource many of these specialized skills increases the cost of the project (while decreasing “ownership”) and can lead to project economics that rule out the project.
Despite the lack of formal experience, some survey respondents indicate that they believe that their organizations do have the ability to develop and/or operate projects. Figure 15 summarizes the survey’s results. From an operational standpoint, these results are not surprising. Most irrigation districts with existing or near-complete hydro systems do or plan to operate the systems with internal staff. Since hydro requires minimal maintenance during its operating lifetime, these costs are fairly low, and the skills needed are transferrable from other mechanical skills that are housed within these types of organizations.
Figure 15. Organizations That Believe They Are Able to Develop and/or Operate Small Hydro Projects
0 1 2 3 4 5 6
Could!Develop
Could!Operate
Could!Develop!and!Operate
Not!Able
Irrigation!Districts
Municipalities
Source: Survey conducted by Summit Blue and Golder Associates, 2008.
The vast majority of organizations responding, however, do not believe that their organizations can develop small hydro projects. This highlights the gap in the project development cycle: the internal capacity to develop. The respondents that indicate that they believe their organizations can develop a project either own and operate an existing project or have one or more of the needed skills. At organizations without existing projects, however, it is a different story. One respondent stated it this way those are decisions that “are out of my pay grade.”
4.2.2 Permitting Process
The permitting process is by far the most complex part of the project development cycle. This section describes how the market perceives the permitting process and then proceeds to provide more detail about where the barriers lie. While this list is not comprehensive, it provides a view of what the market said are the most significant barriers to project development.
Market Perception: Time-Consuming and Expensive
For an individual who has not gone through the permitting process for small hydro before, it is a daunting undertaking. There are many moving parts, and the process involves both federal and state entities. One
Summit Blue Consulting, LLC 45

Summit Blue Consulting, LLC 46
interviewee said, “The process is so painful.” The paperwork, the time, and the financial commitments required without any guarantee that the project will be approved deter many organizations from even starting the process. One market participant estimates that the cost to conduct the feasibility study and to start working through the permitting process can reach $200,000-$300,000 for a commercial-scale project. By the time those funds are expended, there is still no guarantee that a permit will be granted or that the project will come to fruition.
These perceptions differ from those of individuals who have gone through the permitting process in the past. Organizations with existing hydro installations typically have the institutional knowledge necessary to navigate these processes. Having survived the complexities of the process, they say that the perceptions by the inexperienced organizations are not accurate. It’s a matter of patience and persistence, these individuals say, and the willingness to commit the time to seeing it through.
Figure 16 through Figure 19 provide an overview of Oregon’s procedural requirements for permitting a hydro project larger than about 75 kW (or 100 Theoretical Horsepower, Thp). The origin of this market perception becomes evident when examining these requirements.
Note that this process map is actually simplified, omitting the detail associated with the box in Stage 2 that says, “Conduct studies in coordination with the State and Federal agencies.” Fish and wildlife agencies and the Federal Electricity Regulatory Commission (FERC) are usually very active in these studies. Interactions with the Endangered Species Act can extend these studies even longer. It is up to the project proponent to deal with all of these different agencies; the coordination by any individual agency with the others is perceived to be fairly low.
Like many other markets for renewable energy, the market for small hydro is segmented by state, making it difficult for third-party developers to achieve economies of scale. There are different permitting requirements from state to state, and different agencies with which relationships must be built in order to survive the permitting process. As a result, there are few developers (except in the area of incremental hydro) that cross boundaries across states. The Canadian firm interviewed ventured in the Northwest market 20 years ago and pulled out of the market due, in large part, to the complexity of the permitting process. Their perception is that the process is still quite complex. In the meantime, they have been kept busy with development in British Columbia, where the market is active and permitting is simplified by a central provincial permitting process where federal and local interests are incorporated and managed by the provincial authority in a streamlined process.
In one respect this permitting process actually became simpler as the result of a 2007 law passed by the Oregon Legislature. HB 2785 allowed water rights holders with an existing diversion to simply add a new beneficial use for hydro, which allowed projects that fit into this bucket to follow an expedited process relative to the conventional hydro permitting process.25 The additional beneficial use does not introduce any new water rights; it simply allows the water right holder another non-consumptive use of the water. By piggybacking on the existing water right, the water right holder can bypass some of the complications of the permitting process discussed in section 4.2.2. It should be noted that the Oregon Water Resources Department, the organization that administers the permitting process for small hydro projects, has yet to receive an application under this new permitting process.
25 74th Oregon Legislative Assembly (2007 Regular Session). Enrolled HB 2785. Available: http://www.leg.state.or.us/07reg/measpdf/hb2700.dir/hb2785.en.pdf

Figure 16. Oregon's Permitting Process for Hydro Projects Larger Than 75 kW: Stage 1
!
!
!
!
!
!
!
!
!
!
!
!
!
!
! !
!
!
!
!
!
!
!
!
!
!
!
!
! !
Complete
Project!size!
100!THP!or!less!
Follow!Minor!Project!Procedure!for!Filing!
Application!!OAR!690"051"0090!
Greater!than!100!THP!
Follow!Major!Project!Procedure!for!Filing!Application!OAR!690"051"0095!
STAGE!1!
Submit!application!and!fee,!application!is!date!stamped.!!Date!
stamp!is!priority!date!of!application!
Returned!for!correction/completion!
or!further!info!
Notice!of!application!posted!in!WRD!weekly!notice!
Incomplete
WRD!will!distribute!copies!to!the!Hydro!Task!Force!(HTF).!!A!meeting!date!is!set!for!applicant!to!present!project!to!the!HTF.!
Applicant!shall!prepare!a!draft!study!plan!and!distribute!to!appropriate!agencies!
listed!in!OAR!690"051"0060!
WRD!will!schedule!a!site!visit!and!schedule!a!public!hearing.!
Comment!period!is!established!for!HTF,!other!affected!agencies!or!public!can!review!and!
provide!comment!
Director!of!Commission!shall!issue!an!order!to!modify,!approve!or!reject!the!
Preliminary!Permit!
Permit!Approved!
Proceed!to!Stage!2!
Permit!Denied!
Summit Blue Consulting, LLC 47

Figure 17. Oregon's Permitting Process for Hydro Projects Larger Than 75 kW: Stage 2
STAGE!2!
Modify!Permit!based!on!requirements!imposed!by !Preliminary!Permit.!!Submit!final!study!plan!to!
agencies!and!Director !for!approval!–!notice!of!
submit tal!will !appear!in!WRD!weekly!notice!
File!response!to!request!within!30!days!of!receiving !
notice!from!Director!of!the!
Request!
Commission!shall!resolve!any!dispute!and!inform!all!
participants!to!the!dispute!
accordingly!
Conduct!studies!in!
coordination!with!the!State!and!Federal!Agencies!
Prepare!draft!license!(non"municipal)!or!permit!
(municipal)!application!and!submit!to!State!and!Federal!agencies,!Indian!tribes!and!the!public!for!review!and!
comment.!!Notice!for!opportunity! to!review!will !be!
Comments!shall!be!submitted!within!a!time!period!set!by!the!
Director !who!shall!forward!the!responses!to!the!applicant!and!HTF!
Proceed!to!Stage!3
Comments!from!Agency, !
Tribe!or!Public
No!Comments!
from!Agency,!Tribe!or!Public
Request!from!Agency,!Tribe!
or!Public!for !additional!studies,!within!30!days!of!
receipt!of!final!study!plan!
Summit Blue Consulting, LLC 48

Figure 18. Oregon's Permitting Process for Hydro Projects Larger Than 75 kW: Stage 3
!
!
!
! !
STAGE!3!
Applicant!shall!file!application!with!WRD.!!The!Department!shall!distribute!the!application!to!appropriate!consultation!agencies.!!Notice!shall!be!mailed!to!local!planning!authority,!affected!property!owners!and!public!interest!groups!on!record!with!WRD.!!Application!
shall!be!made!public!by!the!developer!and!Department!
An!agency,!Indian!tribe!or!member!of!the!Public!may!request!additional!information!within!60!days!after!application!is!filed!
Applicant!shall!file!a!response!within!30!days!of!receiving!notice!of!the!request!
The!Commission!shall!accept!or!reject!applicant’s!position!on!additional!studies!and!notify!affected!parties!accordingly!
Once!application!issues!are!resolved,!a!ready!for!final!review!notice!shall!be!sent!to!agencies!and!interested!parties!by!the!Director!
(comments!must!be!submitted!within!60!days!of!final!review!notice)
The!Director!shall!prepare!an!order!on!the!potential!the!proposed!project!may!contribute!to!cumulative!impacts!with!other!existing,!proposed!or!approved!
hydroelectric!projects!in!the!same!river!basin!and!distribute!it!to!state!and!federal!agencies,!Indian!tribes!and!other!participants.!
If!a!determination!is!made!that!there!is!not!potential!for!cumulative!impacts!the!director!shall!conduct!a!contested!case!hearing!on!the!public!interest!issues!of!the!application.!!If!no!exceptions!are!filed!to!the!proposed!order!within!30!days,!the!
proposed!order!becomes!final!and!is!signed!by!the!Director!
If!exceptions!are!filed!to!the!final!order,!the!Commission!shall!review!and!make!the!final!determination!for!the!final!order
Proceed!to!Stage!4
Consolidated!review!will!be!conducted!as!a!contested!case!hearing,!in!the!event!
of!cumulative!impacts!
Summit Blue Consulting, LLC 49

Summit Blue Consulting, LLC 50
Figure 19. Oregon's Permitting Process for Hydro Projects Larger Than 75 kW: Stage 4
STAGE!4!
The!License!or!Permit!shall!be!issued!or!denied!with!condition!that!the!Director!or!Commission,!in!cases!where!the!final!order!is!issued!by!the!
Commission,!deems!necessary!
The!applicant!shall!submit!construction!specifications!to!the!Director!
A separate permitting process exists for projects smaller than 75 kW (100 Theoretical Horsepower, Thp) that do not already have a water right. This process does not require FERC approval, but the process includes significant opportunity (i.e., time) for stakeholder involvement. The result is a process that lasts a minimum of 90 days once the application is submitted and can last twice as long, depending on the validity of objections raised. This long up-front time commitment is a significant one, especially if the applicant is a resident or small organization.

Summit Blue Consulting, LLC 51
Figure 20. Oregon's Permitting Process for Hydro Projects Smaller than 75 kW: Stage 1
!
Complete
Incomplete
Minor!Hydro!
Project!(100!THP!or!less).!
Understand!resource!protection!standards!
that!must!be!satisfied!in!order!to!approve!the!
project.!
Follow!Minor!Project!Procedure!Filing!Application!OAR!690"051"
0090!
Prepare!a!project!map!and!obtain!a!tax!assessor’s!
map!for!the!powerhouse!area.!
Obtain!project!approval!from!county!land!use!agency!(appropriate!
OWRD!form)!
Submit!the!completed!application!packet!and!the!first!installment!of!the!application!fee!($500)!to!OWRD!
Complete!application!and!submit!fee.!
Returned!for!correction/completion!
or!further!info.!

Summit Blue Consulting, LLC 52
Figure 21. Oregon's Permitting Process for Hydro Projects Smaller than 75 kW: Stage 2
!Submit!the!completed!application!packet!and!the!first!installment!of!the!application!fee!($500)!to!OWRD!
Application!published!in!OWRD!weekly!publication.!
OWRD!sends!out!a!public!notice!to!local!county!planning!
department!for!a!30"!day!comment!period.!!
OWRD!sends!out!a!public!notice!to!any!property!owners!
within!300!feet!of!the!powerhouse!and!affected!Indian!tribes!for!a!30"!day!
comment!period.!
OWRD!sends!questionnaire!to!state!and!federal!agencies!regarding!the!project;!must!respond!
within!30!days.!
OWRD!reviews!comments!and!prepares!a!technical!report!stating!their!opinion.!If!
approved,!a!draft!water!right!will!accompany!the!report.!
Site!visit!might!be!scheduled!conducted!by!various!agencies.!
Application!accepted.!Any!comments!are!integrated.!Once!remaining!$500!
application!fee!is!submitted,!OWRD!issues!a!time"limited!
water!right.!
Application!denied;!applicant!can!request!case!hearing.!Then!the!department!will!
distribute!Contested!Hearing!Case!to!all!interested!parties.!
Technical!report!and!draft!water!right!sent!to!commenters!and!receiving!agencies!for!60"
day!comment!period.!
Any!objections!sent!to!applicant,!all!objectors!and!
commenters!and!all!agencies.!
If!invalid,!Director!informs!objector!and,!who!can!submit!a!
protest!within!30!days.!
If!there!is!a!protest,!Director!refers!it!to!Water!Resources!Commission.!
If!valid,!OWRD!will!make!revisions!and!sends!it!out!to!all!interested!parties!for!another!
comment!period.!!

Summit Blue Consulting, LLC 53
Oregon’s No Dead Fish Rule
One element of Oregon’s permitting process for new run-of-river hydro projects that introduces more complications is the “No Dead Fish Rule” (otherwise known as Oregon Revised Statute Chapter 543.017(c)). In cases where this rule applies, the applicant must prove that the new hydro development does not result in any net loss of fish. It has been interpreted to mean that the projects cannot kill any additional fish, which introduces additional costs and studies for projects subject to the rule. The specific language in the statue is as follows:
Except as provided in this paragraph, no activity may be approved that results in a net loss of wild game fish or recreational opportunities. If a proposed activity may result in a net loss of any of the above resources, the commission may allow mitigation if the commission finds the proposed mitigation in the project vicinity is acceptable. (ORS 543.017(c))
There is some confusion about what “mitigation” will be interpreted to mean in a legal context. Whether this involves fish screens, the trucking of fish around dams, or other measures is unclear to some individuals involved in relevant projects. There may be case law that clarifies how this will be interpreted, but it is not widely known among those involved in relevant projects.
This statute only applies in cases where the applicant applies for a new water right. Sites that are eligible to use the expedited HB 2785 process discussed earlier are not subject to the No Dead Fish Rule. It does however appear to typically apply for an incremental hydro improvement.
Seasonal Water Rights Hurt Economics
The economic feasibility of a small hydro project is sometimes compromised by seasonal water flows. Irrigation districts’ water rights are often seasonal, only allowing them access to the water during irrigation season. While this is appropriate for their core business, it means that small hydro projects may be generating electricity (and therefore revenue) for only a few months each year. The energy generated during these few months often fails to generate the revenue needed to make the project cost effective. In some cases, the seasonal flows are sufficient to earn the needed return on investment, but in many other cases, this is a significant barrier to development.
Irrigation districts could apply for new water rights that extend their existing water rights to year-round status, but this introduces two main challenges. First, the application for a new water right disqualifies the applicant from using the expedited permitting process outlined in HB 2785.26 Applying for a new water right is a more rigorous process, which adds both time and cost to the project. Second, the new water right will have junior status and will introduce more risk into the project’s predicted energy production. Because the water right is junior, the level of uncertainty associated with its annual flow is higher than for more senior water rights already held by irrigation districts. When forecasting energy production and associated revenue, the modelers will have to assign a higher discount rate to these new water flows; this reduces the amount of revenue that can be included in the cash flow analysis.
26 74th Oregon Legislative Assembly (2007 Regular Session). Enrolled HB 2785. Available: http://www.leg.state.or.us/07reg/measpdf/hb2700.dir/hb2785.en.pdf

Not All Water Rights are Equal: Certificated Water Rights
All water rights that pre-date the Oregon Water Code’s inception on February 24, 1909, and that have been used continuously since then must be adjudicated27 to be eligible for a hydro development. The goal of the adjudication of these “vested” water rights is a “certificate” of each decreed right; this certificate is a prerequisite for any hydro development. The adjudication process involves a comprehensive public process component, however, which provides opportunities for stakeholders to contest the claims to the water rights.28 For some of the largest water rights holders, the prospect of losing claim to any of their vested water rights is enough to deter them from pursuing certification.
When considering possible hydro sites, it is important to consider the status of the water rights held by the potential host organization. If they have yet to be adjudicated, it may be several years before the site is even eligible to begin the permitting process for a hydro development. In the Klamath Basin, for example, the adjudication was still in process as of September 2008,29 and the initial filings of claim to water rights were due in 199130; this 17-year-old process had still not delivered a final order or the certificated rights. In other cases, the host may not have any plans to adjudicate their water rights, which indicates that a hydro development is not in their future either. Understanding the status of water rights at the outset of discussions about hydro development is a critical factor in identifying potentially successful projects.
Lack of Appropriate County and City Land Use Ordinances
In addition to the state processes for securing approval for hydro development and clarifying water rights issues where relevant), new hydro projects are also subject to county or city land use ordinances. One irrigation district’s biggest barrier to development was navigating the passage of a new zoning amendment at the county level. This irrigation district reported that ODOE is aware of the issue and has determined that none of the counties in Oregon had zoning ordinances in place that would allow, much less encourage, hydro development. As a result, the first new hydro development in each county would have to gain passage of an amendment to the zoning code that allows for hydropower development.
Other Permitting Issues: ASR Technologies
The ASR sites for which 3RValve’s technology is applicable are not eligible for hydro development because they are not directly permitted as certificated water rights but are first permitted through limited licenses.31 The ASRs are typically issued limited licenses for five to six years, at which time they may enter the permit stage. Thus, the ASR site owners would have to wait until the certificated right is obtained before initiating the hydro permitting process.
The main barrier associated with this permitting nuance is one of cost. The incremental upfront cost to install a 3RValve (or another comparable technology) at the time that the ASR is constructed is minimal.
Summit Blue Consulting, LLC 54

Summit Blue Consulting, LLC 55
If the valve must be installed several years after the system is built, however, the cost to install the technology matches the price of the equipment, creating less favorable economics.
4.2.3 Interconnection
The process for interconnecting small renewable energy systems was described as more difficult than it needs to be. One respondent indicated that one utility’s interconnection process is so onerous that it seems that [the utility] did not want small hydro on its grid at all; this individual cited the requirement for a full-blown interconnection study on a project so small that the grid barely notices as an example of the utility’s aversion to small hydro project. This account reflected perceptions similar to those expressed in the interviews conducted as part of Summit Blue’s risk assessment work with Energy Trust.
In this context, another respondent developed a successful approach to navigating the complex interconnection requirements. This respondent brought an electrical engineer to all interconnection-related meetings. The engineer’s technical knowledge facilitated the detailed procedural discussion and added credibility to the project proponent’s case.
4.2.4 Lack of Familiarity with Available Resources
Survey data indicate that awareness of the resources available to assist in hydropower project development is low. More than 70% of respondents indicated one of the two lowest levels of awareness for BETC and for Energy Trust’s feasibility study funding, technical assistance and funding of above-market costs; at least 60% of those responses fell in the lowest level of awareness. Figure 22 shows the survey data for representatives of irrigation districts and municipalities combined because there was minimal difference between these segments.
27 Oregon Water Resources Department. April 4, 2008. “Other Water Rights.” Available: http://www.wrd.state.or.us/OWRD/PUBS/aquabook_other.shtml 28 Ibid. 29 Oregon Department of Water Resources. September 2, 2008. “Klamath Basin Adjudication: Current Statistics.” Available: http://www1.wrd.state.or.us/files/Publications/klamath-adj/Status_of_the_Adjudication.pdf 30 McLean, Holly R. Office of General Counsel, U.S. Department of Agriculture, Portland, OR. Klamath Adjudication – Lessons Learned. Available: http://www.stream.fs.fed.us/afsc/pdfs/McLean.pdf 31 Oregon Water Resources Department. April 4, 2008. “Other Water Rights: Limited Licenses.” Available: http://www.wrd.state.or.us/OWRD/PUBS/aquabook_newrights.shtml

Figure 22. Survey Responses Regarding Awareness of Available Resources
0 5 10 15
Not!Very!Aware
Somewhat!Aware
Very!Aware
Above"Market!Costs
Technical!Assistance
Feasibility
BETC
Source: Survey conducted by the Summit Blue team, 2008.
This is a major barrier for future development of small hydro projects, but it is also an opportunity for Energy Trust. Of the respondents that indicated their level of awareness in the two lowest levels, one-third of municipalities’ representatives and nearly two-thirds of irrigation districts’ representatives indicated that there was a somewhat receptive or very receptive attitude toward small hydro within their organizations. This indicates that there are untapped potential hosts in the marketplace that would be interested to learn more about resources that would facilitate project development. Whether or not these organizations include representatives that can take the project forward is a separate issue, but the interest in learning about the potential for development is the next step.
Summit Blue Consulting, LLC 56

5 OPPORTUNITIES AND ACTIONS NEEDED TO
MOVE THE MARKET FORWARD The market for small hydro development in Oregon has challenges and opportunities. The barriers outlined in Section 4.2 shape the market by defining the rules for engagement; all market activity must proceed according to those rules. Working within these rules for engagement and around the barriers, it is possible to create opportunities for development, which are discussed in section 5.1.
Until the permitting situation structure for small hydro is simplified, the market will require external support. Section 5.1.3 outlines several strategies for deploying such support in the market. As it stands, the timeline for developing projects makes it difficult for a private market actor with expertise in the field to earn a rate of return sufficient to justify investment in the market. Without the experts, development must be pushed forward by a small set of unique individuals within the target market that possess the skill set needed to drive a project forward. In addition to this limited set of experts, there is a finite number of somewhat fragmented organizations with the characteristics needed to pursue projects. This further challenges the private sector because it is difficult to identify a target market of any substantial scale.
The last part of this section (section 5.3) discusses changes in policy that would facilitate small hydro development by reducing the permitting hurdles. These changes would require a long lead time to materialize and would be, for the most part, outside of the control of Energy Trust. These policy changes are outlined, however, because they would make progress toward creating a market that is driven by the private sector, rather than by incentives or market intervention.
5.1 Opportunities for New Development The current regulatory and decision-making environment indicates that new development in Oregon can happen if it leverages existing processes. This manifests itself clearly in three areas. First, new hydro development that relies on certificated water rights with existing diversions will reduce the permitting burden (Section 5.1.1). Identifying construction projects already planned by target market actors can facilitate the budgeting and consensus-building processes (Section 5.1.2). Finally, water rights holders with seasonal water rights (e.g., irrigation districts) may be able to access water year-round by working within the existing hydro permitting process (Section 5.1.3).
5.1.1 Piggyback on Existing Diversions
As discussed in Section 4.2, water rights that are certificated have access to a streamlined permitting process that reduces the permitting burden. Potential hydro sites that lack a certificated water right must either go through the process to secure a new water right or through the adjudication process to certificate the right; without the certificated water right (created anew or through the adjudication process), it is not possible to secure the permits necessary for hydro development. The process to obtain a new water right is long and even when complete will result in a very junior water right that may not provide a reliable supply of water. This is the case for all types of sites, including those owned by municipalities, utilities, irrigation districts, and private citizens. The challenges to the adjudication process were discussed in depth in Section 4.2.2.
Summit Blue Consulting, LLC 57

New projects must take advantage of the simplified permitting process. All else being equal, the shorter development timelines will facilitate the development of projects with higher rates of return because the cash flows will start earlier. Targeting projects that fit into this category of water rights will lead to a higher rate of success in completing projects.
5.1.2 Leverage Planned Construction Projects
Hydro generating systems can often be added during the construction phase of another major capital improvement project at what seems like minimal incremental cost relative to the overall costs of the project. Swalley Irrigation District, for example, plans to install its hydro system at the same time that the irrigation district is engaging in a massive expansion of its pipeline infrastructure. Similarly, Farmers Irrigation District’s current upgrade to its existing small hydro system is part of a larger capital improvement project that sought to increase the efficiency of the pumps in its system. In both cases, gaining support for the hydro component of the project was nearly effortless. The revenue generating opportunity more than outweighed the incremental cost from the perspective of the patrons.
In support of this idea, the survey indicated that the budgeting cycle for an additional expenditure such as a small hydro generator is not overly long. About two-thirds of the respondents indicated that the budget approval process for a small hydro project would be less than one year. The response differed slightly between the irrigation districts and the municipalities that responded, with the irrigation districts having a larger percentage responding that it could take more than two years, as shown in Figure 23.
Summit Blue Consulting, LLC 58

Figure 23. Estimated Time to Approve Budget for Hydro Project: Irrigation Districts (top) and Municipalities (bottom)
less!than!6!months
6"12!months
13"24!months
more!than!2!years
Source: Survey conducted by the Summit Blue team.
less!than!6!months
6"12!months
13"24!months
more!than!2!years
Future development of small hydro systems could expand on this trend of adding hydro to existing capital improvement projects. This would require that Energy Trust (or other vested market actors) identify the pipeline of capital construction projects. This could be done through networks in the industry, by attending industry conferences, or through a search of permitting applications; most relevant capital improvement projects are bound by public permitting processes. Outreach to other agencies in the permitting cycle could encourage the view that small hydro, as a renewable generating resource, should be seen as a value-added and potentially risk mitigating measure.
This development opportunity does require that other criteria for success be in place in order to produce a successful project, however. The budget approval process requires that the involved agencies believe that the organization is capable of successfully completing a project and that feasibility studies indicate that a viable site exists. In these cases, the key is to identify the capital improvement processes early in their development in order to align the timeline for the hydro project with that of the driving capital project.
Summit Blue Consulting, LLC 59

5.1.3 Access Year-Round Water for Irrigation District Projects
Within the existing permitting framework, it appears possible that seasonal water rights holders are able to access water year-round to supply their projects. The goal is to enable hydro systems owned by seasonal water right holders to produce electricity year round, which increases the amount of revenue generated by the project and improves project economics. This approach is appropriate for irrigation districts, which typically hold permits for the irrigation season only (April 15-October 1).
Figure 24 presents a simple scenario under which an irrigation district may be able to access water for its hydro system in months during which its water right is not active. Water Rights Holder #1 represents the irrigation district with a hydro system; the irrigation district diverts water and returns it to the same stream. Water Rights Holder #1 is upstream of Water Rights Holder #2, which holds a senior water right on the stream (relative to other water rights holders on the stream); Water Rights Holder #2 will divert the water at the green hash mark.
Figure 24. Reference Figure for Year-Round Water Rights Scenario
Point of Diversion for Water Rights Holder #1(Irrigation District / Hydro Project)
Point of Diversion for Water Rights Holder #2(Senior Water Right Holder)
Point of Return for Water Rights Holder #1(Irrigation District / Hydro Project)
Upstream
Downstream
If the water rights are configured as in Figure 24 and several other assumptions are met, it appears that the irrigation district would be able to divert water for use in its hydro system during the months in which its seasonal water right is not active. The irrigation district would divert the water through its hydro system and return it to the stream upstream of the point of diversion for Water Rights Holder #2. The seniority of Water Rights Holder #2’s claim ensures that the water will still be in the stream when it reaches the point of diversion for the irrigation district. Conversely, if the irrigation district is downstream of a senior water rights holder, the in-stream flows may not be sufficient to supply the hydro system at the point of diversion.
This general approach is subject to several assumptions:
! The irrigation district can divert and return water to the same stream in the configuration outlined in Figure 24;
Summit Blue Consulting, LLC 60

! The irrigation district does not consume any of the water that it diverts;
! All other in-stream water rights between the irrigation district’s point of diversion and point of return are met;
! Power is a classified use in the basin in which the stream is located; and
! OWRD sanctions such an arrangement.
This approach requires additional research in order to determine its feasibility in real-world conditions. First, such a more detailed scenario must be proved out with OWRD staff. A preliminary conversation with OWRD indicates that this type of arrangement warrants further consideration, but OWRD did not provide any approval or sanctioning of such an approach in this preliminary discussion. Further, it would be necessary to determine how many sites in Energy Trust territory have this type of configuration. A GIS analysis would be one approach to visualize the relative seniority of water rights, types of organizations that hold the water rights, and the classified uses in the basins.
An additional risk is created through this approach that would also be worthy of investigation. During the months in which the irrigation district’s seasonal water right is not active, the irrigation district would not have a right to the water that it is diverting. During these “off” months, the irrigation district relies on the seniority of the downstream water rights holder to maintain the flows in the stream to supply the hydro project. If the downstream senior water rights holder were to give up its right or otherwise change its status, the flows may not be available for the irrigation district. This introduces another risk factor in the calculation of project revenues, which would likely increase the cost of capital; depending on the severity of the risk premium assigned, this additional cost of capital may offset the gains of the improved project economics realized through this approach.
5.2 Short-Term Actions Needed to Move the Market Forward
Because the small hydro market is somewhat fragmented in terms of resource and market actors, a simple intervention like financing may not be sufficient incentive to develop additional small hydro resources. It would appear, however, that sufficient resource exists to merit an appropriately targeted intervention. The forms that such interventions might take are discussed in this section.
5.2.1 Provide an Expert to Help Interested Organizations Navigate the Process
Those organizations that were successful at small hydro development in Oregon typically possessed each of four necessary components:
1) Awareness of small hydropower as a “real” resource;
2) A technically feasible project;
3) The funding to pursue and build the project; and
4) Access to a resource conversant in hydropower, public finance, and permitting.
Summit Blue Consulting, LLC 61

Summit Blue Consulting, LLC 62
The research indicates that the first three components are necessary but not sufficient in and of themselves. As this learning was garnered part way through the research, several market actors were asked about interventions targeted to the fourth element: would it be feasible for them to work with an outsourced, but onsite project advocate? Response to the concept of a paid on-site expert was strongly positive. Energy Trust has had experience with this approach in providing advice to assist in developing a geothermal resource and experience with other entities, such as BC Hydro’s VanCity effort, has also been positive.32
Ideally this resource would be dispatched to work part-time for several entities at once, pursuing grants and identifying projects that could generate renewable power and would also improve utilization of existing water resources, which would improve stakeholder support of the project and, in turn, funding. As broader implications of climate change are increasingly appreciated, it seems likely that including small hydropower in infrastructure improvements (e.g. where ditches or other conduit may be leaking) will only serve to increase the palatability of these types of improvements to the public.
Despite the perceived difficulty of this process, it was not perceived to be a “full time” effort for a single person. Thus the right person or entity could support more than one organization, thereby leveraging learnings from several entities.33 Other “two-fer” support efforts could be identified, especially in cases in which one water entity serves more than one city. Support of efforts like this would also have the effect of increasing the odds of an actual project. If one city is unable to build or is delayed, the knowledge brought to the process could still support a project by the other city.
5.2.2 Raise Awareness about Energy Trust’s Support
Several interviewees cited perceived reputational benefits of generating renewable power as a significant project benefit or potentially mitigating benefit of a larger project. It is therefore somewhat ironic that those projects that have been sponsored or have received some initial funding have not received more media coverage. Additionally, the research points to a lack of awareness of Energy Trust support of small hydro in the municipalities and irrigation districts. Customers that had not already applied for feasibility study support were more likely to be aware of Energy Trust as a funder of efficiency projects. This may highlight an opportunity for Energy Trust to leverage existing contacts in this sector to move deeper into the customer’s organization. This would also appear to be true for managers of larger hydropower portfolios (e.g., PacifiCorp) considering incremental hydropower. Engineers constrained by capital and outage planning do not appear to be familiar with Energy Trust as a potential resource in this area. Indications are that these planning engineers would welcome additional information and training on how different programs “interface” as some concern does exist about overlapping funding sources.
Increasing outreach to these key market actors would aid in transferring knowledge about the feasibility and support for these types of projects and would highlight additional benefits gained by participants in Energy Trust programs. Potential project hosts would recognize that a successful project completed with assistance from Energy Trust programs would generate media coverage and other reputational gains. Specific types of awareness support identified as desirable include the following: additional outreach,
32 For example see BC Hydro’s VanCity effort. They paid to have an MBA ‘work for’ Vancouver City Business Banking. This seasoned and experienced energy expert was placed at VanCity to identify opportunities for energy efficiency at the point of project inception and financing. Although paid for by BC Hydro, the MBA worked at the credit union. 33 The City of Banks Oregon was mentioned in one interview as a location with exploitable head in a conduit that needs improvement.

meetings, workshops (particularly on-line to mitigate travel issues). Note too that promotion of small hydro development as a “mitigating measure” to the risk of local opposition to construction or other major projects may tap into a nascent but apparently growing trend.
In addition to these broader outreach efforts, targeted outreach to a specific set of market actors may also help Energy Trust identify the capital investment projects discussed in section 5.1.2. Building a network in the construction community that installs the piping systems and with relevant permitting agencies would create opportunities to identify projects at a phase when the design may still be altered to include a small hydro system. By communicating program offerings to the construction industry, Energy Trust would be able to expand its reach in the industry and leverage the principles of social marketing. Accessing this information through the regulatory agencies, conversely, would concentrate Energy Trust’s efforts and provide a focused set of contacts that could feed information back to Energy Trust to help identify organizations with near-term hydro project potential.
5.2.3 Create a Road Map of All Permitting Requirements
A road map that describes all of the permitting requirements would provide another means of overcoming the policy-related barriers to developing small hydro projects. An overview of the permitting process would enable organizations without access to an internal expert to move forward, and it would provide a frame of reference for those organizations considering a hydro project. Understanding the time scale on which the permitting takes place and the requirements can help an organization new to small hydro development understand what information it will need to move the project forward. It would also remove some of the mystery involved in the permitting process.
The road map would include a variety of information critical to navigating the permitting process for classes of projects with potential for development in Oregon, including water treatment and irrigation districts. The information would include timelines, information required, and tips for preparing successful permitting applications. By clearly delineating the requirements by the agencies that require them, the road map would enable an inexperienced developer to engage in the permitting process. The road map could focus on the federal and state requirements and then identify county- and local level requirements to the extent that they are similar across jurisdictions.
The key to the success of the road map is to present the information in a succinct and straightforward manner. A 200-page document would enhance the perception that the process is complex and time consuming; conversely, a document that distills down the most important information into as simple a process as possible will help to overcome that perception. The central piece of the road map would be a graphic that clearly delineates the actions required of the project owner by different agencies at different points in the process.
5.2.4 Create Long-Term Certainty in Incentive Levels
Long-term certainty in the incentives offered to support small hydropower projects would encourage the technical experts needed to make the market flourish to invest in Oregon. A commitment to a standard offer on the horizon of five to ten years would ensure that the economics of a small hydro project would not dissipate halfway through the development process. It would also encourage the private sector technical experts, including the engineering, equipment manufacturers, legal advisors, and developers, to target Oregon’s market more directly.
This approach also acknowledges the time that it takes to complete a project – everything from building organizational and stakeholder support for the project, through the feasibility, permitting, capital raising,
Summit Blue Consulting, LLC 63

and construction phases of the project. Altogether, the Swalley Irrigation District project is expected to take about five years, and that includes guidance from an experienced internal champion and a straightforward permitting process because the hydro project will be in conduit. Other projects can take longer from start to finish. Uncertainty about the incentive’s availability and level at the time that the project is ready to apply for it creates additional risk for the project developer.
The development of a robust set of technical resources in Oregon to support development is an important factor for the target market. For irrigation districts, the ability to have a face-to-face conversation about the project with technical experts is an important element to a project’s success. Even a consultant in Portland can be considered an outsider for some organizations. The remoteness of some organizations can also lead to increased travel costs for consultants coming from out of state, adding to the cost of determining a project’s viability. Thus, the development of a dispersed network of professionals to support hydro development will be an important determinant of project success for this market segment.
In British Columbia, the market for developing small hydro projects is robust, due in large part to the existence of a standing, standard offer for projects under 10 MW. Developers and engineers understand that the incentive will be available as they progress through their pipelines of projects, creating certainty about the financial viability of these projects. At once, this approach reduces the risk to the developer and helps to mitigate the high fixed cost of hydro projects. This decision is implemented by BC Hydro and is aligned with a broader provincial goal of becoming energy independent by 2016.
The risks and benefits of this approach must be carefully studied and considered in the context of the goals of Energy Trust. The practice of instituting long-term standard offers has not been a part of Energy Trust’s approach to the renewable energy market to date. There are concerns that this structure may result in paying too much for some resources and may not provide enough flexibility for other projects. In the past, there has been concern that the public purpose funds that provide funding for Energy Trust would not be available over such a time frame; SB838’s extension of the public purpose funding for Energy Trust through 2026 has created more clarity around this issue, however. Depending on Energy Trust’s own risk assessment, it may be determined that this type of incentive program would be better offered through a separate entity.
5.3 Long-Term Actions Needed to Move the Market Forward
This section lays out a variety of actions that can be taken to move the market forward that require longer time horizons. Affecting these policy-focused changes will require the commitment of significant time and resources over a longer period of time. The ability to affect change in these areas is, for the most part, outside of the control of Energy Trust, but changes in these areas would help to address some of the primary barriers to the development of small hydro.
5.3.1 Align State and Federal Exemptions
Alignment between the trigger points for expediting the permitting process at the state and federal level would further streamline the permitting process. For projects that are not in conduit, the federal and state governments have different project sizes that trigger eligibility for exemption. FERC allows projects
Summit Blue Consulting, LLC 64

Summit Blue Consulting, LLC 65
under its jurisdiction34 that are smaller than 5 MW and that meet certain requirements to apply for an exemption from its standard permitting process. OWRD allows projects smaller than 100 Thp (or ~75 kW) to apply for permits through an expedited process. Those projects that fall in between the 75 kW and 5 MW thresholds and are subject to FERC’s jurisdiction are required to go through the more rigorous screening at the state level while being able to take advantage of the streamlined federal process. Projects not subject to FERC’s jurisdiction will also benefit from an expedited process.
Oregon has already accomplished this to some extent for in-conduit projects. In-conduit projects that are smaller than 15 MW if owned by non-municipal entities (or smaller than 40 MW if owned by municipalities) and that meet certain other criteria are exempt from the FERC permitting process.35 Oregon’s adoption of HB2785 tied an in-conduit project’s eligibility for an expedited permitting process to its eligibility for this FERC exemption.36 As a result, projects that fit into this category have fewer permitting barriers to overcome than most other projects.37
Reducing the permitting burden at the state level would reduce one of the fixed costs associated with hydro development. Since the cost of hydro development is driven by its up-front investment, the reduction in this cost can help make project economics more attractive. While this fixed cost is small when compared with the cost of equipment, it still contributes to the overall up-front cost.
Even if these improvements were made, some confusion over the permitting process would remain for first-time applicants. A simpler permitting process that involves multiple permitting entities can still be confusing. Many first-time applicants will not have heard of FERC before and will wonder where to start the process, as discussions with current market actors revealed is already an issue. Some type of guidance on the permitting process will still be needed, but a simplified process will reduce the complexity of that guidance.
5.3.2 Centralize Permitting
Creating one point of contact for permitting small hydro projects that addresses federal, state, county, and local issues would make the permitting process even more accessible. This approach builds on the OWRD’s existing stakeholder process, which solicits input from a variety of state and federal agencies. Effectively, this would create a one-stop shop for obtaining the permits necessary for small hydro projects. While still addressing the concerns of all of the stakeholders, the central permitting authority
34 FERC jurisdiction only extends to projects that meet at least one of the following requirements: the project is on a navigable waterway; the project will affect interstate commerce (i.e., if the system is connected to a regional electric transmission grid); the project uses federal land; or the project will use surplus water or water power from a federal dam.” Source: Oregon Department of Energy. “Micro Hydroelectric Systems.” Available: http://www.oregon.gov/ENERGY/RENEW/Hydro/Hydro_index.shtml 35 Federal Energy Regulatory Commission. April 2004. “Handbook for Hydroelectric Project Licensing and 5 MW Exemptions from Licensing.” Available: http://www.ferc.gov/industries/hydropower/gen-info/handbooks/licensing_handbook.pdf 36 Northwest Hydro Association. May 16, 2007. “Small Hydro Workshop.” Available: http://www.oregon.gov/ENERGY/RENEW/Hydro/docs/6-Hydro_Workshop16may2007-Lee.pdf 37 Applying for the FERC exemption still requires diligence and paperwork, however, which may still require guidance for first-time hydro project developers.

Summit Blue Consulting, LLC 66
would facilitate the permitting process for hydro development. Since many of the same issues are addressed by different agencies’ permitting requirements, this approach would streamline the process while still achieving the goals of multiple agencies.
The complexity of the permitting process is one of the most significant deterrents to developing small hydro. The time commitment required to manage the permitting process is significant, and the duration of the permitting process delays the start of revenue generation further decreasing the return on the investment. Organizations such as water utilities and irrigation districts only develop one or two hydro projects over their lifetime, making the development of internal capacity needed to navigate the permitting process not cost effective. Outsourcing the needed expertise to the private sector can add cost to projects that are already pushing the limits of cost effectiveness.
A variety of approaches may be considered in developing a central permitting body. Creating a panel that includes representatives of all the relevant permitting agencies would ensure that the individual agencies’ goals are met to their satisfaction. Ideally, such a panel would be located in Oregon to facilitate the process and leverage the relationship building which results from the accessibility of the panel. Alternatively, one agency may facilitate the process. Several agencies may agree to consolidate all of the permitting requirements into one form, and the facilitating agency would be charged with circulating the completed form to all of the relevant agencies and soliciting approval. The central body would then consolidate all comments and send them back to the applicant.

Summit Blue Consulting, LLC A-1
APPENDIX A: DATA DEFINITIONS FILES

Description Spatial Attributes
Page 1 of 9
10/23/2008file://C:\Documents and Settings\kjanssen\Local Settings\Temp\metadata81.htm

Page 2 of 9
10/23/2008file://C:\Documents and Settings\kjanssen\Local Settings\Temp\metadata81.htm

Page 3 of 9
10/23/2008file://C:\Documents and Settings\kjanssen\Local Settings\Temp\metadata81.htm

Page 4 of 9
10/23/2008file://C:\Documents and Settings\kjanssen\Local Settings\Temp\metadata81.htm

Page 5 of 9
10/23/2008file://C:\Documents and Settings\kjanssen\Local Settings\Temp\metadata81.htm

Page 6 of 9
10/23/2008file://C:\Documents and Settings\kjanssen\Local Settings\Temp\metadata81.htm

Page 7 of 9
10/23/2008file://C:\Documents and Settings\kjanssen\Local Settings\Temp\metadata81.htm

Page 8 of 9
10/23/2008file://C:\Documents and Settings\kjanssen\Local Settings\Temp\metadata81.htm

Page 9 of 9
10/23/2008file://C:\Documents and Settings\kjanssen\Local Settings\Temp\metadata81.htm

Summit Blue Consulting, LLC B-1
APPENDIX B: FIRST AND SECONDTIER WATER RIGHTS HOLDERS

Summit Blue Consulting, LLC B-2
Table B1. FirstTier Water Rights Holders in PacifiCorp Service Territory
N A M E O R BUSIN ESS N A M E
A NNU A L W A T E R RI G H T
A L L O C A T I O N* PRI O RI T Y
D A T E T YPE (acre-feet)
AGRICULTURAL USES
FARMERS IRRIGATION DISTRICT SW 21,719 12/5/1974
BAIC INC. SW 20,307 7/23/1971
SUBTOTAL -- 42,026 --
Total Agriculture Use Water Rights > 5,000 acre-feet -- 49,266 --
% of Total Share -- 85% --
INDUSTRIAL/MANU FACTURING USES
OCHOCO IRRIGATION DISTRICT SW 65,064 10/29/1982
PACIFIC POWER & LIGHT CO. SW 36,198 12/21/1905
PACIFIC POWER & LIGHT CO. SW 28,959 12/21/1905
WEYERHAEUSER CO. SW 22,877 6/18/1959
EDWARD HINES LUMBER CO. SW 17,520 9/30/1905
WILLAMETTE INDUSTRIES INC. SW 13,031 12/23/1954
OCHOCO IRRIGATION DISTRICT SW 10,844 3/13/1916
WILLAMETTE INDUSTRIES INC. ST 8,688 3/31/1910
MEDFORD IRRIGATION DISTRICT SW 7,800 11/23/1960
STAYTON CANNING CO. COOP SW 7,240 4/19/1946
SUBTOTAL -- 218,221 --
Total Industrial/Manufacturing Use Water Rights > 5,000 acre-feet
-- 224,881 --
% of Total Share -- 97% --
IRRIGATION (including Primary and Supplemental uses)
NORTH UNIT IRRIGATION DISTRICT SW 1,062,783 2/28/1913
KLAMATH DRAINAGE DISTRICT SW 347,837 4/25/1977
MEADOWS DRAINAGE DISTRICT SW 145,155 1/26/1910
BAIC INC. SW 104,155 5/23/1974
BAIC INC. SW 104,155 11/18/1976
SANTIAM WATER CONTROL DISTRICT SW 100,668 5/14/1909
DAVID VAN ESSEN SW 76,560 10/23/1992
EAGLE POINT IRRIGATION DISTRICT SW 65,722 4/21/1915
CROSS COUNTRY CANAL CO. SW 64,165 6/6/1935
MIDDLE FORK IRRIGATION DISTRICT SW 54,298 1/2/1962

Summit Blue Consulting, LLC B-3
N A M E O R BUSIN ESS N A M E
A NNU A L W A T E R RI G H T
A L L O C A T I O N* PRI O RI T Y
D A T E T YPE (acre-feet)
BAIC INC. SW 52,077 9/14/1971
BAIC INC. SW 52,077 9/14/1971
MEADOWS DRAINAGE DISTRICT SW 51,626 2/2/1955
FARMERS WATER DITCH CO. SW 50,917 5/5/1941
MEDFORD IRRIGATION DISTRICT SW 43,438 3/1/1915
DOBBIN DITCH CO. & ASSIGNEES SW 42,714 7/20/1915
TALENT IRRIGATION DISTRICT SW 39,818 7/31/1915
FARMERS WATER DITCH CO. SW 38,182 5/5/1941
ROGUE RIVER VALLEY IRRIGATION DISTRICT SW 36,198 6/24/1913
JNO M FENN SW 36,198 9/3/1912
SUBTOTAL -- 2,568,743 --
Total Irrigation Use Water Rights > 5,000 acre-feet -- 4,155,352 --
% of Total Share -- 62% --
MUNICIPAL USES
CITY OF MEDFORD SW 72,397 10/22/1954
CITY OF ADAIR VILLAGE SW 59,365 7/7/1971
CITY OF SALEM SW 44,886 N/A
CITY OF SALEM; BOISE CASCADE CORP. SW 39,818 N/A
CITY OF MEDFORD SW 29,683 5/28/1925
CITY OF COQUILLE SW 21,719 1/3/1949
CITY OF MEDFORD SW 21,719 8/21/1915
CITY OF MEDFORD SW 21,719 10/20/1923
CITY OF SALEM; PUBLIC WORKS GW 21,719 1/2/1958
CITY OF PORTLAND; BUREAU OF WATER WORKS GW 20,199 11/12/1976
CITY OF PORTLAND; BUREAU OF WATER WORKS GW 80,505 11/12/1976
CITY OF CORVALLIS SW 18,099 11/12/1948
CITY OF GRANTS PASS SW 18,099 7/19/1960
CITY OF GRANTS PASS SW 18,099 12/2/1965
CITY OF GRANTS PASS SW 18,099 1/13/1983
CITY OF STAYTON SW 18,099 5/13/1991
CITY OF ASTORIA SW 16,651 6/8/1925
CITY OF UMATILLA SW 16,651 10/5/1976
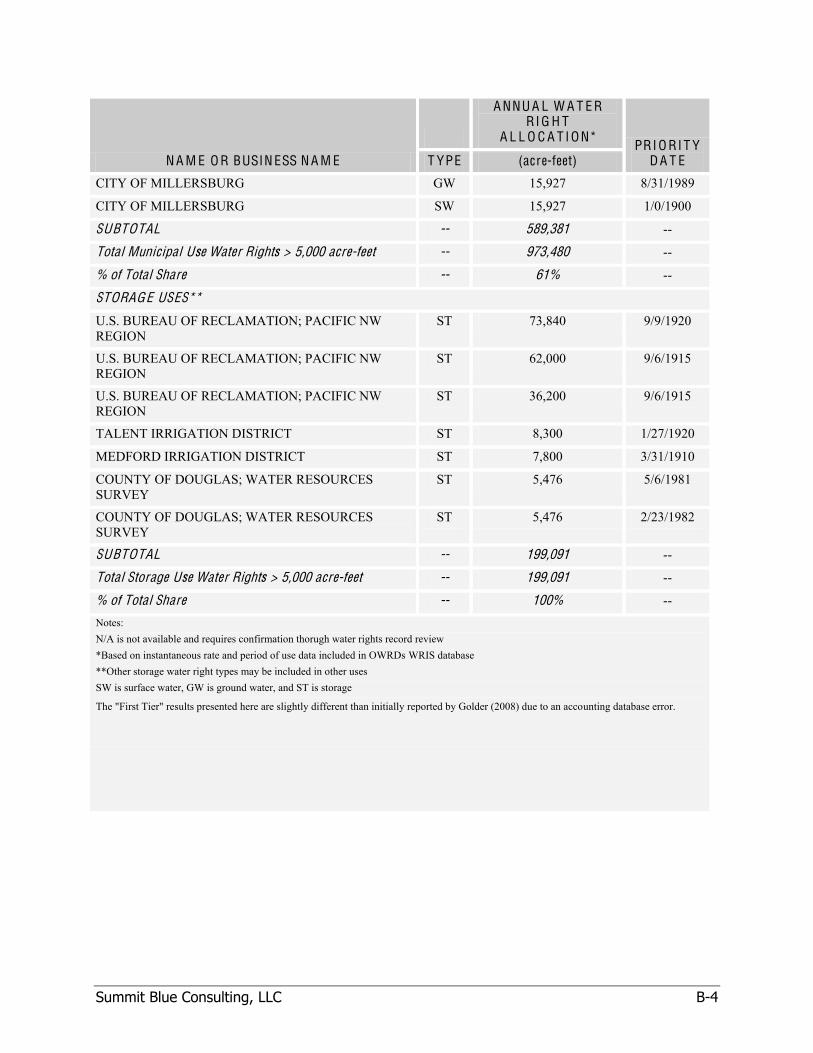
Summit Blue Consulting, LLC B-4
N A M E O R BUSIN ESS N A M E
A NNU A L W A T E R RI G H T
A L L O C A T I O N* PRI O RI T Y
D A T E T YPE (acre-feet)
CITY OF MILLERSBURG GW 15,927 8/31/1989
CITY OF MILLERSBURG SW 15,927 1/0/1900
SUBTOTAL -- 589,381 --
Total Municipal Use Water Rights > 5,000 acre-feet -- 973,480 --
% of Total Share -- 61% --
STORAGE USES**
U.S. BUREAU OF RECLAMATION; PACIFIC NW REGION
ST 73,840 9/9/1920
U.S. BUREAU OF RECLAMATION; PACIFIC NW REGION
ST 62,000 9/6/1915
U.S. BUREAU OF RECLAMATION; PACIFIC NW REGION
ST 36,200 9/6/1915
TALENT IRRIGATION DISTRICT ST 8,300 1/27/1920
MEDFORD IRRIGATION DISTRICT ST 7,800 3/31/1910
COUNTY OF DOUGLAS; WATER RESOURCES SURVEY
ST 5,476 5/6/1981
COUNTY OF DOUGLAS; WATER RESOURCES SURVEY
ST 5,476 2/23/1982
SUBTOTAL -- 199,091 --
Total Storage Use Water Rights > 5,000 acre-feet -- 199,091 --
% of Total Share -- 100% -- Notes: N/A is not available and requires confirmation thorugh water rights record review *Based on instantaneous rate and period of use data included in OWRDs WRIS database **Other storage water right types may be included in other uses SW is surface water, GW is ground water, and ST is storage
The "First Tier" results presented here are slightly different than initially reported by Golder (2008) due to an accounting database error.

Summit Blue Consulting, LLC B-5
Table B2. FirstTier Water Rights Holders in Portland General Electric Service Territory
N A M E O R BUSIN ESS N A M E
A NNU A L W A T E R
RI G H T A L L O C A T I O N* PRI O RI T Y
D A T E T YPE (acre-feet)
AGRICULTURAL USES
GLENN WALTERS NURSERY INC. SW 9,412 4/21/1995
GLENN WALTERS NURSERY INC. SW 5,806 4/21/1995
SUBTOTAL -- 15,218 --
Total Agriculture Use Water Rights > 5,000 acre-feet -- 15,218 --
% of Total Share -- 100% --
INDUSTRIAL/MANU FACTURING USES
TUALATIN VALLEY WATER DISTRICT SW 73,121 6/19/1973
BOISE CASCADE CORP. SW 47,058 12/30/1993
ATOCHEM NORTH AMERICA INC. SW 35,112 7/13/1990
OREGON STEEL MILLS SW 23,891 6/12/1968
SPAULDING PULP & PAPER CO. SW 14,262 6/28/1962
OREGON STEEL MILLS SW 9,774 11/18/1974
OREGON CITY LEASING CO. SW 8,688 2/24/1989
STAYTON CANNING CO. COOP SW 7,240 11/23/1960
PENNSYLVANIA SALT MANUFACTURING CO. OF WASHINGTON
SW 6,443 2/17/1941
STIMSON LUMBER CO. SW 5,792 4/1/1932
SUBTOTAL -- 231,380 --
Total Industrial/Manufacturing Use Water Rights > 5,000 acre-feet
-- 231,380 --
% of Total Share -- 100% --
IRRIGATION (including Primary and Supplemental uses)
MALLORIES DAIRY INC. SW 242,529 10/9/1991
DONALD OLSON SW 84,704 5/14/1947
PALMER CREEK WATER DISTRICT IMPROVEMENT CO.
SW 29,205 4/14/1967
PALMER CREEK WATER DISTRICT IMPROVEMENT CO.
SW 21,719 4/12/1988
TUALATIN VALLEY IRRIGATION DISTRICT SW 15,638 1/4/1984
RUFUS C HOLMAN SW 14,479 1/27/1927
J D DUBACK SW 13,249 7/29/1914
TELLELYN K PETERSON REVOCABLE TRUST SW 8,079 11/8/2004

Summit Blue Consulting, LLC B-6
N A M E O R BUSIN ESS N A M E
A NNU A L W A T E R
RI G H T A L L O C A T I O N* PRI O RI T Y
D A T E T YPE (acre-feet)
MOLALLA IRRIGATION CO. SW 6,561 12/8/1909
THOMAS E WITHYCOMBE SW 5,401 9/28/1967
ANDREW HANSEN SW 5,068 1/7/1927
A F HAYES SW 5,017 12/29/1928
SUBTOTAL -- 451,648 --
Total Irrigation Use Water Rights > 5,000 acre-feet -- 451,648 --
% of Total Share -- 100% --
MUNICIPAL USES
CITY OF PORTLAND; BUREAU OF WATER WORKS
SW 921,610 N/A
CITY OF PORTLAND; BUREAU OF WATER WORKS
SW 144,779 N/A
CITY OF PORTLAND; BUREAU OF WATER WORKS
GW 80,505 11/12/1976
TUALATIN VALLEY WATER DISTRICT SW 73,121 6/19/1973
OAK LODGE WATER DISTRICT SW 44,886 7/1/1970
CITY OF SAINT HELENS SW 43,438 11/8/1982
SOUTH FORK WATER COMMISSION SW 43,438 8/3/1953
CITY OF LAKE OSWEGO SW 36,198 3/14/1967
CITY OF HILLSBORO SW 31,131 2/6/1974
CITY OF PORTLAND; BUREAU OF WATER WORKS
GW 24,180 11/12/1976
CITY OF FOREST GROVE SW 23,891 4/28/1976
CITY OF PORTLAND; BUREAU OF WATER WORKS
SW 20,271 N/A
CITY OF PORTLAND; BUREAU OF WATER WORKS
GW 20,199 11/12/1976
CITY OF BEAVERTON SW 18,099 7/15/1980
CITY OF SANDY SW 18,099 4/28/1983
CLACKAMAS WATER DISTRICT SW 18,099 5/20/1968
PORT OF PORTLAND (GENERAL CORRESPONDENCE ONLY)
SW 15,754 11/18/1992
CITY OF OREGON CITY SW 14,479 1/16/1918
CITY OF OREGON CITY SW 14,479 8/11/1926
U.S. BUREAU OF RECLAMATION SW 14,479 2/20/1963
SUBTOTAL -- 1,621,136 --
Total Municipal Use Water Rights > 5,000 acre-feet -- 1,775,131 --

Summit Blue Consulting, LLC B-7
N A M E O R BUSIN ESS N A M E
A NNU A L W A T E R
RI G H T A L L O C A T I O N* PRI O RI T Y
D A T E T YPE (acre-feet)
% of Total Share -- 91% --
STORAGE USES**
EAST VALLEY WATER DISTRICT ST 14,000 8/27/1998
SUBTOTAL -- 14,000 --
Total Storage Use Water Rights > 5,000 acre-feet -- 14,000 --
% of Total Share -- 100% -- Notes: N/A is not available and requires confirmation thorugh water rights record review *Based on instantaneous rate and period of use data included in OWRDs WRIS database **Other storage water right types may be included in other uses SW is surface water, GW is ground water, and ST is storage The "First Tier" results presented here are slightly different than initially reported by Golder (2008) due to an accounting database error.
Table B3. SecondTier Water Rights Holders in PacifiCorp Service Territory
N A M E O R BUSIN ESS N A M E
A NNU A L W A T E R RI G H T
A L L O C A T I O N* PRI O RI T Y
D A T E T YPE (acre-feet)
AGRICULTURAL USES
FARMERS IRRIGATION DISTRICT SW 21,719 12/5/1974
BAIC INC. SW 20,307 7/23/1971
INDUSTRIAL/MANU FACTURING USES
PACIFIC POWER & LIGHT CO. SW 36,198 12/21/1905
PACIFIC POWER & LIGHT CO. SW 28,959 12/21/1905
WEYERHAEUSER CO. SW 22,877 6/18/1959
EDWARD HINES LUMBER CO. SW 17,520 9/30/1905
WILLAMETTE INDUSTRIES INC. SW 13,031 12/23/1954
OCHOCO IRRIGATION DISTRICT SW 10,844 3/13/1916
MEDFORD IRRIGATION DISTRICT SW 7,800 11/23/1960
IRRIGATION (including Primary and Supplemental uses)
NORTH UNIT IRRIGATION DISTRICT SW 1,062,783 2/28/1913
KLAMATH DRAINAGE DISTRICT SW 347,837 4/25/1977
MEADOWS DRAINAGE DISTRICT SW 145,155 1/26/1910
BAIC INC. SW 104,155 5/23/1974

Summit Blue Consulting, LLC B-8
N A M E O R BUSIN ESS N A M E
A NNU A L W A T E R RI G H T
A L L O C A T I O N* PRI O RI T Y
D A T E T YPE (acre-feet)
BAIC INC. SW 104,155 11/18/1976
SANTIAM WATER CONTROL DISTRICT SW 100,668 5/14/1909
EAGLE POINT IRRIGATION DISTRICT SW 65,722 4/21/1915
CROSS COUNTRY CANAL CO. SW 64,165 6/6/1935
MIDDLE FORK IRRIGATION DISTRICT SW 54,298 1/2/1962
BAIC INC. SW 52,077 9/14/1971
BAIC INC. SW 52,077 9/14/1971
MEADOWS DRAINAGE DISTRICT SW 51,626 2/2/1955
FARMERS WATER DITCH CO. SW 50,917 5/5/1941
MEDFORD IRRIGATION DISTRICT SW 43,438 3/1/1915
DOBBIN DITCH CO. & ASSIGNEES SW 42,714 7/20/1915
TALENT IRRIGATION DISTRICT SW 39,818 7/31/1915
FARMERS WATER DITCH CO. SW 38,182 5/5/1941
ROGUE RIVER VALLEY IRRIGATION DISTRICT SW 36,198 6/24/1913
JNO M FENN SW 36,198 9/3/1912
MUNICIPAL USES
CITY OF MEDFORD SW 72,397 10/22/1954
CITY OF ADAIR VILLAGE SW 59,365 7/7/1971
CITY OF SALEM SW 44,886 N/A
CITY OF SALEM; BOISE CASCADE CORP. SW 39,818 N/A
CITY OF MEDFORD SW 29,683 5/28/1925
CITY OF COQUILLE SW 21,719 1/3/1949
CITY OF MEDFORD SW 21,719 8/21/1915
CITY OF MEDFORD SW 21,719 10/20/1923
CITY OF SALEM; PUBLIC WORKS GW 21,719 1/2/1958
CITY OF PORTLAND; BUREAU OF WATER WORKS GW 20,199 11/12/1976
CITY OF PORTLAND; BUREAU OF WATER WORKS GW 80,505 11/12/1976
CITY OF CORVALLIS SW 18,099 11/12/1948
CITY OF GRANTS PASS SW 18,099 7/19/1960
CITY OF GRANTS PASS SW 18,099 12/2/1965
CITY OF GRANTS PASS SW 18,099 1/13/1983
CITY OF STAYTON SW 18,099 5/13/1991
CITY OF ASTORIA SW 16,651 6/8/1925
CITY OF UMATILLA SW 16,651 10/5/1976

Summit Blue Consulting, LLC B-9
N A M E O R BUSIN ESS N A M E
A NNU A L W A T E R RI G H T
A L L O C A T I O N* PRI O RI T Y
D A T E T YPE (acre-feet)
CITY OF MILLERSBURG GW 15,927 8/31/1989
CITY OF MILLERSBURG SW 15,927 1/0/1900
STORAGE USES**
U.S. BUREAU OF RECLAMATION; PACIFIC NW REGION
ST 73,840 9/9/1920
U.S. BUREAU OF RECLAMATION; PACIFIC NW REGION
ST 62,000 9/6/1915
U.S. BUREAU OF RECLAMATION; PACIFIC NW REGION
ST 36,200 9/6/1915
TALENT IRRIGATION DISTRICT ST 8,300 1/27/1920
MEDFORD IRRIGATION DISTRICT ST 7,800 3/31/1910
COUNTY OF DOUGLAS; WATER RESOURCES SURVEY
ST 5,476 5/6/1981
COUNTY OF DOUGLAS; WATER RESOURCES SURVEY
ST 5,476 2/23/1982
Notes: N/A is not available and requires confirmation thorugh water rights record review *Based on instantaneous rate and period of use data included in OWRDs WRIS database **Other storage water right types may be included in other uses SW is surface water, GW is ground water, and ST is storage
Table B4. SecondTier Water Rights Holders in Portland General Electric Service Territory
N A M E O R BUSIN ESS N A M E
A NNU A L W A T E R RI G H T
A L L O C A T I O N* PRI O RI T Y D A T E T YPE (acre-feet)
INDUSTRIAL/MANU FACTURING USES
TUALATIN VALLEY WATER DISTRICT SW 73,121 6/19/1973
OREGON STEEL MILLS SW 23,891 6/12/1968
SPAULDING PULP & PAPER CO. SW 14,262 6/28/1962
IRRIGATION (including Primary and Supplemental uses)
DONALD OLSON SW 84,704 5/14/1947
PALMER CREEK WATER DISTRICT IMPROVEMENT CO.
SW 29,205 4/14/1967
TUALATIN VALLEY IRRIGATION DISTRICT SW 15,638 1/4/1984
MUNICIPAL USES

Summit Blue Consulting, LLC B-10
N A M E O R BUSIN ESS N A M E
A NNU A L W A T E R RI G H T
A L L O C A T I O N* PRI O RI T Y D A T E T YPE (acre-feet)
CITY OF PORTLAND; BUREAU OF WATER WORKS
SW 921,610 N/A
TUALATIN VALLEY WATER DISTRICT SW 73,121 6/19/1973
OAK LODGE WATER DISTRICT SW 44,886 7/1/1970
CITY OF SAINT HELENS SW 43,438 11/8/1982
SOUTH FORK WATER COMMISSION SW 43,438 8/3/1953
CITY OF LAKE OSWEGO SW 36,198 3/14/1967
CITY OF HILLSBORO SW 31,131 2/6/1974
CITY OF PORTLAND; BUREAU OF WATER WORKS
GW 24,180 11/12/1976
CITY OF FOREST GROVE SW 23,891 4/28/1976
CITY OF PORTLAND; BUREAU OF WATER WORKS
GW 20,199 11/12/1976
CITY OF BEAVERTON SW 18,099 7/15/1980
CITY OF SANDY SW 18,099 4/28/1983
CLACKAMAS WATER DISTRICT SW 18,099 5/20/1968
CITY OF OREGON CITY SW 14,479 1/16/1918
CITY OF OREGON CITY SW 14,479 8/11/1926
U.S. BUREAU OF RECLAMATION SW 14,479 2/20/1963
STORAGE USES**
EAST VALLEY WATER DISTRICT ST 14,000 8/27/1998 Notes: N/A is not available and requires confirmation thorugh water rights record review *Based on instantaneous rate and period of use data included in OWRDs WRIS database **Other storage water right types may be included in other uses SW is surface water, GW is ground water, and ST is storage

Summit Blue Consulting, LLC C-1
APPENDIX C: SURVEY FOR SECOND TIER WATER RIGHTS HOLDERS

Energy Trust of Oregon ∙ 851 SW Sixth Avenue ∙ Suite 1200 ∙ Portland, OR 97204
Survey for Large Water Rights Holders
Directions: Where options are provided, please circle the answer that best fits your organization’s situation. Where blanks are provided, please fill in the answers that are most appropriate.
Participant Characterization 1. Please provide some information about yourself:
Your name __________________________
Your title ___________________________
Name of the organization you represent _______________________________________
2. How large is your organization’s annual water right characterization? > 250,000 acre‐feet 100,000‐249,999 acre‐feet 50,000‐99,999 acre‐feet 25,000‐49,999 acre‐feet 10,000‐24,999 acre‐feet 5,000‐9,999 acre‐feet < 4,999 acre‐feet
3. Which of these designations best fits your organization?
Agriculture/Irrigation Industrial/Manufacturing Municipality Other government organization Other (Please describe) ________________________________
Technical Questions for Storage Facilities 4. Do you or your organization own and maintain a water storage facility that holds greater that 0.5
million gallons (1.5 acre feet) of water? Yes, we have a tank. Yes, we have an open reservoir or pond. Yes, we maintain both tanks and reservoirs. No (If no, please skip to question #13.)

Energy Trust of Oregon ∙ 851 SW Sixth Avenue ∙ Suite 1200 ∙ Portland, OR 97204
5. What is the total holding capacity the largest facility that you maintain? Greater than 5000 acre ft. (approx. 1.6 billion gallons) Between 1000 and 5000 acre ft. (approx. 326 million – 1.6 billion gallons) Between 100 and 1000 acre ft. (approx. 32.6 million – 326 million gallons) Between 10 and 100 acre ft. (approx. 3.3 million – 32.6 million gallons) Between 3 and 10 acre ft. (approx. 1 million – 3.3 million gallons) Less than 3 acre ft. (approx. 1 million gallons) Not applicable
6. If you own multiple water storage facilities, how many additional facilities do you maintain in total?
More than 10 Between 6 and 10 Between 3 and 5 2 Not applicable
7. If you own multiple facilities, what is the average storage capacity of the group?
Greater than 5000 acre ft. (approx. 1.6 billion gallons) Between 1000 and 5000 acre ft. (approx. 326 million – 1.6 billion gallons) Between 100 and 1000 acre ft. (approx. 32.6 million – 326 million gallons) Between 10 and 100 acre ft. (approx. 3.3 million – 32.6 million gallons) Between 3 and 10 acre ft. (approx. 1 million – 3.3 million gallons) Less than 3 acre ft. (approx. 1 million gallons) Not applicable
8. Getting back to your largest storage facility, by your estimate, what is the maximum difference in
head (feet of drop) between your largest storage facility and its corresponding distribution zone or irrigation outlet? High head: greater than 300 feet Medium head: 100 – 300 feet Low head: 10 – 100 feet Very low head: Less than 10 feet No drop, just storage that must be pumped. Not applicable
9. What is the average flow rate through the reach with the maximum head difference?
Greater than 10,000 gpm (approx. 1337 cfs) Between 5,000 and 10,000 gpm (approx. 668‐1337 cfs) Between 1,000 and 5,000 gpm (approx. 134‐668 cfs) Between 500 and 1,000 gpm (approx. 67‐134 cfs) Less than 500 gpm (approx. 77 cfs) Not applicable

Energy Trust of Oregon ∙ 851 SW Sixth Avenue ∙ Suite 1200 ∙ Portland, OR 97204
10. Are all of your storage‐related water rights certificated? Yes No Not applicable
11. If no, when do you anticipate your storage‐related water rights to be perfected?
Greater than 20 years Between 11 and 20 years Between 6 and 10 years Between 1 and 5 years Less than 1 year Not applicable
12. The closer a site is to distribution lines the less costly it will be to transmit electricity. By your
estimate, what is the distance from your storage facility to the nearest known distribution line? Greater than 50 miles Between 25 and 50 miles Between 5 and 25 miles Between 1 and 5 miles Less than 1 mile Don’t know Not applicable
Technical Issues for open channel flow, ditch flow, or waste water discharge 13. Do you or your organization discharge waste water from a municipal or industrial facility or own and
maintain canals or ditches that deliver or discharge water under gravity flow? Yes, we have a municipal waste water discharge. Yes, we have an industrial waste water discharge. Yes, we maintain canals and/or ditch systems to deliver water to end users. No, we do not discharge waste water or maintain canals or ditch systems. (If no, please skip to
question #21.) 14. By your estimate at what rate, does the discharge or ditch/canal run?
Greater than 10,000 gpm (approx. 1337 cfs) Between 5,000 and 10,000 gpm (approx. 668‐1337 cfs) Between 1,000 and 5,000 gpm (approx. 134‐668 cfs) Between 500 and 1,000 gpm (approx. 67‐134 cfs) Less than 500 gpm (approx. 77 cfs) Not applicable

Energy Trust of Oregon ∙ 851 SW Sixth Avenue ∙ Suite 1200 ∙ Portland, OR 97204
15. If your system includes multiple locations of open channel flow how many additional location do you think you might have that include and significant drop in elevation (i.e. more than 10 feet)? More than 10 Between 6 and 10 Between 3 and 5 2 Not applicable
16. By your estimate, what is the maximum difference in head (feet of drop) at the locations you’re
have counted in question #0? High head: greater than 300 feet Medium head: 100 – 300 feet Low head: 10 – 100 feet Very low head: Less than 10 feet Not applicable
17. What is the average flow rate through the reach with the maximum head difference?
Greater than 10,000 gpm (approx. 1337 cfs) Between 5,000 and 10,000 gpm (approx. 668‐1337 cfs) Between 1,000 and 5,000 gpm (approx. 134‐668 cfs) Between 500 and 1,000 gpm (approx. 67‐134 cfs) Less than 500 gpm (approx. 77 cfs) Not applicable
18. Are all of your water rights associated with open channel flow, ditch flow, or waste water discharge
certificated? Yes No Not applicable
19. If no, when do you anticipate your water rights associated with open channel flow, ditch flow, or
waste water discharge to be perfected? Greater than 20 years Between 11 and 20 years Between 6 and 10 years Between 1 and 5 years Less than 1 year Not applicable
Energy Trust of Oregon ∙ 851 SW Sixth Avenue ∙ Suite 1200 ∙ Portland, OR 97204
20. The closer a site is to distribution lines the less costly it will be to transmit electricity. By your estimate, what is the distance from your open channel flow, ditch flow, or waste water discharge to the nearest known distribution line? Greater than 50 miles Between 25 and 49 miles Between 5 and 24 miles Between 1 and 4 miles Less than 1 mile Don’t know Not applicable
Project Development Issues 21. Has your organization conducted a feasibility study for a small hydro project (i.e., development of
hydroelectric power with generating capacities less than or equal to 100 theoretical horsepower that could serve small communities or facilities) in the last five years? Yes, with Energy Trust’s assistance/funding Yes, without Energy Trust’s assistance or funding No
22. Which entities in your organization would be involved in approving funds/staff resources needed to
deploy a small hydropower project (e.g., board, city council, commissioners, budget committee)? __________________________________________________________________________________ __________________________________________________________________________________ _________________________________________________________________________________
23. By your estimate, how long would the budget approval process take? More than 2 years 13‐24 months 6‐12 months < 6 months
24. Does your organization already own and/or operate a hydropower facility? Own Operate Own and Operate No
25. Is someone in your organization experienced with hydropower project development in any of the
following capacities? (Please circle as many answers as appropriate.) Yes, in a construction capacity Yes, in a financial capacity Yes, in a legal capacity Yes, in an engineering capacity

Energy Trust of Oregon ∙ 851 SW Sixth Avenue ∙ Suite 1200 ∙ Portland, OR 97204
No
26. Would your organization have the labor and experience needed to develop and/or manage a small hydropower project? Yes, we could develop and operate Yes, we could develop Yes, we could operate No
27. If your organization is lacking resources to develop and/or manage such a project, which resources
are needed: Labor (time) Financial knowledge Technical knowledge Legal knowledge Other: ___________________________
28. Rank your level of familiarity with the financial incentives for small hydropower projects that are
available through the Business Energy Tax Credit (BETC)? 1 = not very aware, and 5 = very aware 1 2 3 4 5
29. Rank your level of familiarity with each of the financial incentives and technical assistance options for small hydropower projects that are available through the Energy Trust of Oregon, as listed below: 1 = not very aware and 5 = very aware Financial assistance for feasibility studies (50% of total project costs, up to $30,000)
1 2 3 4 5
Technical assistance during the project development stage 1 2 3 4 5
Financial assistance for project installation (amounts vary) 1 2 3 4 5
30. From your standpoint, what would be your organization’s general receptivity to a small hydro project? Very receptive Somewhat receptive Not very receptive Not at all receptive I don’t know
When complete, please return to Bob Long at Golder Associates in the self‐addressed stamped
envelope provided. Responses may also be sent to Betsy Kauffman’s attention at the address below.

Energy Trust of Oregon ∙ 851 SW Sixth Avenue ∙ Suite 1200 ∙ Portland, OR 97204
Energy Trust of Oregon extends its thanks to Golder Associates for assisting in this data collection effort and to you for participating in the survey!
Summit Blue Consulting, LLC D-1
APPENDIX D: SUPPLEMENTAL TECHNOLOGY INFORMATION

SMALL HYDRO TECHNOLOGY REVIEW – DRAFT
Submitted To:
Energy Trust of Oregon
November 17, 2008

Submitted to: Betsy Kauffman and Jed Jorgensen Energy Trust of Oregon 851 SW Sixth Avenue, Suite 1200 Portland, Oregon 97204 Submitted by: Summit Blue Consulting, LLC 1722 14th Street, Ste. 230 Boulder, CO 80302 720.564.1130 Prepared by: Jane Pater 720.564.1130 @summitblue.com
Patricia Thompson 925.935.0270 @summitblue.com

Summit Blue Consulting, LLC i
TABLE OF CONTENTS 1 Micro Hydro Low Head Solutions ....................................................................... 1
1.1 Water Wheels................................................................................................ 3
2 Technology-Specific Installations ...................................................................... 5
2.1 Pressure Reducing Valves ............................................................................... 5
2.2 Incremental Hydro Installations ...................................................................... 7
2.2.1 Haas-Kings River Hydroelectric Project .................................................. 7
2.2.2 Lawrence Hydroelectric Project ............................................................ 7
2.2.3 Other Improvement Projects ................................................................ 8
3 New Product Offerings for Low-Head Hydro Applications ................................. 9

Draft – For Internal Discussion Only
Summit Blue Consulting, LLC 1
1 MICRO HYDRO LOW HEAD SOLUTIONS To make smaller low head sites more cost-effective, manufacturers of propeller-type turbines have come up with a range of different methods for implementing their turbines to suit the site conditions while keeping costs down. The basic components are always the same: an intake, a set of guide vanes, a runner, and a draft tube. Five options are most widely used:
1. Tube turbines: A tube turbine is a propeller machine in which the tube surrounding the propeller has an “elbow” put into it so that the shaft of the runner can be brought out to mate up with the speed-increaser and generator. The choice of layout of a tube turbine is dictated by the existing site conditions, the available head, and, most importantly, the ratio of the head to the rotor diameter.
A special case of the tube turbine is the siphon turbine. This is worthy of special mention because of its suitability for ultra-low head sites. The specific advantages are as follows:
! The siphon creates extra height in which to fit the turbine so excavation and civil works are reduced. Without excavation requirements, the design becomes applicable for installing onto (rather than in place of) existing civil structures such as weirs or sluices.
! System shutdown can be affected simply by breaking the siphon, so no intake gate is required, which is a significant cost-saving measure.
! Both turbine and generator can be above upstream water level for ease of inspection and maintenance, and there is no need for a draft tube gate.
! Turbine and draft tube can be supplied as a complete, precision unit assembled in the factory for rapid installation (or removal) on site, and not embedded deep in the civil works.
A key disadvantage to the siphon turbine is that, with its greater elevation, the system will have a greater visual impact and, thus, extra sound-proofing may be required to ensure that noise disturbance is minimized.

Draft – For Internal Discussion Only
Summit Blue Consulting, LLC 2
Figure 1. Siphon Turbine in Italy
Source: Ian Bacon and Ian Davison, Low Head Hydro Power in the South-East of England –A Review of the Resource and Associated Technical, Environmental and Socio-Economic Issues. (2004)
2. Open flume turbines: An open flume turbine is one in which there is no intake section narrowing down to feed the flow into the turbine. Instead the guide-vanes sit in a large open chamber. This arrangement is usually most suited to replacing old open-flume Francis machines in existing mill structures.
3. Pit Kaplan (right-angle drive): The Pit-Kaplan was originally devised as a low-cost alternative to the bulb turbine. In this arrangement, the shaft of the runner passes into a sealed pit, which runs from the base of the intake up into the powerhouse. The flow passes either side of the pit to reach the guide-vanes and runner. The pit itself contains a right-angle drive gearbox from which a vertical shaft ascends into the powerhouse to drive the generator. The pit-Kaplan has been used in recent low-head schemes in Germany.
4. Submersible turbines (mini-bulb turbines): Mini-bulb turbines are now available in which the generator is submerged in a small water-tight bulb. With this concept, there is no need for a powerhouse above the turbine, the generator automatically receives water cooling, and the visual and noise impacts of the scheme are greatly reduced.
5. Pico Hydro: Various solutions are available for pico hydro (up to 5 kW) applications. For example, Ampair1
1Ampair. “Ampair Water Powered Generators.” Available:
makes a submersible pico-hydro (100W) turbine called the Underwater. This is a rugged, permanent magnet, low-speed, high-output alternator, sealed in an oil-filled waterproof housing. It can be used in tidal races, in tidal mill streams, and in any fast-flowing water which will cover the turbine. Multiple units can be installed to increase generated power.
www.ampair.com/ampair/waterpower.asp

Draft – For Internal Discussion Only
Summit Blue Consulting, LLC 3
Figure 2. Pico Hydro Submersible Turbine (left), and Submersible Bulb Turbine (Waterpumps Oy, Finland)
Sources: Ampair: www.ampair.com/ampair/waterpower.asp and Ian Bacon and Ian Davison, Low Head Hydro Power in the South-East of England –A Review of the Resource and Associated Technical, Environmental and Socio-Economic Issues. (2004)
1.1 Water Wheels The waterwheel is one of the oldest forms of renewable energy. Prior to the mid-eighteenth century, few waterwheels were designed according to scientific principles; thus, they had low efficiencies. Today, waterwheel technology is experiencing a renaissance due to a desire to utilize lower heads with better project economics.
There are two types of waterwheels:
! Overshot wheels: The water is fed into the wheel from the top into buckets or “cells” and then released at the lowest possible elevation.
! Undershot wheels: the water is fed into the wheel from a height that is below the wheel axis.
German companies are at the forefront of this technology. Hydrowatt Ltd. has built 16 wheels over the last decade. Installed head heights have ranged from 2.1m to 4.4 m, and they have been utilized to generate electrical outputs ranging from 10 kW to 55 kW. Efficiencies are around 60%, which is lower than the 70%–80% that is typical of conventional turbines. However, operation time at nominal capacity can be expected to be longer for waterwheels than the normal 6,000 hours for conventional turbines. Capacity costs for waterwheels are around 33% – 66% of a comparable size Kaplan turbine installation. Finally, waterwheels, due to their low speed of operation, are considered to be fish-friendly and do not create vibration or noise problems.
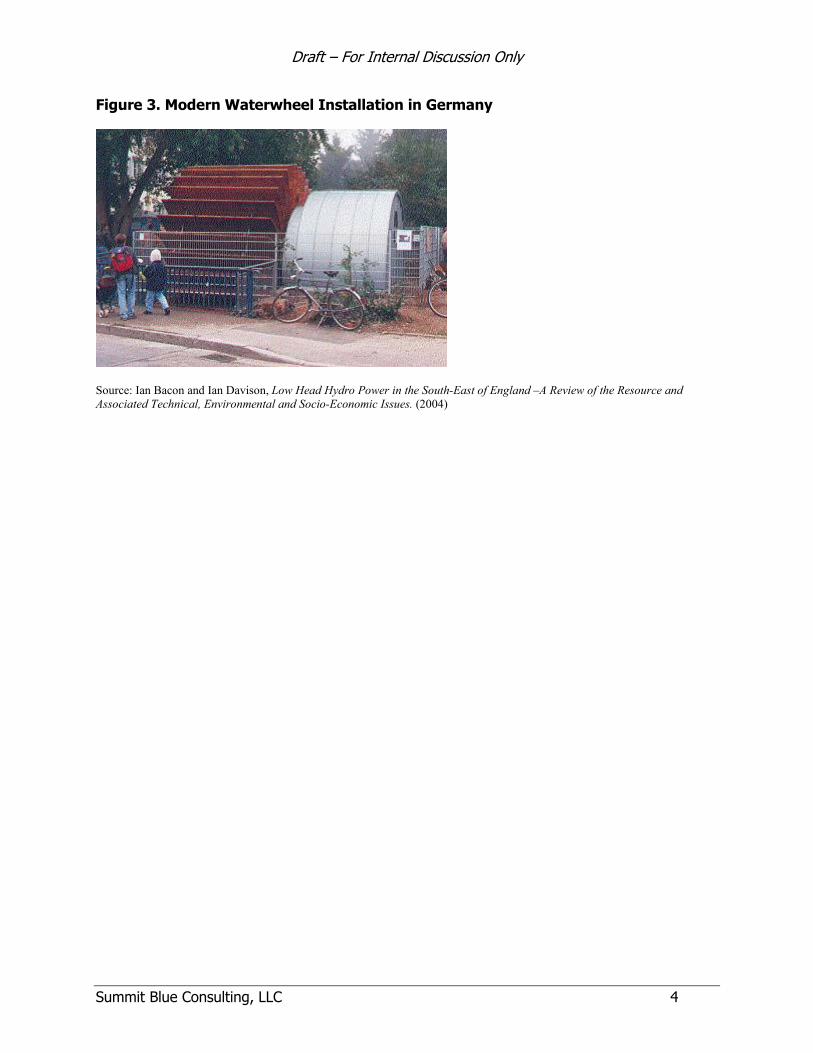
Draft – For Internal Discussion Only
Summit Blue Consulting, LLC 4
Figure 3. Modern Waterwheel Installation in Germany
Source: Ian Bacon and Ian Davison, Low Head Hydro Power in the South-East of England –A Review of the Resource and Associated Technical, Environmental and Socio-Economic Issues. (2004)

Draft – For Internal Discussion Only
Summit Blue Consulting, LLC 5
2 TECHNOLOGY-SPECIFIC INSTALLATIONS To provide some background
2.1 Pressure Reducing Valves There are several hydro technologies that have been developed specifically for man-made water conduits – canals, irrigation ditches, aqueducts, pipelines – both open and closed, or have been adapted for this type of hydro resource.
Pacific Hydro (Australia)
Pacific Hydro2
Table 3
recognized the powerful flows of water released for irrigation purposes from the Mulwala Canal (an irrigation channel) as an untapped source of hydro power. As Australia's first hydroelectric project built on an irrigation channel, the project is now generating clean, renewable energy without affecting the water flow. The 2.5 MW Drop Hydro project was constructed on the site and began generating power in November 2002. The project now generates about 11,000MWh of energy each year. Construction of the Drop Hydro plant also provided considerable benefits to the local economy including investment and job creation, with up to 30 people employed on the site. Details of the project are included in .
2Pacific Hydro Limited, “The Drop Hydro,” www.pacifichydro.com.au/OurEnergy/HydroPower/TheDropHydro/tabid/125/Default.aspx
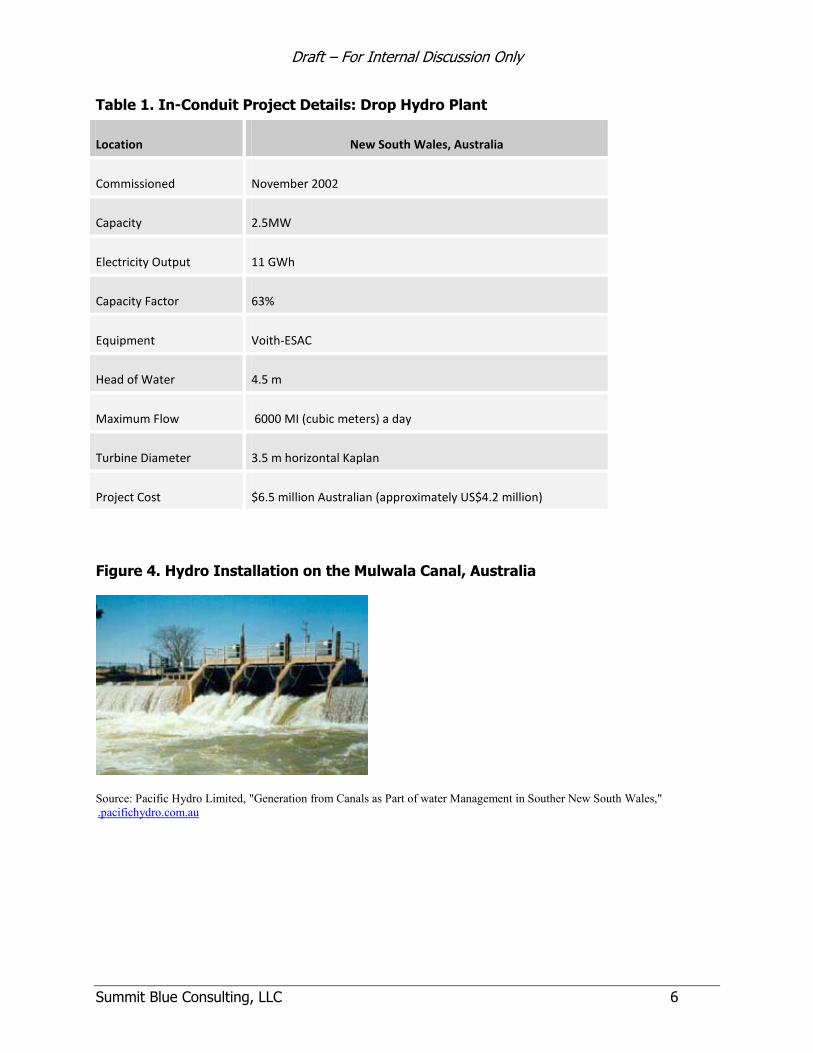
Draft – For Internal Discussion Only
Summit Blue Consulting, LLC 6
Table 1. In-Conduit Project Details: Drop Hydro Plant
Location New South Wales, Australia
Commissioned November 2002
Capacity 2.5MW
Electricity Output 11 GWh
Capacity Factor 63%
Equipment Voith‐ESAC
Head of Water 4.5 m
Maximum Flow 6000 MI (cubic meters) a day
Turbine Diameter 3.5 m horizontal Kaplan
Project Cost $6.5 million Australian (approximately US$4.2 million)
Figure 4. Hydro Installation on the Mulwala Canal, Australia
Source: Pacific Hydro Limited, "Generation from Canals as Part of water Management in Souther New South Wales," .pacifichydro.com.au

Draft – For Internal Discussion Only
Summit Blue Consulting, LLC 7
Rancho Peñasquitos Pressure Control and Hydroelectric Facility (San Diego County Water Authority)
The Pressure Control and Hydroelectric Facility (PCHF)3
2.2 Incremental Hydro Installations
serves an important function in improving aqueduct operations and enhancing the flexibility of the Water Authority’s extensive water delivery system. Several large diameter valves within the facility control water pressure and the amount of water delivered to surface water storage reservoirs and water filtration plants. A hydroelectric turbine generates supplemental electricity.
The project provides two great benefits to the region: improved pipeline operations and hydroelectric energy generation. Construction on the $21 million facility began in August 2004 and took approximately 28 months to complete. The high-pressure flows in Pipeline 5 provide an opportunity to generate a clean renewable energy resource for San Diego County. The 4.5 MW turbine generator in the facility operates year-round, reducing the Water Authority’s energy costs while supplying the surplus power to the region.
Sites that already host hydro facilities can often be improved by increasing the efficiency of the site or by adding additional capacity (for under-developed sites). This type of development is often very cost-effective as civil engineering and interconnect expenses are minimal relative to the amount of generation added.
2.2.1 Haas-Kings River Hydroelectric Project4
The Haas-Kings River hydroelectric project is a 193 MW project located on the North Fork Kings River (NFKR) near the town of Clovis, in Fresno County, California. At the Kings River Powerhouse, on April 27, 2006 Pacific Gas and Electric Company (PG&E) completed and placed into service a new set of wicket gates, facing plates and wicket gate stem bushings. In addition, the new facing plates were line bored and the turbine was refurbished. Combined with improvements at the Haas powerhouse, the improvements raised annual generation from 723,156 GWh to 750,630 GWh, giving an overall increase in generation of 3.80%.
2.2.2 Lawrence Hydroelectric Project5
The Lawrence Hydroelectric Project is a 16.8 MW run-of-river facility located on the Merrimack River in Lawrence, Massachusetts. The major project features include a stone masonry dam constructed in 1848, known as the "Essex Dam" or "Great Stone Dam," and a powerhouse containing two identical 8.4 MW horizontal Kaplan bulb turbine-generator units, each with a rated hydraulic capacity of 4,000 CFS. The Essex Dam's 900 foot long overflow spillway has historically been topped by five foot high wooden flashboards supported by steel pins, raising the normal head pond elevation to 44.17 feet NGVD.
3 San Diego County Water Authority, ‘Rancho Pensaquitos Pressure Control and Hydroelectric Facility.” www.sdcwa.org/infra/cip-PCHF.phtml 4 Soneda, Alan (Pacific Gas and Electric) letter to Honorable Kimberly Bose, Federal Energy Regulatory Commission [Washington, D.C.] October 13, 2008. Regarding Haas-Kings River Hydroelectric Project (FERC No. 1988). 5 Webb, Kevin (Essex Company) letter to to Honorable Kimberly Bose, Federal Energy Regulatory Commission [Washington, D.C.] September 26, 2008. Regarding Lawrence Hydroelectric Project (FERC No. 2800-MA).

Draft – For Internal Discussion Only
Summit Blue Consulting, LLC 8
The existing five foot high wooden flashboards on the Essex Dam are being replaced with an inflatable crest gate system of equal height. One of the primary advantages of an inflatable crest gate system over a traditional pin-supported wooden flashboard system is that a crest gate system provides a greater degree of control over impoundment water levels, allowing optimization of the project head over a wider range of flow conditions and events.
The inflatable crest gate system on the Essex Dam will allow the project to maintain consistent headpond elevation and head conditions over a wider range of flows, and will eliminate the need to draw down the impoundment for flashboard repairs. Gains in project energy production will, thus, be realized by maintaining the impoundment water level at full head during the period following a high flow event. The Obermeyer6
2.2.3 Other Improvement Projects
crest gate system installed at the Lawrence Project will be equipped with an automatic pond level control system, which will work in conjunction with the unit control system to optimize the project's head conditions and energy production. A model of the improvements predicts a 6.7% increase in generation at the site due to the inflatable gates.
A summary of other improvement projects that filed requests for certification of renewable energy production tax credits recently is given in Table 4. Under the Energy Policy Act 2005, additional electricity generated from an existing hydropower project is eligible to receive renewable energy tax credits, also known as production tax credits (PTC), if such addition is achieved by improving efficiency or by adding capacity. However, the increment must first be approved by FERC.
Table 2. Recent Hydro Improvement Projects
Company Project Improvements Increase in Generation
Erie Boulevard Hydropower7
Hudson River Hydroelectric Project
Upgrading of existing turbines and addition of new turbines, increasing capacity from 28.8 MW to 29.6 MW.
12.9%.
FPL Energy8 Gulf Island - Deer Rips Hydroelectric Project
Replace turbine runner and rewind generator. Increase capacity by3.2 MW to 25.2 MW.
4.05%
Pacificorp Energy
Cutler Hydroelectric Project
Replace turbine runner. 4.5%
6 Obermeyer Hydro, “Information,” Available: www.obermeyerhydro.com/info.htm. 7 Verville, Sarah A. (Pierce Atwood) letter to Honorable Kimberly Bose, Federal Energy Regulatory Commission [Washington, D.C.] September 29, 2008. Regarding Hudson River Hydroelectric Project (FERC No. P-2482). 8 Wiley, F. Allen (FPL Maine Energy Hydro) letter to Honorable Kimberly Bose, Federal Energy Regulatory Commission [Washington, D.C.] October 21, 2008. Regarding Gulf Island-Deer Rips Hydroelectric Project (FERC No. 2283).

Draft – For Internal Discussion Only
Summit Blue Consulting, LLC 9
3 NEW PRODUCT OFFERINGS FOR LOW-HEAD
HYDRO APPLICATIONS Low-head hydro applications pose some of the most robust challenges to environmental issues and to development of a project that is economically feasible. Innovations in this technology space typically seek to address one of these two issues. In the case of environmental issues, low head sites are more likely than high head sites to include fish habitat; innovations attempt to maintain the fish habitat while still retaining sufficient flow to generate electricity. In the case of economic viability, low-head hydro projects must minimize the amount of civil works necessary for a functioning system in order to keep costs low; new products typically seek new ways to achieve this.
Variable Speed Operation of a New Very Low Head Hydro Turbine with Low Environmental Impact
A new way to use very low head sites was developed by French and Canadian engineers, and is described in a paper given at the 2007 IEEE Canada Electrical Power Conference.9
Figure 10
The concept is to have an Integrated Generating Set built around a large Kaplan runner, directly coupled to the generator, the trash rack, and the trash rack cleaner, all integrated in one block and installed in the sluice passage of existing dams. The turbine generating set has a fixed distributer but is still double-regulated (adjustable blades and variable speed). shows the differences between a vertical siphon Kaplan, a bulb turbine, and the very low head design.
In variable speed mode, as the head changes, the turbine operating speed is changed accordingly, allowing the power plant to be kept running at a fair efficiency. When the head changes, a corresponding speed set point is calculated in order to keep the operating efficiency at the highest level attainable. The water level is measured by upstream and downstream level sensors. The variable speed operation gives several advantages over traditional fixed speed Kaplan turbines: very smooth operation, high regulation performance and power stability, easy and robust integration with the grid, and the possibility of using the turbine for off-grid applications.
The turbine is designed for very low head sites (1.4 m to 3.4 m). The Kaplan turbine has been designed to keep civil work and installation costs as low as possible, thus making very low head sites economically interesting. Control is achieved by eight adjustable blades used for water level regulation and by a variable speed power converter.
9 Philippe Lautier et al., "Variable Speed Operation of a New Very Low Head Hydro Turbine with Low Environmental Impact" (paper presented at the 2007 IEEE Canada Electrical Power Conference, 2007) The project was made possible by the Agence de l’Environnement et de la Maîtrise de l’Energie, Ministère Délégué à la Recherche (France), and Department of Natural Resources of Canada.

Draft – For Internal Discussion Only
Summit Blue Consulting, LLC 10
Figure 5. Diagram of Very Low Head Variable Speed Kaplan Turbine
Source: Philippe Lautier et al., "Variable Speed Operation of a New Very Low Head Hydro Turbine with Low Environmental Impact" (paper presented at the 2007 IEEE Canada Electrical Power Conference, 2007)
A 450 kW prototype of the turbine was successfully installed, commissioned, and qualified in southern France during the winter and spring of 2007. Prior to this installation, the turbine concept had been tested using a small scale model in a lab in Canada. The turbine’s very low rotational speed makes it fish-friendly and the low civil work required to set it up brings its environmental impact to a very acceptable level.
Low-Head Hydro: Fish-Friendly Variable Speed Low-Head Turbine
Another project being run by Natural Resources Canada10
10Natural Resources Canada, “Low-Head Hydro: Fish-Friendly Variable Speed Low-Head Turbine,” updated October 2005, Available:
is to develop a more economic version of the variable speed low-head turbine.
A major concern with the economic viability of small hydro systems is the varying water resource power input to the turbine. Conventional single regulated turbines are unable to operate with significant changes to flow and must be shut down. Double regulated Kaplan turbines can operate over a significant turndown ratio, but their capital costs are much higher. A better approach would be to develop a system with lower capital cost, but with the same operational efficiency and turndown ratio. In addition, a properly designed fish-friendly turbine is highly desirable to reduce fish injury and mortality.
www.nrcan.gc.ca/es/etb/cetc/cetc01/TandI/lowhead_e.htm.

Draft – For Internal Discussion Only
Summit Blue Consulting, LLC 11
This project proposes to develop a simple non-regulated turbine system coupled with a variable-speed generator to operate at the correct flow to rotational speed, improving fish friendliness, increasing productivity and reducing the overall cost for low-head run-of-river applications.
Unlike conventional turbines, which have guide vanes, wicket gates, and relative large number of short runner blades, the proposed turbine will be a non-regulated vortex propeller turbine, having fewer but longer and thicker runner blades, which prevents fish mortality and injury caused by negative mechanical and cavitation effects, and other effects. A special turbine casing will be designed to create the required tangential momentum. The proposed generator will be compact. Based on permanent magnet technology with a high number of poles, it will be able to generate electric power with improved efficiency at low and variable-speed operations. The generated power at variable frequency will be converted to utility quality power using commercially available frequency converters that will be modified for this application.
This project is due to be completed in November 2008.
HYDROMATRIX® and StrafloMatrix, Electric Energy from Low Head Hydro Potential11
The main reason for the exclusive use of the weir structure for its primary purpose (e.g., shipping, irrigation, or flood prevention) can be attributed to the non-feasibility of energy generation at the time of its construction. Another reason is that the retrofitting of a conventional low head turbine generator unit would mean excessive civil works, geological risk and associated cost. Many of these dams are equipped with radial gates. For maintenance of the radial gates, bulkhead gate logs can be inserted into gate slots upstream and downstream of the radial gates.
Figure 6: Schematics of a HYDROMATRIX® Installation
Source: E. Schlemmer, F. Ramsauer, X. Cui, and A. Binder, "HYDROMATRIX® and StrafloMatrix™, Electric Energy from Low Head Hydro Potential," (2007)
For power generation, the dam’s bays can be equipped with HYDROMATRIX® modules, which are relatively small turbine-generator-sets, approx. 200 to 700 kW in size, which are inserted into the gate slots of the bays (see Figure 11).
11 E. Schlemmer, F. Ramsauer, X. Cui, and A. Binder, "HYDROMATRIX® and StrafloMatrix™, Electric Energy from Low Head Hydro Potential," (2007)

Draft – For Internal Discussion Only
Summit Blue Consulting, LLC 12
Compared to a retrofit with conventional turbine-generator-units, the use of modules has several advantages. Existing structures can be used to a maximum extent and no additional land is flooded. Civil works and geological risks are kept to a minimum. The flow of the river is not altered and the modules can be raised above the high water mark in the case of flooding. The concept is highly modular and can be expanded according to the dam owner’s needs. For instance, with increased demand for power, additional bays can be equipped with modules. Different flow rates can be dealt with simply by altering the number of modules or individual machines in operation.
HYDROMATRIX® units have the following characteristics and head/flow requirements:
Available flow rate 60 m³/s (approx.)
Head 3 m to 15 m
Unit output 200 kW to 700 kW (approx.)
Grid connection at close distance
Civil structure suitable for HYDROMATRIX® installation
Figure 7. Irrigation dam, Jebel Aulia, Sudan
Source: E. Schlemmer, F. Ramsauer, X. Cui, and A. Binder, "HYDROMATRIX® and StrafloMatrix™, Electric Energy from Low Head Hydro Potential," (2007)
Table 5 gives details of several HYDROMATRIX® installations that are currently in operation round the world.

Draft – For Internal Discussion Only
Summit Blue Consulting, LLC 13
Table 3. Details of Existing Hydromatrix Installations
Location Type Head (m) Speed (rpm)
Unit Output (kW)
Number of Units
Total Output (MW)
Navigation weir Nussdorf, Vienna,
Austria
Asynchronous 5.86 336.7 525 12
4.75
Irrigation dam, Jebel Aulia, Sudan
Asynchronous
5.5
375 380 80
30.4
Intake structure, Colebrook, USA
Asynchronous
7.6 to 30.5
900 500
6
3
Ship lock Freudenau, Vienna, Austria
Asynchronous
10.3 to 1
500 200 25
5
StrafloMatrix™‐prototype, Agonitz,
Austria
Synchronous 8.5
428.57
700 1
0.7
Source: E. Schlemmer, F. Ramsauer, X. Cui, and A. Binder, "HYDROMATRIX® and StrafloMatrix™, Electric Energy from Low Head Hydro Potential," (2007)

Summit Blue Consulting, LLC E-1
APPENDIX E: SUMMARY OF LITERATURE REVIEW SOURCES

Summit Blue Consulting, LLC E-2
Paper Title File Name/Source Paper Date
Key Concepts Comments
Guides and General Information
[1]Small Hydro Power: Technology and Current
Status
Oliver Paish, IT Power Ltd, Hampshire, UK 2002
Small‐scale hydro is one of the most cost‐effective and environmentally benign energy technologies to be considered both for rural electrification in less
developed countries and further hydro developments in Europe. The European Commission have a target to increase small hydro capacity by 4500MW (50%) by the year 2010. The UK has 100MW of existing small
hydro capacity (under 5MW) operating from approximately 120 sites, and at least 400MW of unexploited potential. This paper summarizes the different small hydro technologies, new innovations
being developed, and the barriers to further development.
Good general guide.
[2] Small Hydro Power State of The Art and
Applications
C.Dragu, T. Sels, Member, IEEE and R. Belmans, Senior Member, IEEE
Not given
A literature study of the advantages and drawbacks of Small and Micro Hydro Plants. Two principal
economic characteristics of hydropower are high initial and low operating costs. From studied
literature an easy algorithm is proposed to follow in order to assure the maximum efficiency for minimum costs of a site. Each hydro site is unique, since about 75% of the development cost is determined by the location and site conditions. An economical and technical review of the essential components (civil works and mechanical and electrical equipment) of a small hydropower system is made and projected on
two different sites in Flanders.
Useful overview of economics and planning strategies. Written sometime after 1998?
[3] Handbook for Developing Micro Hydro In British Columbia
BC Hydro March 2004
Handbook to further the development of micro hydro developments in BC. Relevant for projects with
installed capacities of less than 8000 kW. Addresses key issues pertaining to micro hydro development and aims to make developers aware of the opportunities and challenges of energy development. Key sections:
Useful overview. Covers the main issues when starting to develop a project but no
technical details.
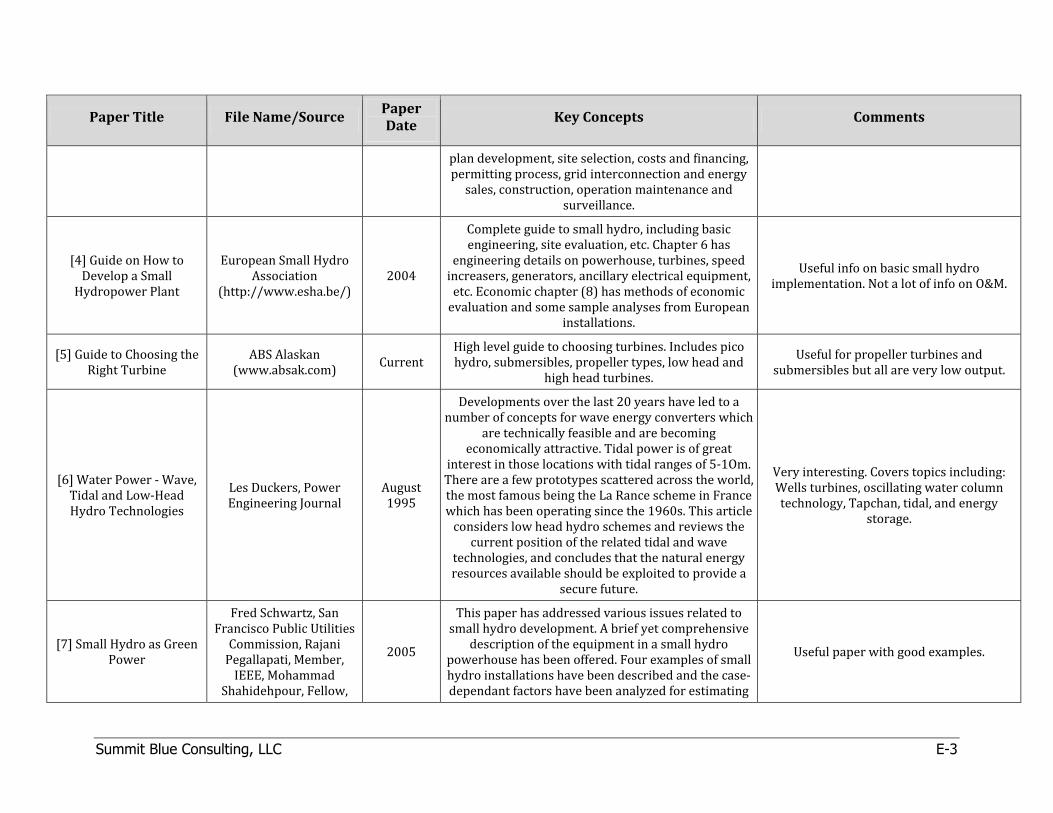
Summit Blue Consulting, LLC E-3
Paper Title File Name/Source Paper Date
Key Concepts Comments
plan development, site selection, costs and financing, permitting process, grid interconnection and energy sales, construction, operation maintenance and
surveillance.
[4] Guide on How to Develop a Small Hydropower Plant
European Small Hydro Association
(http://www.esha.be/) 2004
Complete guide to small hydro, including basic engineering, site evaluation, etc. Chapter 6 has
engineering details on powerhouse, turbines, speed increasers, generators, ancillary electrical equipment, etc. Economic chapter (8) has methods of economic evaluation and some sample analyses from European
installations.
Useful info on basic small hydro implementation. Not a lot of info on O&M.
[5] Guide to Choosing the Right Turbine
ABS Alaskan (www.absak.com) Current
High level guide to choosing turbines. Includes pico hydro, submersibles, propeller types, low head and
high head turbines.
Useful for propeller turbines and submersibles but all are very low output.
[6] Water Power ‐ Wave, Tidal and Low‐Head Hydro Technologies
Les Duckers, Power Engineering Journal
August 1995
Developments over the last 20 years have led to a number of concepts for wave energy converters which
are technically feasible and are becoming economically attractive. Tidal power is of great
interest in those locations with tidal ranges of 5‐1Om. There are a few prototypes scattered across the world, the most famous being the La Rance scheme in France which has been operating since the 1960s. This article considers low head hydro schemes and reviews the current position of the related tidal and wave
technologies, and concludes that the natural energy resources available should be exploited to provide a
secure future.
Very interesting. Covers topics including: Wells turbines, oscillating water column technology, Tapchan, tidal, and energy
storage.
[7] Small Hydro as Green Power
Fred Schwartz, San Francisco Public Utilities Commission, Rajani Pegallapati, Member, IEEE, Mohammad
Shahidehpour, Fellow,
2005
This paper has addressed various issues related to small hydro development. A brief yet comprehensive
description of the equipment in a small hydro powerhouse has been offered. Four examples of small hydro installations have been described and the case‐dependant factors have been analyzed for estimating
Useful paper with good examples.

Summit Blue Consulting, LLC E-4
Paper Title File Name/Source Paper Date
Key Concepts Comments
IEEE, Electric Power and Power Electronics Center,
Illinois Institute of Technology
the payback as well as the advantages and constraints of each site. Environmental issues associated with
small hydro have also been explored.
[8] Low Head Hydro Power in the South‐East of
England – A Review of the Resource and Associated Technical, Environmental and Socio‐
Economic Issues
Ian Bacon (TV Energy) Ian Davison (MWH)
TV Energy
February 2004
…low head hydropower is an important and traditional resource and should not be ignored.
Previous estimates for hydro potential vary widely in the South East with, for example, the potential from the Thames alone using weir based schemes to lie in the order of 5 to 35MWe (based on various expert
assessments). Weirs certainly offer scope for medium to longer term development. Mills, on the other hand, offer more short term opportunities and a chance to really ‘get the ball rolling’ for river‐based renewable
energy generation.
Good information on technologies useful for low head resources.
[9] A Guide To UK Mini‐Hydro
Developments
The British Hydropower Association
January 2005
This Guide is designed to assist anyone in the UK who is planning to develop a small‐scale hydro‐electric scheme. The term “Mini‐hydro” can apply to sites
ranging from a tiny scheme to electrify a single home, to one of a few hundred kilowatts. The Guide explains: · The basic concept of generating power from water · The purpose of different components of a scheme
· The principle steps in developing a project · The technology involved
· Where to go for help and sources of funding
Good general guide, some UK‐specific so not relevant.
Prototypes and Emerging Technology
[10] Hydromatrix® and StrafloMatrix™, Electric Energy from Low Head
Hydro Potential
IEEE ‐ E. Schlemmer, F. Ramsauer, X. Cui, and A.
Binder 2007
Describes technology that can make use of low head hydro potential at existing single purpose dams – i.e. weir structures used for shipping, irrigation, or flood prevention. The installation of HYDROMATRIX®‐
modules into existing dams is described as well as the cost benefits. The permanent magnet excited
synchronous StrafloMatrix™‐unit is contrasted to the
Not sure how applicable to NW as targets large low‐head dams with no hydro (are there any?). Technology already in use so
could be deployed.

Summit Blue Consulting, LLC E-5
Paper Title File Name/Source Paper Date
Key Concepts Comments
original concept employing directly driven induction machines. Several examples of built HYDROMATRIX®‐plants are given.
[11] Final Turbine and Test Facility Design
Report ‐ Alden/NREC Fish Friendly Turbine
Alden Research Laboratory for DOE 2000
Improvements in turbine design to reduce fish mortality or injury. Not sure if this is only for large
hydro. Not turbine size given. Not sure if relevant – possibly.
[12] Variable Pitch Darrieus Water Turbines
Brain Kirke, Leo Lazauskas
Sustainable Energy Center, University of South Australia
2008 Covers the improvements in using Darrieus turbines in water. Improves issues such as low starting torque and shaking.
Largely research – not relevant for implementation.
[13] Low‐head Hvdroelectric Power Using Pneumatic Conversion
Prof Norman Bellamy, published in Power Engineering Journal
May 1989
This article deals with alternative power conversion systems based on air as an intermediate fluid which are aimed at achieving a more economic solution to low head sites. A novel water‐to‐air power‐conversion
system has been built which utilises a flexible membrane as a self‐oscillating interface between water and air to drive an air turbine and generator. Problems of this new technology are discussed and a
number of improvements are proposed.
Does not look relevant – at development stage.
[14] Design of a Power Take Off System for the VIVACE Generator
ME 450 Winter 2008 Section 3: Professor
Hulbert April 2008
The VIVACE Converter, which is invented by Professor Michael M. Bernitsas of the University of Michigan, converts ocean/river hydrokinetic energy to
electricity by Vortex Induced Vibration (VIV). The overall objective of this project is to design and build a Power Take Off (PTO) system for a VIVACE Converter.
A prototype for proof of concept was built. The prototype power output was found to be 0.04 W with
a resistance of 1600 ohms.
Prototype only – likely not relevant.
Improved Implementation/Financial Analysis
[15] Optimal Planning of S. Roy, Senior Member, 2005 …multiple microscale hydro generating units can be Interesting approach for implementing

Summit Blue Consulting, LLC E-6
Paper Title File Name/Source Paper Date
Key Concepts Comments
Generating Units Over Micro‐Hydro Resources Within a Catchment Area
IEEE planned over a catchment area consisting of several potential installation sites so as to extract the
maximum possible energy per‐unit investment cost. With a pre‐decided overall charge rate, this would, in turn, determine the annual payback of levelized installation costs. The method leads to a choice of turbine type for each site, setting its optimal head, flow, and power output. Part‐flow conditions are accommodated through the respective site
hydrographs. A suitable case study involving 16 potential sites, adapted from the upper Ganga basin located in Northern India, is finally presented as an
illustrative example.
multiple microhydro installations in one catchment area.
[16] Distributed Generation Evaluation Study for AmerenUE
Alternative Energy Systems Consulting
November 2007
Has sample analysis of DG project with industrial small hydro, plus levelized costs for small hydro. Useful for financial analysis example.
[17] Variable Speed Operation of a New Very Low Head Hydro Turbine with Low Environmental
Impact
Philippe Lautier, Claude O'Neil, Claire Deschenes, Herve Joel Nanga Ndjana, Richard Fraser, Marc
Leclerc 2007 IEEE Canada Electrical Power Conference
2007
A new very low head turbine has been developed. Keeping projects profitability at a good level was made possible by reducing required civil work and
keeping the turbine reliability at a reasonable cost per installed kW. Control and efficiency issues have been addressed by using state of the art power electronics to achieve the best output at low head. This article
gives an overview of the turbine design and its control technique using practical results measured on a first 450 kW unit installed and commissioned in southern France during spring 2007 and running since then.
Useful new concept in low head hydro design. Built into the sluice passage of
existing dams.

Summit Blue Consulting, LLC E-7
Paper Title File Name/Source Paper Date
Key Concepts Comments
[18] Low Head/Low Power Hydropower
Resource Assessment of the Pacific Northwest Hydrologic Region
Idaho National Laboratory
September 2002
An analytical assessment of the hydropower potential of the Pacific Northwest Hydrologic Region. The principal focus of the study was the amount of low head (less than 30 ft)/low power (less than 1 MW) potential in the region and the fractions of this potential that corresponded to the operating envelopes of three classes of hydropower
technologies: conventional turbines, unconventional systems, and microhydro technologies.
Financial Analysis
[19] Optimal Installation Capacity of Small Hydro‐power Plants Through the
Use of Technical, Economic and Reliability
Indices
S.M.H. Hosseinia,, F. Forouzbakhshb, M.
Rahimpoora Electrical Engineering Department, Faculty of Engineering, Islamic Azad University, Tehran, Iran
2004
…determine the optimal installation capacity of Small Hydro‐Power Plants (SHPPs) and estimate optimal
annual energy value. A method to calculate the annual energy is presented, as is the program developed using Excel software. This program analyzes and
estimates the most important economic indices of an SHPP using the sensitivity analysis method. Another program calculates the reliability indices for a number of units of an SHPP with a specified load duration curve. Comparing the technical, economic and reliability indices will determine the optimal
installation capacity of an SHPP. The above‐mentioned algorithm is applied to a sample SHPP.
Useful for financial analysis and planning small hydro projects.
[20] Criteria for the Economic Planning of a Low Power Hydroelectric
Plant
R. Montanari, Dipartimento di
Ingegneria Industriale, Universita` degli Studi di Parma, Parma, Italy
2003
…an original method for finding the most economically advantageous choice for the installation of micro hydroelectric plants with only small head and modest flow rates. The specific energy of the fluid is low and therefore large masses of water are needed. Traditional Kaplan or Francis type turbines have too
high levels of initial investments. More simple
Useful for planning hydro at low head sites.

Summit Blue Consulting, LLC E-8
Paper Title File Name/Source Paper Date
Key Concepts Comments
configurations must be analysed, such as plants with propeller turbines or Michell–Banki turbines. The general methodology applied is based on the use of economic profitability indicators such as NPV,
calculated using the plant project parameters, the nominal flow rate and head, and the particular hydrologic characteristics of the site. An example
application is given.
[21] Economic Risk and Sensitivity
Analyses for Small Scale Hydropower Projects
Lars Jenssen, Kåre Mauring, Tor Gjermundsen
IEA Technical Report
March 2000
This report deals with uncertainty and economical risks related to hydropower projects.
Chapters 2‐4 describe the different components that influence the economics of a project and the uncertainty each component is burdened with. Chapter 5 describes various methods for the
calculation and evaluation of the risks associated with benefits and costs. Chapters 6‐9 present the step‐by‐step principle; the structure, the calculations and the
results. Chapter 10 gives an example.
Useful risk analysis.
[22] Estimation of Economic Parameters of
U.S. Hydropower Resources
Douglas G. Hall, Richard T. Hunt, Kelly S. Reeves,
Greg R. Carroll
Idaho National Engineering and Environmental Laboratory
June 2003
Tools for estimating the cost of developing and operating and maintaining hydropower resources in the form of regression curves were developed based on historical plant data. Development costs that were addressed included: licensing, construction, and five
types of environmental mitigation. A tool for estimating the annual and monthly electric generation
of hydropower resources was also developed. Additional tools were developed to estimate the cost
of upgrading a turbine or a generator. The development and operation and maintenance cost estimating tools, and the generation estimating tool were applied to 2,155 U.S. hydropower sites, including
totally undeveloped sites, dams without a hydroelectric plant, and hydroelectric plants that could be expanded to achieve greater capacity. Site
characteristics and estimated costs and generation for

Summit Blue Consulting, LLC E-9
Paper Title File Name/Source Paper Date
Key Concepts Comments
each site were assembled in a database.
Hydro in Manmade Conduits
[23] Municipal Hydro ‐ There's Power in Your
Pipes!
Community Hydro website:
www.communityhydro.biz/watersystems.html
Current
Community Hydro specializes in generating electricity from water flowing through municipal water supplies and treated effluent from wastewater treatment
systems. We offer a proprietary technology called a "generating pressure reducing valve" (GPRV), which runs in parallel with an existing PRV to generate
power within existing conduits. SOAR technologies of Washington have developed a method for providing reliable pressure reduction with power generation as a byproduct. The technology combines two standard devices: an impulse (Pelton) turbine and components
from a standard PRV. A GPRV is best suited for pressure differentials of at least 25 psi, and flows of over 1 million gallons a day. Lower flows can work if
the pressure differential is more than 25 psi.
Developer of in‐conduit hydro. Not much more info on the website. Need to talk to them about what projects are installed.
[24] Statewide Small Hydropower Resource Assessment for State of
California
Navigant Consulting for the CEC June 2006
Examines CA statewide potential of RPS‐eligible small hydropower. Report states that the most likely type of RPS‐eligible small hydropower is that developed
within man‐made conduits – i.e. pipelines, aqueducts, irrigation ditches, and canals. Approximately 255 MW of small hydropower potential in man‐made conduits could be developed in CA with current technologies.
Also has thorough review of hydropower technologies.
Very useful for in‐conduit info. Subjects covered include: Magnitude of Potential RPS‐Eligible Small Hydropower, Current State of Hydropower Technology, Equipment Options, Estimated Capital and
O+M costs, Barriers and Hurdles to Development of In‐Conduit Hydropower. Also lists ways to retrofit existing plants.
[25] Design Considerations for
Hydropower Development In a Water Distribution
System
SHP Development and Programme Worldwide ‐ David P. Chamberlain, Ed Stewart, Fei‐Fan Yeh and Michael T. Stift, San Diego County Water Authority,
2004
Describes design considerations for using turbines in a water distribution system. There are issues because of long pipeline reaches and widely varying flow and
pressure conditions imposed by the water distribution system. For a fixed speed unit, the
selection of design points for head and flow needs to be optimized to provide an operating envelope that
Very interesting and useful for water distribution system small hydro. Good
technical information.

Summit Blue Consulting, LLC E-10
Paper Title File Name/Source Paper Date
Key Concepts Comments
would maximize the return on the investment. Method and approach to evaluate these considerations are
outlined. A sample 4.3 MW Pressure Control/Hydroelectric Facility is given as an
illustrative example. Licensing requirements for small inline hydroelectric facilities are also briefly discussed
[26] Energy efficiency: Wastewater Treatment and Energy Production
Filtration & Separation, Volume 44, Issue 12, December 2007, Pages 16‐19 Anthony Bennett
17 December 2007
…there are circumstances where water delivered directly to treatment plants can also be exploited.
Using turbines as water energy reduction brakes, and utilizing pressure reduction valves and brake pressure tanks, WWTW requirements of an overall low water pressure head can be achieved in combination with
hydropower energy generation.
Not a lot of information on hydro – mostly about biogas.
[27] Energy Trust Briefing: Farmers
Irrigation Small‐Scale Hydroelectric Project
Energy Trust of Oregon May 2005
Proposal from SOAR Technologies to install a 40 kW hydroelectric turbine for Farmers Irrigation District to operate within the water delivery system. Soar will build and operate it and the sell it to Farmers after at least one‐year of operating experience. As proposed, the turbine will serve a dual function. It will provide essential pressure reduction, while also generating more than 120,000 kWh per year. The project will serve as a demonstration of these techniques and
technologies for both irrigation systems and drinking water supply systems in Oregon.
Would be good to find out what happened with this!
Case Studies/Feasibility Studies
[28] A Feasibility Study for a Microhydro Installation for the Strangford Lough
Wildfowlers & Conservation Association
Mark Tamburrini (MSc Thesis)
Energy Systems Research Unit, Department of
Mechanical Engineering, University of Strathclyde,
UK
September 2004
A feasibility study for a micro‐hydro scheme on a conservation site in Northern Ireland. The study
confirmed that the concept of a microhydro scheme using the existing dam is sound, and that a peak
sustainable power output of 54kW could be achieved using a high efficiency vertical axis turbine. Study includes following sections: Introduction, Literature Review, Feasibility Study, Technical Analysis, Analysis
Good example of feasibility study including working with local community,
environmentally sound planning for site development, as well as detailed microhydro
planning.

Summit Blue Consulting, LLC E-11
Paper Title File Name/Source Paper Date
Key Concepts Comments
of Potential Energy Resource and Income from Exported Energy, Financial Viability, and Conclusions
and Recommendations
[29] Mitchell Dam Case Study
Iowa Energy Center Alternate Energy
Revolving Load Program
Installed 1998,
downloaded 2007
An abandoned hydroelectric station on the Cedar River near Mitchell came to life in 1998 after
three decades of inactivity, thanks to an innovative partnership between the Mitchell County
Conservation Board (MCCB) and two California investors. Contains details of the technology,
performance, and economics.
[30] Case Study – Crown Hill Farm Oregon Office Of Energy January
2003 Case study of a small hydro installation on a farm. No production or cost data but describes process of installation and funding.
[31] Green Energy Study for British Columbia Phase 2: Mainland Small Hydro
Sigma Engineering Ltd. For BC Hydro
October 2002
An inventory of potential small hydro sites in BC Hydro territory. Projects in the Inventory range in size from 500 kW to about 47 MW and they are located in most geographical regions of the province. Because of differing terrain, capacities and different hydrology, the projects also have a range of unit energy costs.
Approximately 40% of the project sites are developable at less than 7 c/kWh which comprises
about 67% of the total developable energy. The inventory is based on sizing each project to the mean annual flow and operating on a run‐of‐river
basis. This may not be the optimal configuration of the project but it may be a requirement for a green
classification.
Good list of small hydro sites with transmission costs taken into consideration. O&M costs are a simple estimate of 2% of
capacity costs.
[32] Generation From Canals As Part Of Water Management In Southern
New South Wales
Pacific Hydro Limited, Australia
www.pacifichydro.com.au
Current Website
With the assistance of a $1 million grant under the Renewable Energy Commercialisation Program,
Pacific Hydro Limited has developed Australia’s first hydroelectric scheme that uses an irrigation channel. Pacific Hydro operates the scheme on the largest
water delivery channel in Australia, the Mulwala canal in southern New South Wales. The first stage of the
Similar to GPRV concept. Actually running.

Summit Blue Consulting, LLC E-12
Paper Title File Name/Source Paper Date
Key Concepts Comments
project has been constructed, with generation commencing in November 2002 from a 2MW facility capable of accepting flows of up to 70m3/s at a
location known as ‘The Drop’. The Drop is a control structure that regulates flows into the Mulwala and
Berrigan canals.
[33] Haas‐Kings River Hydroelectric Project
(FERC No. 1988) ‐ Request for
Commission Certification of Renewable Energy
Production Tax Credit for Efficiency Improvements
PG&E (FERC Filing) October 2008
Request for FERC certification of incremental hydro project
[34] Lawrence Hydroelectric Project (FERC No. 2800‐MA); Request for Certification of Renewable Energy Production Tax Credit
Essex Company (FERC Filing)
September 2008
Request for FERC certification of incremental hydro project
[35] Hudson River Hydroelectric Project,
Sherman Island (FERC No. 2482);
Request for Certification of Renewable Energy Production Tax Credit
Erie Boulevard Hydropower
September 2008
Request for FERC certification of incremental hydro project
[36] Gulf Island ‐ Deer Rips Hydroelectric Project
(FERC No. 2283); Request for Certification of Renewable Energy Production Tax Credit
FPL Energy October 2008
Request for FERC certification of incremental hydro project

Summit Blue Consulting, LLC E-13
Paper Title File Name/Source Paper Date
Key Concepts Comments
[37] Cutler Hydroelectric Project
(FERC No. 2283); Request for Certification of Renewable Energy Production Tax Credit
Pacificorp Energy November 2008
Request for FERC certification of incremental hydro project