small business counts - asbfeo · · 2017-03-28very real sense, small business counts. ......
TRANSCRIPT

Small Business Counts
Small Business in the Australian Economy

© Commonwealth of Australia 2016
ISBN 978-1-925220-85-8
This publication is available for your use under a Creative Commons BY Attribution 3.0 Australia licence, with
the exception of the Commonwealth Coat of Arms, the Ombudsman logo, photographs, images, signatures
and where otherwise stated. The full licence terms are available from
http://creativecommons.org/licenses/by/3.0/au/legalcode.
Use of Ombudsman material under a Creative Commons BY Attribution 3.0 Australia licence requires you to
attribute the work (but not in any way that suggests that the Ombudsman endorses you or your use of the
work).
Ombudsman material used ‘as supplied’.
Provided you have not modified or transformed Ombudsman material in any way including, for example, by
changing the Ombudsman text; calculating percentage changes; graphing or charting data; or deriving new
statistics from published Ombudsman statistics—then Ombudsman prefers the following attribution:
Source: The Australian Small Business and Family Enterprise Ombudsman.
Derivative material
If you have modified or transformed Ombudsman material, or derived new material from those of the
Ombudsman in any way, then the Ombudsman prefers the following attribution:
Based on The Australian Small Business and Family Enterprise Ombudsman data.
Use of the Coat of Arms
The terms under which the Coat of Arms can be used are set out on the It’s an Honour website
(www.itsanhonour.gov.au).
Other uses
Inquiries regarding this licence and any other use of this document can be directed to:
Manager
Communications and Marketing
Australian Small Business and Family Enterprise Ombudsman
02 6263 1500
This working paper outlines the research and findings on small business statistics. Due care has been
exercised in the preparation of this publication. Notwithstanding, the Office of the Australian Small Business
and Family Enterprise Ombudsman, its employees and advisers disclaim all liability whatsoever, including
liability for negligence and for any loss, damage, injury, expense or cost incurred by any person as a result of
accessing, using or relying upon any of the information in this research paper to the maximum extent
permitted by law.

Australian Small Business and Family Enterprise Ombudsman | Small Business in the Australian Economy 3
Contents
Forward 5
Overview 6
1 Introduction 7
2 Small business share of economic activity 8
2.1 Small business numbers 8
2.1.1 Business numbers measured by employment ................................................................ 8
2.1.2 Business numbers measured by turnover ...................................................................... 9
2.1.3 Nano businesses numbers .......................................................................................... 10
2.2 Small business share of value added 11
2.3 Small business employment 15
3 Innovative behaviour 21
3.1 Small business innovation 21
3.2 Commercialising research 21
3.3 Small businesses innovation and national productivity 22
3.4 Barriers to business innovation 24
3.5 Small business R&D 24
4 Small business exports 28
4.1 Number of small business exporters 28
4.2 Value of small business exports 29
5 Tax contribution 32
5.1 Understanding the tax contribution of small businesses 32
5.2 Small business industry benchmarks 33
6 Women in small business 34
6.1 Ownership and management 34
6.1.1 Business control .......................................................................................................... 37
6.1.2 Business management ................................................................................................ 37
Australian Small Business and Family Enterprise Ombudsman | Small Business in the Australian Economy 4
6.2 The next generation 38
6.3 Women as owner/managers 40
6.3.1 Business challenges ................................................................................................... 40
6.3.2 The use of IT ............................................................................................................... 40
6.3.3 Work-life balance ......................................................................................................... 41
6.4 Trends 41
7 Government assistance 41
Appendix 42
Data methodology 42

Australian Small Business and Family Enterprise Ombudsman | Small Business in the Australian Economy 5
Forward
Australia is a nation of small businesses and I am so pleased to be appointed
as the first Australian Small Business and Family Enterprise Ombudsman.
Small business is the most dynamic and exciting sector in the Australian
economy, yet it is underreported in the media and often overlooked by
governments at all levels when setting policies that affect business.
Part of my role is to lift the profile of the Australian small business sector so
that it receives the attention from governments and the media that it
deserves. This report is a roundup of the key small business statistics kept by
various Australian Government agencies. It confirms the size and importance
of the sector to the Australian economy.
Less obvious from the statistics is the ever changing face of small business
(see chart below). Tens of thousands of small businesses are entering and
leaving the economy every year.
The small business environment is a very dynamic medium that allows
entrepreneurs to pursue their dreams, unencumbered by the strictures of
larger and more bureaucratic business structures. As such, small businesses encapsulate the values of agility and
nimbleness espoused by the Prime Minister and are perfectly placed to pursue innovative opportunities in the new
Australian economy.
Kate Carnell, AO Australian Small Business and Family Enterprise Ombudsman
Figure 1 - Survival rates of Australian businesses by numbers of employees
Source: Australian Bureau of Statistics Counts of Australian Small Businesses 8165.0, Feb 2016

Australian Small Business and Family Enterprise Ombudsman | Small Business in the Australian Economy 6
Overview
Small businesses count.
They are prevalent in all sectors of the economy and in all of Australia’s regions. There is no ‘typical’ small
business. It is a very diverse sector, covering many different types of business activity. Nevertheless, we are able
to draw together statistics from several sources to illustrate the size and importance of the small business sector.
What emerges is a picture of a surprisingly large and vibrant sector, which is vital to the health of the Australian
economy.
The vast majority (over nine in ten) of Australian businesses are small businesses. They account for 33 per cent of
Australia’s GDP, employ over 40 per cent of Australia’s workforce, and pay around 12 per cent of total company
tax revenue.
While some small businesses are at the cutting edge of technology and design in Australia, only 30 per cent of
small businesses engage in product innovation. This is a smaller percentage than for medium and large
businesses. Nevertheless, small business accounts for 17 per cent of business expenditure on research and
development (R&D).
Small businesses dominate some industry sectors (such as Agriculture and Real Estate) but are virtually non-
existent in others sectors that require significant capital investment to participate (for example Telecommunications
and Utilities).
The size of a business is an important determinant of business longevity. The small business sector is very
volatile, with non-employing small businesses having the lowest survival rate of all businesses in Australia.
Paradoxically, this ongoing creation and destruction of small businesses is an explanation for the adaptability and
resilience of the small business sector. It enables new business ventures to quickly spring up to exploit new
opportunities and promptly exit declining industries.
The ‘born-global’ phenomenon is seeing greater numbers of small businesses entering export markets at an early
stage of their development. In 2013-14, 44 per cent of goods-exporting firms were small businesses. However,
they are generally niche players, accounting for a very small percentage (about 0.5 per cent) of the total value of
Australian exports.
Women are becoming increasingly significant in small business. In 1991, 31 per cent of small businesses
owners/managers were women. By 2015 this figure had risen to 34 per cent.
Small business is the least assisted sector of the economy. Only 15 per cent of small businesses report receiving
any form of government assistance, compared to 30 per cent of medium businesses and 57 per cent of large
businesses.
A healthy small business sector is a prerequisite for a growing economy with high employment opportunities. In a
very real sense, small business counts.

Australian Small Business and Family Enterprise Ombudsman | Small Business in the Australian Economy 7
1 Introduction
This report brings together the ABS, ATO and Austrade data to present a statistical report of the small business
sector. It shows the contribution of the small business sector to the Australian economy.
Its purpose is to be an information resource for governments, public policy makers and researchers that will
improve their knowledge and understanding of the Australian Small Business sector. The report is data-based and
does not comment on the policy issues or concerns of the small business sector. It simply sets the scene to give
all stakeholders a more common understanding of the significance of the small business contribution to economic
activity.
In this report, a small business is defined as a business that has an Australian Business Number (ABN) and an
active GST role with turnover less than $2 million per annum (p.a.); or employs less than 20 people. There is a
rough approximation between these two measures but they are not identical. Accordingly, there are minor
differences in the counts of Australian small businesses depending upon whether the turnover or employee
definition of a small business is used.
In this report, unless otherwise stated, the term ‘small businesses’ will include micro businesses, which are defined
by the ABS as GST paying enterprises employing 0-4 employees. However, unless otherwise stated, the data
counts do not include extremely small businesses which have an ABN but are not GST active and have no
employees. We have termed these ‘nano businesses’ (see sections 2.1.2).

Australian Small Business and Family Enterprise Ombudsman | Small Business in the Australian Economy 8
2 Small business share of economic activity
This section examines the small business share of output, employment and value added by industry and State and
Territory. The data source is the February 2016 release of the ABS Counts of Australian Business.
2.1 Small business numbers
2.1.1 Business numbers measured by employment
Using the employment measure of small business, there were 2,065,523 small businesses in Australia employing
less than 19 people, accounting for 97 per cent of all Australian businesses by employee size. There were 51,000
medium sized businesses, employing 20 to 199 employees, which is 2.4 per cent of all firms. Only 3,700
Australian firms employed over 200 people in 2015, meaning that large businesses account for only 0.2 per cent of
all Australian businesses.
Table 1: Business size measured by employment
Business Size Count %
Small (0-19 employees) 2,066,523 97.4
Medium (20-199 employees) 50,995 2.4
Large (200+ employees) 3,717 0.2
Total 2,121,235 100
Source: ABS Counts of Australian Business 8165.0, Feb 2016 and ASBFEO calculations (excludes nano businesses with no GST role)
The majority, 61 per cent, of Australian businesses by number are sole traders with no employees. Micro business
with 1-4 employees account for 27 per cent of Australian businesses. Small businesses with 5-19 employees
comprise 9 per cent of Australian firms. Only 3 per cent of Australian businesses have 20 or more employees.
Table 2: Counts of Australian businesses measured by employment size as at Jun 2015
Source: ABS Counts of Australian Business 8165.0, Feb 2016 and ASBFEO calculations (excludes nano businesses with no GST role)
Employees Firm Count %
0 (non-employing) 1,284,615 60.6
1–4 (micro) 584,744 27.5
5–19 (small) 197,164 9.3
20–199 (medium) 50,995 2.4
200+ (large) 3,717 0.2
Total 2,121,235 100

Australian Small Business and Family Enterprise Ombudsman | Small Business in the Australian Economy 9
Chart 1: Turnover by business size
Source: ABS Counts of Australian Business 8165.0, Feb 2016 and ASBFEO calculations (excludes micro businesses with no GST role)
2.1.2 Business numbers measured by turnover
In 2015, there were 1,980,401 small businesses in Australia with an active GST role and turnover of less than $2
million a year. These small businesses accounted for 93 per cent of all Australian businesses by turnover. Around
a quarter of small businesses had a turnover of less than $50,000 a year.
Moving up the size spectrum, over 730,000 small businesses had turnover of less than $200,000 a year and
another 700,000 had turnover of $200,000 to $2 million a year (see Table 3). In proportionate terms, two thirds of
Australian businesses had income of $50,000 to $200,000 a year. Only 7 per cent of Australian businesses could
be considered medium or large businesses with turnover of more than $2 million a year1.
Table 3: Business numbers by annual turnover in 2014-15
Turnover Number %
$0 to less than $50k 541,616 26%
$50k to less than $200k 730,901 34%
$200k to less than $2m 707,884 33%
$2m or more 140,834 7%
Total 2,121,235 100%
Source: ABS Counts of Australian Business 8165.0, Feb 2016 and ASBFEO calculations (excludes nano businesses with no GST role)
1 Source: ABS Counts of Australian Business 8165.0, Feb 2016 and ASBFEO calculations
61%
28%
9%
2% 0.2%
Firm count by number of employees
0 (non-employing)
1–4 (micro)
5–19 (small)
20–199 (medium)
200+ (large)

Australian Small Business and Family Enterprise Ombudsman | Small Business in the Australian Economy 10
Chart 2: Turnover by business size
Source: ABS Counts of Australian Business 8165.0, Feb 2016 and ASBFEO calculations (excludes nano businesses with no GST role)
2.1.3 Nano businesses numbers
In the ATO data set, there are ‘nano’ sized businesses that report business revenue but have no GST activity (the
mandatory GST registration threshold is $75,000 turnover).
These nano businesses are excluded from the ABS small business counts. Nano businesses are, on average,
roughly one-tenth the size of small businesses with GST activity. The median turnover of these nano businesses
was only $15,000 in 2013 (mean turnover $48,000). Nano businesses are often secondary business interests to a
main revenue source.
While the individual economic contribution of these nano businesses is correspondingly small, their number is
significant overall. For every ten small businesses with GST activity in the ATO data there are another six nano
businesses (about 1.2 million) without GST activity. These non-GST active nano businesses are largely sole
traders, trusts and self-managed superannuation funds. Extrapolating these figures would give a potential GDP
contribution of nano businesses of roughly 2 per cent of GDP.
Table 4: Comparison: Small businesses with GST activity and Nano business without GST activity
2012/2013 Small Business Median
Small Business Mean
Nano Business Median
Nano Business Mean
Turnover $131,000 $368,000 $15,000 $48,000
Net income $16,000 $43,000 $5,000 $22,000
Income tax $0* $11,000 $1,000 $8,000
GST 4,000 $11,000 $0** $0**
Source: ATO Data Set 2013, ASBFEO Calculations. Figures rounded to nearest thousand. *Note that small businesses operating as a partnership pays no tax at the partnership level, rather on individual partners’ level. The same is generally true for businesses operating through a trust – individual beneficiaries of the trust are taxed at their individual tax rate. **A business with no GST activity is generally paying GST on business inputs (input taxed.)
$0 to less than $50k 26%
$50k to less than $200k 34%
$200k to less than $2m 33%
$2m or more 7%
Business count by turnover

Australian Small Business and Family Enterprise Ombudsman | Small Business in the Australian Economy 11
2.2 Small business share of value added
Value added is the increase in the value of goods or services as a result of business activity. Industry value added
is the contribution of that industry to GDP. On average, small business contributed one-third of industry value
added and one-third of GDP in 2014.
Chart 3: Share of value added by business size
Source: ABS Catalogue No. 81550 Australian Industry 2013-14 Page 5, ASBFEO Calculations
As the economy has grown over the last six years of records, the proportion of total value added by small, medium
and large businesses have remained fairly constant.
A slight decline from 34 per cent in 2008-09 to 33 per cent in 2013-14 indicates that the average growth rate of the
small business sector has been only slightly less than that of the economy as a whole. The medium business
sector has also experienced a marginal decline in its share of the economy over that six-year period. The winner
was the large business sector, which expanded in relative terms from 42 per cent of economic output in 2008-09 to
44 per cent in the last year of record.
Table 5: Value added by business size from 2009 to 2014
Size 2008-09 2009-10 2010-11 2011-12 2012-13 2013-14
$billion % $billion % $billion % $billion % $billion % $billion %
Small business $283 34% $313 36% $326 35% $341 34% $335 33% $343 33%
Medium business $197 24% $188 22% $215 23% $229 23% $226 23% $234 23%
Large business $354 42% $357 42% $402 43% $433 43% $440 44% $460 44%
Total $834 100% $858 100% $943 100% $1,003 100% $1,001 100% $1,037 100% Source: ABS Catalogue No. 8155.0 Australian Industry 2013-14 Page 5, ASBFEO Calculations
Small Business
33%
Medium Business
23%
Large Business
44%
Share of value added
Australian Small Business and Family Enterprise Ombudsman | Small Business in the Australian Economy 12
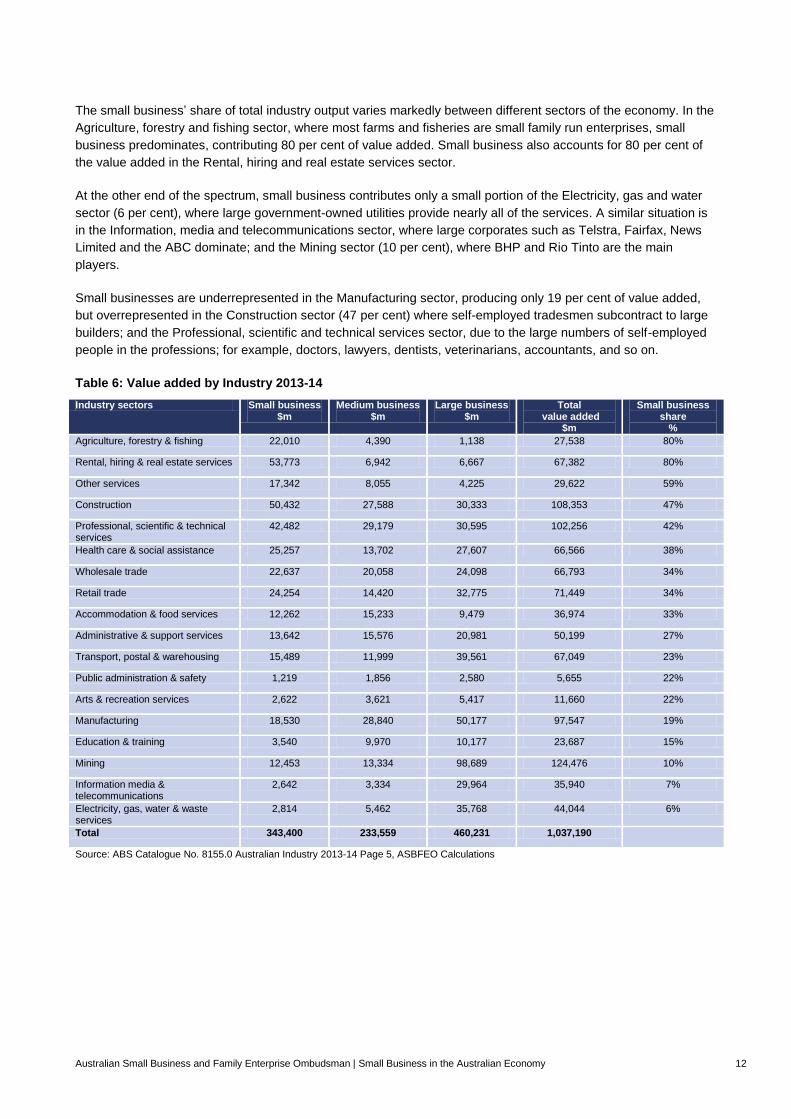
The small business’ share of total industry output varies markedly between different sectors of the economy. In the
Agriculture, forestry and fishing sector, where most farms and fisheries are small family run enterprises, small
business predominates, contributing 80 per cent of value added. Small business also accounts for 80 per cent of
the value added in the Rental, hiring and real estate services sector.
At the other end of the spectrum, small business contributes only a small portion of the Electricity, gas and water
sector (6 per cent), where large government-owned utilities provide nearly all of the services. A similar situation is
in the Information, media and telecommunications sector, where large corporates such as Telstra, Fairfax, News
Limited and the ABC dominate; and the Mining sector (10 per cent), where BHP and Rio Tinto are the main
players.
Small businesses are underrepresented in the Manufacturing sector, producing only 19 per cent of value added,
but overrepresented in the Construction sector (47 per cent) where self-employed tradesmen subcontract to large
builders; and the Professional, scientific and technical services sector, due to the large numbers of self-employed
people in the professions; for example, doctors, lawyers, dentists, veterinarians, accountants, and so on.
Table 6: Value added by Industry 2013-14
Industry sectors Small business $m
Medium business $m
Large business $m
Total value added
$m
Small business share
%
Agriculture, forestry & fishing 22,010 4,390 1,138 27,538 80%
Rental, hiring & real estate services 53,773 6,942 6,667 67,382 80%
Other services 17,342 8,055 4,225 29,622 59%
Construction 50,432 27,588 30,333 108,353 47%
Professional, scientific & technical services
42,482 29,179 30,595 102,256 42%
Health care & social assistance 25,257 13,702 27,607 66,566 38%
Wholesale trade 22,637 20,058 24,098 66,793 34%
Retail trade 24,254 14,420 32,775 71,449 34%
Accommodation & food services 12,262 15,233 9,479 36,974 33%
Administrative & support services 13,642 15,576 20,981 50,199 27%
Transport, postal & warehousing 15,489 11,999 39,561 67,049 23%
Public administration & safety 1,219 1,856 2,580 5,655 22%
Arts & recreation services 2,622 3,621 5,417 11,660 22%
Manufacturing 18,530 28,840 50,177 97,547 19%
Education & training 3,540 9,970 10,177 23,687 15%
Mining 12,453 13,334 98,689 124,476 10%
Information media & telecommunications
2,642 3,334 29,964 35,940 7%
Electricity, gas, water & waste services
2,814 5,462 35,768 44,044 6%
Total 343,400 233,559 460,231 1,037,190
Source: ABS Catalogue No. 8155.0 Australian Industry 2013-14 Page 5, ASBFEO Calculations

Australian Small Business and Family Enterprise Ombudsman | Small Business in the Australian Economy 13
The industry where the small business sector makes the largest contribution to GDP is the Rental, hiring and real
estate services industries where small business value added was $54 billion in 2013-14. The next largest small
business industry sector was Construction, where small business value added was $50 billion in 2013-14.
The Professional, scientific and technical services industry was the third-largest small business industry sector,
producing value added of $42 billion. Small business makes a large contribution in the Health care and social
assistance industry ($25 billion) due to the clustering in this sector of doctors, dentists, ophthalmologists and other
health practitioners who operate as independent small businesses. It might be surprising that Retail trade is only
fifth-largest industry in terms of small business output at ($24 billion). However, if retail is combined with wholesale
trade, the combined small business value added would be the third largest of any industry.
Chart 4: Industry value added by business size 2013-14 ($ million)
Source: ABS Catalogue No. 8155.0 Australian Industry 2013-14 Page 5, ASBFEO Calculations
Small business makes the largest contribution to GDP in the Rental, hiring and estate services industry (57 billion);
the Construction ($50 billion); Professional, scientific and technical services ($43 billion); Health care and social
assistance ($25 billion), Retail trade ($24 billion), Wholesale trade ($23 billion) and Agriculture ($22 billion).
0 50,000 100,000 150,000
Public administration and safety (private)
Arts and recreation services
Information Media and Telecommunications
Electricity, gas, water and waste services
Education and training (private)
Accommodation and food services
Mining
Administrative and support services
Transport, postal and warehousing
Other services
Manufacturing
Agriculture, forestry and fishing
Wholesale trade
Retail trade
Health care and social assistance (private)
Professional, scientific and technical services
Construction
Rental, hiring and real estate services
$ million
Ind
us
try
Industry Value add by Business Size
Small
Medium
Large

Australian Small Business and Family Enterprise Ombudsman | Small Business in the Australian Economy 14
When industries are ranked according to the small business’ share of industry output, a different picture emerges.
Small business dominates the Agriculture, forestry and fishing and Rental, hiring and real estate services
industries, accounting for 80 per cent of the value added in each industry. Family farms are by far the most
prevalent form of business organisation in the rural sector. Real estate agencies are also set up as small
businesses. In the Construction industry, independent tradesmen and small builders account for 46 per cent of
value added.
Chart 5: Percentage share of industry value added by business size 2013-14
Source: ABS Catalogue No. 8155.0 Australian Industry 2013-14 Page 5, ASBFEO Calculations
0% 20% 40% 60% 80% 100%
Electricity, gas, water and waste services
Information Media and Telecommunications
Mining
Education and training (private)
Manufacturing
Public administration and safety (private)
Arts and recreation services
Transport, postal and warehousing
Administrative and support services
Accommodation and food services
Wholesale trade
Retail trade
Health care and social assistance (private)
Professional, scientific and technical services
Construction
Other services
Rental, hiring and real estate services
Agriculture, forestry and fishing
Percentage
Ind
us
try
Percentage share of industry value add by Business Size
Small
Medium
Large

Australian Small Business and Family Enterprise Ombudsman | Small Business in the Australian Economy 15
2.3 Small business employment
In 2013-14, small business employed 4.7 million people (44 per cent of total employment) and generated 40 per
cent of new jobs in the economy2. While small business employment grew by nearly 200,000 in the 6 years from
2008-09 to 2013-14, its share of total employment declined marginally from 46 per cent in 2008-09 to 44 per cent
in 2013-14. The share of employment in medium-sized businesses remained at 24 per cent. Although big business
increased its share of total employment from 30 per cent in 2008 to 32 per cent in 2013-14, small business was
still the largest employing sector with 1.3 million (39 per cent) with more employees than large businesses.
Table 7: Employment by business size
Size 2008-09 2009-10 2010-11 2011-12 2012-13 2013-14
('000) % ('000) % ('000) % ('000) % ('000) % ('000) %
Small 4,556 46 4,731 47 4,781 45 4,626 43 4,576 43 4,722 44
Medium 2,333 24 2,337 23 2,558 24 2,734 26 2,679 25 2,608 24
Large 2,920 30 2,988 30 3,197 30 3,312 31 3,382 32 3,395 32
Total 9,809
10,056
10,536
10,672
10,637
10,725 Source: ABS Catalogue No. 8155.0 Australian Industry 2013-14 Page 5, ASBFEO Calculations.
Chart 6: Employment by business size
Source: ABS Catalogue No. 8155.0 Australian Industry 2013-14 Page 5, ASBFEO Calculations
2 See Department of Industry, Office of the Chief Economist, Research Paper 4/2015, The employment dynamics of Australian entrepreneurship.
0
2,000,000
4,000,000
6,000,000
8,000,000
10,000,000
12,000,000
2008-09 2009-10 2010-11 2011-12 2012-13 2013-14
Em
plo
yees
Year
Employment by Business Size
Large
Medium
Small

Australian Small Business and Family Enterprise Ombudsman | Small Business in the Australian Economy 16
The vast majority (63 per cent) of small businesses are sole traders with no employees at all. Of the rest, 9 per
cent of small businesses have one employee, and that sole employee is likely to be the owner. Another 7 per cent
of small businesses have two employees.
Chart 7: Number of employees by percentage of small businesses
Source: ATO data set 2013 year, ASBFEO Calculations (excludes nano businesses with no GST role)
The few small businesses employing 10 people or more, cumulatively comprise 7 per cent of total small
businesses by number, but employ the majority (60 per cent) of people employed by small businesses overall. In
the same year 49 per cent of employees of small businesses earnt less than $20,000 - a reflection of the high rate
of part time employment in small businesses.
Chart 8: Average salary per employee
Source: ATO data set 2013 year, ASBFEO Calculations (excludes nano businesses with no GST role)
0%
10%
20%
30%
40%
50%
60%
70%
0 1 2 3 4 5 6 7 8 9 10
Perc
en
tag
e
Count of Employees
Number of employees per entity by % of small businesses
0%
5%
10%
15%
20%
25%
30%
%
Average Salary $
Average Salary per Employee by percentage count & employee
Count
Employee

Australian Small Business and Family Enterprise Ombudsman | Small Business in the Australian Economy 17
In 2013-14, small business with less than 20 employees employed over 4.7 million people or 44 per cent of the
total private sector workforce. A further 2.6 million people were employed in medium-sized businesses with less
than 200 employees. In total, twice as many people are employed in small and medium sized businesses then in
large business.
Table 8: Employment by industry 2013-14
Industry Sector Small business
'000
Medium business
'000
Large business
'000
Total employment
‘000
Small business Share
%
Agriculture, forestry and fishing 421 73 19 513 82%
Mining 20 28 139 187 11%
Manufacturing 272 284 323 879 31%
Electricity, gas, water and waste services 15 21 78 114 13%
Construction 669 230 175 1,073 62%
Wholesale trade 232 167 170 569 41%
Retail trade 482 196 592 1,270 38%
Accommodation and food services 384 319 213 915 42%
Transport, postal and warehousing 224 98 249 571 39%
Information Media and Telecommunications
34 28 102 165 21%
Rental, hiring and real estate services 315 56 32 403 78%
Professional, scientific and technical services
506 259 201 966 52%
Administrative and support services 336 252 319 908 37%
Public administration and safety (private) 19 28 35 82 23%
Education and training (private) 88 146 146 380 23%
Health care and social assistance (private)
307 253 464 1,025 30%
Arts and recreation services 77 65 74 217 35%
Other services 322 104 63 489 66%
Total selected industries 4,723 2,607 3,394 10,726
Source: ABS Catalogue No. 8155.0, Australian Industry 2014-14 Page 5, ASBFEO Calculations

Australian Small Business and Family Enterprise Ombudsman | Small Business in the Australian Economy 18
In proportionate terms, small business was most significant in the Agriculture, forestry and fishing industries where
they provided 82 per cent of total employment. Other industries where small business employed more than half the
total industry employment were Rental, hiring and real estate services (78 per cent); Other services (66 per cent);
Construction (62 per cent) and Professional, scientific and technical services (52 per cent).
Chart 9: Employment by industry ranked by small business proportionate share - 2013-14
Source: ABS Catalogue No. 8155.0 Australian Industry 2013-14 Page 5, ASBFEO Calculations
Small business was least significant in the Mining (10 per cent); Electricity, gas, water and waste services (15 per
cent); and Information, Media and telecommunications (21 per cent) industries, which are heavily capitalised
sectors and characterised by high entry barriers and large economies of scale. These industries are dominated by
large firms which provide 60-75 per cent of total employment.
0% 20% 40% 60% 80% 100%
Mining
Electricity, gas, water and waste services
Information Media and Telecommunications
Education and training (private)
Public administration and safety (private)
Health care and social assistance (private)
Manufacturing
Arts and recreation services
Administrative and support services
Retail trade
Transport, postal and warehousing
Wholesale trade
Accommodation and food services
Professional, scientific and technical services
Construction
Other services
Rental, hiring and real estate services
Agriculture, forestry and fishing
%
Ind
us
try
Employment by industry proportionate share
Small
Medium
Large

Australian Small Business and Family Enterprise Ombudsman | Small Business in the Australian Economy 19
In absolute terms, the industries with the most small business employment are Construction (669,000);
Professional, scientific and technical services (506,000); Retail trade (482,000); Agriculture, forestry and fishing
(421,000); Accommodation and food services (384,000); and Rental, hiring and real estate services (315,000).
Chart 10: Total employment by industry ranked by small business numbers - 2013-14
Source: ABS Catalogue No. 8155.0 Australian Industry 2013-14 Page 5, ASBFEO Calculations
The least significant small business sectors are Information, Media and telecommunications (34,000 employees);
Mining (20,000 employees), Public administration and safety (19,000) and Electricity, gas, water and waste
management services.
0 200 400 600 800 1,000 1,200 1,400
Electricity, gas, water and waste services
Public administration and safety (private)
Mining
Information Media and Telecommunications
Arts and recreation services
Education and training (private)
Transport, postal and warehousing
Wholesale trade
Manufacturing
Health care and social assistance (private)
Rental, hiring and real estate services
Other services
Administrative and support services
Accommodation and food services
Agriculture, forestry and fishing
Retail trade
Professional, scientific and technical services
Construction
'000s
Ind
us
try
Employment by industry
Small
Medium
Large

Australian Small Business and Family Enterprise Ombudsman | Small Business in the Australian Economy 20
Looking at the survival of businesses over a four year period, of the 2.1 million firms in business in June 2011, only
1.3 million or 62 per cent) were still in business in 2015.
Table 9: Business survival rates 2011 to 2015
Employment Size Businesses operating
in June 2011 (count)
Survived to June 2015
(count)
Survival rate %
Non-employing (a) 1,306,023 733,946 56
1–4 employees 581,741 394,746 68
5–19 employees 191,812 147,698 77
20–199 employees 49,302 40,284 82
200+ employees 3,534 2,932 83
Total employing (b) 826,389 585,660 71
Total (a + b) 2,132,412 1,319,606
Source: ABS Counts of Australian Business 8165.0, Feb 2016 and ASBFEO calculations.
It would seem that sole operators with no employees are the most short-lived with a survival rate of only 56 per
cent. Survival rates increase with firm size: micro businesses with 1 to 4 employees had a survival rate of 68 per
cent. Small businesses with 5-19 employees had a survival rate of 77 per cent, medium sized firms had a survival
rate of 82 per cent. The largest firms with over 200 employees had the highest survival rate of 83 per cent.
Chart 11: Businesses operating in 2011 and 2015
Source: ABS Counts of Australian Business 8165.0, Feb 2016 and ASBFEO calculations.
0
500,000
1,000,000
1,500,000
2,000,000
2,500,000
Co
un
t
Size of Business
Business survival rate
BusinessesOperating in June2011
Survived to June2015

Australian Small Business and Family Enterprise Ombudsman | Small Business in the Australian Economy 21
3 Innovative behaviour
3.1 Small business innovation
Small businesses are often innovative, however, the propensity to engage in innovative activity, increases with
size. While only 40 per cent of micro businesses and 60 per cent of small businesses engaged in innovative
activity in 2013-14, 67 per cent of medium businesses and 80 per cent of large businesses reported undertaking at
least some innovative activity.
Large businesses generally have greater resources to spend on innovative processes such as research and
development. The relative advantage of large businesses is least in bringing new goods and services to market. In
2013-14, 31 per cent of small businesses were involved in product innovation compared to 35 per cent of large
businesses. The disparity between small and large business’ innovative behaviour is greatest in the area of
operational processes, where large businesses were twice as likely to be involved in innovation as small
businesses.
Table 10: Business innovation by activity and size 2013-14
Innovation activity - new or improved: 0–4 persons 5–19 persons 20–199
persons 200 or more persons
% % % %
Goods/services 19 31 34 35
Operational processes 13 22 34 44
Organisation/managerial processes 16 29 39 53
Marketing methods 16 26 31 40
Any innovative activity 40 60 67 80
Source: ABS Catalogue No. 81670: Characteristics of Australian Business 2013-14 – Summary.
3.2 Commercialising research
An issue for the commercialisation of innovation is the limited transfer of ideas between higher education
institutions and business. The ABS survey on Innovation in Australian Business3 found that only three per cent of
small to medium enterprises (SMEs) sourced ideas and information for innovation from the tertiary education
sector (see Table 10). By contrast, SMEs were around ten times more likely to have sourced ideas from their
competitors and other businesses in the same sector (also Table 11). A larger proportion of SMEs may also have
sourced ideas indirectly from the tertiary education sector through, for example, journals and research papers.
However, the figures strongly suggest that there is generally poor transference of ideas and information from the
tertiary education sector to small and medium sized businesses.
Small business is also less likely to collaborate on innovation than large business. The differences are most
pronounced in Agriculture, forestry and fishing, where 82 per cent of big businesses collaborate, compared to
28 per cent of small businesses; and Finance and insurance services where 46 per cent large businesses
collaborate compared to only 16 per cent for small business.
3 ABS: 8158.0 – Innovation in Australian Business, 2012-13.

Australian Small Business and Family Enterprise Ombudsman | Small Business in the Australian Economy 22
Table 11: Source of ideas for innovation for small to medium businesses - 2012-13
Source of idea 0-4 persons %
5-19 persons %
20-199 persons %
Within the business or related company 55 62 68
Clients, customers or buyers 42 37 46
Suppliers 25 27 36
Competitors and other businesses from the same industry 28 31 36
Consultants 16 21 29
Universities or other higher education institutions 3 3 3
Government agencies 3 2 5
Private non-profit research institutes 1 np 1
Commercial laboratories & research and development enterprises 1 1 1
Websites, journals, research papers, publications 31 28 29
Professional conferences, seminars, meetings, trade shows 21 25 27
Industry associations 16 16 24
Source: ABS: 8158.0 – Innovation in Australian Business, 2012-13.
3.3 Small businesses innovation and national productivity
Productivity, measured as output per hour worked, or output per dollar of capital invested, indicates how efficiently
the Australian economy is turning inputs into outputs. Productivity grows as innovation spreads through an
industry; as firms invest in more advanced technology, and as competition drives the success of more efficient
firms and the failure of others. In 2013-14, only 28 per cent of small businesses reported improvements in
productivity compared to 36 per cent of large firms.
Table 12: Businesses reporting improved performance compared to previous year, 2013-14
Activity 0–4 persons 5–19 persons 20–199 persons 200 + persons
Increases in: % of businesses % of businesses % of businesses % of businesses
Sales 31 41 55 62
Profitability 22 30 37 46
Employment 7 22 41 44
Export markets 1 2 3 9
IT investment 13 23 38 43
Productivity 17 28 35 36
Source: ABS Cat No. 8167.0 Selected Characteristics of Australian Business, 2013-14 and ASBFEO calculations.
Measured in absolute numbers, small business is very involved in innovation – they are more likely to innovate
and bring new goods and services to a market. The overwhelming majority of innovative firms are small
businesses: in 2012-13, 285,000 small firms reported they engaged in innovative activity, compared with 2,972
large firms.
Small businesses often pioneer new technologies or work practices, before they spread more broadly through an
industry. Modern definitions of entrepreneurship emphasise a strong link between entrepreneurship and innovation
and distinguish entrepreneurship from simple form of management. As far back as 1934, Schumpeter, in his
classical analysis of capitalist society The Theory of Economic Development, for example, emphasised the role of
the entrepreneur and associated ‘gales of creative destruction’.

Australian Small Business and Family Enterprise Ombudsman | Small Business in the Australian Economy 23
Chart 12 Businesses reporting improved performance compared to previous year - 2013-14
Source: ABS Cat No.: 8167.0 Selected Characteristics of Australian Business, 2013-14 and ASBFEO calculations.
Table 13: Performance improvements for innovative and non-innovative small businesses - 2013-14
Activity increases in: Innovative small firms % Non-innovative small firms %
Sales 46 34
Profitability 35 23
Employment 26 15
IT investment 32 9
Productivity 34 18
Source: ABS Cat No.: 81670 Selected Characteristics of Australian Business, 2013-14 and ASBFEO calculations.
Chart 13 Performance improvements for innovative vs non-innovative small businesses, 2013-14
Source: ABS Cat No.: 81670 Selected Characteristics of Australian Business, 2013-14 and ASBFEO calculations.
0 10 20 30 40 50 60 70
Sales
Profitability
Employment
Export markets
IT investment
Productivity
%
Are
a
Businesses reporting improved performance compared to prior year
200 + persons
20–199 persons
5–19 persons
0–4 persons
0 10 20 30 40 50
Sales
Profitability
Employment
IT investment
Productivity
% increase on prior year
Are
a
Comparison of performance improvements
Non innovative smallfirms
Innovative smallfirms
Australian Small Business and Family Enterprise Ombudsman | Small Business in the Australian Economy 24
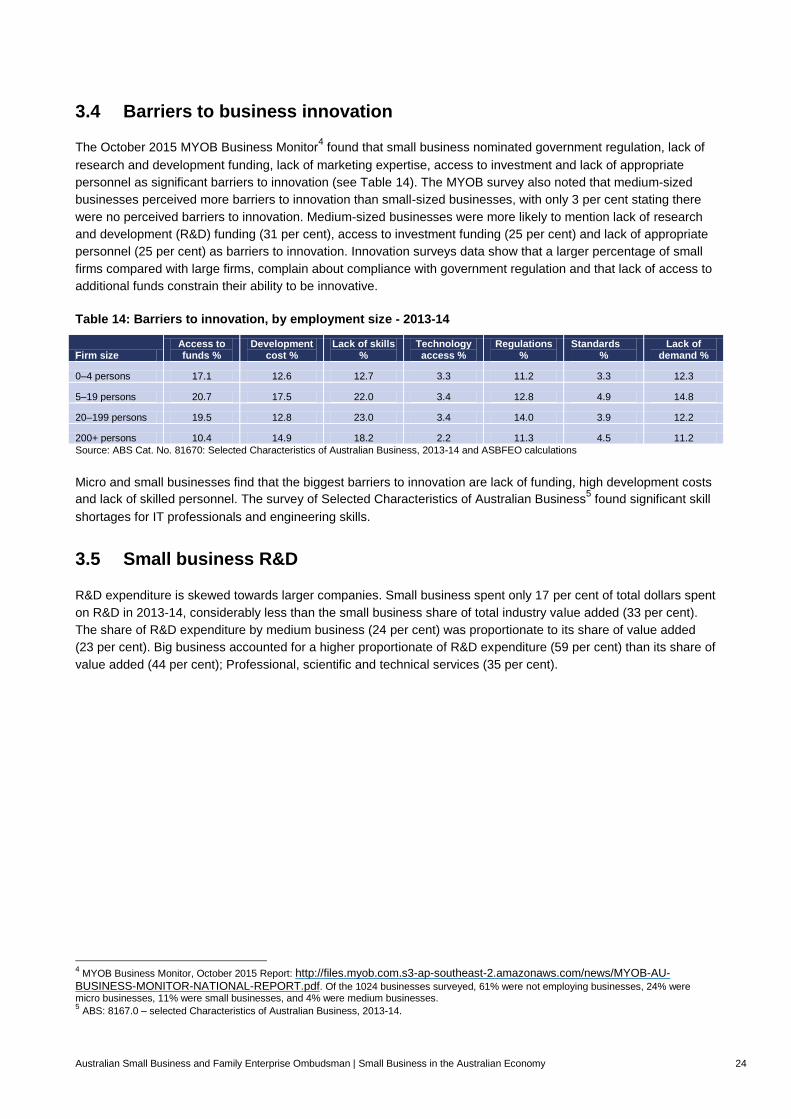
3.4 Barriers to business innovation
The October 2015 MYOB Business Monitor4 found that small business nominated government regulation, lack of
research and development funding, lack of marketing expertise, access to investment and lack of appropriate
personnel as significant barriers to innovation (see Table 14). The MYOB survey also noted that medium-sized
businesses perceived more barriers to innovation than small-sized businesses, with only 3 per cent stating there
were no perceived barriers to innovation. Medium-sized businesses were more likely to mention lack of research
and development (R&D) funding (31 per cent), access to investment funding (25 per cent) and lack of appropriate
personnel (25 per cent) as barriers to innovation. Innovation surveys data show that a larger percentage of small
firms compared with large firms, complain about compliance with government regulation and that lack of access to
additional funds constrain their ability to be innovative.
Table 14: Barriers to innovation, by employment size - 2013-14
Firm size Access to funds %
Development cost %
Lack of skills %
Technology access %
Regulations %
Standards %
Lack of demand %
0–4 persons 17.1 12.6 12.7 3.3 11.2 3.3 12.3
5–19 persons 20.7 17.5 22.0 3.4 12.8 4.9 14.8
20–199 persons 19.5 12.8 23.0 3.4 14.0 3.9 12.2
200+ persons 10.4 14.9 18.2 2.2 11.3 4.5 11.2
Source: ABS Cat. No. 81670: Selected Characteristics of Australian Business, 2013-14 and ASBFEO calculations
Micro and small businesses find that the biggest barriers to innovation are lack of funding, high development costs
and lack of skilled personnel. The survey of Selected Characteristics of Australian Business5 found significant skill
shortages for IT professionals and engineering skills.
3.5 Small business R&D
R&D expenditure is skewed towards larger companies. Small business spent only 17 per cent of total dollars spent
on R&D in 2013-14, considerably less than the small business share of total industry value added (33 per cent).
The share of R&D expenditure by medium business (24 per cent) was proportionate to its share of value added
(23 per cent). Big business accounted for a higher proportionate of R&D expenditure (59 per cent) than its share of
value added (44 per cent); Professional, scientific and technical services (35 per cent).
4 MYOB Business Monitor, October 2015 Report: http://files.myob.com.s3-ap-southeast-2.amazonaws.com/news/MYOB-AU-
BUSINESS-MONITOR-NATIONAL-REPORT.pdf. Of the 1024 businesses surveyed, 61% were not employing businesses, 24% were micro businesses, 11% were small businesses, and 4% were medium businesses. 5 ABS: 8167.0 – selected Characteristics of Australian Business, 2013-14.

Australian Small Business and Family Enterprise Ombudsman | Small Business in the Australian Economy 25
Chart 14: Small business share of total business research and development spending - 2013-14
Source: ABS Cat. No. 81040 Research and Experimental Development, Businesses, Australia, 2013-14.
There are several industries in which the small business share of R&D expenditure is greater than its share of
value added. These are rental, hiring and real estate services (54 per cent of industry R&D spend); health care
and social assistance (44 per cent of industry R&D); and education and training (35 per cent of industry R&D).
Table 15: Business expenditure on R&D by industry and firm size - 2013-14
Industry
Small business
$m
Medium business
$m
Large business
$m
Total industry R&D $m
Small business share %
Agriculture, forestry and fishing 58 123 62 243 24
Mining 390 469 1972 2830 14
Manufacturing 514 1214 3116 4844 11
Electricity, gas, water and waste services 64 23 228 315 20
Construction 127 107 630 864 15
Wholesale trade 168 346 446 960 18
Retail trade 76 70 96 242 32
Accommodation and food services* 2 8 0 24 9
Transport, postal and warehousing 19 30 314 363 5
Information media and telecommunications 106 111 358 575 19
Financial and insurance services 79 212 2802 3093 3
Rental, hiring and real estate services 73 39 24 136 54
Professional, scientific and technical services 1363 1592 798 3753 36
Administrative and support services 34 69 125 228 15
Public administration and safety* 4 15 0 27 15
Education and training* 9 11 0 25 35
Health care and social assistance 33 32 9 74 44
Arts and recreation services 8 41 64 113 7
Other services 50 49 43 141 35
Total 3182 4561 11107 18850 Source: ABS Cat. No. 81040 Research and Experimental Development, Businesses, Australia, (Sept. 2015). * includes data not available for
publication but included in total.
17%
24% 59%
R&D spend
Small Business Medium Business Large Business

Australian Small Business and Family Enterprise Ombudsman | Small Business in the Australian Economy 26
Looking at the magnitude of R&D expenditure in dollar terms, the industries where small business spends the
most on R&D are: professional, scientific and technical services $1,363 million; manufacturing $514 million; mining
$390 million; wholesale trade $168 million; and construction $127 million.
Chart 15: Business expenditure on R&D by industry and firm size - 2013-14 (logarithmic scale)
Source: ABS Cat. No. 8104.0 Research and Experimental Development, Businesses, Australia, 2013-14.
The industries where small business R&D expenditure is most significant in proportionate terms are Rental, hiring
and real estate services (54 per cent of industry R&D); Health care and social assistance (44 per cent)
Professional, scientific and technical services (36 per cent) and Education and training (35 per cent).
1 10 100 1000 10000
Accommodation and Food Services
Public Administration and Safety
Arts and Recreation Services
Education and Training
Transport, Postal and Warehousing
Health Care and Social Assistance
Administrative and Support Services
Other Services
Agriculture, Forestry and Fishing
Electricity, Gas, Water and Waste Services
Rental, Hiring and Real Estate Services
Retail Trade
Financial and Insurance Services
Information Media and Telecommunications
Construction
Wholesale Trade
Mining
Manufacturing
Professional, Scientific and Technical Services
$m
Ind
ustr
y
Business R&D spend by industry and size
Small Business
Medium Business
Large Business

Australian Small Business and Family Enterprise Ombudsman | Small Business in the Australian Economy 27
Chart 16: Business expenditure on R&D by industry and size - 2013-14
Source: ABS Cat. No. 8104.0 Research and Experimental Development, Businesses, Australia, 2013-14
0% 20% 40% 60% 80% 100%
Financial and Insurance Services
Transport, Postal and Warehousing
Arts and Recreation Services
Manufacturing
Mining
Construction
Administrative and Support Services
Wholesale Trade
Information Media and Telecommunications
Electricity, Gas, Water and Waste Services
Public Administration and Safety
Accommodation and Food Services
Agriculture, Forestry and Fishing
Retail Trade
Other Services
Professional, Scientific and Technical Services
Education and Training
Health Care and Social Assistance
Rental, Hiring and Real Estate Services
%
Ind
ustr
y
Business R&D Expenditure by industry and size proportionate share
Small Business
Medium Business
Large Business

Australian Small Business and Family Enterprise Ombudsman | Small Business in the Australian Economy 28
4 Small business exports
This chapter examined the available data on small business exports. The data comes from the ABS publication
Characteristics of Australian Exporters, 2013-146. While this survey provides data on the number of small business
exporters of goods and the value of their exports, it does not provide any data on small business exporters of
services.
4.1 Number of small business exporters
It is sometimes assumed that only large companies are capable of penetrating export markets but this is simply
not true. In 2013-14 there were 19,965 small businesses exporting goods, representing 44 per cent of all
businesses exporting goods. In recent years we are seeing increasing numbers of small firms that are ‘born
global’, meaning that they are exporting from the very beginning7.
Chart 17: Proportion of goods exporting businesses by size 2013-14
Source: ABS 5368.0.55.006 – Characteristics of Australian Exporters, 2013-14: ASBFEO calculations.
The number of small businesses which are exporting has been growing since 2006-7. But they have also been
growing as a proportion of exporting businesses. In 2006-07 small businesses made up 39 per cent of exporting
businesses. By 2013-14, that had grown to 44 per cent. It is likely that this trend has largely resulted from the
enhanced ability of small business to reach global markets using the Internet; however no data is available to
confirm this.
6 ABS 5368.0.55.006 – Characteristics of Australian Exporters, 2013-14. 7 Counts of Australian Business, ABS 8165.0, 2 March 2015 http://www.abs.gov.au/ausstats/[email protected]/mf/8165.0.
Large Business 9.9%
Medium Business 46.1%
Small Business 44.1%
Proportion of Goods Exporting businesses by size

Australian Small Business and Family Enterprise Ombudsman | Small Business in the Australian Economy 29
Table 16: Number of small business exporters of goods
Business Size
2006-07 2007-08 2008-09 2009-10 2010-11 2011-12 2012-13 2013-14
Large business
4,375 4,411 5,932 4,274 4,207 4,206 4,211 4,474
Medium business
21,666 21,670 20,787 20,857 20,753 20,577 20,464 20,867
Small business
16,613 17,017 16,540 17,521 17,774 18,297 18,370 19,965
Total exporters
42,654 43,098 43,259 42,652 42,734 43,080 43,045 45,306
% Small business
38.9 39.5 38.2 41.1 41.6 42.5 42.7 44.1
Source: ABS 5368.0.55.006 – Characteristics of Australian Exporters, 2013-14: ASBFEO calculations.
The proportion of exporting businesses which are small businesses varies across industries. Small business
exporters make up a larger proportion of exporters in the Retail trade (43 per cent), Construction (41 per cent) and
Agriculture, forestry and fishing (40 per cent) industries but make up a much smaller proportion of Manufacturing
(30 per cent) and Mining (15 per cent) exporters (Chart 18). The proportion of small business exporters in each
industry sector are less than the overall proportion because 6,664 small business exporters (28 per cent) do not
have an ABN and are not included in the figures for individual industries, while few medium or large businesses
are in this position.8
Chart 18: Proportion of small business exporters by number – 2013-14
Source: ABS 5368.0.55.006 – Characteristics of Australian Exporters, 2013-14: ASBFEO calculations.
4.2 Value of small business exports
While the number of small businesses which are exporters is significant, their contribution to the total value of
exports is relatively small. In total, small business contributes only $1.4 billion to the value of exports out of a total
of $273 billion.
8 ABS 5368.0.55.006 – Characteristics of Australian Exporters, 2013-14: ASBFEO calculations.
0% 20% 40% 60% 80% 100%
Mining
Manufacturing
Transport, postal and warehousing
Other
Wholesale Trade
Agriculture, forestry and fishing
Construction
Retail Trade
Ind
us
try
Proportion of Small Business Exporters by number
Small Business Medium Business Large Business

Australian Small Business and Family Enterprise Ombudsman | Small Business in the Australian Economy 30
Chart 19: Contribution of small business to the total value of goods
Source: ABS 5368.0.55.006 – Characteristics of Australian Exporters, 2013-14: ASBFEO calculations.
The value of small business goods exports is greatest in Wholesale trade ($480 million) followed by Manufacturing
($229 million) and Retail trade ($102 million). Chart 20 sets out the value of exports in each industry by size of
business. Note that because of the low total value of small business exports, this Chart uses a logarithmic scale to
emphasise the small business contribution.
Chart 20: Small business goods exports by industry 2013-14, by value - $m (logarithmic scale)
Note: ‘Other (b)’ in Chart 20 includes goods exporters in Electricity, gas, water and waste services; Accommodation and food services; Information, media and telecommunications; Financial and insurance services; Rental, hiring and real estate services; Professional, scientific and technical services; administrative and support services; Public administration and safety; Education and training; Health, care and social assistance; Arts and recreation services; as well as businesses that lack a classification under ANZSIC 2006 and businesses yet to confirm their main industry of activity with the ATO.
Source: ABS Cat No. 5368.0 - Characteristics of Australian Exporters, 2013-14 (Jun 2015) and ASBFEO calculations.
Large Business 95.1%
Medium Business 4.4%
Small Business 0.5%
Total value of goods exported contribution by size
1 10 100 1,000 10,000 100,000 1,000,000
Mining
Construction
Agriculture, forestry and fishing
Transport, postal andwarehousing
Retail Trade
Manufacturing
Other (b)
Wholesale Trade
$ million
Ind
us
try
Small Business Exports by industry and value
Smallbusiness
Mediumbusiness
Largebusiness

Australian Small Business and Family Enterprise Ombudsman | Small Business in the Australian Economy 31
The small business exports as a proportion of the exports for each industry varies. While the total value of small
business goods exports is largest in the wholesale trade, the contribution to each industry as a proportion of that
industry exports is different. As a proportion of each industry’s small business makes the greatest contribution to
exports in the construction industry (4 per cent) and the retail trade (3 per cent) while it contributes only $12 million
to mining exports (Table 17 and Chart 21).
Chart 21: Contribution of small business exporters to each industry category
Source: ABS 5368.0.55.006 – Characteristics of Australian Exporters, 2013-14: ASBFEO calculations.
Table 17: Value of goods exports, by industry and business size 2013-14
Goods exporters with an ABN by Industry
Small business
$m
Medium business
$m
Large business
$m
Total exports
$m
Small business. share
%
Agriculture, forestry and fishing 39 559 5,410 6,008 0.6
Mining 12 323 152,902 153,237 -
Manufacturing 229 3,417 34,193 37,839 0.6
Construction 36 208 740 985 3.7
Wholesale trade 480 4,464 31,110 36,054 1.3
Retail trade 102 573 3,041 3,716 2.7
Transport, postal and warehousing 51 507 2,393 2,952 1.7
Other (b) 267 1,724 28,975 30,966 0.9
All goods exporters with an ABN 1,216 11,776 258,764 271,756 0.4
Goods exporters without an ABN 208 183 773 1,164 17.9
All Industries (c) 1,424 11,959 259,537 272,921
Source: ABS Cat No. 5368.0 - Characteristics of Australian Exporters, 2013-14 (Jun 2015) and ASBFEO calculations.
0.0% 0.5% 1.0% 1.5% 2.0% 2.5% 3.0% 3.5% 4.0%
Mining
Manufacturing
Agriculture, forestry and fishing
Other
Wholesale Trade
Transport, postal and warehousing
Retail Trade
Construction
Contribution of small business exporters by industry category
Small Business

Australian Small Business and Family Enterprise Ombudsman | Small Business in the Australian Economy 32
5 Tax contribution
Table 18: Company tax revenue by business size
Business size classed by revenue
2010-2011 2011-2012 2012-2013
$m % $m % $m %
Small (<$2m) 6,631 10 7,105 11 7,491 12
Medium ($2m - $100m) 13,680 22 14,124 22 14,735 23
Large (>$100m) 42,712 68 42,923 67 42,304 65
Total 63,023 100 64,152 100 64,530 100 Source: ATO tax data and ASBFEO calculations.
Chart 22: Share of company tax revenue by business size
Source: ATO tax data and ASBFEO calculations (2012/13 year).
5.1 Understanding the tax contribution of small businesses
The use of entity level data can produce a misleading picture of the overall tax contribution of small business. The
interplay of individual, partnership, trust, company, and superfund aspects of family enterprise tax planning
enormously complicates the picture of what the small ‘economic group’ earns, the taxes paid, and total of
government assistance received by individuals (while significant for very small businesses there is no data on this
in this report). Keeping this caveat in mind, the following table (Table 19) illustrates the importance of the size of
the small business (at an entity level) on the taxes paid and employment.
Table 19: Key numbers by annual turnover in 2012-13
Turnover %. of small businesses
% income tax paid by small business
% net GST paid by small businesses
% employees of small business
$0 to less than $50k 27% 13% -1% 2%
$50k to less than $200k 34% 19% 13% 8%
$200k to less than $2m 36% 53% 64% 66%
$2m to less than $5m 4% 15% 24% 24%
Total 100% 100% 100% 100%
Source: ATO sample dataset for 2013 year and ASBFEO calculations (excludes nano businesses with no GST role), Entity level data.
12%
23%
65%
Share of company income tax revenue %
Small business Medium business Large business

Australian Small Business and Family Enterprise Ombudsman | Small Business in the Australian Economy 33
5.2 Small business industry benchmarks
The ATO publishes small industry benchmarks to assist in the comparison of a business performance against
potentially similar businesses in the same industry. The benchmarks:
are calculated from income tax returns and activity statements from over 1.3 million small businesses;
account for businesses with different turnover ranges (greater than $30,000 and less than $15 million) across more than 100 industries, and
are published as a range to recognise the variations that occur between businesses due to factors such as location and the businesses circumstances.
The approach used excludes the distortionary impact of industry outliers from the benchmark calculation process.
The benchmarks can be found at: https://www.ato.gov.au/Business/Small-business-benchmarks/In-
detail/Benchmarks-by-industry/
Table 20: Example benchmark data – takeaway food services 45120 (excluding restaurants)
2013-14 Financial Year Annual turnover range ‘000
$65-$200 $200-$600 >$600
Cost of sales/turnover 34%-41% 36%-44% 34%-41%
Average cost of sales 37% 40% 37%
Total expenses/turnover 76%-85% 81%-90% 88%-94%
Average total expenses 81% 86% 91%
Labour/turnover 14%-21% 13%-21% 19%-25%
Rent/turnover 15%-23% 11%-19% 8%-14%
Source: https://www.ato.gov.au/Business/Small-business-benchmarks/In-detail/Benchmarks-A-Z/R-Z/Takeaway-food-services/
Australian Small Business and Family Enterprise Ombudsman | Small Business in the Australian Economy 34
6 Women in small business
There is limited data about the role of women in small business. The ABS data on the Counts of Australian
Businesses9 does not show the gender of the business owner or manager. The ABS Labour Force data does show
the number of people working as business owner/managers broken down by sex. This data relates to all
businesses, not just small business. Nevertheless, as over 97 per cent of all businesses are small businesses, this
data should provide a good indication of the proportion of women who are owner/managers of small businesses.
Private surveys provide another source of data on women in small business. These surveys are often prepared by
accounting firms, industry organisations and academics. Much of the available data which comes from private
surveys is focussed on family businesses. However, as family businesses constitute around 70 per cent of all
businesses and most businesses are small businesses that data can provide some guidance on issues relating to
women in small business.
The quality of the data from private surveys may not be highly reliable. In some series of surveys the results
appear to change more significantly from one survey to the next than would be expected. Nevertheless, some
general observations might be drawn from the available data.
6.1 Ownership and management
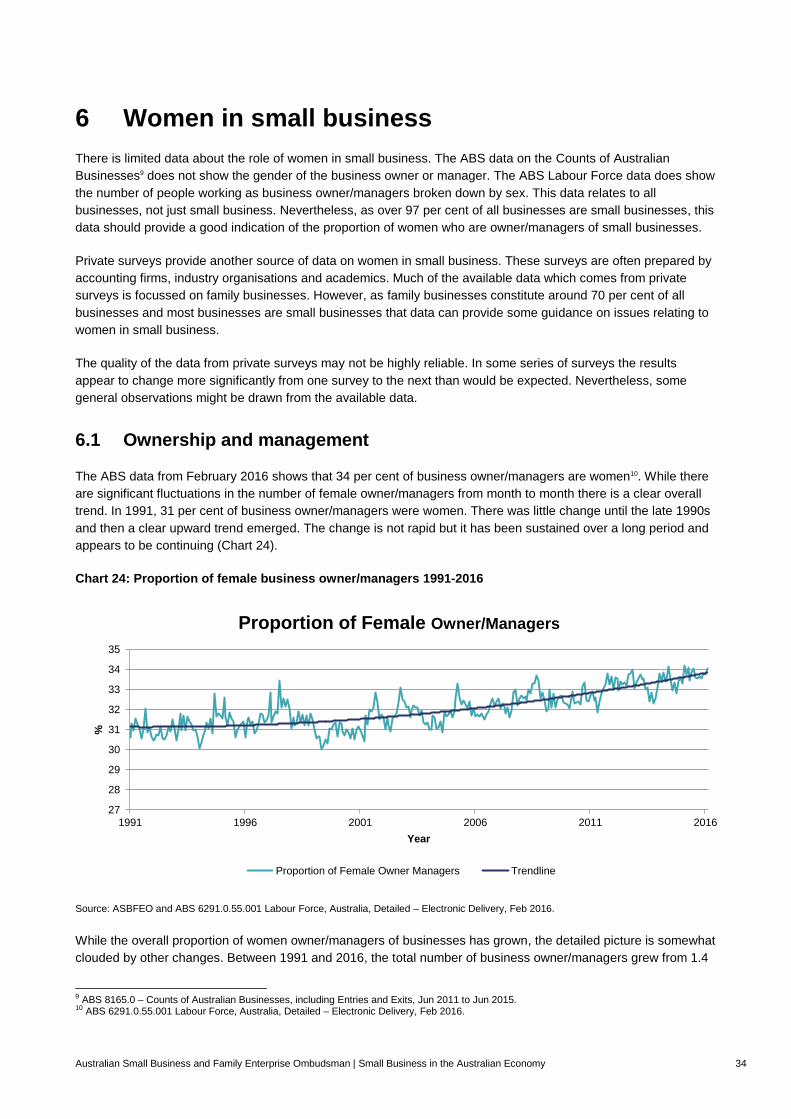
The ABS data from February 2016 shows that 34 per cent of business owner/managers are women10. While there
are significant fluctuations in the number of female owner/managers from month to month there is a clear overall
trend. In 1991, 31 per cent of business owner/managers were women. There was little change until the late 1990s
and then a clear upward trend emerged. The change is not rapid but it has been sustained over a long period and
appears to be continuing (Chart 24).
Chart 24: Proportion of female business owner/managers 1991-2016
Source: ASBFEO and ABS 6291.0.55.001 Labour Force, Australia, Detailed – Electronic Delivery, Feb 2016.
While the overall proportion of women owner/managers of businesses has grown, the detailed picture is somewhat
clouded by other changes. Between 1991 and 2016, the total number of business owner/managers grew from 1.4
9 ABS 8165.0 – Counts of Australian Businesses, including Entries and Exits, Jun 2011 to Jun 2015. 10 ABS 6291.0.55.001 Labour Force, Australia, Detailed – Electronic Delivery, Feb 2016.
27
28
29
30
31
32
33
34
35
1991 1996 2001 2006 2011 2016
%
Year
Proportion of Female Owner/Managers
Proportion of Female Owner Managers Trendline

Australian Small Business and Family Enterprise Ombudsman | Small Business in the Australian Economy 35
million to 2.1 million. That growth was most heavily concentrated among part-time owner/managers. The total
number of part-time owner managers grew by 129 per cent from 286,800 to 658,000 over this period. In contrast,
the total number of full time owner managers grew by only 25 per cent from 1,132,400 to 1,417,800. This
represents a significant change in the pattern of work by business owner/managers.
Historically, women have been much more likely to be part-time, rather than full-time owner/managers. In 1991,
while 30 per cent of owner/managers overall were women, they made up 72 per cent of part-time owner/managers
and only 20 per cent of full time owner/managers. Despite the rise in the proportion of part-time owner/managers
between 1991 and 2016, there was a shift towards a higher proportion of fulltime women owner/managers while
the proportion of women part-time owner/managers fell. The overall proportion of women rose from 30 per cent to
34 per cent and the proportion of women among full-time owner/managers rose from 20 per cent to 22 per cent
while the proportion of part-time women fell from 72 per cent to 59 per cent. (Chart 25)
Chart 25: Change in the proportion of female owner/managers from 1991 to 2016
Source: ASBFEO and ABS 6291.0.55.001 Labour Force, Australia, Detailed – Electronic Delivery, Feb 2016.
The labour force figures also show the gender breakdown between those who work in employing and non-
employing businesses, and between incorporated and unincorporated businesses. Women dominate every
category of part-time owner/managers comprising 52-72 per cent of part-time owner/managers in each category of
business. Among the individual categories of full time owner/managers women make up only 17-30 per cent
(Chart 26)11. It is noticeable that women make up a higher proportion of owner/managers in employing enterprises
than in non-employing enterprises. The distinction between incorporated and unincorporated businesses may, to
some extent, be artificial as many businesses operate through a combination of legal structures.
11 ASBFEO and ABS 6291.0.55.001 Labour Force, Australia, Detailed – Electronic Delivery, Feb 2016.
0
10
20
30
40
50
60
70
80
% Women Among Part-timeOwner/Managers
% Women Among Full-timeOwner/Managers
% Women Among AllOwner/Managers
%
Category
Comparison of Full-time Women Owners - 1991 to 2016
Percentage in 1991 Percentage in 2016

Australian Small Business and Family Enterprise Ombudsman | Small Business in the Australian Economy 36
Chart 26: Proportion of women part-time and full-time owners/managers by category
Source: ASBFEO and ABS 6291.0.55.001 Labour Force, Australia, Detailed – Electronic Delivery, Feb 2016.
Private surveys of small business and family business paint a different picture. Private surveys also show that the
majority of businesses are owned by men, but they show much lower proportions of women as owner/managers.
In 1994, for example, the PWC/CBA Monash survey found that only 5 per cent of family business owners were
women12. The much later 2013 MGI survey found that around 10 per cent of family business owner/managers were
female. But the figure for non-family businesses was even lower at 3 per cent13.
There is no data to indicate the reasons for this significant difference in findings. But it may be speculated that it is
the result of a significant difference in sample selection. The ABS data attempts to capture all members of the
labour force who report their occupation as business owner/manager. Private surveys usually select their sample
from the clients of large accounting firms, users of particular types of accounting software, or from businesses
covered by rating agencies such as Dun & Bradstreet. It is possible that the private surveys are biased towards
larger small businesses and medium businesses and that the proportions of women owner/managers in those
businesses are different to the overall figures for all businesses.
The reasons for going into business and the aspirations of women business owners can be different from those of
men. The February 2014 MYOB Business Monitor found that women were more likely to cite lifestyle change (43
per cent rather than 35 per cent overall) or making money from a hobby or interest (26 per cent rather than 20 per
cent overall) as reasons for starting a business.14 Similarly, the October 2015 MYOB survey found that the
long-term goals of owners are more likely to include making money from something that they are passionate about
for female owners (22 per cent) than for male owners (13 per cent).15
12 Smyrnios K, Romano C, The Price Waterhouse/Commonwealth Bank Family Business Survey 1994, p. 18. 13 Dana L, Smyrnios K & MGI, Surviving Not Thriving: The MGI Australian family and private business survey 2013, MGI, 2013, p. 16. 14 MYOB, MYOB Business Monitor, February 2014 Report, p. 27. 15 MYOB, MYOB Business Monitor, October 2015 Report, p. 22.
0
10
20
30
40
50
60
70
80
IncorporatedEnterprise With
Employees
IncorporatedEnterprise Without
Employees
UnincorporatedEnterprise With
Employees
UnincorporatedEnterprise Without
Employees
All businesses
%
Category
Part-time and Full-time Owner Managers 2016
% of WomenAmong Part-timeOwner/Managers
% of WomenAmong Full-timeOwner/Managers
% of WomenAmong AllOwner/Managers

Australian Small Business and Family Enterprise Ombudsman | Small Business in the Australian Economy 37
6.1.1 Business control
Women have historically not featured prominently as the chairs of company boards or as directors. The 2008
Family Business Survey found that 97 per cent of chairpersons were male.16 More recent surveys in 2009 and
2011 surveys put the figure for women as chairs much higher, at around 12 per cent (Table 21).
Business owners have recognised the ability of women as directors. The 1994 PWC/CBA Monash survey found
that 91 per cent of male and 97 per cent of female owners ranked women equally with men as directors.17 Despite
this the representation of women among directors of family businesses is not high. The 2009 Family Business
Survey found that 30 per cent of family business directors were female.18 In both 2011 and 2013 the Family
Business surveys (using slightly different criteria) found that only one-third of businesses had executive directors
who are female, with 36 per cent having female non-executive directors.19
Although the ability of female directors has been recognised and women make up a significant proportion of
directors of family companies, they are much less likely to be the chair of the board.
6.1.2 Business management
The 2015 Family Business Survey found that high performing family businesses were more likely to have a female
CEO.20 Despite this finding surveys have consistently found that there is a relatively low proportion of women
CEOs among family businesses.
Some of the earliest data on women in business comes from the 1994 PWC/CBA Monash survey of family
businesses. It found that only 3 per cent of first and 5 per cent of second generation family businesses had female
CEOs. Family businesses that were not managed by a family member did not involve any female CEOs.21 This is
despite 91 per cent of male and 97 per cent of female owners ranking women equally with men as directors.22
The latest Family Business Survey (2015) found that only 15 per cent of family business CEOs were female.
Earlier surveys in the same series found that 23 per cent of CEOs were female in 2013, and 14 per cent were
female in 2011.23 While the rapid change in the reported number of female CEOs may be puzzling, these figures
represent a significant increase from the 3-5 per cent figure reported in the 1994 PWC/CBA survey.24
The Family Business Surveys also reported a low proportion of female managers in family businesses. The
proportion fell from 40 per cent in 2011 to 25 per cent in 2013. In large family businesses the proportion was even
lower at 18 per cent.25
More data is available from the 2009 and 2011 Family Business Surveys. They provided a more detailed breakup
of the proportion of male and female senior officers in family businesses.
16 KPMG and Family Business Australia: Family Business Survey 2008, KPMG & Family Business Australia, 2008, p. 12. 17 Smyrnios K, Romano C, The Price Waterhouse/Commonwealth Bank Family Business Survey 1994, p. 18. 18 KPMG, Family Business Australia, KPMG and Family Business Australia Survey of Family Businesses 2009, p.11. 19 KPMG and Family Business Australia: Family Business Survey 2013, KPMG & Family Business Australia, 2013, p. 27. 20 Graves C, Thomas J, KPMG and Family Business Australia: Family Business Survey 2015, KPMG & Family Business Australia, 2015, p. 7. 21 Smyrnios K, Romano C, The Price Waterhouse/Commonwealth Bank Family Business Survey 1994, p. 18. 22 Smyrnios K, Romano C, The Price Waterhouse/Commonwealth Bank Family Business Survey 1994, p. 18. 23 KPMG and Family Business Australia: Family Business Survey 2013, KPMG & Family Business Australia, 2013, p. 27: KPMG and Family Business Australia: Family Business Survey 2011, KPMG & Family Business Australia, 2011. Cited in Graves C, Thomas J, KPMG and Family Business Australia: Family Business Survey 2015, KPMG & Family Business Australia, 2015, p. 19. 24 Graves C, Thomas J, KPMG and Family Business Australia: Family Business Survey 2015, KPMG & Family Business Australia, 2015, p. 7. 25 KPMG and Family Business Australia: Family Business Survey 2013, KPMG & Family Business Australia, 2013, p. 27.

Australian Small Business and Family Enterprise Ombudsman | Small Business in the Australian Economy 38
Table 21: Who holds the key positions in the family business 200926
Position Family Non-family
Female % Male % Female % Male %
CEO 12.12 85.23 0 2.65
Director 30.14 65.53 0.28 3.94
General manager 10.61 74.3 2.79 12.29
Owner/manager 16.43 82.16 0 1.41
Management team 21.39 47.76 10.95 19.9
Board chair 12.23 81.66 0 6.11
Member of board 18.05 69.92 2.26 9.77
Source: KPMG and Family Business Australia: Family Business Survey 2009, p11.
It is notable that in the 2009 data the proportion of non-family key position holders who are female is much lower
than among family key position holders. For example, roughly one in three family directors are women while only
one in fourteen non-family directors are women. The 2011 data on the gender of people in senior
management/governance positions shows somewhat different results for the proportion of women in some of
these positions.
Table 22: Family occupancy of senior management/governance positions 201127
Position Female % Male %
CEO/MD 14 86
Executive board member 37.5 62.5
Non-executive board member 36 64
Management team 40 62
Board chair 11.5 88.5
Source: KPMG and Family Business Australia: Family Business Survey 2011, p14.
The MGI Family and Business surveys (2003, 2006, 2010 and 2013) found that the participation of women as
owners and managers of family businesses remained at roughly 10 per cent over a period of ten years while the
involvement of daughters in the day to day running of business remained at roughly 9 per cent.
‘Disappointingly, a comparison of the four reports again highlights a lack of growth in the participation rate
of females as owners and managers of family businesses.28’
The 2013 MGI survey also found that while 90 per cent of family business owner-managers are male, the figure for
non-family businesses was even higher at 97 per cent.29
6.2 The next generation
Overall, the available data suggests that the proportion of women in senior positions has been rising, but very
slowly. A similar picture emerges from the data available on business succession.
There is a marked preference for sons, rather than daughters, to take over the family business. While now dated,
the 1994 PWC/CBA Monash survey found that among Family Business CEOs who were going to be replaced by a
26 KPMG, Family Business Australia, KPMG and Family Business Australia Survey of Family Businesses 2009, p.11. 27 KPMG, Family Business Australia, KPMG and Family Business Australia: Family Business Survey 2011, 2011, p. 14. 28 Dana L, Smyrnios K & MGI, Surviving Not Thriving: The MGI Australian family and private business survey 2013, MGI, 2013, p. 4, 6. 29 Dana L, Smyrnios K & MGI, Surviving Not Thriving: The MGI Australian family and private business survey 2013, MGI, 2013, p. 16.

Australian Small Business and Family Enterprise Ombudsman | Small Business in the Australian Economy 39
family member, 62 per cent will be replaced by a son compared to 8 per cent with a daughter.30 The preference for
sons to take over the role of CEO was, if anything, greater in 2006 than it was in 1994. In the 2006 survey appears
that sons are 10 times more likely to succeed the current CEO (75 per cent) than daughters (7 per cent).31
These relative differences appear to be reflective of the variance in involvement in the family business. The 2006
MGI survey found that more sons are involved in the day-to-day running of family firms (30 per cent) compared to
daughters (5 per cent).32
Table 23: Family members most involved in the family business, in relation to the owner 200633
Family members involved Overall
%
1st Generation Business
%
2nd Generation Business
%
3rd – 5th Generation Business
%
Spouse 53 60 28 17
Son 30 25 56 33
Daughter 5 4 4 22
Brother 3 2 2 11
Sister 0.4 - 2 -
Other 9 9 9 17
Source: MGI Australian Family & Private Business Survey 2006, p15.
The results for longer established businesses are revealing. In 1st and 2nd generation family businesses, many
more sons (25-56 per cent) are involved in day to day management than daughters (4 per cent).
Among 3rd-to-5th generation business the picture is significantly different. While sons are still more likely to be
involved in those businesses (33 per cent) the proportion of daughters (22 per cent) is much higher. This suggests
that longer established family businesses give a much greater role to daughters than newer businesses.
The 2010 MGI survey showed a significantly higher level of participation by female family members with 7 per cent
of current owners having daughters actively involved in the businesses and 2 per cent of business owners’ sisters
being involved in the business. Although the gap had narrowed sons were still five times more likely to be involved
in the family business than daughters and five times more likely to succeed the current CEO than daughters.34
The 2013 MGI survey cast some light on the perceptions of business owners and managers about the likely role of
women in future generations of small business.
Both male and female business owner/managers feel that daughters are not as interested as sons in being
actively involved in the family business. However, women had a more positive view of the involvement of
daughters than men. Significantly more women owner-managers (58 per cent) than men (42 per cent) believe that
daughters are as interested as sons to be actively involved in the family business and far fewer of them believe
that work-life balance considerations keep daughters from taking up top-level positions in the business.35
30 Smyrnios K, Romano C, The Price Waterhouse/Commonwealth Bank Family Business Survey 1994, p. 18. 31 RMIT University, The MGI Australian Family and Private Business Survey 2006, MGI, 2006, p. 4. 32 RMIT University, The MGI Australian Family and Private Business Survey 2006, MGI, 2006, p. 22. 33 RMIT University, The MGI Australian Family and Private Business Survey 2006, MGI, 2006, p. 15. 34 RMIT University, The MGI Australian Family and Private Business Survey 2010, MGI, 2010, p. 5. 35 Dana L, Smyrnios K & MGI, Surviving Not Thriving: The MGI Australian family and private business survey 2013, MGI, 2013, p. 26.
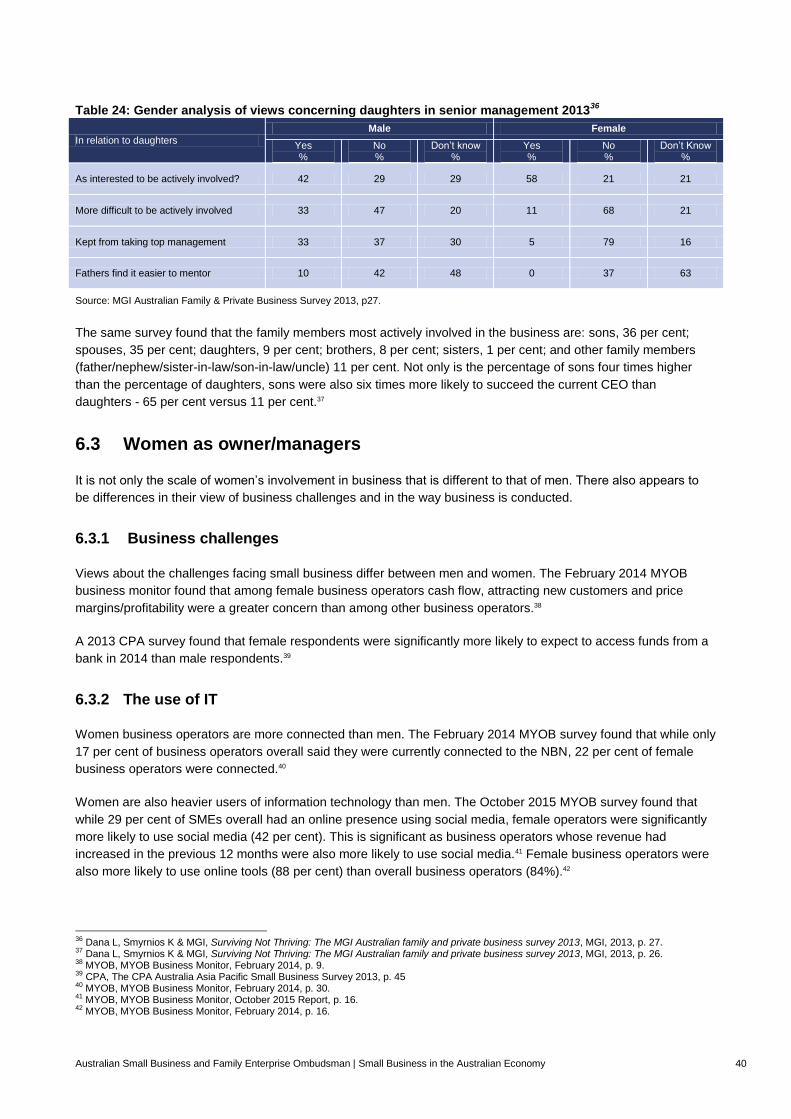
Australian Small Business and Family Enterprise Ombudsman | Small Business in the Australian Economy 40
Table 24: Gender analysis of views concerning daughters in senior management 201336
In relation to daughters
Male Female
Yes %
No %
Don’t know %
Yes %
No %
Don’t Know %
As interested to be actively involved? 42 29 29 58 21 21
More difficult to be actively involved 33 47 20 11 68 21
Kept from taking top management 33 37 30 5 79 16
Fathers find it easier to mentor 10 42 48 0 37 63
Source: MGI Australian Family & Private Business Survey 2013, p27.
The same survey found that the family members most actively involved in the business are: sons, 36 per cent;
spouses, 35 per cent; daughters, 9 per cent; brothers, 8 per cent; sisters, 1 per cent; and other family members
(father/nephew/sister-in-law/son-in-law/uncle) 11 per cent. Not only is the percentage of sons four times higher
than the percentage of daughters, sons were also six times more likely to succeed the current CEO than
daughters - 65 per cent versus 11 per cent.37
6.3 Women as owner/managers
It is not only the scale of women’s involvement in business that is different to that of men. There also appears to
be differences in their view of business challenges and in the way business is conducted.
6.3.1 Business challenges
Views about the challenges facing small business differ between men and women. The February 2014 MYOB
business monitor found that among female business operators cash flow, attracting new customers and price
margins/profitability were a greater concern than among other business operators.38
A 2013 CPA survey found that female respondents were significantly more likely to expect to access funds from a
bank in 2014 than male respondents.39
6.3.2 The use of IT
Women business operators are more connected than men. The February 2014 MYOB survey found that while only
17 per cent of business operators overall said they were currently connected to the NBN, 22 per cent of female
business operators were connected.40
Women are also heavier users of information technology than men. The October 2015 MYOB survey found that
while 29 per cent of SMEs overall had an online presence using social media, female operators were significantly
more likely to use social media (42 per cent). This is significant as business operators whose revenue had
increased in the previous 12 months were also more likely to use social media.41 Female business operators were
also more likely to use online tools (88 per cent) than overall business operators (84%).42
36 Dana L, Smyrnios K & MGI, Surviving Not Thriving: The MGI Australian family and private business survey 2013, MGI, 2013, p. 27. 37 Dana L, Smyrnios K & MGI, Surviving Not Thriving: The MGI Australian family and private business survey 2013, MGI, 2013, p. 26. 38 MYOB, MYOB Business Monitor, February 2014, p. 9. 39 CPA, The CPA Australia Asia Pacific Small Business Survey 2013, p. 45 40 MYOB, MYOB Business Monitor, February 2014, p. 30. 41 MYOB, MYOB Business Monitor, October 2015 Report, p. 16. 42 MYOB, MYOB Business Monitor, February 2014, p. 16.

Australian Small Business and Family Enterprise Ombudsman | Small Business in the Australian Economy 41
6.3.3 Work-life balance
Attitudes to work-life balance also differ between female and male business operators. Females (54 per cent) are
significantly less satisfied than males (47 per cent) with their work-life balance.43 This is despite male business
operators reporting that they worked longer hours, an average 42 of hours per week, than their female
counterparts, an average of 38 hours per week.44
6.4 Trends
The data on women in small business is limited but some general observations can be made. The data from both
the ABS and private surveys generally show a slow increase in the involvement of women in the ownership,
control and management of businesses. The change is not rapid, but there does appear to be a consistent upward
trend for female involvement. These changes are significant. Unlocking more of the potential of women in business
may make a significant contribution to Australia’s economic growth.
7 Government assistance
While many small businesses would be utilising the low income tax thresholds available for individuals, and some
may also be accessing low income assistance, less than 15 per cent of small businesses and only 8 per cent of
micro businesses reported receiving any form of formal business assistance from government.
In comparison, 57 per cent of large businesses reported receiving government assistance.
Table 25: Government financial assistance by business size 2013-14
Type of assistance
Micro (0-4 persons)
%
Small (5-19 persons)
%
Medium (20-199 persons)
%
Large (200+ persons)
% Total
Grants 1.9 4.3 10.2 25.3 3.4
Ongoing funding 0.4 2 5.3 14.9 1.3
Subsidies 1.6 2.5 5.7 16 2.3
Tax concessions 1 2.3 5.3 18.7 1.9
Rebates 3.2 5.5 10.8 18.8 4.6
Other assistance 0.8 1.4 1.5 3.3 1.1
Any assistance received 8 14.8 29.6 57.2 12
No assistance received 92 85.2 70.4 42.8 88
Source: ABS cat no. 8167.0 - Selected Characteristics of Australian Business, 2013-14 – Summary table.
43 MYOB, MYOB Business Monitor, September 2013, p. 22. 44 MYOB, MYOB Business Monitor, March 2013, p. 13.

Australian Small Business and Family Enterprise Ombudsman | Small Business in the Australian Economy 42
Appendix
Data methodology
The underlying data set used in this report is drawn from ATO data. A random sample of 10,000 businesses
was collected to produce a representative sample that is aligned to the ABS data to show reliability (degree
of confidence) with an employee count of between 0 to 100 employees and turnover of up to $5 million. The
sample includes individuals, companies, partnerships, trusts and self-managed superannuation funds
(SMSFs). The data excluded all tax payer identify information (Tax File Number (TFN), Australian Business
Number (ABN), names and addresses).
The data set excluded businesses in a category where there were less than five businesses or postcodes
where there were less than five businesses. This will lead to an under representation of isolated businesses
however this was done to insure anonymity of the businesses selected in the sample.
Basic difference between the ATO data sample and ABS data sets is the inclusion of ‘nano’ business data in
the ATO data sample. The ‘nano’ sized businesses are entities that report business revenue but have no GST
activity and these ‘nano’ businesses are excluded from the ABS small business counts.
Where a data source is listed as ASBFEO calculation this indicates a calculation has been made based on
ABS data to support the analysis (e.g. a new graph). Where ‘nano’ businesses have been included in the
analysis the data source should list ‘ATO data set.
The data set uses 2013 financial year information for calculations to align with ABS data though the data set
does include 2014 financial year data.
A range of other data sources are used in this report most notably ABS datasets and other publicly available
reports. Where a data source has been used it has been referenced appropriately.
The data set was drawn in the first quarter of 2016. Analysis of the data and comparative data sets occurred
during the first and second quarter of 2016. The report was finalised over the latter half of 2016.