slide 1 t:/classes/bms602 b/lecture 2 602_b.ppt© 1995-2004 j.paul robinson - purdue university...
Post on 20-Dec-2015
215 views
TRANSCRIPT

Slide 1 t:/classes/BMS602 B/Lecture 2 602_B.ppt© 1995-2004 J.Paul Robinson - Purdue University Cytometry Laboratories
Week 2Excitation, fluorescence, optical systems, resolution
BME 695Y / BMS 634 Confocal Microscopy: Techniques and Application Module
Purdue University Department of Basic Medical Sciences, School of Veterinary Medicine
& Department of Biomedical Engineering, Schools of Engineering
J.Paul Robinson, Ph.D.Professor of Immunopharmacology & Biomedical Engineering
Director, Purdue University Cytometry Laboratories
UPDATED February 2004
JThese slides are intended for use in a lecture series. Copies of the graphics are distributed and students encouraged to take
their notes on these graphics. The intent is to have the student NOT try to reproduce the figures, but to LISTEN and UNDERSTAND the material. All material copyright J.Paul Robinson unless otherwise stated, however, the material may
be freely used for lectures, tutorials and workshops. It may not be used for any commercial purpose.
One useful text for this course is Pawley “Introduction to Confocal Microscopy”, Plenum Press, 2nd Ed. A number of the ideas and figures in these lecture notes are taken from this text.

Slide 2 t:/classes/BMS602 B/Lecture 2 602_B.ppt© 1995-2004 J.Paul Robinson - Purdue University Cytometry Laboratories
Overview of lecture 21. Excitation Sources2. Fluorescence3. Raman & Raleigh Scatter4. Photobleaching5. CCD cameras for fluorescence6. Fluorescent probes for biological material7. The structure of a confocal microscope8. Optical properties of confocal systems9. Confocal principals11.Resolution, gray scales and image structure12 Sampling theory and electronic zoom13.Reflection Imaging.
Slide 3 t:/classes/BMS602 B/Lecture 2 602_B.ppt© 1995-2004 J.Paul Robinson - Purdue University Cytometry Laboratories
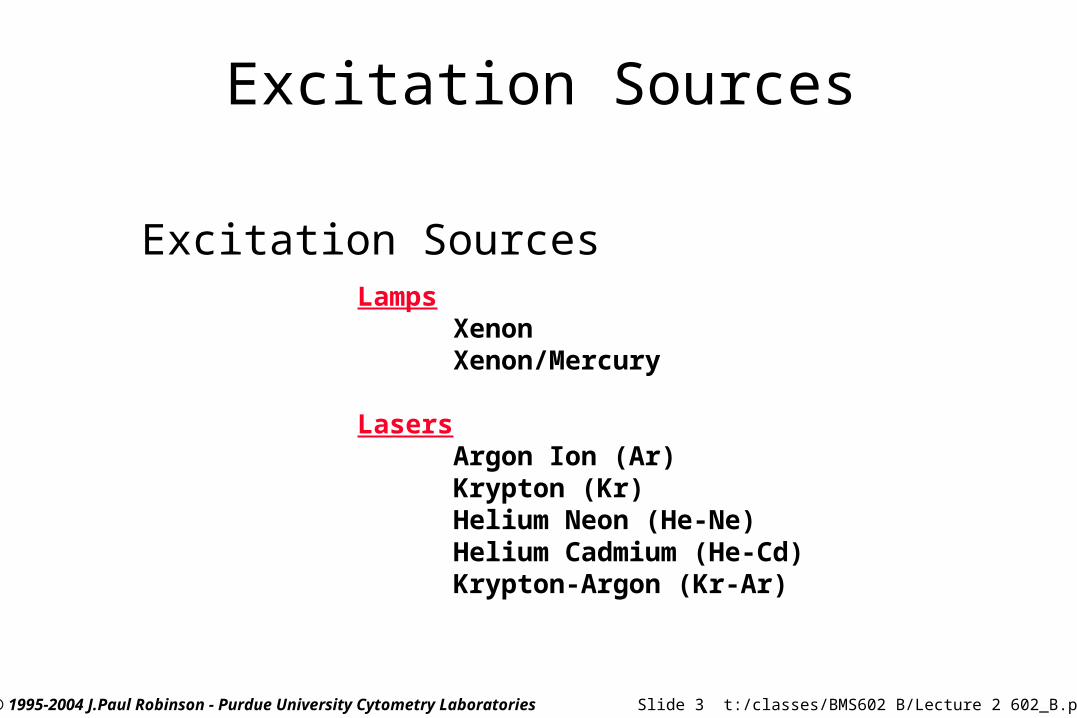
Excitation Sources
Excitation SourcesLamps
XenonXenon/Mercury
LasersArgon Ion (Ar)Krypton (Kr)Helium Neon (He-Ne)Helium Cadmium (He-Cd)Krypton-Argon (Kr-Ar)

Slide 4 t:/classes/BMS602 B/Lecture 2 602_B.ppt© 1995-2004 J.Paul Robinson - Purdue University Cytometry Laboratories
Fluorescence
• Chromophores are components of molecules which absorb light
• They are generally aromatic rings

Slide 5 t:/classes/BMS602 B/Lecture 2 602_B.ppt© 1995-2004 J.Paul Robinson - Purdue University Cytometry Laboratories
FluorescenceE
NE
RG
Y
S0
S1
S2
T2
T1ABS FL I.C.
ABS - Absorbance S 0.1.2 - Singlet Electronic Energy LevelsFL - Fluorescence T 1,2 - Corresponding Triplet StatesI.C.- Nonradiative Internal Conversion IsC - Intersystem Crossing PH - Phosphorescence
IsC
IsC
PH
[Vibrational sublevels]
Jablonski Diagram
Vibrational energy levelsRotational energy levelsElectronic energy levels
Singlet States Triplet States

Slide 6 t:/classes/BMS602 B/Lecture 2 602_B.ppt© 1995-2004 J.Paul Robinson - Purdue University Cytometry Laboratories
Simplified Jablonski Diagram
S0
S’1
En e
r gy
S1
hvex hvem

Slide 7 t:/classes/BMS602 B/Lecture 2 602_B.ppt© 1995-2004 J.Paul Robinson - Purdue University Cytometry Laboratories
FluorescenceThe longer the wavelength the lower the energy
The shorter the wavelength the higher the energyeg. UV light from sun causes the sunburn
not the red visible light
Intensity related to the probability of the event
Wavelengththe energy of the light absorbed or emitted

Slide 8 t:/classes/BMS602 B/Lecture 2 602_B.ppt© 1995-2004 J.Paul Robinson - Purdue University Cytometry Laboratories
FluorescenceStokes Shift
– is the energy difference between the lowest energy peak of absorbence and the highest energy of emission
495 nm 520 nm
Stokes Shift is 25 nmFluoresceinmolecule
Flu
ores
cnec
e In
tens
ity
Wavelength

Slide 9 t:/classes/BMS602 B/Lecture 2 602_B.ppt© 1995-2004 J.Paul Robinson - Purdue University Cytometry Laboratories
Ethidium
PE
cis-Parinaric acid
Texas Red
PE-TR Conj.
PI
FITC
600 nm300 nm 500 nm 700 nm400 nm457350 514 610 632488 Common Laser Lines

Slide 10 t:/classes/BMS602 B/Lecture 2 602_B.ppt© 1995-2004 J.Paul Robinson - Purdue University Cytometry Laboratories
Parameters
• Extinction Coefficient– refers to a single wavelength (usually the absorption maximum)
• Quantum Yield– Qf is a measure of the integrated photon emission over the
fluorophore spectral band
• At sub-saturation excitation rates, fluorescence intensity is proportional to the product of and Qf

Slide 11 t:/classes/BMS602 B/Lecture 2 602_B.ppt© 1995-2004 J.Paul Robinson - Purdue University Cytometry Laboratories
Excitation Saturation
• The rate of emission is dependent upon the time the molecule remains within the excitation state (the excited state lifetime f)
• Optical saturation occurs when the rate of excitation exceeds the reciprocal of f
• In a scanned image of 512 x 768 pixels (400,000 pixels) if scanned in 1 second requires a dwell time per pixel of 2 x 10⁻⁶ sec.
• Molecules that remain in the excitation beam for extended periods have higher probability of interstate crossings and thus phosphorescence
• Usually, increasing dye concentration can be the most effective means of increasing signal when energy is not the limiting factor (ie laser based confocal systems)

Slide 12 t:/classes/BMS602 B/Lecture 2 602_B.ppt© 1995-2004 J.Paul Robinson - Purdue University Cytometry Laboratories
How many Photons?
• Consider 1 mW of power at 488 nm focused to a Gaussian spot whose radius at 1/e2 intensity is 0.25m via a 1.25 NA objective
• The peak intensity at the center will be 10-3W [.(0.25 x 10⁻⁴ cm)2]= 5.1 x 10⁵ W/cm2 or 1.25 x 1024 photons/(cm2 sec-1)
• At this power, FITCFITC would have 63% of its molecules in an excited state and 37% in ground state at any one time
Slide 13 t:/classes/BMS602 B/Lecture 2 602_B.ppt© 1995-2004 J.Paul Robinson - Purdue University Cytometry Laboratories
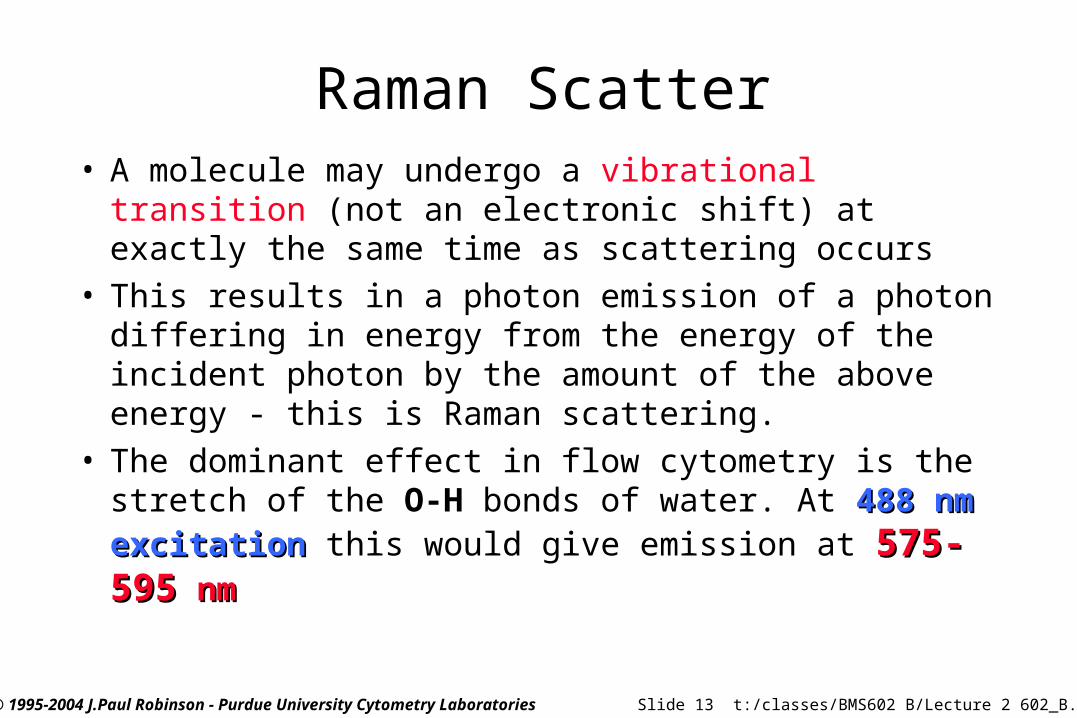
Raman Scatter• A molecule may undergo a vibrational transition (not an
electronic shift) at exactly the same time as scattering occurs• This results in a photon emission of a photon differing in
energy from the energy of the incident photon by the amount of the above energy - this is Raman scattering.
• The dominant effect in flow cytometry is the stretch of the O-H bonds of water. At 488 nm excitation488 nm excitation this would give emission at 575-595575-595 nm nm

Slide 14 t:/classes/BMS602 B/Lecture 2 602_B.ppt© 1995-2004 J.Paul Robinson - Purdue University Cytometry Laboratories
Rayleigh Scatter• Molecules and very small particles do
not absorb, but scatter light in the visible region (same freq as excitation)
• Rayleigh scattering is directly proportional to the electric dipole and inversely proportional to the 4th power of the wavelength of the incident light
the sky looks blue because the gas molecules scatter more light at shorter (blue) rather than longer wavelengths (red)

Slide 15 t:/classes/BMS602 B/Lecture 2 602_B.ppt© 1995-2004 J.Paul Robinson - Purdue University Cytometry Laboratories
Photobleaching• Defined as the irreversible destruction of an
excited fluorophore (discussed in later lecture)• Methods for countering photobleaching
– Scan for shorter times
– Use high magnification, high NA objective
– Use wide emission filters
– Reduce excitation intensity
– Use “antifade” reagents (not compatible with viable cells)

Slide 16 t:/classes/BMS602 B/Lecture 2 602_B.ppt© 1995-2004 J.Paul Robinson - Purdue University Cytometry Laboratories
Photobleaching example
• FITCFITC - at 4.4 x 10²³ photons cm-2 sec-1 FITCFITC bleaches with a quantum efficiency Qb of 3 x 10⁻⁵
• Therefore FITCFITC would be bleaching with a rate constant of 4.2 x 10³ sec-1 so 37% of the molecules would remain after 240 sec of irradiation.
• In a single plane, 16 scans would cause 6-50% bleaching

Slide 17 t:/classes/BMS602 B/Lecture 2 602_B.ppt© 1995-2004 J.Paul Robinson - Purdue University Cytometry Laboratories
Antifade Agents• Many quenchers act by reducing oxygen concentration to
prevent formation of singlet oxygen
• Satisfactory for fixed samples but not live cells!
• Antioxidents such as propyl gallate, hydroquinone, p-phenylenediamine are used
• Reduce O2 concentration or use singlet oxygen quenchers such as carotenoids (50 mM crocetin or etretinate in cell cultures); ascorbate, imidazole, histidine, cysteamine, reduced glutathione, uric acid, trolox (vitamin E analogue)

Slide 18 t:/classes/BMS602 B/Lecture 2 602_B.ppt© 1995-2004 J.Paul Robinson - Purdue University Cytometry Laboratories
Excitation - Emission Peaks
Fluorophore EXpeak EM peak
% Max Excitation at488 568 647 nm
FITC 496 518 87 0 0Bodipy 503 511 58 1 1Tetra-M-Rho 554 576 10 61 0L-Rhodamine 572 590 5 92 0Texas Red 592 610 3 45 1CY5 649 666 1 11 98
Note: You will not be able to see CY5 fluorescence under the regular fluorescent microscope because the wavelength is too high.
Slide 19 t:/classes/BMS602 B/Lecture 2 602_B.ppt© 1995-2004 J.Paul Robinson - Purdue University Cytometry Laboratories
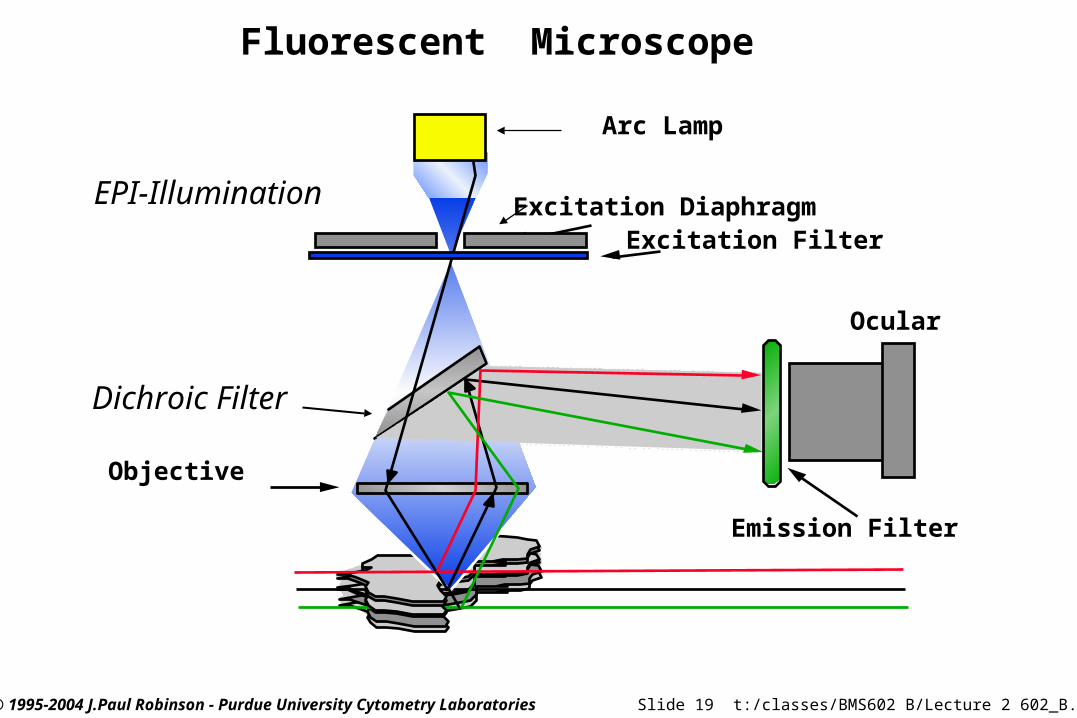
Fluorescent Microscope
Dichroic Filter
Objective
Arc Lamp
Emission Filter
Excitation Diaphragm
Ocular
Excitation Filter
EPI-Illumination

Slide 20 t:/classes/BMS602 B/Lecture 2 602_B.ppt© 1995-2004 J.Paul Robinson - Purdue University Cytometry Laboratories
Fluorescence Microscope withColor Video (CCD) 35 mm Camera
camera
Camera viewer
ocular
filters
objectives
stage
condensor

Slide 21 t:/classes/BMS602 B/Lecture 2 602_B.ppt© 1995-2004 J.Paul Robinson - Purdue University Cytometry Laboratories
Cameras and emission filters
Color CCD camera does not need optical filters to collect all wavelengths but if you want to collect each emission wavelength optimally, you need a monochrome camera with separate emission filters shown on the right (camera is not in position in this photo).
Camera goes here
Cooled color CCD camera

Slide 22 t:/classes/BMS602 B/Lecture 2 602_B.ppt© 1995-2004 J.Paul Robinson - Purdue University Cytometry Laboratories
Slide 23 t:/classes/BMS602 B/Lecture 2 602_B.ppt© 1995-2004 J.Paul Robinson - Purdue University Cytometry Laboratories
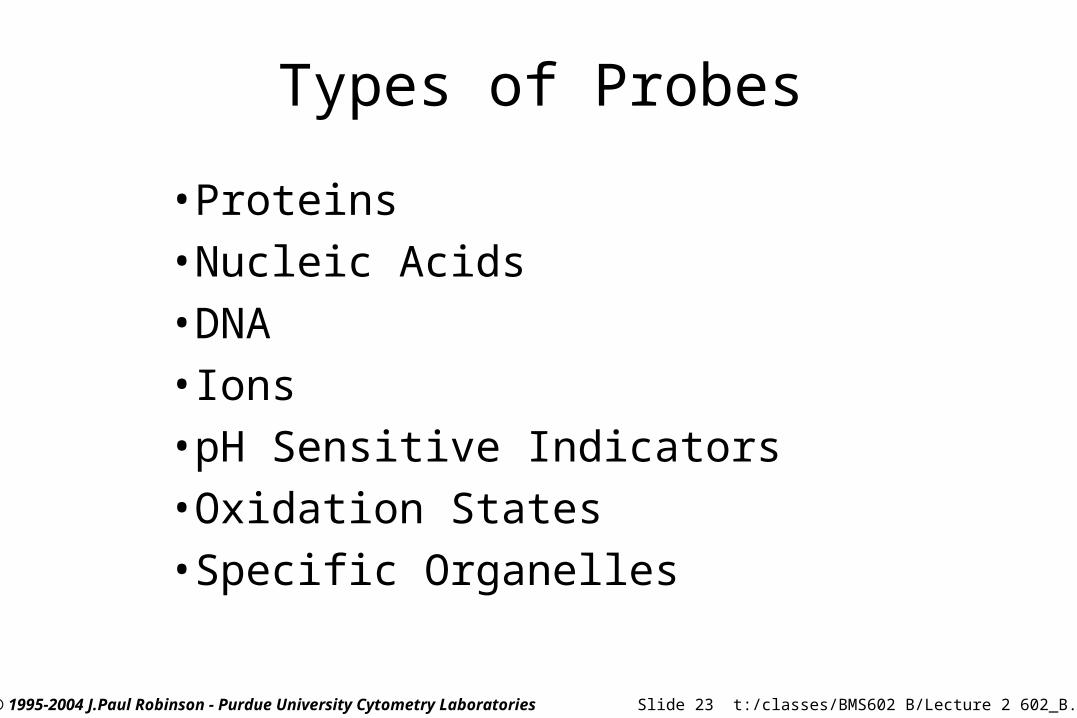
Types of Probes
•Proteins•Nucleic Acids•DNA•Ions•pH Sensitive Indicators•Oxidation States•Specific Organelles

Slide 24 t:/classes/BMS602 B/Lecture 2 602_B.ppt© 1995-2004 J.Paul Robinson - Purdue University Cytometry Laboratories
Probes for Proteins
FITC 488 525
PE 488 575
APC 630 650
PerCP™ 488 680
Cascade Blue 360 450
Coumerin-phalloidin 350 450
Texas Red™ 610 630
Tetramethylrhodamine-amines 550 575
CY3 (indotrimethinecyanines) 540 575
CY5 (indopentamethinecyanines) 640 670
Probe Excitation Emission

Slide 25 t:/classes/BMS602 B/Lecture 2 602_B.ppt© 1995-2004 J.Paul Robinson - Purdue University Cytometry Laboratories
Probes for Ions
• INDO-1 Ex350 Em405/480
• QUIN-2 Ex350 Em490
• Fluo-3 Ex488 Em525
• Fura -2 Ex330/360 Em510

Slide 26 t:/classes/BMS602 B/Lecture 2 602_B.ppt© 1995-2004 J.Paul Robinson - Purdue University Cytometry Laboratories
pH Sensitive Indicators
• SNARF-1 488 575
• BCECF 488 525/620
440/488 525[2’,7’-bis-(carboxyethyl)-5,6-carboxyfluorescein]
Probe Excitation Emission
Slide 27 t:/classes/BMS602 B/Lecture 2 602_B.ppt© 1995-2004 J.Paul Robinson - Purdue University Cytometry Laboratories
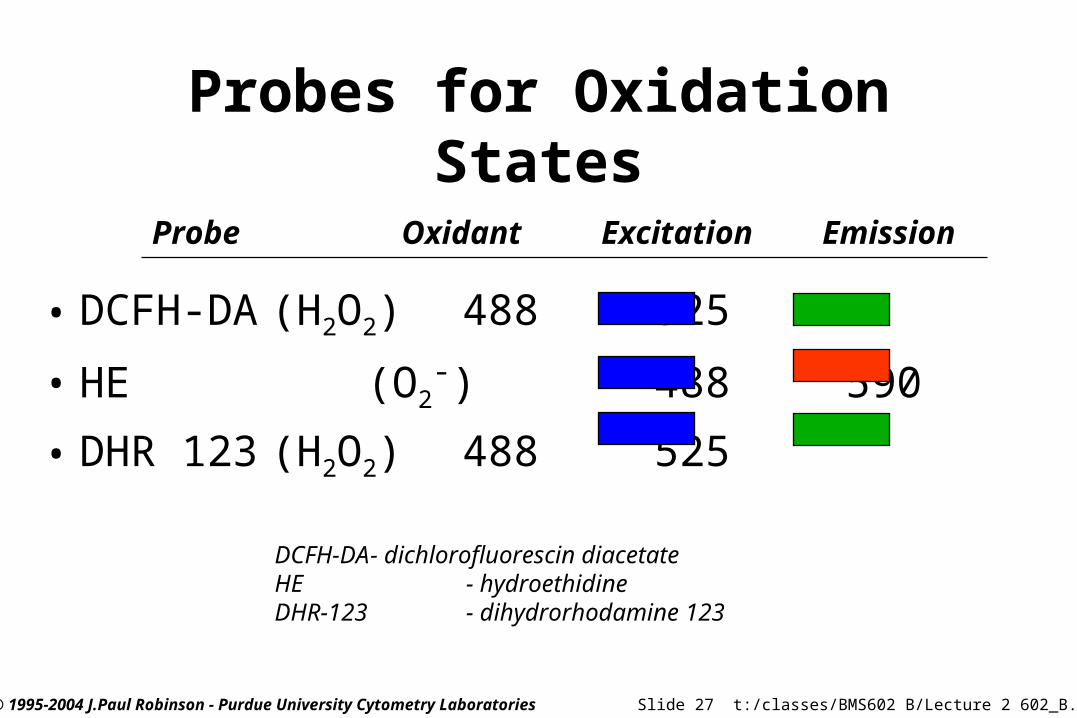
Probes for Oxidation States
• DCFH-DA(H2O2) 488 525
• HE (O2-) 488 590
• DHR 123 (H2O2) 488 525
Probe Oxidant Excitation Emission
DCFH-DA - dichlorofluorescin diacetateHE - hydroethidineDHR-123 - dihydrorhodamine 123

Slide 28 t:/classes/BMS602 B/Lecture 2 602_B.ppt© 1995-2004 J.Paul Robinson - Purdue University Cytometry Laboratories
Specific Organelle Probes
BODIPY Golgi 505 511
NBD Golgi 488 525
DPH Lipid 350 420
TMA-DPH Lipid 350 420
Rhodamine 123 Mitochondria 488 525
DiO Lipid 488 500
diI-Cn-(5) Lipid 550 565
diO-Cn-(3) Lipid 488 500
Probe Site Excitation Emission
BODIPY - borate-dipyrromethene complexesNBD - nitrobenzoxadiazoleDPH - diphenylhexatrieneTMA - trimethylammonium

Slide 29 t:/classes/BMS602 B/Lecture 2 602_B.ppt© 1995-2004 J.Paul Robinson - Purdue University Cytometry Laboratories
DNA Probes• AO
– Metachromatic dye• concentration dependent emission• double stranded NA - Green• single stranded NA - Red
• AT/GC binding dyes– AT rich: DAPI, Hoechst, quinacrine
– GC rich: antibiotics bleomycin, chromamycin A3, mithramycin, olivomycin, rhodamine 800

Slide 30 t:/classes/BMS602 B/Lecture 2 602_B.ppt© 1995-2004 J.Paul Robinson - Purdue University Cytometry Laboratories
Multiple Emissions
• Many possibilities for using multiple probes with a single excitation
• Multiple excitation lines are possible
• Combination of multiple excitation lines or probes that have same excitation and quite different emissions– e.g. Calcein AM and Ethidium (ex 488)– emissions 530 nm and 617 nm

Slide 31 t:/classes/BMS602 B/Lecture 2 602_B.ppt© 1995-2004 J.Paul Robinson - Purdue University Cytometry Laboratories
Energy Transfer
• Effective between 10-100 Å only
• Emission and excitation spectrum must significantly overlap
• Donor transfers non-radiatively to the acceptor
• PE-Texas Red™
• Carboxyfluorescein-Sulforhodamine B

Slide 32 t:/classes/BMS602 B/Lecture 2 602_B.ppt© 1995-2004 J.Paul Robinson - Purdue University Cytometry Laboratories
Fluorescence
Resonance Energy Transfer
Inte
nsi
ty
Wavelength
Absorbance
DONOR
Absorbance
Fluorescence Fluorescence
ACCEPTOR
Molecule 1 Molecule 2

Slide 33 t:/classes/BMS602 B/Lecture 2 602_B.ppt© 1995-2004 J.Paul Robinson - Purdue University Cytometry Laboratories
Benefits of Confocal Microscopy
• Reduced blurring of the image from light scattering• Increased effective resolution• Improved signal to noise ratio• Clear examination of thick specimens• Z-axis scanning• Depth perception in Z-sectioned images• Magnification can be adjusted electronically

Slide 34 t:/classes/BMS602 B/Lecture 2 602_B.ppt© 1995-2004 J.Paul Robinson - Purdue University Cytometry Laboratories
Fluorescent Microscope
Objective
Arc Lamp
Emission Filter
Excitation Diaphragm
Ocular
Excitation Filter
Objective
Laser
Emission Pinhole
Excitation Pinhole
PMT
EmissionFilter
Excitation Filter
Confocal Microscope

Slide 35 t:/classes/BMS602 B/Lecture 2 602_B.ppt© 1995-2004 J.Paul Robinson - Purdue University Cytometry Laboratories
MRC 1024 System
UV Laser
Kr-Ar Laser
Optical Mixer
ScanheadMicroscope

Slide 36 t:/classes/BMS602 B/Lecture 2 602_B.ppt© 1995-2004 J.Paul Robinson - Purdue University Cytometry Laboratories
Bio-Rad MRC 1024
Slide 37 t:/classes/BMS602 B/Lecture 2 602_B.ppt© 1995-2004 J.Paul Robinson - Purdue University Cytometry Laboratories
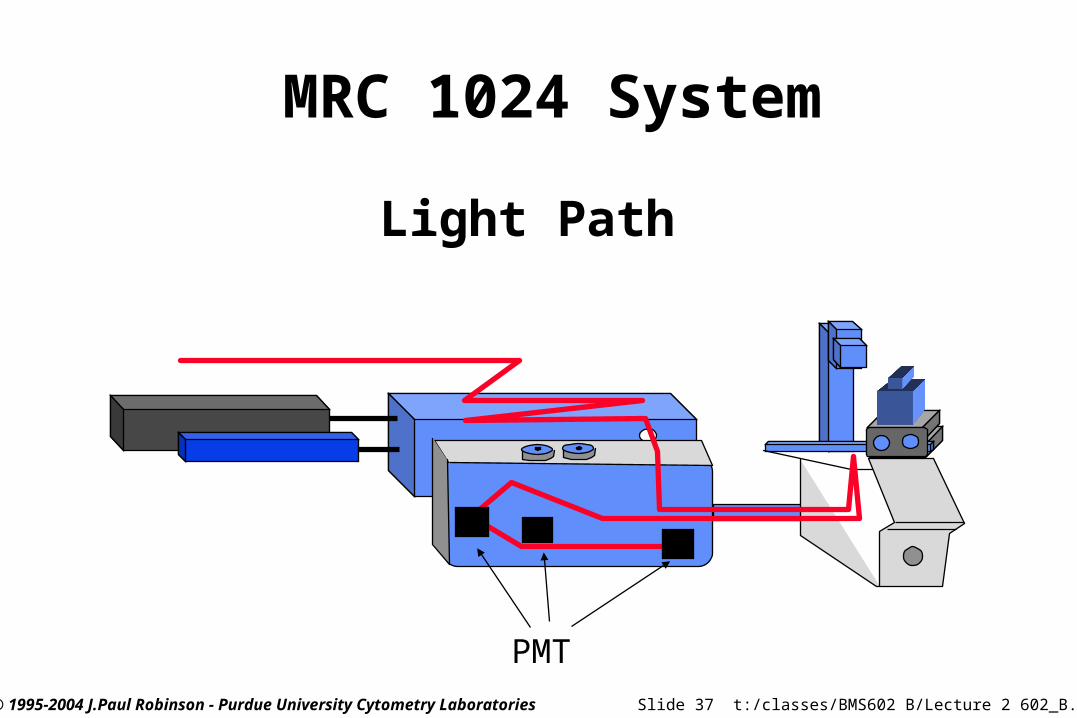
MRC 1024 System
Light Path
PMT

Slide 38 t:/classes/BMS602 B/Lecture 2 602_B.ppt© 1995-2004 J.Paul Robinson - Purdue University Cytometry Laboratories
Optical Mixer - MRC 1024 UVArgon Laser
Argon-KryptonLaser
Fast Shutter
UV CorrectionOptics
FilterWheels
To Scanhead
UV Visible
353,361 nm
488, 514 nm
488,568,647 nm
Beam Expander

Slide 39 t:/classes/BMS602 B/Lecture 2 602_B.ppt© 1995-2004 J.Paul Robinson - Purdue University Cytometry Laboratories
MRC 1024 Scanhead
From Laser
To and from Scope
32
1PMTGalvanometers
EmissionFilterWheel

Slide 40 t:/classes/BMS602 B/Lecture 2 602_B.ppt© 1995-2004 J.Paul Robinson - Purdue University Cytometry Laboratories
To Scanhead
From Scanhead

Slide 41 t:/classes/BMS602 B/Lecture 2 602_B.ppt© 1995-2004 J.Paul Robinson - Purdue University Cytometry Laboratories
Scanning Galvanometers
xy
Laser in
Laser out
Point Scanning
ToMicroscope

Slide 42 t:/classes/BMS602 B/Lecture 2 602_B.ppt© 1995-2004 J.Paul Robinson - Purdue University Cytometry Laboratories
The Scan Path of the Laser Beam767, 1023, 1279
511, 1023
00Start
Specimen
Frames/Sec # Lines1 5122 2564 1288 6416 32

Slide 43 t:/classes/BMS602 B/Lecture 2 602_B.ppt© 1995-2004 J.Paul Robinson - Purdue University Cytometry Laboratories
How a Confocal Image is Formed
CondenserLens
Pinhole 1 Pinhole 2
ObjectiveLens
Specimen
Detector
Modified from: Handbook of Biological Confocal Microscopy. J.B.Pawley, Plennum Press, 1989

Slide 44 t:/classes/BMS602 B/Lecture 2 602_B.ppt© 1995-2004 J.Paul Robinson - Purdue University Cytometry Laboratories
Fundamental Limitations of Confocal Microscopy
FromSource
To Detector
. x,y,z
2
n2 photons2
1
n1 photons
1
z
y
xVOXEL
PIXEL
From: Handbook of Biological Confocal Microscopy. J.B.Pawley, Plennum Press, 1989

Slide 45 t:/classes/BMS602 B/Lecture 2 602_B.ppt© 1995-2004 J.Paul Robinson - Purdue University Cytometry Laboratories
Optical Resolution:Gray Level & Pixelation
• Analogous to intensity range
For computer images each pixel is assigned a value. If the image is 8 bit, there are 28 or 256 levels of intensity If the image is 10 bit there are 1024 levels, 12 bit 4096 levels etc.
• The intensity analogue of a pixel is its grey level which shows up as brightness.
• The display will determine the possible resolution since on a TV screen, the image can only be displayed based upon the number of elements in the display. Of course, it is not possible to increase the resolution of an image by attributing more “pixels” to it than were collected in the original collection!

Slide 46 t:/classes/BMS602 B/Lecture 2 602_B.ppt© 1995-2004 J.Paul Robinson - Purdue University Cytometry Laboratories
Pixels
T
• Pixels & image structureHardcopy usually compromises pixel representation. With 20/20 vision you can distinguish dots 1 arc second apart (300 m at 1 m) so 300 DPS on a page is fine. So at 100 m, you could use dots 300 mm in size and get the same effect! Thus an image need only be parsimonius, i.e., it only needs to show what is necessary to provide the expected image.

Slide 47 t:/classes/BMS602 B/Lecture 2 602_B.ppt© 1995-2004 J.Paul Robinson - Purdue University Cytometry Laboratories

Slide 48 t:/classes/BMS602 B/Lecture 2 602_B.ppt© 1995-2004 J.Paul Robinson - Purdue University Cytometry Laboratories
320x240 x 24
Zoom x 2Zoom x 8
Zoom x 4
Magnifying with inadequate information. This is known as “empty magnification” because there are insufficient data points.
Magnifying with inadequate information. This is known as “empty magnification” because there are insufficient data points.
The final image appears to be very “boxy” this is known as “pixilation”.
The final image appears to be very “boxy” this is known as “pixilation”.

Slide 49 t:/classes/BMS602 B/Lecture 2 602_B.ppt© 1995-2004 J.Paul Robinson - Purdue University Cytometry Laboratories
541x600x8(2,596,800) 1.5x)
361x400x8
(1,155,200) 2x
180x200x8
(288,000) 1X
Magnifying with adequate information. Here, the original image was collected with many more pixels - so the magnified image looks better!
Magnifying with adequate information. Here, the original image was collected with many more pixels - so the magnified image looks better!
Socrates?….well perhaps not...
Socrates?….well perhaps not...
Slide 50 t:/classes/BMS602 B/Lecture 2 602_B.ppt© 1995-2004 J.Paul Robinson - Purdue University Cytometry Laboratories
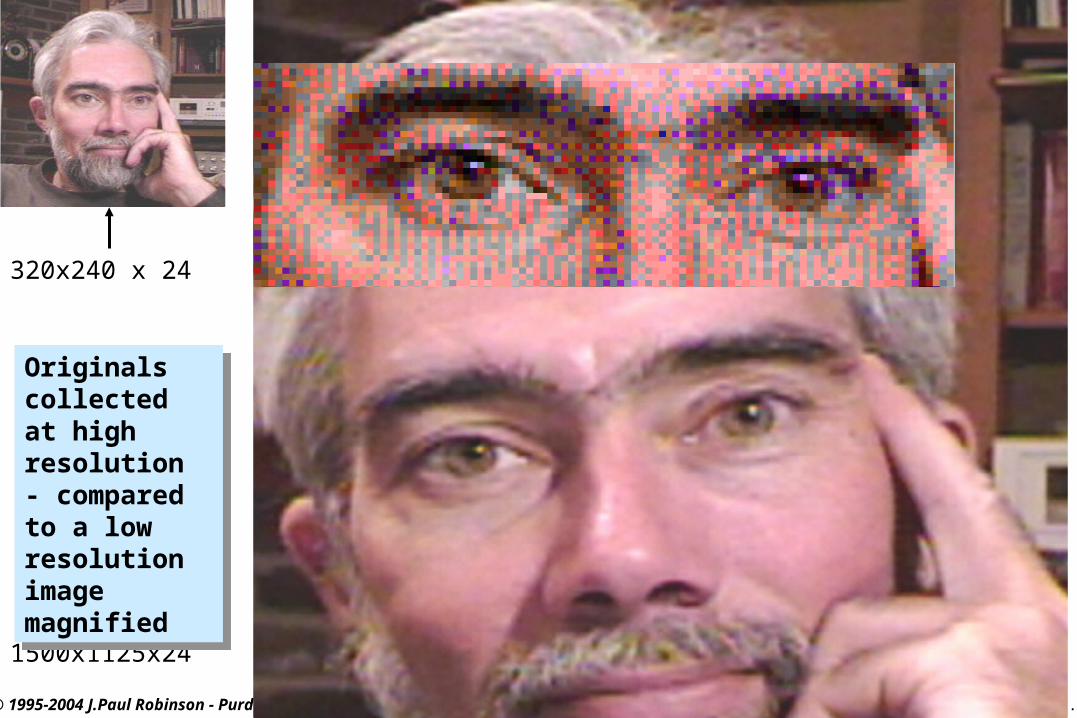
320x240 x 24
1500x1125x24
Originals collected at high resolution - compared to a low resolution image magnified
Originals collected at high resolution - compared to a low resolution image magnified

Slide 51 t:/classes/BMS602 B/Lecture 2 602_B.ppt© 1995-2004 J.Paul Robinson - Purdue University Cytometry Laboratories
Sampling Theory• The Nyquist Theorem
– Nyquest theory describes the sampling frequency (f) required to represent the true identity of the sample.
– i.e., how many times must you sample an image to know that your sample truly represents the image?
– In other words to capture the periodic components of frequency f in a signal we need to sample at least 2f times
• Nyquist claimed that the rate was 2f. It has been determined that in reality the rate is 2.3f - in essence you must sample at least 2 times the highest frequency.
• For example in audio, to capture the 22 kHz in the digitized signal, we need to sample at least 44.1 kHz

Slide 52 t:/classes/BMS602 B/Lecture 2 602_B.ppt© 1995-2004 J.Paul Robinson - Purdue University Cytometry Laboratories
Digital Zoom
1 x1024 points
2 x1024 points
4 x1024 points
Note that we have reduced the field of view of the sample

Slide 53 t:/classes/BMS602 B/Lecture 2 602_B.ppt© 1995-2004 J.Paul Robinson - Purdue University Cytometry Laboratories
Reflection Imaging
Backscattered light imaging
Same wavelength as excitation
Advantages: no photobleaching since not using a photo-probe (note: does not mean no possible damage to specimen)
Problems: optical reflections from components of microscope
CD-ROM pits
Increasingmag
Collagen

Slide 54 t:/classes/BMS602 B/Lecture 2 602_B.ppt© 1995-2004 J.Paul Robinson - Purdue University Cytometry Laboratories
Issues for good confocal imaging
• Axial Resolution– Must determine the FWHM (full width half maximum) intensity values of a vertical section
of beads
• Field Flatness– Must be able to collect a flat field image over a specimen - or z-axis information will be
inaccurate
• Chromatic Aberration– must test across an entire field that emission is constant and not collecting radial or tangential
artifacts due to chromatic aberration in objectives
• Z-drive precision and accuracy– must be able to reproducibily measure distance through a specimen - tenths of microns will
make a big difference over 50 microns

Slide 55 t:/classes/BMS602 B/Lecture 2 602_B.ppt© 1995-2004 J.Paul Robinson - Purdue University Cytometry Laboratories
Conclusions• Fluorescence is the primary energy source for confocal microscopes
• Dye molecules must be close to, but below saturation levels for optimum emission
• Fluorescence emission is longer than the exciting wavelength
• The energy of the light increases with reduction of wavelength
• Fluorescence probes must be appropriate for the excitation source and the sample of interest
• Correct optical filters must be used for multiple color fluorescence emission
• Sampling rate must be appropriate for specimen(Nyquist Theorem)