slamm 4 - warren pinnacle consulting,...
TRANSCRIPT

Application of the Sea-Level Affecting Marshes Model (SLAMM 6) to Laguna Atascosa NWR
U. S. Fish and Wildlife ServiceNational Wildlife Refuge System
Division of Natural Resources and Conservation PlanningConservation Biology Program4401 N. Fairfax Drive - MS 670
Arlington, VA 22203
August 16, 2011
PO Box 315, Waitsfield VT, 05673(802)-496-3476

Application of the Sea-Level Affecting Marshes Model (SLAMM 6) to Laguna Atascosa NWR
Introduction........................................................................................1Model Summary...................................................................................1
Sea Level Rise Scenarios.......................................................................2Data Sources and Methods..................................................................4Results...............................................................................................11Discussion..........................................................................................42References.........................................................................................43Appendix A: Contextual Results........................................................45

Application of the Sea-Level Affecting Marshes Model (SLAMM 6) to Laguna Atascosa NWR
Introduction
Tidal marshes are among the most susceptible ecosystems to climate change, especially accelerated sea level rise (SLR). The Intergovernmental Panel on Climate Change (IPCC) Special Report on Emissions Scenarios (SRES) suggested that global sea level will increase by approximately 30 cm to 100 cm by 2100 (IPCC 2001). Rahmstorf (2007) suggests that this range may be too conservative and that the feasible range by 2100 is 50 to 140 cm. Rising sea levels may result in tidal marsh submergence (Moorhead and Brinson 1995) and habitat “migration” as salt marshes transgress landward and replace tidal freshwater and irregularly flooded marsh (R. A. Park et al. 1991).
In an effort to address the potential effects of sea level rise on United States national wildlife refuges, the U. S. Fish and Wildlife Service contracted the application of the SLAMM model for many coastal Region 2 refuges. This analysis is designed to assist in the production of comprehensive conservation plans (CCPs) for each refuge along with other long-term management plans.
Model Summary
Changes in tidal marsh area and habitat type in response to sea-level rise were modeled using the Sea Level Affecting Marshes Model (SLAMM 6) that accounts for the dominant processes involved in wetland conversion and shoreline modifications during long-term sea level rise (Park et al. 1989; www.warrenpinnacle.com/prof/SLAMM).
Successive versions of the model have been used to estimate the impacts of sea level rise on the coasts of the U.S. (Titus et al. 1991; Lee et al. 1992; Park et al. 1993; Galbraith et al. 2002; National Wildlife Federation & Florida Wildlife Federation 2006; Glick et al. 2007; Craft et al. 2009).
Within SLAMM, there are five primary processes that affect wetland fate under different scenarios of sea-level rise:
Inundation: The rise of water levels and the salt boundary are tracked by reducing elevations of each cell as sea levels rise, thus keeping mean tide level (MTL) constant at zero. The effects on each cell are calculated based on the minimum elevation and slope of that cell.
Erosion: Erosion is triggered based on a threshold of maximum fetch and the proximity of the marsh to estuarine water or open ocean. When these conditions are met, horizontal erosion occurs at a rate based on site- specific data.
Prepared for USFWS 1 Warren Pinnacle Consulting, Inc.

Application of the Sea-Level Affecting Marshes Model (SLAMM 6) to Laguna Atascosa NWR
Overwash: Barrier islands of under 500 meters (m) width are assumed to undergo overwash during each specified interval for large storms. Beach migration and transport of sediments are calculated.
Saturation: Coastal swamps and fresh marshes can migrate onto adjacent uplands as a response of the fresh water table to rising sea level close to the coast.
Accretion: Sea level rise is offset by sedimentation and vertical accretion using average or site-specific values for each wetland category. Accretion rates may be spatially variable within a given model domain and can be specified to respond to feedbacks such as frequency of flooding.
SLAMM Version 6.0 was developed in 2008/2009 and is based on SLAMM 5. SLAMM 6.0 provides backwards compatibility to SLAMM 5, that is, SLAMM 5 results can be replicated in SLAMM 6. However, SLAMM 6 also provides several optional capabilities.
Accretion Feedback Component: Feedbacks based on wetland elevation, distance to channel, and salinity may be specified. This feedback will be used in USFWS simulations, but only where adequate data exist for parameterization.
Salinity Model: Multiple time-variable freshwater flows may be specified. Salinity is estimated and mapped at MLLW, MHHW, and MTL. Habitat switching may be specified as a function of salinity. This optional sub-model is not utilized in USFWS simulations.
Integrated Elevation Analysis: SLAMM will summarize site-specific categorized elevation ranges for wetlands as derived from LiDAR data or other high-resolution data sets. This functionality is used in USFWS simulations to test the SLAMM conceptual model at each site. The causes of any discrepancies are then tracked down and reported on within the model application report.
Flexible Elevation Ranges for land categories: If site-specific data indicate that wetland elevation ranges are outside of SLAMM defaults, a different range may be specified within the interface. In USFWS simulations, the use of values outside of SLAMM defaults is rarely utilized. If such a change is made, the change and the reason for it are fully documented within the model application reports.
Many other graphic user interface and memory management improvements are also part of the new version including an updated Technical Documentation, and context sensitive help files.
For a thorough accounting of SLAMM model processes and the underlying assumptions and equations, please see the SLAMM 6.0 Technical
Prepared for USFWS 2 Warren Pinnacle Consulting, Inc.

Application of the Sea-Level Affecting Marshes Model (SLAMM 6) to Laguna Atascosa NWR
Documentation (Clough et al. 2010). This document is available at http://warrenpinnacle.com/prof/SLAMM
All model results are subject to uncertainty due to limitations in input data, incomplete knowledge about factors that control the behavior of the system being modeled, and simplifications of the system (Council for Regulatory Environmental Modeling 2008). Site-specific factors that increase or decrease model uncertainty may be covered in the Discussion section of this report.
Sea Level Rise Scenarios
SLAMM 6 was run using scenario A1B from the Special Report on Emissions Scenarios (SRES) – mean and maximum estimates. The A1 family of scenarios assumes that the future world includes rapid economic growth, global population that peaks in mid-century and declines thereafter, and the rapid introduction of new and more efficient technologies. In particular, the A1B scenario assumes that energy sources will be balanced across all sources. Under the A1B scenario, the IPCC WGI Fourth Assessment Report (IPCC 2007) suggests a likely range of 0.21 to 0.48 m of SLR by 2090-2099 “excluding future rapid dynamical changes in ice flow.” The A1B-mean scenario that was run as a part of this project falls near the middle of this estimated range, predicting 0.39 m of global SLR by 2100. A1B-maximum predicts 0.69 m of global SLR by 2100.
The latest literature (Chen et al. 2006; Monaghan et al. 2006) indicates that the eustatic rise in sea levels is progressing more rapidly than was previously assumed, perhaps due to the dynamic changes in ice flow omitted within the IPCC report’s calculations. A recent paper in the journal Science (Rahmstorf 2007) suggests that, taking into account possible model error, a feasible range by 2100 of 50 to 140 cm. This work was recently updated and the ranges were increased to 75 to 190 cm (Vermeer and Rahmstorf 2009). Pfeffer et al. (2008) suggests that 2 m by 2100 is at the upper end of plausible scenarios due to physical limitations on glaciological conditions. A recent US intergovernmental report states "Although no ice-sheet model is currently capable of capturing the glacier speedups in Antarctica or Greenland that have been observed over the last decade, including these processes in models will very likely show that IPCC AR4 projected SLRs for the end of the 21st century are too low" (Clark 2009). A recent paper by Grinsted et al. (2009) states that “sea level 2090-2099 is projected to be 0.9 to 1.3 m for the A1B scenario…” Grinsted also states that there is a “low probability” that SLR will match the lower IPCC estimates.
Prepared for USFWS 3 Warren Pinnacle Consulting, Inc.

Application of the Sea-Level Affecting Marshes Model (SLAMM 6) to Laguna Atascosa NWR
To allow for flexibility when interpreting the results, SLAMM was also run assuming 1 m, 1.5 m, and 2 m of eustatic SLR by the year 2100. The A1B- maximum scenario was scaled up to produce these bounding scenarios (Figure 1).
0
20
40
60
80
100
120
140
160
180
200
1990 2015 2040 2065 2090
Sea
Lev
el R
ise
(cm
)
A1B Mean
A1B max
1 meter
1.5 meter
2 meters
Figure 1. Summary of SLR scenarios utilized
Prepared for USFWS 4 Warren Pinnacle Consulting, Inc.

Application of the Sea-Level Affecting Marshes Model (SLAMM 6) to Laguna Atascosa NWR
Data Sources and Methods
Wetland layer. Figure 2 shows the most recent available wetlands layer obtained from a National Wetlands Inventory (NWI) photo dated 1994. Converting the NWI survey into 30 m cells indicated that the approximately 230,000 acre Laguna Atascosa NWR (approved acquisition boundary including water) is composed of the following categories:
Land cover type Area (acres)
Percentage (%)
Undeveloped Dry Land
Undeveloped Dry Land 118773 51
Estuarine BeachEstuarine Beach 44757 19
Tidal FlatTidal Flat 21961 10
Inland Fresh Marsh
Inland Fresh Marsh 20796 9Inland Open Water
Inland Open Water 7215 3Developed Dry Land
Developed Dry Land 5735 2Irregularly Flooded Marsh
Irregularly Flooded Marsh 4598 2
Inland ShoreInland Shore 3542 2
Estuarine Open Water
Estuarine Open Water 1399 <1Regularly Flooded Marsh
Regularly Flooded Marsh 690 <1
Open OceanOpen Ocean 497 <1
Riverine TidalRiverine Tidal 419 <1
SwampSwamp 193 <1
Transitional Salt Marsh
Transitional Salt Marsh 177 <1
Ocean BeachOcean Beach 139 <1Total (incl. water) 230891 100
Prepared for USFWS 5 Warren Pinnacle Consulting, Inc.

Application of the Sea-Level Affecting Marshes Model (SLAMM 6) to Laguna Atascosa NWR
Figure 2. Wetland coverage of the study area. Modeling boundaries indicated in yellow
Prepared for USFWS 6 Warren Pinnacle Consulting, Inc.
Undeveloped Dry LandUndeveloped Dry LandEstuarin e BeachEstuarine BeachTidal Flat Tidal FlatI n lan d Fr esh Mar shInland Fresh MarshI n lan d Open Wat erInland Open WaterDeveloped Dry Lan dDeveloped Dry LandI rregular ly Flooded MarshIrregularly Flooded MarshI n lan d S hore Inland Shore

Application of the Sea-Level Affecting Marshes Model (SLAMM 6) to Laguna Atascosa NWR
Elevation Data. The digital elevation map used in this simulation, shown in Figure 3, is a bare-earth dataset that was derived by combining data from a 2006 Texas Water Development Board LiDAR, and an International Boundary and Water Commission LiDAR dated 2005.
Figure 3. Shade-relief elevation map of the study area.
Model Timesteps. Model forecast outputs were chosen at years 2025, 2050, 2075 and 2100 with the initial condition date set to 1994 (the most recent wetland data available).
Dikes and Impoundments. According to the National Wetland Inventory, there are some inland fresh marsh and open water areas that are protected by dikes, as shown in Figure 4 for the entire contextual area.
Prepared for USFWS 7 Warren Pinnacle Consulting, Inc.
Elevations(relative to
MTL)

Application of the Sea-Level Affecting Marshes Model (SLAMM 6) to Laguna Atascosa NWR
Figure 4. Dikes present in the study area (represented in yellow)
Historic sea-level rise rates. In the southern portion of the study area, at the NOAA gauge stations of Port Isabel (ID 8779770) and Padre Island (ID 8779750), measured historic rates of SLR are similar and average 3.64 mm/yr. Further north, at the Port Mansfield, gauge station (ID 8778490), just in front of the water pass connecting Red Fish Bay and the Gulf of Mexico, the recorded trend is 1.93 mm/yr. At Rockport, in Aransas Bay, historic SLR is 5.16 mm/yr on average. These rates of SLR are higher than the global average for the last 100 years (approximately 1.7 mm/year, IPCC 2007a), potentially reflecting land subsidence at this site. The values recorded at Port Isabel and Padre Island were chosen for this SLAMM simulation they are site-specific and intermediate between other trends measured in this part of the Gulf of Mexico.
Tide Ranges. Figure 5 shows the locations of the 4 tide gauge stations (red marks) within the study area used to define the tide ranges for this site.
Prepared for USFWS 8 Warren Pinnacle Consulting, Inc.

Application of the Sea-Level Affecting Marshes Model (SLAMM 6) to Laguna Atascosa NWR
Figure 5. Location of NOAA tides gages used for Laguna Atascosa NWR
The great diurnal tide range was derived by taking the average value of all the four stations observed values, summarized in Table 1, and subsequently set to 0.4 m.
Table 1. NOAA tide gauges and values.Station ID Site Name Tide Range (m)8779977 Brownsville, TX 0.4628779770 Port Isabel, TX 0.4258779750 South Padre Island C.g Station, TX 0.488779724 Queen Isabella Causeway, TX 0.391
Salt elevation. This parameter within SLAMM designates the boundary between wet lands and dry lands or saline wetlands and fresh water wetlands. As such, this value may be best derived by examining historical tide gage data. For this application, the salt boundary was defined as the elevation above which inundation is predicted less than once per thirty days using data from the gauge station at Brownsville, TX (ID 8779977) and Port
Prepared for USFWS 9 Warren Pinnacle Consulting, Inc.

Application of the Sea-Level Affecting Marshes Model (SLAMM 6) to Laguna Atascosa NWR
Isabel, TX (ID 87779770). Estimated salt elevation are very similar, approximately 2.1 Half Tide Units (HTU). As the great tide range is estimated to be uniform in the study area, 0.4 m above MTL, salt elevation is set to 0.42 m above MTL.
Accretion/erosion rates. Accretion and erosion rates for marshes are summarized in Table 2 and were set to the values used in a recent study of Aransas NWR (Callaway et al. 1997), a little further north of the Lower Rio Grande Valley NWR. Elevation correction. The MTL to NAVD88 correction of -0.035 m was derived using NOAA gauge stations in the area that have this datum, Port Isabel and Queen Island Causeway (ID 8779739).
Refuge boundaries. Modeled USFWS refuge boundaries for Texas are based on Approved Acquisition Boundaries as published on the FWS National Wildlife Refuge Data and Metadata website. The cell-size used for this analysis was 30 m by 30 m cells.
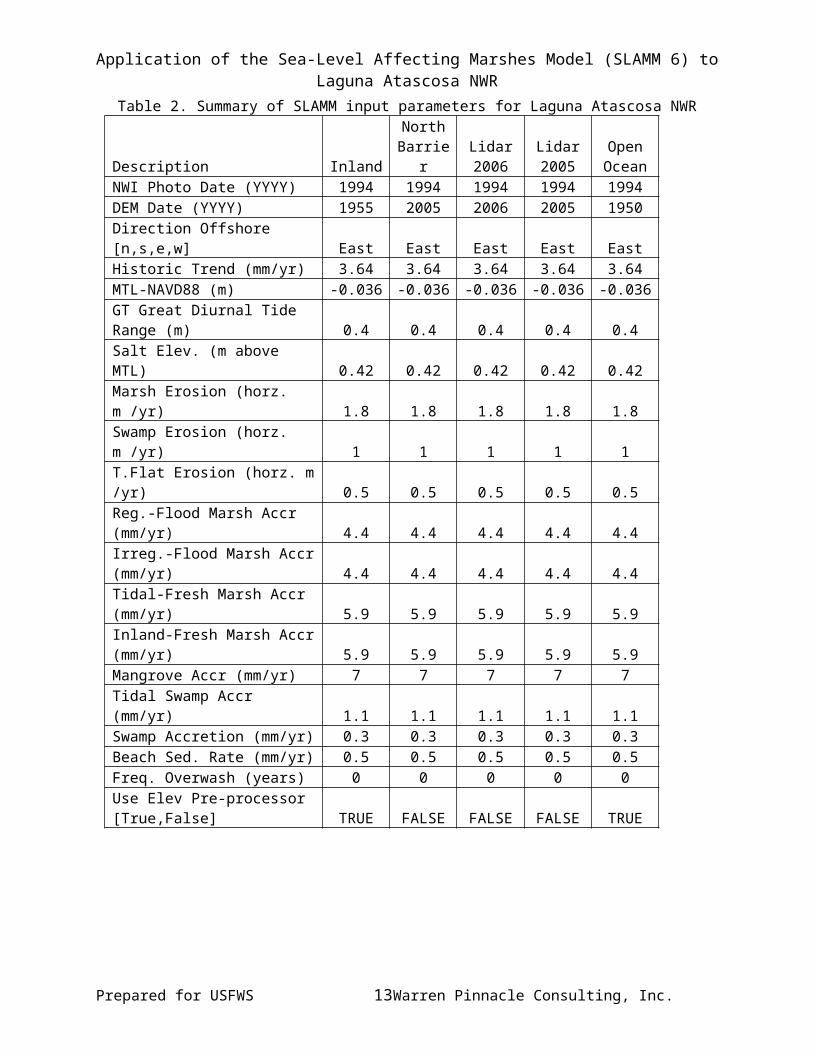
Input subsites and parameter summary. Based on the different dates of the DEM, 5 different simulation input subsites were identified as illustrated in Figure 6. Table 2 summarizes all SLAMM input parameters for each subsite of the study area. Values for parameters with no specific local information were kept at their default value.
Prepared for USFWS 10 Warren Pinnacle Consulting, Inc.

Application of the Sea-Level Affecting Marshes Model (SLAMM 6) to Laguna Atascosa NWR
2006
2005
20051955
1950
Figure 6. Input subsites for model application.
Prepared for USFWS 11 Warren Pinnacle Consulting, Inc.

Application of the Sea-Level Affecting Marshes Model (SLAMM 6) to Laguna Atascosa NWR
Table 2. Summary of SLAMM input parameters for Laguna Atascosa NWR
Description InlandNorth Barrier
Lidar 2006
Lidar 2005
Open Ocean
NWI Photo Date (YYYY) 1994 1994 1994 1994 1994DEM Date (YYYY) 1955 2005 2006 2005 1950Direction Offshore [n,s,e,w] East East East East EastHistoric Trend (mm/yr) 3.64 3.64 3.64 3.64 3.64MTL-NAVD88 (m) -0.036 -0.036 -0.036 -0.036 -0.036GT Great Diurnal Tide Range (m) 0.4 0.4 0.4 0.4 0.4Salt Elev. (m above MTL) 0.42 0.42 0.42 0.42 0.42Marsh Erosion (horz. m /yr) 1.8 1.8 1.8 1.8 1.8Swamp Erosion (horz. m /yr) 1 1 1 1 1T.Flat Erosion (horz. m /yr) 0.5 0.5 0.5 0.5 0.5Reg.-Flood Marsh Accr (mm/yr) 4.4 4.4 4.4 4.4 4.4Irreg.-Flood Marsh Accr (mm/yr) 4.4 4.4 4.4 4.4 4.4Tidal-Fresh Marsh Accr (mm/yr) 5.9 5.9 5.9 5.9 5.9Inland-Fresh Marsh Accr (mm/yr) 5.9 5.9 5.9 5.9 5.9Mangrove Accr (mm/yr) 7 7 7 7 7Tidal Swamp Accr (mm/yr) 1.1 1.1 1.1 1.1 1.1Swamp Accretion (mm/yr) 0.3 0.3 0.3 0.3 0.3Beach Sed. Rate (mm/yr) 0.5 0.5 0.5 0.5 0.5Freq. Overwash (years) 0 0 0 0 0Use Elev Pre-processor [True,False] TRUE FALSE FALSE FALSE TRUE
Prepared for USFWS 12 Warren Pinnacle Consulting, Inc.

Application of the Sea-Level Affecting Marshes Model (SLAMM 6) to Laguna Atascosa NWR
Results
This simulation of the Laguna Atascosa NWR predicts that refuge wetlands will be significantly impacted for all SLR scenarios. Table 3 presents the predicted loss of each wetland category by 2100 for each of the five SLR scenarios examined.
Table 3. Predicted loss rates of land categories by 2100 given simulated scenarios of eustatic SLR at Laguna Atascosa NWR
Land cover categoryInitial
coverage (acres)
Land cover loss by 2100 for different SLR scenarios
0.39 m 0.69 m 1 m 1.5 m 2 m
Undeveloped Dry Land 118773 4% 7% 9% 16% 25%Estuarine Beach 44757 43% 76% 92% 95% 98%Tidal Flat 21961 70% 93% 83% 79% 75%Inland Fresh Marsh 20796 0% 2% 6% 15% 47%Developed Dry Land 5735 3% 5% 7% 14% 23%Irregularly Flooded Marsh 4598 3% 30% 62% 81% 91%Inland Shore 3542 15% 18% 24% 34% 45%Regularly Flooded Marsh 690 -154%(1) -442% -513% -630% -1255%Swamp 193 0% 0% 1% 7% 22%Ocean Beach 139 -141% -436% -666% -430% -160%(1) A negative loss indicates a gain with respect to initial coverage
Approximately 20,000 to 60,000 acres of the refuge are predicted to be converted into open water by 2100, depending on the SLR scenario considered. Undeveloped-dry land, that today covers approximately 50% of the area, is predicted to be relatively resilient with a maximum predicted loss of 25% (29,000 acres) of the current coverage. Similar fractional losses are observed for developed dry land.
Other land cover types, although they currently cover a smaller fraction of the refuge, are predicted to be significantly affected.
The beaches facing the Intracoastal Waterway, in particular on South Padre Island, may experience a loss ranging from 43% to 98%.
For SLR higher than 1 m predicted losses for irregularly-flooded marshes are above 60%. Most of these high marshes are converted to
Prepared for USFWS 13 Warren Pinnacle Consulting, Inc.
Application of the Sea-Level Affecting Marshes Model (SLAMM 6) to Laguna Atascosa NWR
regularly-flooded marsh, a land cover that is predicted to have significant gains for all SLR scenarios considered.
Inland-fresh marsh, because of high elevations and inland location, appears to be resilient to SLR; only above 1.5 m SLR by 2100 do predicted losses for inland-fresh marsh exceed 15%.
Swamp is also predicted to be resilient with losses of only 7% under SLR of 1.5 m, although the current coverage is only 190 acres.
Laguna Atascosa NWRIPCC Scenario A1B-Mean, 0.39 m SLR eustatic by 2100
Results in AcresInitial 2025 2050 2075 2100
Undeveloped Dry Land
Undeveloped Dry Land 118773 116390 115683 114707 113680Estuarine Beach
Estuarine Beach 44757 44683 44556 32242 25436Tidal Flat
Tidal Flat 21961 21983 22201 14411 6695Inland Fresh Marsh
Inland Fresh Marsh 20796 20751 20743 20733 20729Inland Open Water
Inland Open Water 7215 7209 7002 6721 6626Developed Dry Land
Developed Dry Land 5735 5629 5608 5579 5537Irregularly Flooded Marsh
Irregularly Flooded Marsh 4598 4494 4494 4490 4446Inland Shore
Inland Shore 3542 3203 3193 3069 3013Estuarine Open Water
Estuarine Open Water 1399 2161 2590 23226 38015Regularly Flooded Marsh
Regularly Flooded Marsh 690 1727 1562 1588 1756Open Ocean
Open Ocean 497 514 535 547 557Riverine Tidal
Riverine Tidal 419 169 168 167 164Swamp
Swamp 193 193 193 193 193Transitional Salt Marsh
Transitional Salt Marsh 177 1683 2257 3026 3709Ocean Beach
Ocean Beach 139 103 106 195 337Total (incl. water) 230891 230891 230891 230891 230891
Prepared for USFWS 14 Warren Pinnacle Consulting, Inc.

Application of the Sea-Level Affecting Marshes Model (SLAMM 6) to Laguna Atascosa NWR
Laguna Atascosa NWR, Initial Condition
Prepared for USFWS 15 Warren Pinnacle Consulting, Inc.

Application of the Sea-Level Affecting Marshes Model (SLAMM 6) to Laguna Atascosa NWR
Laguna Atascosa NWR, 2025, Scenario A1B Mean, 0.39 m SLR
Prepared for USFWS 16 Warren Pinnacle Consulting, Inc.

Application of the Sea-Level Affecting Marshes Model (SLAMM 6) to Laguna Atascosa NWR
Laguna Atascosa NWR, 2050, Scenario A1B Mean, 0.39 m SLR
Prepared for USFWS 17 Warren Pinnacle Consulting, Inc.

Application of the Sea-Level Affecting Marshes Model (SLAMM 6) to Laguna Atascosa NWR
Laguna Atascosa NWR, 2075, Scenario A1B Mean, 0.39 m SLR
Prepared for USFWS 18 Warren Pinnacle Consulting, Inc.

Application of the Sea-Level Affecting Marshes Model (SLAMM 6) to Laguna Atascosa NWR
Laguna Atascosa NWR, 2100, Scenario A1B Mean, 0.39 m SLR
Prepared for USFWS 19 Warren Pinnacle Consulting, Inc.

Application of the Sea-Level Affecting Marshes Model (SLAMM 6) to Laguna Atascosa NWR
Laguna Atascosa NWRIPCC Scenario A1B-Max, 0.69 m SLR eustatic by 2100
Results in AcresInitial 2025 2050 2075 2100
Undeveloped Dry Land
Undeveloped Dry Land 118773 116051 114856 113052 110942Estuarine Beach
Estuarine Beach 44757 44644 33064 22037 10669Tidal Flat
Tidal Flat 21961 21988 16100 4217 1519Inland Fresh Marsh
Inland Fresh Marsh 20796 20742 20704 20651 20429Inland Open Water
Inland Open Water 7215 7207 6996 6577 6419Developed Dry Land
Developed Dry Land 5735 5620 5584 5523 5437Irregularly Flooded Marsh
Irregularly Flooded Marsh 4598 4476 4380 4024 3239Inland Shore
Inland Shore 3542 3200 3085 2990 2890Estuarine Open Water
Estuarine Open Water 1399 2215 20890 45074 60703Regularly Flooded Marsh
Regularly Flooded Marsh 690 1869 1516 2511 3740Open Ocean
Open Ocean 497 523 562 583 618Riverine Tidal
Riverine Tidal 419 169 167 164 159Swamp
Swamp 193 193 193 193 193Transitional Salt Marsh
Transitional Salt Marsh 177 1876 2618 2888 3187Ocean Beach
Ocean Beach 139 118 177 408 747Total (incl. water) 230891 230891 230891 230891 230891
Prepared for USFWS 20 Warren Pinnacle Consulting, Inc.

Application of the Sea-Level Affecting Marshes Model (SLAMM 6) to Laguna Atascosa NWR
Laguna Atascosa NWR, Initial Condition
Prepared for USFWS 21 Warren Pinnacle Consulting, Inc.

Application of the Sea-Level Affecting Marshes Model (SLAMM 6) to Laguna Atascosa NWR
Laguna Atascosa NWR, 2025, Scenario A1B Maximum, 0.69 m SLR
Prepared for USFWS 22 Warren Pinnacle Consulting, Inc.

Application of the Sea-Level Affecting Marshes Model (SLAMM 6) to Laguna Atascosa NWR
Laguna Atascosa NWR, 2050, Scenario A1B Maximum, 0.69 m SLR
Prepared for USFWS 23 Warren Pinnacle Consulting, Inc.

Application of the Sea-Level Affecting Marshes Model (SLAMM 6) to Laguna Atascosa NWR
Laguna Atascosa NWR, 2075, Scenario A1B Maximum, 0.69 m SLR
Prepared for USFWS 24 Warren Pinnacle Consulting, Inc.

Application of the Sea-Level Affecting Marshes Model (SLAMM 6) to Laguna Atascosa NWR
Laguna Atascosa NWR, 2100, Scenario A1B Maximum, 0.69 m SLR
Prepared for USFWS 25 Warren Pinnacle Consulting, Inc.

Application of the Sea-Level Affecting Marshes Model (SLAMM 6) to Laguna Atascosa NWR
Laguna Atascosa NWR1 m eustatic SLR by 2100
Results in AcresInitial 2025 2050 2075 2100
Undeveloped Dry Land
Undeveloped Dry Land 118773 115710 113948 111121 107772Estuarine Beach
Estuarine Beach 44757 44585 26435 11435 3698Tidal Flat
Tidal Flat 21961 22097 8772 2399 3676Inland Fresh Marsh
Inland Fresh Marsh 20796 20709 20628 19996 19450Inland Open Water
Inland Open Water 7215 7205 6734 6417 5275Developed Dry Land
Developed Dry Land 5735 5611 5549 5445 5313Irregularly Flooded Marsh
Irregularly Flooded Marsh 4598 4417 4026 2727 1763Inland Shore
Inland Shore 3542 3195 3028 2907 2676Estuarine Open Water
Estuarine Open Water 1399 2305 35725 59762 71386Regularly Flooded Marsh
Regularly Flooded Marsh 690 1976 2354 3658 4227Open Ocean
Open Ocean 497 533 581 617 824Riverine Tidal
Riverine Tidal 419 168 165 159 154Swamp
Swamp 193 193 193 193 191Transitional Salt Marsh
Transitional Salt Marsh 177 2062 2466 3362 3420Ocean Beach
Ocean Beach 139 126 287 694 1068Total (incl. water) 230891 230891 230891 230891 230891
Prepared for USFWS 26 Warren Pinnacle Consulting, Inc.

Application of the Sea-Level Affecting Marshes Model (SLAMM 6) to Laguna Atascosa NWR
Laguna Atascosa NWR, Initial Condition
Prepared for USFWS 27 Warren Pinnacle Consulting, Inc.

Application of the Sea-Level Affecting Marshes Model (SLAMM 6) to Laguna Atascosa NWR
Laguna Atascosa NWR, 2025, 1 m SLR
Prepared for USFWS 28 Warren Pinnacle Consulting, Inc.

Application of the Sea-Level Affecting Marshes Model (SLAMM 6) to Laguna Atascosa NWR
Laguna Atascosa NWR, 2050, 1 m SLR
Prepared for USFWS 29 Warren Pinnacle Consulting, Inc.

Application of the Sea-Level Affecting Marshes Model (SLAMM 6) to Laguna Atascosa NWR
Laguna Atascosa NWR, 2075, 1 m SLR
Prepared for USFWS 30 Warren Pinnacle Consulting, Inc.

Application of the Sea-Level Affecting Marshes Model (SLAMM 6) to Laguna Atascosa NWR
Laguna Atascosa NWR, 2100, 1 m SLR
Prepared for USFWS 31 Warren Pinnacle Consulting, Inc.

Application of the Sea-Level Affecting Marshes Model (SLAMM 6) to Laguna Atascosa NWR
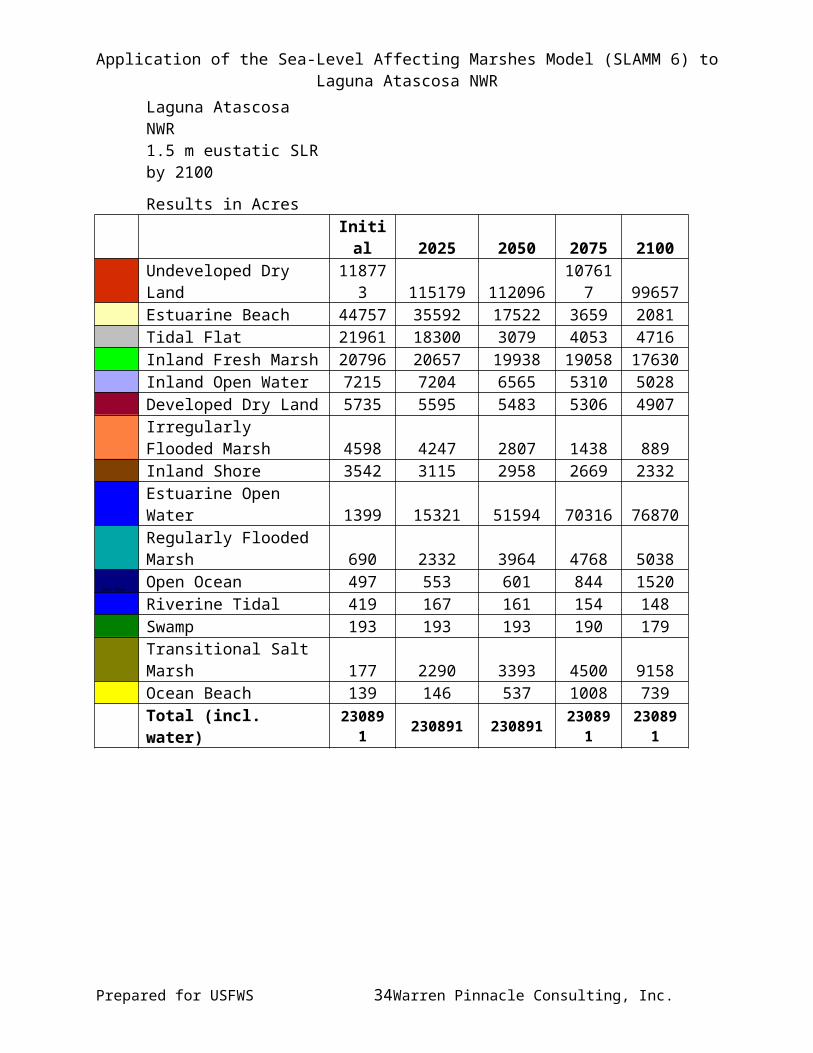
Laguna Atascosa NWR1.5 m eustatic SLR by 2100
Results in AcresInitial 2025 2050 2075 2100
Undeveloped Dry Land
Undeveloped Dry Land 118773 115179 112096 107617 99657Estuarine Beach
Estuarine Beach 44757 35592 17522 3659 2081Tidal Flat
Tidal Flat 21961 18300 3079 4053 4716Inland Fresh Marsh
Inland Fresh Marsh 20796 20657 19938 19058 17630Inland Open Water
Inland Open Water 7215 7204 6565 5310 5028Developed Dry Land
Developed Dry Land 5735 5595 5483 5306 4907Irregularly Flooded Marsh
Irregularly Flooded Marsh 4598 4247 2807 1438 889Inland Shore
Inland Shore 3542 3115 2958 2669 2332Estuarine Open Water
Estuarine Open Water 1399 15321 51594 70316 76870Regularly Flooded Marsh
Regularly Flooded Marsh 690 2332 3964 4768 5038Open Ocean
Open Ocean 497 553 601 844 1520Riverine Tidal
Riverine Tidal 419 167 161 154 148Swamp
Swamp 193 193 193 190 179Transitional Salt Marsh
Transitional Salt Marsh 177 2290 3393 4500 9158Ocean Beach
Ocean Beach 139 146 537 1008 739Total (incl. water) 230891 230891 230891 230891 230891
Prepared for USFWS 32 Warren Pinnacle Consulting, Inc.

Application of the Sea-Level Affecting Marshes Model (SLAMM 6) to Laguna Atascosa NWR
Laguna Atascosa NWR, Initial Condition
Prepared for USFWS 33 Warren Pinnacle Consulting, Inc.

Application of the Sea-Level Affecting Marshes Model (SLAMM 6) to Laguna Atascosa NWR
Laguna Atascosa NWR, 2025, 1.5 m SLR
Prepared for USFWS 34 Warren Pinnacle Consulting, Inc.
Application of the Sea-Level Affecting Marshes Model (SLAMM 6) to Laguna Atascosa NWR
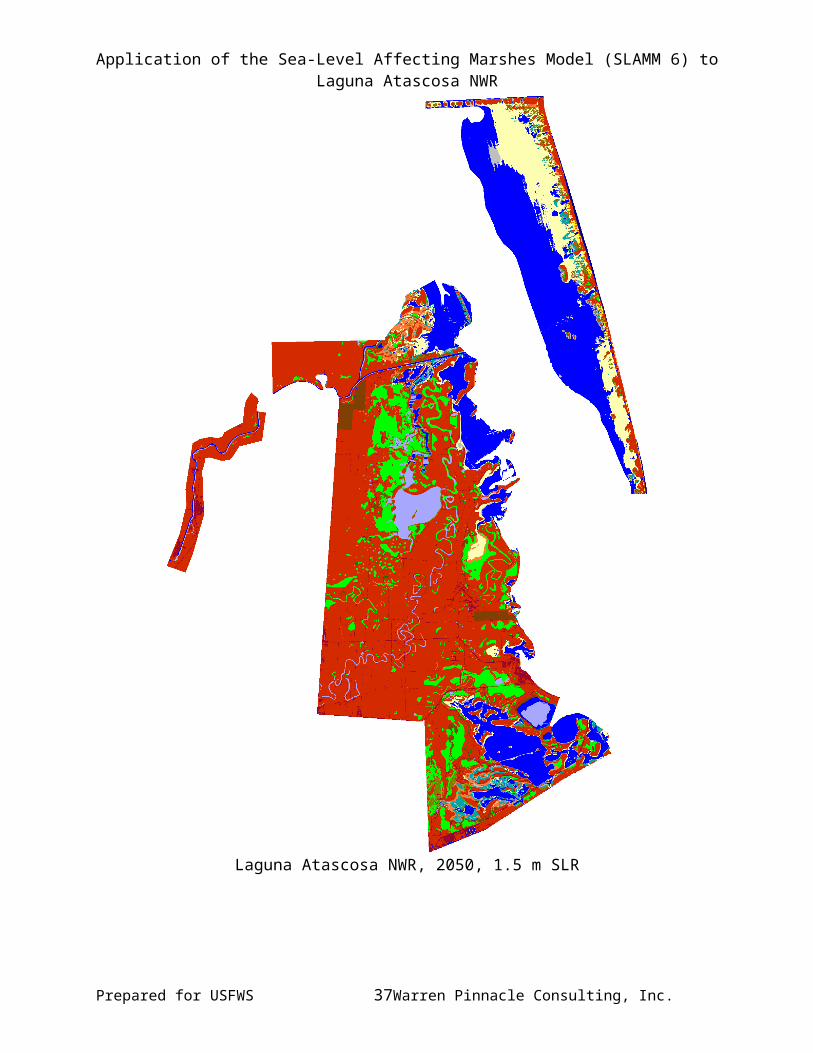
Laguna Atascosa NWR, 2050, 1.5 m SLR
Prepared for USFWS 35 Warren Pinnacle Consulting, Inc.

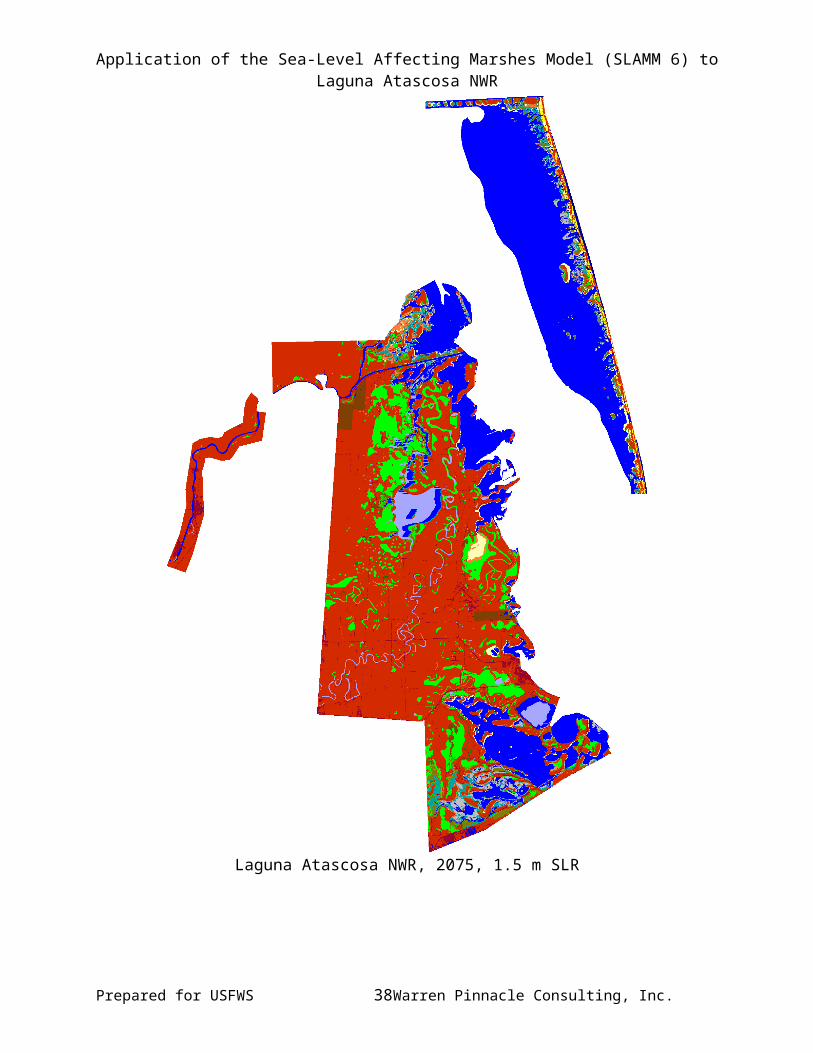
Application of the Sea-Level Affecting Marshes Model (SLAMM 6) to Laguna Atascosa NWR
Laguna Atascosa NWR, 2075, 1.5 m SLR
Prepared for USFWS 36 Warren Pinnacle Consulting, Inc.

Application of the Sea-Level Affecting Marshes Model (SLAMM 6) to Laguna Atascosa NWR
Laguna Atascosa NWR, 2100, 1.5 m SLR
Prepared for USFWS 37 Warren Pinnacle Consulting, Inc.
Application of the Sea-Level Affecting Marshes Model (SLAMM 6) to Laguna Atascosa NWR
Laguna Atascosa NWR2 m eustatic SLR by 2100
Results in AcresInitial 2025 2050 2075 2100
Undeveloped Dry Land
Undeveloped Dry Land 118773 114607 110378 102566 89653Estuarine Beach
Estuarine Beach 44757 30733 8158 2470 1103Tidal Flat
Tidal Flat 21961 12567 3120 4593 5510Inland Fresh Marsh
Inland Fresh Marsh 20796 20583 19385 17657 11103Inland Open Water
Inland Open Water 7215 7202 6431 5150 4900Developed Dry Land
Developed Dry Land 5735 5577 5421 5054 4397Irregularly Flooded Marsh
Irregularly Flooded Marsh 4598 3918 1888 936 393Inland Shore
Inland Shore 3542 3068 2866 2419 1933Estuarine Open Water
Estuarine Open Water 1399 26055 62218 73147 80272Regularly Flooded Marsh
Regularly Flooded Marsh 690 2944 4592 5646 9346Open Ocean
Open Ocean 497 574 643 1233 2031Riverine Tidal
Riverine Tidal 419 167 158 150 137Swamp
Swamp 193 193 193 184 151Transitional Salt Marsh
Transitional Salt Marsh 177 2513 4702 8824 19600Ocean Beach
Ocean Beach 139 191 738 864 362Total (incl. water) 230891 230891 230891 230891 230891
Prepared for USFWS 38 Warren Pinnacle Consulting, Inc.
Application of the Sea-Level Affecting Marshes Model (SLAMM 6) to Laguna Atascosa NWR
Laguna Atascosa NWR, Initial Condition
Prepared for USFWS 39 Warren Pinnacle Consulting, Inc.

Application of the Sea-Level Affecting Marshes Model (SLAMM 6) to Laguna Atascosa NWR
Laguna Atascosa NWR, 2025, 2 m SLR
Prepared for USFWS 40 Warren Pinnacle Consulting, Inc.

Application of the Sea-Level Affecting Marshes Model (SLAMM 6) to Laguna Atascosa NWR
Laguna Atascosa NWR, 2050, 2 m SLR
Prepared for USFWS 41 Warren Pinnacle Consulting, Inc.

Application of the Sea-Level Affecting Marshes Model (SLAMM 6) to Laguna Atascosa NWR
Laguna Atascosa NWR, 2075, 2 m SLR
Prepared for USFWS 42 Warren Pinnacle Consulting, Inc.

Application of the Sea-Level Affecting Marshes Model (SLAMM 6) to Laguna Atascosa NWR
Laguna Atascosa NWR, 2100, 2 m SLR
Prepared for USFWS 43 Warren Pinnacle Consulting, Inc.

Application of the Sea-Level Affecting Marshes Model (SLAMM 6) to Laguna Atascosa NWR
Discussion
For Laguna Atascosa NWR, the areas predicted to be most heavily affected by SLR are the coastal boundaries. By 2100, a large portion of these lands may be inundated under each SLR scenario examined. The beaches on the Intracoastal Waterway are predicted to be significantly affected, with losses ranging from 43% to 98%.
Other wetland types are also predicted to undergo large changes. A considerable portion of the irregularly-flooded marshes will be lost and converted to regularly-flooded marshes for SLR above 1 m. Inland-fresh marshes and swamps are predicted to be resilient due to high elevations and higher dry-lands located between these wetlands and the ocean.
In addition to the land-cover changes cited above, model predictions under higher rates of SLR suggest that the protective functions of the barrier islands will be largely compromised.
The refuge approved acquisition boundary was covered by high-vertical-resolution LiDAR data which reduces model uncertainty.
Regional accretion data were available from the scientific literature and applied on the entire study area. However, more specific measurements of accretion rates within the refuge could provide better predictions of marsh losses in the future.
Prepared for USFWS 44 Warren Pinnacle Consulting, Inc.

Application of the Sea-Level Affecting Marshes Model (SLAMM 6) to Laguna Atascosa NWR
References
Callaway, J. C., DeLaune, R. D., and Patrick, Jr., W. H. (1997). “Sediment Accretion Rates from Four Coastal Wetlands along the Gulf of Mexico.” Journal of Coastal Research, 13(1), 181-191.
Chen, J. L., Wilson, C. R., and Tapley, B. D. (2006). “Satellite Gravity Measurements Confirm Accelerated Melting of Greenland Ice Sheet.” Science, 313, 1958-1960.
Clark, P. U. (2009). Abrupt Climate Change: Final Report, Synthesis and Assessment Product 3. 4. DIANE Publishing.
Clough, J. S., Park, R. A., and Fuller, R. (2010). “SLAMM 6 beta Technical Documentation.”
Council for Regulatory Environmental Modeling. (2008). Draft guidance on the development, evaluation, and application of regulatory environmental models. Draft, Washington, DC.
Craft, C., Clough, J. S., Ehman, J., Joye, S., Park, R. A., Pennings, S., Guo, H., and Machmuller, M. (2009). “Forecasting the effects of accelerated sea-level rise on tidal marsh ecosystem services.” Frontiers in Ecology and the Environment, 7(2), 73-78.
Galbraith, H., Jones, R., Park, R., Clough, J., Herrod-Julius, S., Harrington, B., and Page, G. (2002). “Global Climate Change and Sea Level Rise: Potential Losses of Intertidal Habitat for Shorebirds.” Waterbirds, 25(2), 173.
Glick, P., Clough, J., and Nunley, B. (2007). Sea-level Rise and Coastal Habitats in the Pacific Northwest: An Analysis for Puget Sound, Southwestern Washington, and Northwestern Oregon. National Wildlife Federation.
Grinsted, A., Moore, J. C., and Jevrejeva, S. (2009). “Reconstructing sea level from paleo and projected temperatures 200 to 2100 AD.” Climate Dynamics, 34(4), 461-472.
IPCC. (2001). Climate Change 2001: The Scientific Basis. Contribution of Working Group I to the Third Assessment Report of the Intergovernmental Panel on Climate Change. Cambridge University Press, Cambridge, United Kingdom, 881.
IPCC. (2007). Climate Change 2007: The Physical Science Basis. Cambridge University Press, Cambridge, United Kingdom.
Lee, J. K., Park, R. A., and Mausel, P. W. (1992). “Application of geoprocessing and simulation modeling to estimate impacts of sea level rise on the northeast coast of Florida.” Photogrammetric Engineering and Remote Sensing, 58(11), 1579-1586.
Prepared for USFWS 45 Warren Pinnacle Consulting, Inc.

Application of the Sea-Level Affecting Marshes Model (SLAMM 6) to Laguna Atascosa NWR
Monaghan, A. J., Bromwich, D. H., Fogt, R. L., Wang, S.-H., Mayewski, P. A., Dixon, D. A., Ekaykin, A., Frezzotti, M., Goodwin, I., Isaksson, E., Kaspari, S. D., Morgan, V. I., Oerter, H., Van Ommen, T. D., Van der Veen, C. J., and Wen, J. (2006). “Insignificant Change in Antarctic Snowfall Since the International Geophysical Year.” Science, 313(5788), 827-831.
Moorhead, K. K., and Brinson, M. M. (1995). “Response of Wetlands to Rising Sea Level in the Lower Coastal Plain of North Carolina.” Ecological Applications, 5(1), 261-271.
National Wildlife Federation, and Florida Wildlife Federation. (2006). An Unfavorable Tide: Global Warming, Coastal Habitats and Sportfishing in Florida.
Park, R. A., Trehan, M. S., Mausel, P. W., and Howe, R.C. (1989). “The Effects of Sea Level Rise on U.S. Coastal Wetlands.” The Potential Effects of Global Climate Change on the United States: Appendix B - Sea Level Rise, U.S. Environmental Protection Agency, Washington, DC, 1-1 to 1-55.
Park, R. A., Lee, J. K., Mausel, P. W., and Howe, R. C. (1991). “Using remote sensing for modeling the impacts of sea level rise.” World Resources Review, 3, 184-220.
Park, R. A., Lee, J. K., and Canning, D. J. (1993). “Potential Effects of Sea-Level Rise on Puget Sound Wetlands.” Geocarto International, 8(4), 99.
Pfeffer, W. T., Harper, J. T., and O’Neel, S. (2008). “Kinematic Constraints on Glacier Contributions to 21st-Century Sea-Level Rise.” Science, 321(5894), 1340-1343.
Rahmstorf, S. (2007). “A Semi-Empirical Approach to Projecting Future Sea-Level Rise.” Science, 315(5810), 368-370.
Titus, J. G., Park, R. A., Leatherman, S. P., Weggel, J. R., Greene, M. S., Mausel, P. W., Brown, S., Gaunt, C., Trehan, M., and Yohe, G. (1991). “Greenhouse effect and sea level rise: the cost of holding back the sea.” Coastal Management, 19(2), 171–204.
Vermeer, M., and Rahmstorf, S. (2009). “Global sea level linked to global temperature.” Proceedings of the National Academy of Sciences, 106(51), 21527.
Prepared for USFWS 46 Warren Pinnacle Consulting, Inc.

Application of the Sea-Level Affecting Marshes Model (SLAMM 6) to Laguna Atascosa NWR
Appendix A: Contextual Results
The SLAMM model does take into account the context of the surrounding lands or open water when calculating effects. For example, erosion rates are calculated based on the maximum fetch (wave action) which is estimated by assessing contiguous open water to a given marsh cell. Another example is that inundated dry lands will convert to marshes or ocean beach depending on their proximity to open ocean.
For this reason, an area larger than the boundaries of the USFWS refuge was modeled. Maps of these results are presented here with the following caveats:
Results were closely examined (quality assurance) within USFWS refuges but not closely examined for the larger region.
Site-specific parameters for the model were derived for USFWS refuges whenever possible and may not be regionally applicable.
Especially in areas where dikes are present, an effort was made to assess the probable location and effects of dikes for USFWS refuges, but this effort was not made for surrounding areas.
Prepared for USFWS 47 Warren Pinnacle Consulting, Inc.

Application of the Sea-Level Affecting Marshes Model (SLAMM 6) to Laguna Atascosa NWR
Laguna Atascosa NWR within simulation context (white).
Prepared for USFWS 48 Warren Pinnacle Consulting, Inc.

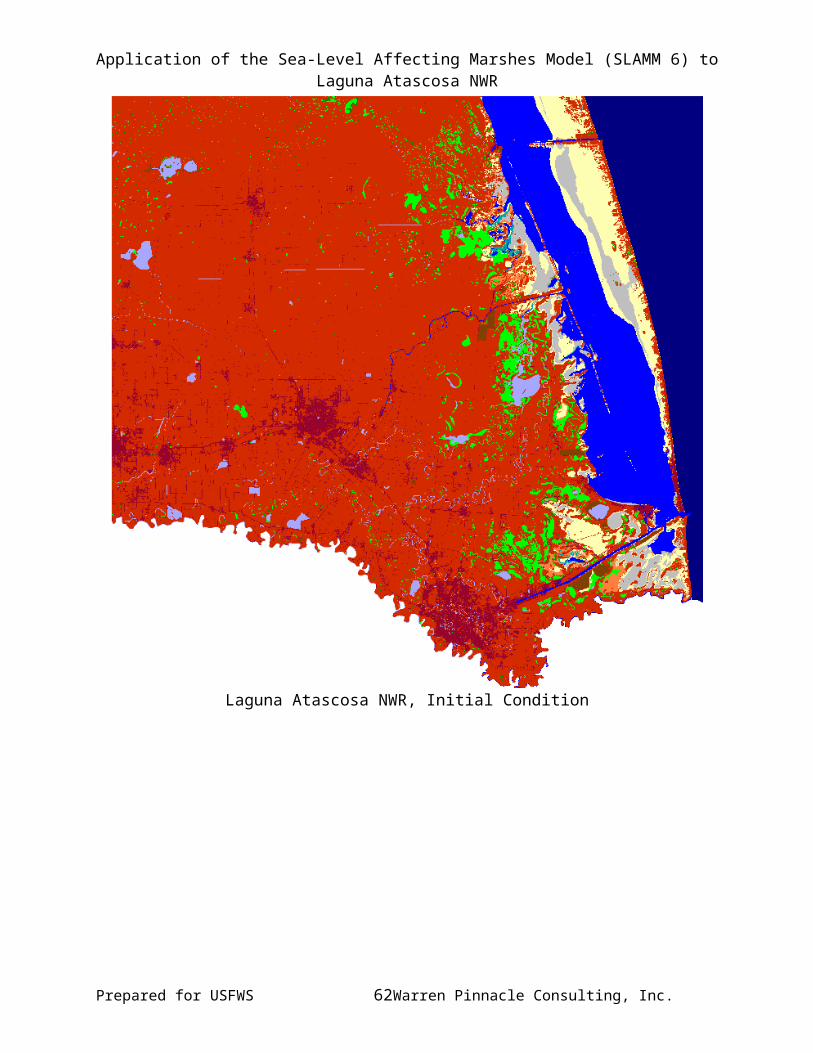
Application of the Sea-Level Affecting Marshes Model (SLAMM 6) to Laguna Atascosa NWR
Laguna Atascosa NWR, Initial Condition
Prepared for USFWS 49 Warren Pinnacle Consulting, Inc.

Application of the Sea-Level Affecting Marshes Model (SLAMM 6) to Laguna Atascosa NWR
Laguna Atascosa NWR, 2025, Scenario A1B Mean, 0.39 m SLR
Prepared for USFWS 50 Warren Pinnacle Consulting, Inc.

Application of the Sea-Level Affecting Marshes Model (SLAMM 6) to Laguna Atascosa NWR
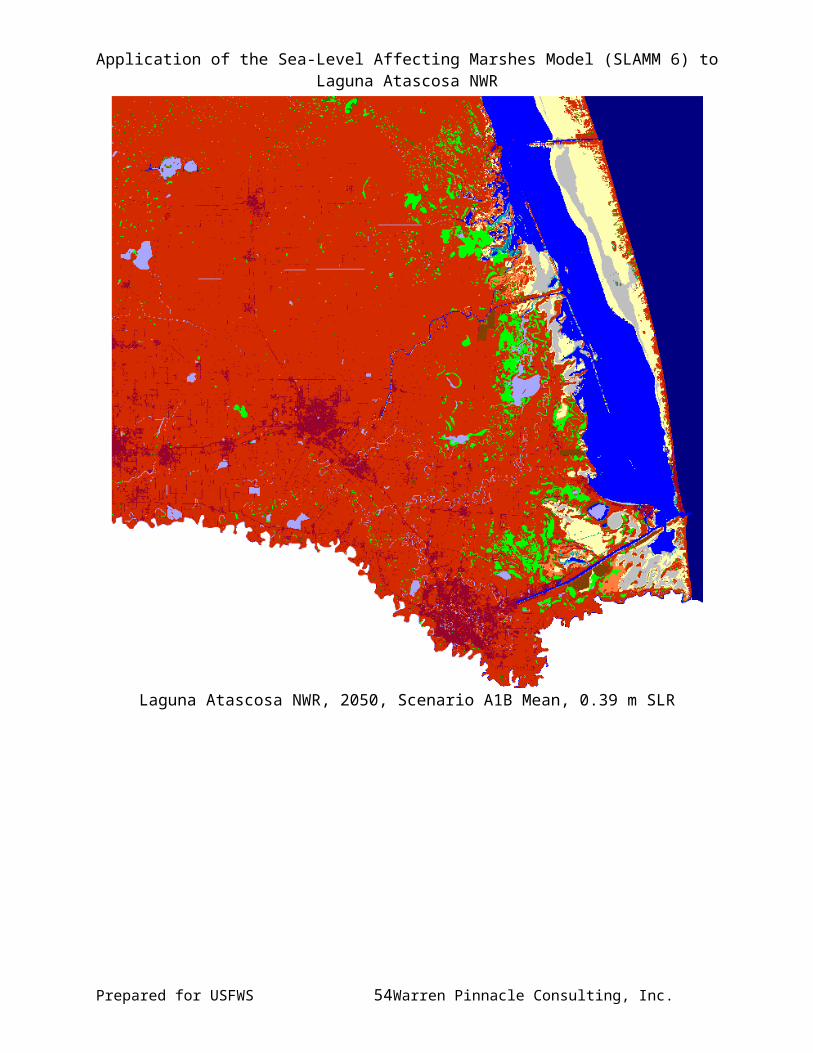
Laguna Atascosa NWR, 2050, Scenario A1B Mean, 0.39 m SLR
Prepared for USFWS 51 Warren Pinnacle Consulting, Inc.

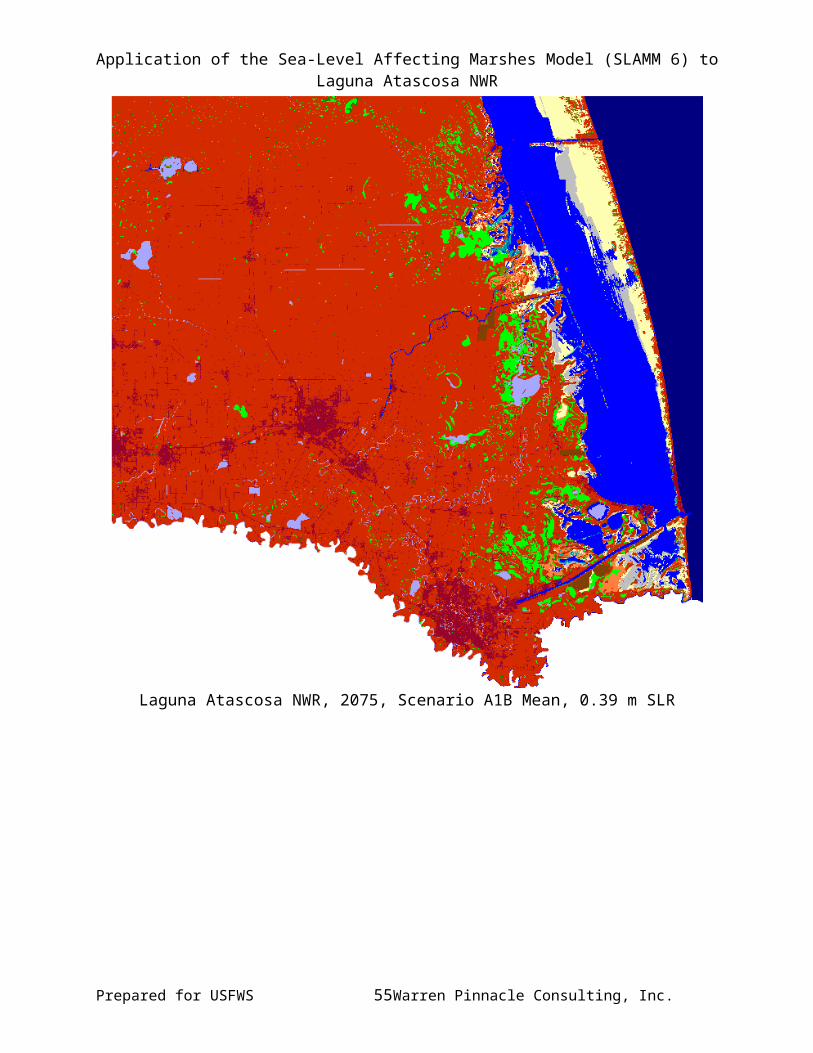
Application of the Sea-Level Affecting Marshes Model (SLAMM 6) to Laguna Atascosa NWR
Laguna Atascosa NWR, 2075, Scenario A1B Mean, 0.39 m SLR
Prepared for USFWS 52 Warren Pinnacle Consulting, Inc.

Application of the Sea-Level Affecting Marshes Model (SLAMM 6) to Laguna Atascosa NWR
Laguna Atascosa NWR, 2100, Scenario A1B Mean, 0.39 m SLR
Prepared for USFWS 53 Warren Pinnacle Consulting, Inc.

Application of the Sea-Level Affecting Marshes Model (SLAMM 6) to Laguna Atascosa NWR
Laguna Atascosa NWR, Initial Condition
Prepared for USFWS 54 Warren Pinnacle Consulting, Inc.
Application of the Sea-Level Affecting Marshes Model (SLAMM 6) to Laguna Atascosa NWR
Laguna Atascosa NWR, 2025, Scenario A1B Maximum, 0.69 m SLR
Prepared for USFWS 55 Warren Pinnacle Consulting, Inc.
Application of the Sea-Level Affecting Marshes Model (SLAMM 6) to Laguna Atascosa NWR
Laguna Atascosa NWR, 2050, Scenario A1B Maximum, 0.69 m SLR
Prepared for USFWS 56 Warren Pinnacle Consulting, Inc.

Application of the Sea-Level Affecting Marshes Model (SLAMM 6) to Laguna Atascosa NWR
Laguna Atascosa NWR, 2075, Scenario A1B Maximum, 0.69 m SLR
Prepared for USFWS 57 Warren Pinnacle Consulting, Inc.

Application of the Sea-Level Affecting Marshes Model (SLAMM 6) to Laguna Atascosa NWR
Laguna Atascosa NWR, 2100, Scenario A1B Maximum, 0.69 m SLR
Prepared for USFWS 58 Warren Pinnacle Consulting, Inc.

Application of the Sea-Level Affecting Marshes Model (SLAMM 6) to Laguna Atascosa NWR
Laguna Atascosa NWR, Initial Condition
Prepared for USFWS 59 Warren Pinnacle Consulting, Inc.

Application of the Sea-Level Affecting Marshes Model (SLAMM 6) to Laguna Atascosa NWR
Laguna Atascosa NWR, 2025, 1 m SLR
Prepared for USFWS 60 Warren Pinnacle Consulting, Inc.

Application of the Sea-Level Affecting Marshes Model (SLAMM 6) to Laguna Atascosa NWR
Laguna Atascosa NWR, 2050, 1 m SLR
Prepared for USFWS 61 Warren Pinnacle Consulting, Inc.

Application of the Sea-Level Affecting Marshes Model (SLAMM 6) to Laguna Atascosa NWR
Laguna Atascosa NWR, 2075, 1 meter
Prepared for USFWS 62 Warren Pinnacle Consulting, Inc.
Application of the Sea-Level Affecting Marshes Model (SLAMM 6) to Laguna Atascosa NWR
Laguna Atascosa NWR, 2100, 1 m SLR
Prepared for USFWS 63 Warren Pinnacle Consulting, Inc.

Application of the Sea-Level Affecting Marshes Model (SLAMM 6) to Laguna Atascosa NWR
Laguna Atascosa NWR, Initial Condition
Prepared for USFWS 64 Warren Pinnacle Consulting, Inc.

Application of the Sea-Level Affecting Marshes Model (SLAMM 6) to Laguna Atascosa NWR
Laguna Atascosa NWR, 2025, 1.5 m SLR
Prepared for USFWS 65 Warren Pinnacle Consulting, Inc.

Application of the Sea-Level Affecting Marshes Model (SLAMM 6) to Laguna Atascosa NWR
Laguna Atascosa NWR, 2050, 1.5 m SLR
Prepared for USFWS 66 Warren Pinnacle Consulting, Inc.

Application of the Sea-Level Affecting Marshes Model (SLAMM 6) to Laguna Atascosa NWR
Laguna Atascosa NWR, 2075, 1.5 m SLR
Prepared for USFWS 67 Warren Pinnacle Consulting, Inc.

Application of the Sea-Level Affecting Marshes Model (SLAMM 6) to Laguna Atascosa NWR
Laguna Atascosa NWR, 2100, 1.5 m SLR
Prepared for USFWS 68 Warren Pinnacle Consulting, Inc.

Application of the Sea-Level Affecting Marshes Model (SLAMM 6) to Laguna Atascosa NWR
Laguna Atascosa NWR, Initial Condition
Prepared for USFWS 69 Warren Pinnacle Consulting, Inc.

Application of the Sea-Level Affecting Marshes Model (SLAMM 6) to Laguna Atascosa NWR
Laguna Atascosa NWR, 2025, 2 m SLR
Prepared for USFWS 70 Warren Pinnacle Consulting, Inc.

Application of the Sea-Level Affecting Marshes Model (SLAMM 6) to Laguna Atascosa NWR
Laguna Atascosa NWR, 2050, 2 m SLR
Prepared for USFWS 71 Warren Pinnacle Consulting, Inc.

Application of the Sea-Level Affecting Marshes Model (SLAMM 6) to Laguna Atascosa NWR
Laguna Atascosa NWR, 2075, 2 m SLR
Prepared for USFWS 72 Warren Pinnacle Consulting, Inc.

Application of the Sea-Level Affecting Marshes Model (SLAMM 6) to Laguna Atascosa NWR
Laguna Atascosa NWR, 2100, 2 m SLR
Prepared for USFWS 73 Warren Pinnacle Consulting, Inc.