slam: a strategy to sl.ow a.sh m.ortality caused by ... · slam pilot project –moran & st....
TRANSCRIPT

Dr. Deborah G. McCullough
Dept. of Entomology & Dept. of Forestry
Michigan State University
Dr. Rodrigo Mercader
Dept. of Biology, Washburn University
SLAM: A Strategy to SL.ow A.sh M.ortality
Caused by Emerald Ash Borer

SLAM Pilot Project – Moran & St. Ignace
Fall 2007: EAB outlier site was identified when a girdled tree was debarked near Moran, MI. Delimitation survey identified 13 trees with low larval densities with 0.5 miles.
A single infested tree was found in 2007 at St. Ignace.
Moran - 2007 2009 Project Area

Michigan State University
Michigan Tech University
MI Dept. of Agriculture
MI Dept. Natural Resources
USDA Forest Service – NA Forest Health Protection;
Northern Research Station; Hiawatha NF
USDA APHIS
SLAM Pilot Project Cooperators
Funding: Forest Service, ARRA

SLAM = SL.owing A.sh M.ortality
Goals: Reduce the rate of EAB population growth to delay the onset & slow the progression of widespread ash decline & mortality.
Develop, implement & evaluate an integrated strategy appropriate for individual sites.
Focus is on the ash resource (not SLEAB!)

Girdled & debarked ash trees function as “sinks.”
Systemic insecticide treatment (emamectin benzoate):
TREE-äge® applied as a trunk injection provides nearly
100% control of EAB adults & larvae for up to 3 years.
Ash utilization: Timber harvests reduce phloem
available to EAB & provide value to landowners.
Tactics to suppress EAB population growth
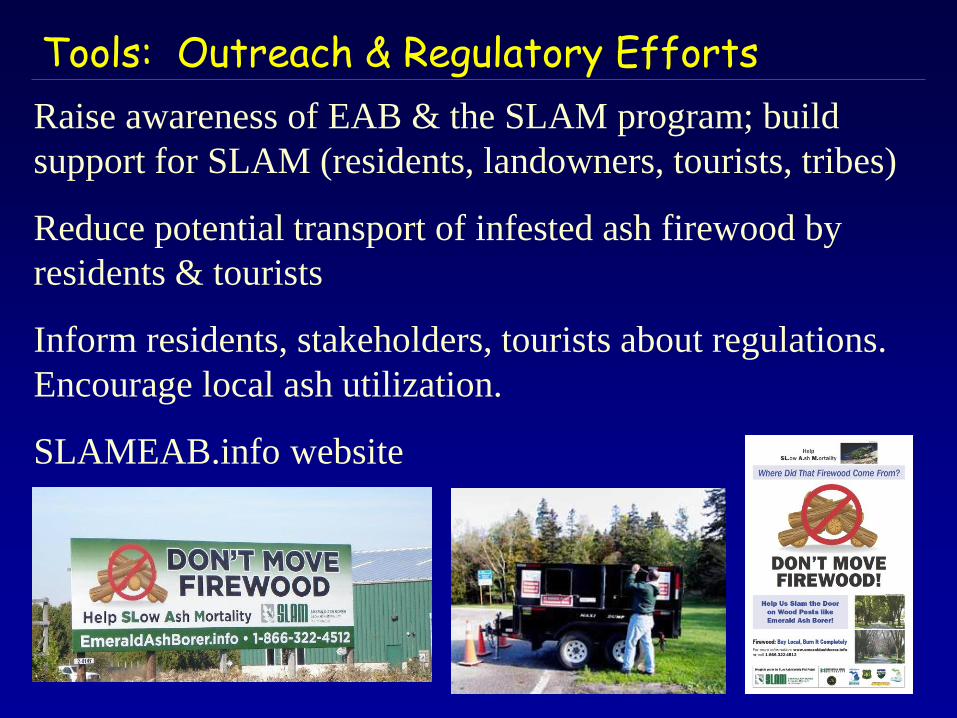
Tools: Outreach & Regulatory Efforts
Raise awareness of EAB & the SLAM program; build
support for SLAM (residents, landowners, tourists, tribes)
Reduce potential transport of infested ash firewood by
residents & tourists
Inform residents, stakeholders, tourists about regulations.
Encourage local ash utilization.
SLAMEAB.info website
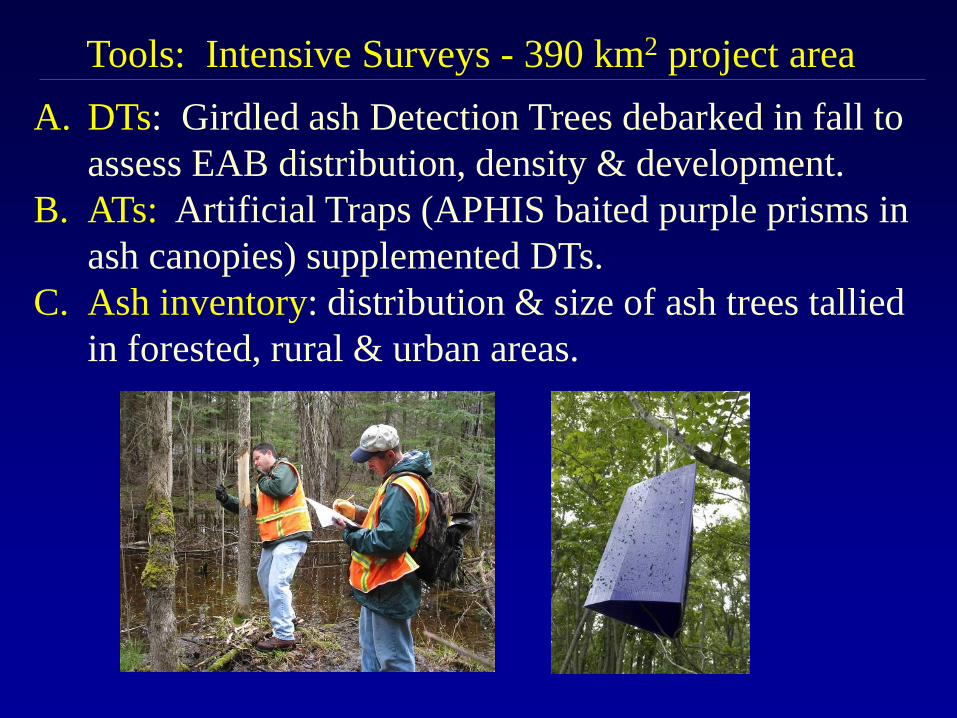
A. DTs: Girdled ash Detection Trees debarked in fall to
assess EAB distribution, density & development.
B. ATs: Artificial Traps (APHIS baited purple prisms in
ash canopies) supplemented DTs.
C. Ash inventory: distribution & size of ash trees tallied
in forested, rural & urban areas.
Tools: Intensive Surveys - 390 km2 project area

Extensive inventory of ash across the project area in
2010 & 2011. Inventory data & ash phloem model were
used to calculate & map ash phloem for each grid cell.
0
20
40
60
80
100
0 10 20 30 40 50 60 70
DBH (cm)
Su
rfa
ce a
rea (
m2)
Second-order polynomial model: y = 0.024x2 - 0.307x + 2.63; r2 = 0.94
y = 0.024x2 – 0.307x + 2.63
r2 = 0.94
DBH (cm)
Su
rfac
e ar
ea (
m2)
McCullough & Siegert.
2007. J. Econ. Entomol.
Tools: Ash Inventory & Ash Phloem Model
Ash phloem

Tools: Coupled Map Lattice Model
1. Adult EAB disperse
2. Adults reproduce (1 & 2-year cohorts tracked)
3. Phloem is consumed by larvae
4. EAB population grows
Ash phloemEAB
Mercader et al. 2011. CJFR; Mercader et al. 2011. Pop. Ecol.

Systematic trap grids (DTs, ATs or both) were established
in a 6 mile radius around known infested trees annually.
1 trap per 40 acres ≈1-2 miles
1 trap per 160 acres 1-3 miles
1 trap per 640 acres 3-6 miles
Number 2008 2009 2010 2011
DTs 444 603 748 855
ATs 229
(171)
331
(99)
475
(0)
480
(0)
Project Area: > 390 km2

Moran: 2009 larval counts from DTs plus 800m buffers
0.1-1 per m2
1-2
2-6
6-8
8-34No EAB

Proposed Treatments for 2009 (but not realized!)
Girdle trees within 150m
Inject trees within
150 m to 400 m
Satellites
Clusters of girdled trees
Inject trees within
400m to 800m
Primary “Core”

Insecticide use in the SLAM Project area was limited by:
(1) Hiawatha National Forest
(2) HNF Wilderness area & (3) HNF Research Area
(4) Endangered dragonfly habitat (expanded in 2009)
(5) Wild & Scenic River corridor
Most treated trees were on right-of-ways along roads.
2009: 229 trees 2010: 358 treesProtected areas

Positive DTs & ATs
2010
Larval Counts in DTs
2010
20112011

Results from SLAM Pilot Project
McCullough et al. 2015. Can Entomol. 147: 349-358.
McCullough. 2015. SLAM. EAB University Webinar
www.emeraldashborer.info
McCullough & Mercader. 2012. Int. J. Pest Manage. 58: 9-23
Mercader et al. 2016. Forest Ecol. Manage. 366: 87-97.
Mercader et al. 2015. Forest Ecol. Manage. 350: 70-80.
Mercader et al. 2013. Environ. Entomol. 42: 1027-1039.
Mercader et al. 2012. J. Econ. Entomol. 105: 272-281.

Mercader et al. 2013. Environ. Entomol.
Girdled ash Detection Trees were much more effective
than baited Artificial Traps.
Pro
bab
ilit
y o
f D
etec
tio
n
Mean larvae per tree within 800 m
0 5 10 15 20 250
0
.20
.4
0.6
0
.8
1
.0

St Ignace: 0.58 km per yrMoran: 1.50 -1.75 km per yr
Estimated rates of EAB spread
The larger Moran infestation likely became established
earlier than the St. Ignace infestation, or more EAB were
originally introduced, or both. Infestations merged in 2010.
2008 2009 2010 2011 2008 2009 2010 2011
Mercader et al. 2016. For. Ecol. Manage.

Key Result: TREE-äge injections slowed EAB
population growth
Effects of insecticide treatment persisted at least 2 years.
2010 injections slowed EAB population growth in 2011
2009 injections slowed growth in 2010 & in 2011
Number of treated trees was significant (P=0.009).
Area of treated ash phloem was not (P=0.21).
Insecticide treatment did not exert a detectable effect on
spread of the infestation.
McCullough et al. 2015. Can. Entomol.
Mercader et al. 2015. For. Ecol. Manage.

Key Result: Sinks (girdled & debarked ash trees)
Sinks reduced EAB population growth the following year
but the effect did not persist for 2 years.
Number of sinks reduced population growth (P=0.015).
Sinks had a small but detectable effect on EAB spread.
Effect depended on the proportion of ash phloem in a grid
cell that was in girdled trees & on EAB density.
Interactions were significant; Sinks attract EAB & larval
counts on nearby trees can increase (spillover effect).
• Treat as many trees as possible with TREE-äge to slow
EAB population growth. This insecticide remains effective
for up to 3 years.
• Treating more trees has a greater effect on slowing EAB
population growth than selectively treating large trees.
• Insecticide treatments did not slow EAB spread. Long
distance EAB dispersal behavior & cues that trigger
dispersal not well understood.
(Mercader et al. 2012; Env. Entomol.)
• Treating trees with TREE-äge retains ecological services
provided by mature trees & can protect future seed source.
Lessons Learned...

• Heavily infested ash trees should be removed, ideally
before high densities of EAB adults can emerge.
• Ash utilization can provide value for landowners.
Merchantable trees (>12 inch DBH) represent a small
portion of the ash resource in forested settings but produce
a high proportion of the EAB.
• Simply removing ash trees, however, is not a SLAM
strategy. Ash removal had a small effect on EAB
population growth & eventually increased spread rates.
• Combine ash removal with other tactics (sinks, TREE-age)
Lessons Learned...

• Girdled ash trees are highly attractive to EAB in low
density sites & are the most effective detection tool.
• Choose small (4-8 inch DBH) trees for detection trees.
Small trees can be efficiently girdled & debarked.
• Debarking girdled ash trees in low density sites:
(1) Provides useful data on EAB density & development
(2) Kills larvae on those trees, slowing population growth
(3) Retains beetles in the area, slowing spread
Lessons Learned...
•Coupling girdled trees with “toxic trees”
should be highly effective.

AcknowledgementsSLAM Management Board: John Bedford, Bob Heyd,
Steve Katovich, Deb McCullough, Brenda Owen, Therese
Poland, Andrew Storer, Amos Ziegler
Also thanks to Gabriel Carballo, Noel Schneeberger,
Travis Perkins, Anne Collins, Nate Siegert, Ken Rauscher,
Jean Perkins, Sandy Liebhold, MDA inspectors, the survey
crews, & media people in the UP.
Funding: US Forest Service NA FHP & ARRA

Strong fit between our simulation model & EAB distribution
in Moran (r2 = 0.937). Including treatment effects
improved the fit. Fit was shaky near the edge of the project
area (very low EAB density = low detection ability).
A) 2010 B) 2011
Model allowed us to compare predicted versus observed
EAB population growth & spread
Mercader et al. 2016. For. Ecol. Manage.