skin analysis software cm-sa ver.1 · pdf file• skin analysis software cm-sa installation...
TRANSCRIPT

Skin Analysis Software CM-SAVer.1.1
Instruction Manual

Formal designations of application software used in this manual
(Designation in this manual) (Formal designation)
Windows, Windows 2000 Microsoft® Windows® 2000 Professional Operating System
Windows, Windows XP Microsoft® Windows® XP Professional Operating System
Windows, Windows Vista Microsoft® Windows® Vista Business Operating System
Trademarks
“Microsoft”, “Windows”, “Windows 2000”, “Windows XP” and “Windows Vista” are registered trademarks of Microsoft Corporation in the U.S.A. and other countries.“Intel” and “Pentium” are registered trademarks of Intel Corporation in the U.S.A. and other countries.Other company names and product names mentioned in this manual are the registered trademarks or trademarks of their respective companies.
Notes on this manual
No part of this manual may be reprinted or reproduced in any form or by any means without the permission of Konica Minolta Sensing, Inc.The contents of this manual are subject to change without notice.Every effort has been made to ensure the accuracy of the contents of this manual. However, should you have any questions or comments, or find an error or missing section, please contact your local sales office.Konica Minolta accepts no responsibility for consequences resulting from failure to follow the instructions outlined in this manual, the condition above notwithstanding.
•
•
•
••
•
Safety PrecautionsBefore you use the CM-SA software, we recommend that you thoroughly read this manual as well as the instruction manuals of your PC and the instrument.

1
Introduction The Skin Analysis Software CM-SA is designed to measure skin with a spectrophotometer (CM-700d, CM-600d, CM-2600d or CM-2500d) connected to a personal computer to obtain Melanin Index, Hb Index and Hb SO2 Index. This document assumes that readers are familiar with basic Windows operations.
Package Contents • Skin Analysis Software CM-SA Installation CD-ROM: 1 • Installation Guide • Authorized Service Facility
Software License Agreement The terms of the license agreement of the CM-SA software are provided in the Software License Agreement dialog box displayed on-screen during the installation process. The license agreement of this software includes banned usage. This software can be installed only if you agree to all the terms of the agreement.
Notes on Use • The CM-SA application software is designed to be used with the Windows 2000, Windows
XP or Windows Vista operating system. Note that neither operating system is included with this software.
• One of these operating systems must be installed on the PC before this software can be installed.
• When inserting the CD-ROM into the CD-ROM drive, note the correct orientation of the disc. Insert it gently.
• Keep the CD-ROM clean and free from scratches. If the recorded surface becomes dirty or the label surface is scratched, a read error may result.
• Avoid exposing the CD-ROM to rapid temperature changes and condensation. • Avoid leaving it in locations where it may be exposed to high temperatures from direct
sunlight or heaters. • Do not drop the CD-ROM or subject it to strong impact. • Keep the CD-ROM away from water, alcohol, paint thinners, and other such substances. • Remove the CD-ROM from the CD-ROM drive while the computer is turned on.
Notes on Storage • After using the CD-ROM, return it to its case and store in a safe place. • Avoid leaving the CD-ROM in locations where it may be exposed to high temperatures from
direct sunlight or heaters. • The CD-ROM should not be kept in areas of high humidity.
Every effort has been made to ensure the accurate operation of this software. However, should you have any questions or comments, please contact the nearest KONICA MINOLTA SENSING authorized service facility.

2
System Requirements System Requirements
OS Windows 2000 Professional SP4 Windows XP Professional SP2 Windows Vista Business x86 Edition
English and Japanese versions of the above operating systems. ・ The hardware of the computer system to be used must meet or
exceed the greater of the recommended system requirements for the compatible OS being used or the following specifications.
Computer PC equipped with a processor equivalent to Pentium III 600MHz or better
Memory 128 MB (256 MB recommended) Hard disk drive 1000 MB of available hard disk space Display Display hardware capable of displaying 1024 x 768 pixels / 16-bit
color or better Others CD-ROM drive (Required for installation)
USB port or serial port (Required for connection of the instrument)
Compatible Instruments
Instruments Spectrophotometer CM-700d, CM-600d, CM-2600d, CM-2500d
Language
Display language English (Japanese can be installed when using a Japanese OS)

3
1. Major functions of the software Skin data display
Melanin Index Hb Index [Hemoglobin (oxidized and reduced) index] Hb SO2 Index (%) [Hemoglobin oxygen saturation index (%)]
Colorimetric value display *1
L*, a*, b*, Munsell value (Hue, Value, Chroma)
Graph display Hue-Value Graph Hb Index-Melanin Index Graph
Data output *3 Saving/reading data in CM-SA original format Saving data in text (CSV) format [Melanin Index, Hb Index, Hb SO2 Index (%), L*, a*, b*, Munsell (Hue, Value, Chroma), Spectral reflectance (400-700 nm) *2]
*1 The Munsell value is calculated under environmental conditions of 2° observer and
illuminant C.
*2 The spectral reflectance to be output is the reflectance obtained in SCI (specular
component included) mode.
*3 The saved data in text format can be used with general application software such as a
text editor or Excel. The CM-SA software cannot reload the saved data in text format. For
that purpose, you need to save the data in the original CM-SA format.
2. Connecting the Instrument to the PC For the procedure for connecting the instrument to the PC, refer to “Connecting to an External Device - Connecting a Personal Computer” in the instruction manual of the instrument. It is unnecessary to set communication parameters with this software.
2.1. Setting the serial port (COM port) If the connection with the instrument fails, the software displays the COM port setting screen.
Note: When some connection failure such as the measuring button on the instrument becoming disabled occurs during use of this software, select “Connect” from the “Instrument” menu for reconnection. If the problem is not solved, refer to “Connecting to an External Device - Connecting a Personal Computer” and “Troubleshooting” in the instruction manual of the instrument.

3. Operation Flow
Starting the software
4
• Editing a data name/comment • Saving the file • Data output (saving data in CSV format) • Printing • Magnifying and copying the graph
• Setting a default data name • Adding a group • Setting illuminant/observer • Setting the options
Measurement
Calibration of the instrument (zero calibration, white calibration)
Exiting the software

4. Starting/Exiting the Software To start the software, select “KONICA MINOLTA” - “Skin Analysis Software CM-SA” in the Windows Start menu, or double-click the “Skin Analysis Software CM-SA” shortcut icon on the desktop. To exit the software, select “Exit” from the “File” menu.
5. Calibration When the software is started, it automatically displays the calibration screen. You can also perform calibration by selecting “Calibration” from the “Instrument” menu. Follow the instructions displayed on the screen to perform the calibration correctly. For precautions on the calibration, refer to the instruction manual for the instrument. If the instrument has already been calibrated, you can cancel calibration. If you changed the measurement area by setting the measurement area selector on the instrument, you must perform calibration in the environment of the selected measurement area.
- Zero calibration screen - - White calibration screen -
5

6. Measurement Press the measuring button on the instrument to start measurement. Before starting measurement, be sure to check the connection between the instrument and PC, and the measurement area setting of the instrument (CM-700d and CM-2600d only).
Note: The measured data can be linked to a selected group. Each group can
store a maximum of 100 data measurements.
6.1. Setting the default data name and comment Before starting measurement, specify the default data name and comment. Select “Set Default data name setting” from the “Data” menu. Up to 30 characters can be used for the default data name and comment. The measured data is named in the format of “Data name + Data No.”. You can select whether to use the date and time of the measurement as a comment. To do so, check “Set date and time as comment.”.
6

6.2. Editing the data name and comment
To edit the data name and comment after measurement, select “Edit data name” from the “Data” menu. Up to 40 characters can be used for the data name and comment.
6.3. Deleting data To delete data, select the data and then select “Delete data” from the “Data” menu.
6.4. Showing data properties To show data properties, select the data and then select “Show Property” from the “Data” menu. The following information about the data is displayed.
Data property Data name, comment, date and time of the measurement, instrument model, body number, measurement area and specular component mode
7

6.5. Adding a group and editing a group name
This software allows data management by group. Adding a group To add a group, select “Add Group” from the “Data” menu. Up to 20 groups can be created. Each group can store a maximum of 100 data measurements. Editing a group name To edit a group name, select the group and then select “Edit Group Name” from the “Data” menu.
6.6. Deleting a group To delete a group, select the group and then select “Delete Group” from the “Data” menu. Note: When a group is deleted, all the data belonging to the group is also deleted.
6.7. Checking/unchecking all data To check/uncheck (select/unselect) all the data in the data list, select “Check All data” or “Uncheck All data” from the “Data” menu. Only the selected data (checked data in the data list) will be plotted on a graph, saved in CSV format, or printed.
8

9
7. Creating a New File and Saving/Opening a File 7.1. Creating a new file
To create a new file, select “New” from the “File” menu. The file is created in the original format (extension: mln).
7.2. Saving a file To save a file, select “Save As” or “Save” from the “File” menu. The file is saved in the original format (extension: mln).
7.3. Opening a file To open an existing file, select “Open” from the “File” menu. You can open only files which are in the original format (extension: mln).

10
8. Data Output (Save in CSV Format) and Printing 8.1. Data output (Save in CSV format)
By selecting data output (“Save As” option), you can save data in CSV (Comma Separated Values) format. - Contents to be saved -
1 Group name 2 Data name 3 Comment 4 Date 5 Time 6 Melanin Index 7 Hb Index 8 Hb SO2 Index (%) 9 Munsell Hue
10 Munsell Value 11 Munsell Chroma 12 L* 13 a* 14 b*
15-45 Reflectance (400 nm to 700 nm)
8.2. Printing Select the destination printer and select “Print” from the “File” menu. The printout is output in landscape orientation.

9. Graph Display 9.1. Munsell Hue-Value graph
The Munsell Hue-Value graph is displayed in the lower left of the screen.
9.2. Hb Index-Melanin Index graph The Hb Index-Melanin Index graph is displayed in the lower right of the screen.
11

9.3. Magnifying and copying the graph
To magnify the graph (maximum display), double-click on the graph. To copy the graph in the clipboard, magnify it and then select Copy from the right-click menu.
Right-click the graph and select “Copy”.
12
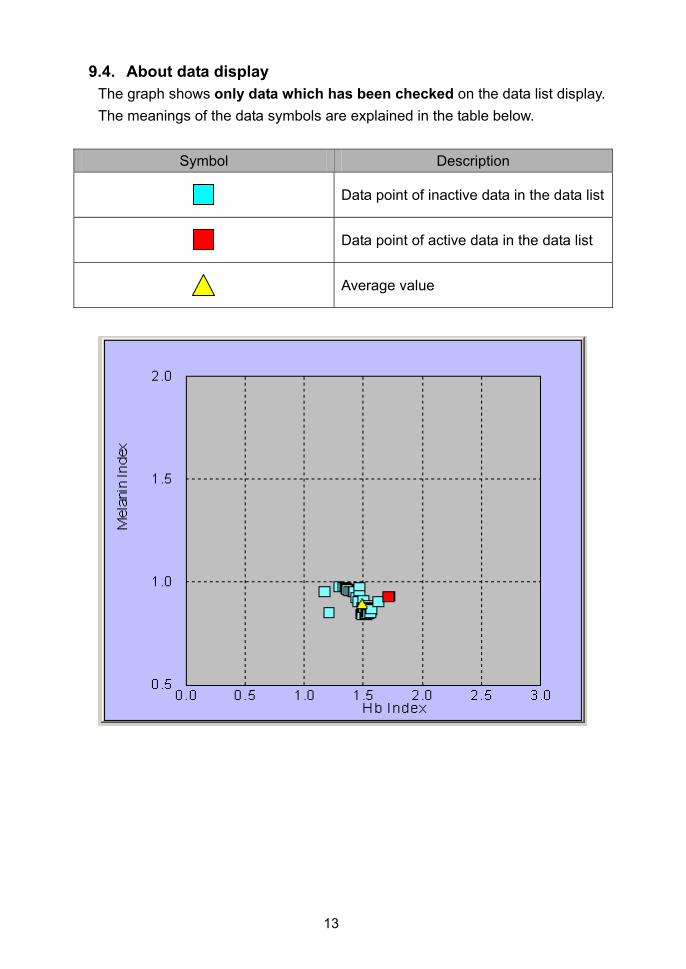
9.4. About data display
The graph shows only data which has been checked on the data list display. The meanings of the data symbols are explained in the table below.
Symbol Description
Data point of inactive data in the data list
Data point of active data in the data list
Average value
13

10. Setting the Illuminant/Observer 10.1. Setting the Illuminant/Observer
Set the illuminant and observer which determine the environmental conditions for the colorimetric value measurement (L*, a*, b*). Select “Illuminant/Observer Setting” from the “Data” menu. Select one of the following four conditions.
(1) Illuminant D65 / 2 degree observer (Default) (2) Illuminant D65 / 10 degree observer (3) Illuminant C / 2 degree observer (4) Illuminant C / 10 degree observer
11. Setting the Options Select “Tool” - “Config. Options”.
1
2
3
4
14

11.1. Setting the measurement area (CM-700d and CM-2600d only) [1] You can set the measurement area as a measurement condition according to the size of the target area (CM-700d and CM-2600d only). The measurement area of the in trument must be changed using the measurement area selector on the instrusettindisplaFor thfor the
11.2. S
Selecbox was bewomecente
11.3. S
Selecdata t
s
ment. If measurement or calibration is performed with a measurement area g other than the area specified in this window, a warning message ised. Follow the message and set a proper measurement area.
y e setting of the measurement area selector, refer to the instruction manual instrument.tting the graph display (Showing the reliability boundary) [2]
e ting the “Show the reliability boundary (Cheeks of Japanese women).” check ill display the Munsell Hue-Value graph and Hb Index-Melanin Index graphw. These displayed ellipses show the reliability boundary of Japanese
lo n’s cheeks. The degrees of reliability are 90%, 95%, and 99% from the r outwards.etting data output [3] t the option for data output (saving data in CSV format) for whether to add o the specified file or to save data as a new file.
15

11.4. Switching the group automatically [4]
The measured data will be linked to an active group. When “Change the group automatically.” is selected, data can be added to several groups in order. When you select this function, do not change the group manually. Meas. Times Specify the number of measurements to link data to each group. Example: When there are Group 1, Group 2 and Group 3 and the number of
measurements is set to 3 The group is automatically changed every three measurements and the data for three measurements is linked to each group.
After three measurements are conducted, the group is automatically changed to the next group to store the data for the fourth measurement.
16


9222-1895-52 AJECDX ©2008-2009 KONICA MINOLTA SENSING, INC.