skills mismatch and productivity in the eu · 2019-07-04 · productivity growth, which has been...
TRANSCRIPT

6
EUROPEAN ECONOMY
Economic and Financial Affairs
ISSN 2443-8022 (online)
EUROPEAN ECONOMY
Skills Mismatch & Productivity in the EU
Anneleen Vandeplasand Anna Thum-Thysen
DISCUSSION PAPER 100 | JULY 2019

European Economy Discussion Papers are written by the staff of the European Commission’s Directorate-General for Economic and Financial Affairs, or by experts working in association with them, to inform discussion on economic policy and to stimulate debate. The views expressed in this document are solely those of the author(s) and do not necessarily represent the official views of the European Commission. Authorised for publication by Mary Veronica Tovšak Pleterski, Director for Investment, Growth and Structural Reforms.
LEGAL NOTICE
Neither the European Commission nor any person acting on behalf of the European Commission is responsible for the use that might be made of the information contained in this publication. This paper exists in English only and can be downloaded from https://ec.europa.eu/info/publications/economic-and-financial-affairs-publications_en.
Luxembourg: Publications Office of the European Union, 2019
PDF ISBN 978-92-79-77437-9 ISSN 2443-8022 doi:10.2765/954687 KC-BD-18-027-EN-N
© European Union, 2019 Non-commercial reproduction is authorised provided the source is acknowledged. For any use or reproduction of material that is not under the EU copyright, permission must be sought directly from the copyright holders.

European Commission Directorate-General for Economic and Financial Affairs
Skills Mismatch and Productivity in the EU
Anneleen Vandeplas and Anna Thum-Thysen
Abstract
This paper analyses different dimensions of skills mismatch (notably ‘macro-economic skills mismatch’,
‘skills shortages’, and ‘on-the-job skills mismatch’) and their empirical relationship with labour
productivity. Macro-economic skills mismatch arises when the skills distribution differs between the
available workers and those that get hired. Skills shortages occur when employers encounter difficulties to
fill their vacancies. On-the-job skills mismatch (overqualification or underqualification) refers to a
discrepancy between the qualification level of a jobholder and the requirements for that particular job.
Our data suggest that certain types of skills mismatch are indeed on the rise in the EU, notably skills
shortages and overqualification. Other types are on a long-term declining trend (e.g. underqualification) or
follow more complex patterns over time (e.g. macro-economic skills mismatch). There are also significant
differences across EU Member States in the levels of these indicators. We further suggest that theoretical
predictions on the relationship between skills mismatch and productivity depend on the dimension of skills
mismatch considered. Our empirical analysis suggests a negative relationship between macro-economic
skill mismatch and labour productivity and – as a sign of a buoyant economy - a positive relationship
between skills shortages and labour productivity. With regard to on-the-job skills mismatch, our data
confirm earlier findings from the economic literature: when comparing a mismatched with a well-matched
worker within the same occupation, overqualification raises and underqualification reduces productivity.
When comparing a mismatched with a well-matched worker within the same qualification level,
overqualification reduces and underqualification increases productivity.
Our results imply a positive link between skills supply and productivity. However, to realise the full
potential of higher skills, skills should be labour market relevant and skilled workers need to be matched
with jobs that use these skills. Therefore, upskilling policies should ideally be accompanied by policies that
assure quality and labour market relevance of acquired skills, policies that foster a general upgrading of
jobs such as business regulations allowing for firm entry, growth, sectoral reallocation, and policies
supporting labour mobility and innovation.
JEL Classification: D40, E31, L51.
Keywords: human capital, skills mismatch, productivity, inclusive growth, structural policy.
Acknowledgements: We would like to thank Alfonso Arpaia, Erik Canton, Nathalie Darnaut, Antonio
Dias Da Silva, Jorge Duran Laguna, Atanas Hristov, Barbara Kauffmann, Emmanuelle Maincent, Dino
Pinelli, Simone Rosini, Mantas Sekmokas, Mary Veronica Tovsak Pleterski, Anne Van Bruggen, Irene
Vlachaki and participants at EMCO and LIME meetings for useful discussions and suggestions.
This note has been jointly elaborated by the European Commission's Directorates General Economic and
Financial Affairs (ECFIN) and Employment, Social Affairs & Inclusion (EMPL).
Contact: Anneleen Vandeplas, European Commission, Directorate-General for Economic and Financial
Affairs, [email protected]; Anna Thum-Thysen, European Commission, Directorate-
General for Economic and Financial Affairs, [email protected].
EUROPEAN ECONOMY Discussion Paper 100


3
CONTENTS
1. Introduction 5
2. Skills mismatch in the eu: an overview of different measures 6
2.1. Macro-economic skills mismatch 6
2.2. Skills shortages 10
2.3. Measures of on-the-job mismatch 13
2.4. Are mismatches increasing over time in the EU? 17
3. Relationship between skills mismatches and productivity 18
3.1. Framework for analysis 20
3.2. Macro-economic skills mismatch 22
3.2.1. Theoritical arguments 22
3.2.2. Empirical findings 24
3.3. Skills shortages 27
3.3.1. Theoritical arguments 27
3.3.2. Empirical findings 27
3.4. Measures of on-the-job skills mismatch 30
3.4.1. Theoritical arguments 30
3.4.2. Empirical findings 33
4. Conclusion and policy implications 38
5. References 42
ANNEX I: DATA SOURCES AND COVERAGE
ANNEX II: DESCRIPTIVE STATISTICS AND GRAPHS

4
ANNEX III: THEORITICAL APPROACHES TO MODELLING THE RELATIONSHIP BETWEEN SKILLS
MISMATCH AND PRODUCTIVITY
ANNEX IV: EMPIRICAL RELATIONSHIPS BETWEEN TOTAL FACTOR PRODUCTIVITY AND SKILLS
MISMATCH
ANNEX V: EMPIRICAL RELATIONSHIPS BETWEEN CAPITAL INTENSITY AND SKILLS MISMATCH
TABLES
GRAPHS

5
1. INTRODUCTION
Human capital is a major driver of inclusive growth. As a consequence of ongoing trends such as
progressive globalisation, demographic change, technological change and digitalisation, jobs are
becoming increasingly skills-intensive. Innovation, which heavily relies on advanced knowledge, is a
key contributing factor to productivity growth, the main source of growth for EU Member States
today. These developments underline the increasing importance of human capital, and the need to
foster a good match between the demand for and the supply of skills.
Some have argued that there are increasing mismatches between the skills or qualifications the work
force has on the one hand and the skills or qualifications required by the economy, as the demand for
skills is changing rapidly as a result of the ongoing processes of structural change listed above.1 There
is also a concern that the onset of the economic crisis in 2008-2009 has exacerbated skills mismatch,
as previously rapidly expanding sectors employing less-skilled labour - such as the construction sector
- experienced severe difficulties.2 Moreover, there are concerns that these mismatches are hampering
productivity growth, which has been sluggish since the mid-1990s.3
This note reviews different dimensions of skills mismatch (at the aggregate level) and describes how
they vary across EU Member States, as well as over time. It then explores the empirical relationship
between these skills mismatch measures and labour productivity. The note highlights that the
relationship between skills mismatch and productivity is not as clear-cut as it may seem at first sight:
the various different concepts of skills mismatch that are being discussed in the literature and by
policymakers imply very different theoretical and empirical conclusions on both the sign and the size
of their relationship with productivity. We find a positive relationship between skills shortages and
labour productivity, and a negative relationship between macro-economic skill mismatch and labour
productivity, while controlling for the output gap. With regard to on-the-job skills mismatch, our data
seem to confirm earlier findings from the economic literature. Notably, when comparing with well-
matched workers in the same occupation, overqualification raises productivity and underqualification
reduces it. When comparing with well-matched workers with the same qualification level, however,
overqualification reduces and underqualification increases productivity. Our work goes beyond earlier
work by McGowan and Andrews (2015a) by being more comprehensive in the dimensions of skills
mismatch considered. Moreover, in contrast with their paper, ours concentrates on aggregate labour
productivity.
To enhance a positive link between skills and productivity, the note argues in favour of policies aiming
at upskilling of the workforce, which should ideally be accompanied by a general upgrading of jobs in
order to put these higher skills in their best use.
The note is organised as follows: Section 2 provides an overview of the different concepts or
dimensions of skills mismatch which have been described and analysed in the economic literature.
Section 3 explores the relationship (across countries and over time) between labour productivity and a
1 For example, Toner (2011) argues, that economies of today need workers with a combination of technical competences and generic or transferable/trans-occupational skills, such as problem-solving, creativity, teamwork and communication skills.
Durbin (2004) argues that raising productivity requires entrepreneurial skills (to identify and respond to market and
innovation opportunities); managerial skills (to provide leadership and organise production processes in the most effective
way); and technical skills (to increase the effectiveness of production and take advantage of technological improvements).
2 see e.g. ECB (2012), European Commission (2016).
3 e.g. McGowan and Andrews (2015a) or Mavromaras et al. (2009).

6
set of four different measures of skills mismatch that can be easily constructed based on data readily
available through Eurostat. It first discusses our prior expectations on the sign and size of the
relationship with productivity based on economic theory, and then the observed empirical results.
Finally, Section 5 concludes and provides a set of general policy implications.
2. SKILLS MISMATCH IN THE EU: AN OVERVIEW OF
DIFFERENT MEASURES
Skills mismatch is a broad concept that is meant to reflect a suboptimal match between workers and
jobs in terms of skills and/or qualifications. While qualifications relate to formally certified undertaken
education and training, skills are the abilities an individual actually possesses and may have been
acquired through informal learning processes. Notwithstanding the important distinction between
skills and qualifications, for the purpose of this note we will refer to “skills mismatch” rather than
“qualification mismatch” for reasons of brevity but also because the former is a more standard term in
the research literature. Some degree of mismatch naturally occurs as a result of labour market frictions
in the short term (Kiss and Vandeplas, 2015). When mismatch is more broad-based and persistent, it
becomes a stronger concern to policymakers.
Two major approaches have been used in the literature. On the one hand, the literature has considered
mismatches between individuals available for work and the available jobs. Such mismatches give rise
to the coexistence of unemployed individuals and vacancies. On the other hand, there is a proliferating
literature on mismatches between those individuals who have a job, and the job they are in. In the
latter approach, no attention is paid to individuals who are out of work.
This note will focus on two indicators that belong to the first approach, notably macro-economic skills
mismatch and skills shortages; and two indicators that rather fit under the second approach
(underqualification and overqualification).4 The considered indicators have been used for some time
by now for EU-related policy analysis. Kiss and Vandeplas (2015) provide a more detailed
justification of the choice of these indicators. An important criterion is the availability of cross-country
comparable data for EU-28 countries over a sufficiently long time period. In what follows, we discuss
the specific definitions and indicators that will be used.
2.1. MACRO-ECONOMIC SKILLS MISMATCH
Macro-economists have typically looked at skills mismatches between individuals available for work
(the unemployed) and the available jobs (vacancies) and have compared them across time and across
countries at the macro-level.5 For the purpose of this note, this type of skills mismatch is referred to as
"macro-economic skills mismatch". It may result in a persistent coexistence of a pool of unemployed
workers (of a certain skills type) with a relatively high vacancy rate (suggesting demand for workers
4 Several researchers have argued that overskilling measures are more significantly associated with several economic
variables than overqualification measures (see e.g. Quintini, 2011; Sloane, 2014; Mavromaras et al., 2012; Budria and Moro-
Egido, 2014), and that the former type of measures are therefore more relevant for analysis. However, data on the latter type of measures are typically more easily available, which explains why they have been used more frequently, including in our
own analysis. The PIAAC and the European Skills and Jobs Survey, which currently provide the best measures on skills
(including subjective reports of overskilling and underskilling) consist of only one data round. While it offers unique data on
direct measures of skills, PIAAC currently covers an incomplete set of European Member States: BG, HR, HU, LU, LV, MT,
PT and RO are missing.
5 See e.g. Kiss and Vandeplas (2015), Sahin et al. (2014), Arpaia et al. (2014), Estevão and Tsounta (2011), and ECB (2012).

7
of a different skills type) and can therefore reflect structural labour market matching inefficiencies,
leading to structural unemployment or inactivity. As this measure of skills mismatch only accounts for
whether or not individuals of a certain skill type are (un)employed (or not), it does not take into
account whether, if they are employed, their job is in line with their skills.
Several inter-related measures are available to assess macroeconomic skills mismatch.6 For reasons of
data availability, skills are in this context usually proxied by qualifications. While the term
"macroeconomic qualifications mismatch" would arguably be more correct, the term "skills mismatch"
remains more commonly used in the macroeconomic literature. If data are available, one can compare
directly the composition of vacancies (in terms of qualification levels) with that of (un)employment
(see e.g. Şahin et al., 2014). As vacancy data are not always available or reliable, simplified measures
can be used that compare the composition of employment in terms of qualifications (as a proxy for
labour demand) with that of the population of working age (as a proxy for supply); or the composition
of unemployment (as a proxy for the lack of demand) with that of the labour force (as a proxy for
supply).
The use of dispersion indicators to measure mismatch in the labour market dates back to Lipsey
(1960), who argued that such mismatch can influence the trade-off between unemployment and
inflation. By now, their use for macro-economic analysis is widespread. One can consider absolute or
relative dispersion measures; one can look at sums of squares or at sums of absolute values of
deviations from the mean; one can weight different categories considered or not. Differences between
the resulting measures can generally be explained based on the selected methodology, and different
methodologies can be defended based on the purpose of the analysis.
For the purpose of this paper, the following specification is proposed for macro-economic skills
mismatch, measured as the relative dispersion of employment rates across three population groups
with different educational attainment:
𝑆𝑀𝐼 = ∑ |𝐸𝑖
𝐸𝑡−
𝑃𝑖
𝑃𝑡
|
𝑖=𝐿,𝑀,𝐻
=1
𝑒𝑡∑ |
𝑃𝑖
𝑃𝑡
(𝑒𝑖 − 𝑒𝑡)|
𝑖=𝐿,𝑀,𝐻
where 𝑖 stands for the three different qualification groups L, M and H,7 𝐸𝑖, 𝑃𝑖 and 𝑒𝑖 for total
employment, the working age population and the employment rate of group i respectively; and 𝐸𝑡, 𝑃𝑡
and 𝑒𝑡 for aggregate (or total – indicated by the subscript 𝑡) employment, the aggregate population and
the aggregate employment rate respectively.8
We selected this specification following Dixon (2006) who argues that a simple dispersion indicator is
easier to interpret than e.g. a standard deviation or a coefficient of variation; we divide it however by
aggregate employment to obtain a relative dispersion indicator that is more easily comparable across
countries and years with considerable variations in employment rates. This measure quantifies the
differences in employment rates between qualification groups, weighted by their importance in the
working age population. It will be 0 if the employment rates of all qualification groups are equal to
each other and hence to the aggregate employment rate. It will converge to its upper limit if the
6 See for instance Kiss and Vandeplas (2015), Arpaia et al. (2014), Estevão and Tsounta (2011), European Commission
(2008:119); Peters (2000), ECB (2012:73). Similar indicators can be derived for regional or sectoral mismatch.
7 Notably low-qualified individuals (with educational attainment at most at ISCED 0-2 level); medium-qualified individuals
(with attainment at most at ISCED 3-4 level); and high-qualified individuals which hold a tertiary degree (ISCED 5-8 level)
8 As a relative indicator, this measure takes on a value between 0 and 2. The 2 refers to n - 1 where n = 3 as three groups of workers are considered (L, M, and H)
8
employment rate is extremely low (0%) in two out of three qualification groups, and extremely high
(100%) in the third group, and if the size of the third group converges to 0 such that the aggregate
employment rate converges to 0 as well. In general, a relatively high mismatch will be observed if
employment rates of low- and/or medium-qualified workers are low as compared to those of high-
qualified workers, while the former make out a substantial share of the working age population.
Macro-economic skills mismatch can reflect both cyclical and structural dynamics. On the one hand,
as low-qualified (un)employment tends to be more sensitive to the cycle than high-qualified
(un)employment, the difference in (un)employment rates between qualification groups typically
increases in economic downturns. As a result, mismatch typically increases during an economic
downturn, and declines again during the recovery.
However, as there are also structural reasons underlying broader dynamics in (un)employment rate
differences between education groups, mismatch dynamics can also reflect those. Examples include a
changing relative demand for low- versus high-qualified workers or differences in the impact of
changing institutional settings and of demographics across education groups (e.g. if the increasing
generosity of benefit systems affects low-qualified workers more than high-qualified ones; or if ageing
is proceeding faster among low-qualified workers than among high-qualified ones). Some of these
reasons are more concerning than others are, which underlines the importance of deeper investigation
to assess the policy implications of a deterioration of mismatch.
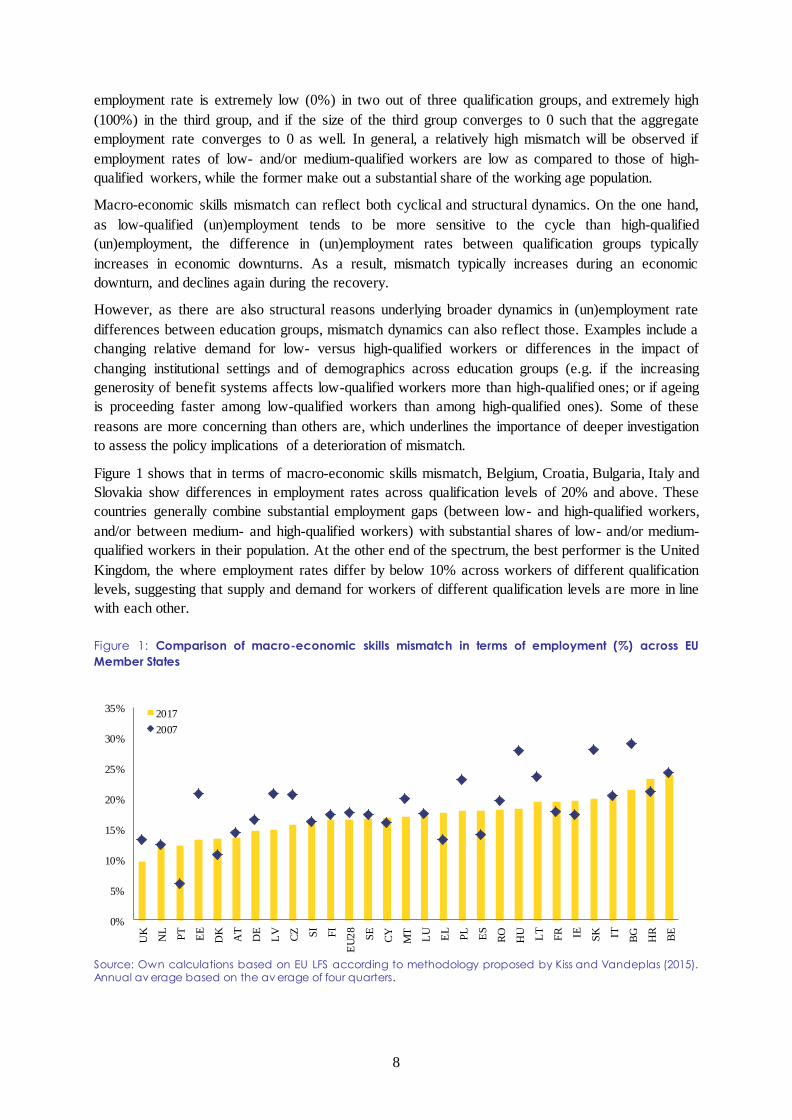
Figure 1 shows that in terms of macro-economic skills mismatch, Belgium, Croatia, Bulgaria, Italy and
Slovakia show differences in employment rates across qualification levels of 20% and above. These
countries generally combine substantial employment gaps (between low- and high-qualified workers,
and/or between medium- and high-qualified workers) with substantial shares of low- and/or medium-
qualified workers in their population. At the other end of the spectrum, the best performer is the United
Kingdom, the where employment rates differ by below 10% across workers of different qualification
levels, suggesting that supply and demand for workers of different qualification levels are more in line
with each other.
Figure 1: Comparison of macro-economic skills mismatch in terms of employment (%) across EU
Member States
Source: Own calculations based on EU LFS according to methodology proposed by Kiss and Vandeplas (2015). Annual av erage based on the av erage of four quarters.
0%
5%
10%
15%
20%
25%
30%
35%
UK
NL
PT
EE
DK
AT
DE
LV
CZ SI
FI
EU
28
SE
CY
MT
LU
EL
PL
ES
RO
HU
LT
FR IE SK IT BG
HR
BE
2017
2007

9
Over the last decade, macro-economic skills mismatch has followed largely a countercyclical pattern
on average in the European Union: rising with the economic downturn, and declining again during the
recovery (see Figure 1 and Figure 3). At the individual Member State level, patterns vary
considerably.
Fifteen Member States saw a reduction of mismatch. The largest (relative) declines over the past
decade are observed in Estonia, Hungary, Slovakia and Bulgaria. In these countries, employment rates
of medium- and high-qualified workers have been structurally converging to the aggregate
employment rate over recent decades, while the latter have been growing in importance as a share of
the working age population. The opposite applies to the employment rate of low-qualified workers,
who however make out a shrinking part of the working-age population. These dynamics have led to
lower employment rate dispersion and have not been visibly interrupted by the crisis.
On the other hand, skills mismatch has gone up in some of the countries that were particularly hit by
the crisis (such as Portugal, Spain, Greece, or Ireland) but also in France, Croatia and Denmark. It
remained relatively stable in Belgium, Cyprus, Italy, Luxemburg, the Netherlands, Slovenia and
Sweden.9
While there is no significant correlation between macro-economic skills mismatch and the educational
attainment of the working age population or the sectoral or occupational composition of employment
in a cross-country section, some interesting correlation patterns can be distinguished over time within
countries. A first observation is that macro-economic skills mismatch has increased particularly in
countries where the building sector saw a strong decline in 2008 (Figure A2.7). Since then,
employment in the construction sectors has not returned to these levels.10
Macro-economic skills
mismatch is increasing in the share of high-skilled occupations (ISCO 1-3) in employment, suggesting
that the process of occupational upgrading is associated with an increased challenge of integrating
less-qualified workers in the labour market (Figure A2.8). Finally, macro-economic skills mismatch is
declining in the share of tertiary graduates in the population, highlighting the negative relationship
between mismatch and rising educational attainment of the workforce (Figure A2.9).11
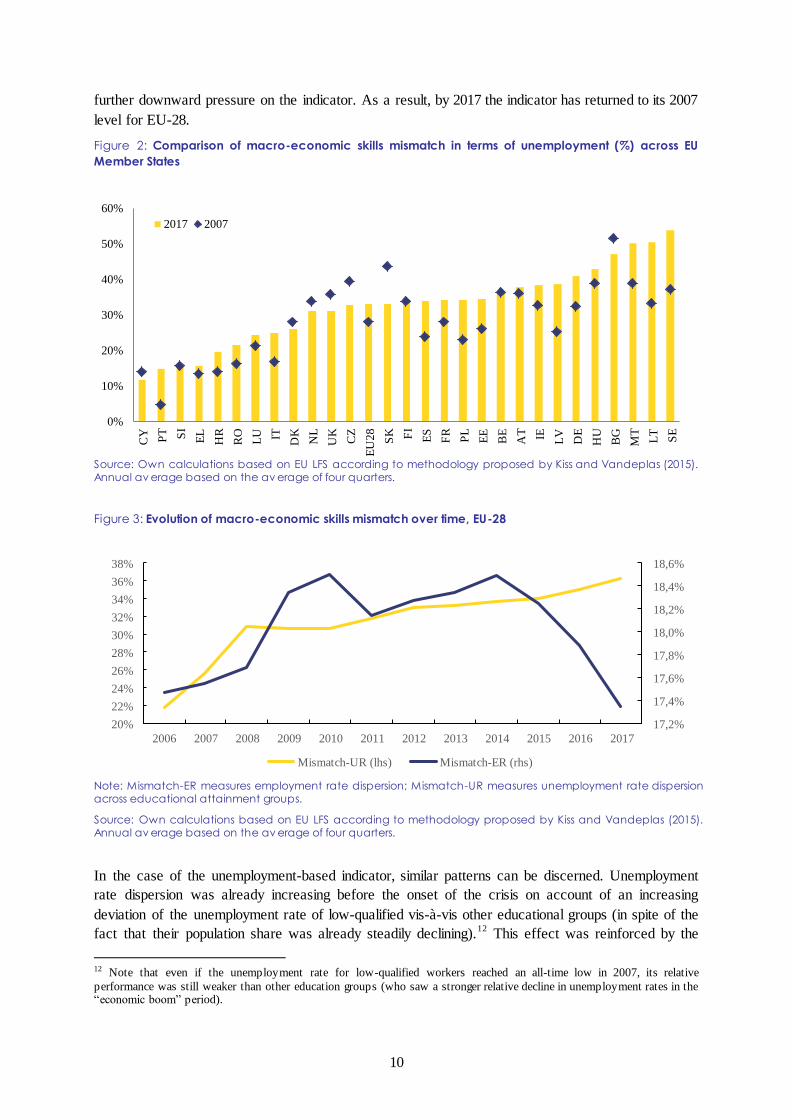
A related mismatch indicator can be calculated based on the dispersion of unemployment (rather than
employment) rates across qualification groups (Figure 2). In general, unemployment dispersion rates
are more volatile than employment dispersion rates. Figure 2 shows that unemployment rates have
diverged across qualification groups on average in the EU-28 over the period 2007-17, with important
contributions from Portugal, the Baltic countries, Spain, Poland, but also Malta and Sweden.
Unemployment rates became more similar across qualification groups in Bulgaria, Cyprus, the Czech
Republic, Denmark, Slovakia, the United Kingdom, and the Netherlands.
While relative dispersion of employment rates increased on average in the EU-28 over the crisis period
(roughly from 2008-2014) and declined since then, relative dispersion of unemployment rates has seen
a steady increase, which started even before the crisis (Figure 3).
In the case of the employment-based indicator, this reflects the crisis-related divergence in
employment rates. The recovery brought a halt and a partial reversal to this process of divergence. The
decline in the relative size of the low attainment group (as a share of the working age population) put
9 Time trends by country are provided in Figure A2.5.
10 One could of course wonder whether it would be desirable for employment in construction to fully recover to the 2008
levels, as this was widely considered an unsustainable construction boom in many countries.
11 Note that the macro-economic mismatch uses population weights of different qualification groups. If the group with more problematic labour market outcomes shrinks, mismatch will improve.
10
further downward pressure on the indicator. As a result, by 2017 the indicator has returned to its 2007
level for EU-28.
Figure 2: Comparison of macro-economic skills mismatch in terms of unemployment (%) across EU
Member States
Source: Own calculations based on EU LFS according to methodology proposed by Kiss and Vandeplas (2015). Annual av erage based on the av erage of four quarters.
Figure 3: Evolution of macro-economic skills mismatch over time, EU-28
Note: Mismatch-ER measures employment rate dispersion; Mismatch-UR measures unemployment rate dispersion across educational attainment groups.
Source: Own calculations based on EU LFS according to methodology proposed by Kiss and Vandeplas (2015). Annual av erage based on the av erage of four quarters.
In the case of the unemployment-based indicator, similar patterns can be discerned. Unemployment
rate dispersion was already increasing before the onset of the crisis on account of an increasing
deviation of the unemployment rate of low-qualified vis-à-vis other educational groups (in spite of the
fact that their population share was already steadily declining).12
This effect was reinforced by the
12 Note that even if the unemployment rate for low-qualified workers reached an all-time low in 2007, its relative
performance was still weaker than other education groups (who saw a stronger relative decline in unemployment rates in the “economic boom” period).
0%
10%
20%
30%
40%
50%
60%
CY PT SI
EL
HR
RO
LU IT
DK
NL
UK
CZ
EU
28
SK FI
ES
FR
PL
EE
BE
AT IE LV
DE
HU
BG
MT
LT
SE
2017 2007
17,2%
17,4%
17,6%
17,8%
18,0%
18,2%
18,4%
18,6%
20%
22%
24%
26%
28%
30%
32%
34%
36%
38%
2006 2007 2008 2009 2010 2011 2012 2013 2014 2015 2016 2017
Mismatch-UR (lhs) Mismatch-ER (rhs)

11
crisis. The coincidence of convergence in employment rates with divergence of unemployment rates
can be explained by the underlying dynamics in activity rates – it can reflect either a widening gap in
activity rates or a general rise in activity rates (denominator effect).
2.2. SKILLS SHORTAGES
A related dimension of labour market mismatch is when employers encounter difficulties filling their
vacancies (skills shortages). This also reflects an imbalance between demand and supply on the labour
market, as there are seemingly no suitable workers for the jobs to be occupied.
Skills shortages can be cyclical and/or structural (European Parliament, 2015). Employers typically
encounter more challenges to recruit the "right" workers at times of economic growth (Green and
Ashton, 1992; Desjardins and Rubenson, 2011) and technological or organisational change (Bosworth
and Dutton, 1990). Empirical evidence supports the view that employers adjust wages upwards and/or
recruitment standards down (such as minimum qualification levels for hiring) during economic
upturns when job applicants become scarcer (Reder 1955; Mortensen 1970; Devereux, 2002; Büttner
et al., 2010).
At present, there is no perfect way to measure skills shortages. Three surveys collect data from
employers on their difficulties to fill vacancies, but the sampling methodologies, the questions that are
asked, and the results are different. First, Eurofound's European Company Survey (ECS) asks
employers whether they “encounter difficulties in finding employees with the right skills”. Second, the
Manpower Talent Shortage Survey indicator identifies employers with difficulties filling jobs “due to
lack of available talent”. Both questions refer directly to skills or talent, but at the same time they do
not exclude difficulties arising from some other sources (see further). Also, ECS data are not collected
on a frequent basis. Finally, the European Business and Consumer Surveys (EU-BCS) collects
(depending on the sector) quarterly or monthly data on employers in manufacturing, services and
construction reporting whether labour shortages are a major factor limiting their production.
Recently, the OECD has started to develop new indicators for skills shortages ("Skills for jobs") based
on more objective data (such as employment growth, wage pressure etc.). These are currently publicly
available as a single year-cross-sectional dataset (OECD.Stat, 2018).
For our analysis, we construct a measure of skills shortages drawing on data from the EBCS on the
share of employers in manufacturing, services and construction reporting that labour shortages are a
major factor limiting their production. The major advantage of this survey is that it produces regular,
cross-country comparable data (on a quarterly or monthly basis) and covers a relatively long time span.
The main disadvantage is that it does not directly allow us to distinguish skills shortages from more
general labour shortages (e.g. as a result of a shrinking or ageing population).
A composite measure of shortages was constructed as the weighted average of three sectors
(construction, industry and services), weighting each sector by its share in value added. Unfortunately,
data are missing for Bulgaria, Ireland, Luxembourg, and Malta.

12
Figure 4: Comparison of skills shortages (%) across EU Member States
Source: Own calculations based on European Business Surv ey and AMECO
Notes: Skills shortages data are missing for IE and LU and v alue added data missing for BG and MT.
For reasons of data availability, the added value of sectors G-N is used as weight for the EBCS services sector which covers sectors H-N and R-S. This implies the assumption that the added value of the wholesale and retail sector (G) is reasonably close to the added value of the arts and other service activities sector (R-S).
Figure 4 provides an overview of the indicator, showing that shortages are reportedly most imminent
in countries such as Hungary and Poland with the incidence of skills shortages is reported to be above
35% and 25%, respectively, and least problematic in Cyprus, Greece, Portugal, Italy and Spain where
the incidence of skill shortages is reported to be lower than 5%. Interestingly, countries with higher
levels of educational attainment (such as Finland, the United Kingdom, Sweden, Lithuania and
Estonia) tend to be located near the right side of the figure, implying that they are more likely to
encounter skills shortages, not less.13
An important caveat applies in interpreting data from employer surveys, as difficulties to fill vacancies
can result from unattractive working conditions offered, inefficiencies in recruitment practices, or
broader "labour shortages" following from a general decline of the labour force currently observed in
several EU countries, rather than from skills mismatch as such (see e.g. CEDEFOP, 2015; Shah and
Burke, 2003). It is also important to note that even if employers are looking out for specific skills,
these are not necessarily technical skills that relate to specific qualifications. For instance, Capelli
(2015) reports that only a third of employer reports of talent shortages in the Manpower data for the
US related to a lack of hard skills that can be learned in school.
Our data on shortages are however more strongly correlated with the availability of high-qualified
labour than with that of low-qualified labour, suggesting that they do not merely reflect labour
shortages in most countries. In particular, our indicator for skills shortages is negatively and
statistically significantly correlated with unemployment rates of medium- and high-qualified workers,
and less so with unemployment of low-qualified workers (see Figure A2.15 - Figure A2.17).
13 A notable exception is Cyprus, which combines one of the highest rates of educational attainment with one of the lowest rates of skills shortages.
0
5
10
15
20
25
30
35
40
CY EL PT IT ES RO LV DK BE LT FR AT HR SK SI DE FI NL CZ UK EE SE PL HU
2018
2008

13
A potential explanation could be that, while worker reallocation rates tend to be higher in those jobs
and industries that generally offer lower wages and more difficult working schedules14
firms tend to
find new hires relatively easily for these types of jobs. In other words, the least productive firms hire
as frequently as the most productive ones, but their separation rates are considerably higher as well
(more often because of quits than because of layoffs). Vacancies tend to persist longer for firms that
are more productive and/or follow higher-end product strategies, and for jobs that require higher
qualification or more experience (Galenianos et al., 2015; Bennett and McGuinness, 2009; UKCES,
2012). Interestingly, countries with higher levels of educational attainment (such as Finland, the
United Kingdom, Sweden, Lithuania and Estonia) tend to be located near the right side of the figure,
implying that they are more likely to encounter skills shortages, not less.15
2.3. MEASURES OF ON-THE-JOB MISMATCH
On-the-job mismatch indicators reflect a complementary dimension of labour market mismatch that
has received ample attention in the micro-economics literature. It considers the discrepancies between
the skills and qualifications of individuals who have a job and the skills/qualifications requirements of
their job. It does not take into account the unemployed.
The difficulty in pinning down the appropriate skills/qualifications requirements for a job in practice
has resulted in a wide range of different indicators in this area that are often only weakly correlated
with each other.
On-the-job mismatch indicators may look at mismatches between the skills a worker possesses and
those that are needed for his/her job; or rather at qualifications, he/she has and those needed for his/her
job. Differences between skills and qualifications can arise for instance as a result of differences in the
skills content (or the quality) of qualifications, skills developed through non-formal or informal
training (e.g. training on-the-job, which raises one's skills beyond his/her qualifications) or skills
depreciation over the lifetime (e.g. because of changes in skills demands or insufficient maintenance
or use of skills, which can reduce one's skills as compared to his/her qualifications).
For each of these dimensions, the literature has proposed a variety of measures16
based on different
data sources17
, often producing diverging results.18
Workers experiencing a mismatch with their jobs
might either have too few skills/qualifications (underskilling/ underqualification) or too many
skills/qualifications (overskilling/overqualification) as compared to what their job requires or allows
them to use. Workers may as well in some cases experience underskilling at the same time as being
14 For example, OECD (2009) presents data on worker reallocation rates by industry, showing that rates are generally higher
in the hotels and restaurants sector, wholesale and retail, and construction. Note that worker reallocation means that a
different worker is hired for an existing job. If a worker is hired for a new job, this is usually referred to as job reallocation.
Usually job reallocation is (more so than worker reallocation) associated with productivity increases. Worker reallocation can for example be the result of worker quits, involving recruitment and training costs for the employer; a new worker with lower
tenure may be less productive than a worker with longer tenure and more experience.
15 A notable exception is Cyprus, which combines one of the highest rates of educational attainment with one of the lowest
rates of skills shortages.
16 E.g., qualification mismatch can be measured based on direct or indirect self-assessment, job analysis, or mean or modal empirical analysis. Similarly, skills mismatch can be measured based on self-assessment or on empirical analysis; and within
these, there are still different methodological options available.
17 Such as Eurostat's Labour Force Survey (LFS) and Adult Education Survey (AES), OECD's survey of adult skills PIAAC,
CEDEFOP's European Skills and Jobs Survey (ESJ) and so on
18 see e.g. for a fairly comprehensive overview Ramos (2014) on qualification mismatch; Perry et al. (2014) on skills mismatch
14
overqualified (or vice versa); see e.g. Perry and Maehler (2017). Another dimension of on-the-job
mismatch is horizontal mismatch, referring to a mismatch between an individual's field of study and
the area (s)he is working in. This topic remains beyond the scope of this paper – not only because of
challenges in measurement,19
but also because it is considered less problematic from a policy
perspective than vertical mismatch (see e.g. Sellami et al., 2018 and Montt, 2017 for a discussion).
This note considers two measures of on-the job qualification mismatch that can be calculated based on
regularly available and cross-country comparable data from Eurostat's Labour Force Survey (LFS), by
comparing the qualification level of a particular worker with the required qualification level of his/her
job, based on the occupational classification of that job.
ILO (2007) proposes that jobs classified at ISCO levels 1-3 require workers that are high-qualified,
jobs at ISCO levels 4-8 require workers that are medium-qualified; and elementary jobs (ISCO level
9) do not require workers to have any qualification.20,21
As a result, a high-qualified worker will be
considered as overqualified if (s)he has a job at ISCO levels 4-9. A medium qualified worker will be
considered as overqualified if (s)he has a job at ISCO level 9, and as underqualified if (s)he has a job
at ISCO level 1-3. A low-qualified worker will be considered as underqualified if (s)he has a job at
ISCO levels 1-8.
Several researchers have argued that overskilling measures are more significantly associated with
several economic variables than overqualification measures (see e.g. Quintini, 2011; Sloane, 2014;
Mavromaras et al., 2012; Budria and Moro-Egido, 2014), and that the former type of measures are
therefore more relevant for analysis. However, qualification-based data are typically more easily
available, which explains why they have been used more frequently, including in our own analysis.22
Unfortunately, the link between skills and qualification mismatch is rather weak. Quintini (2011)
shows that only about 36% of overqualified workers report being overskilled. Similarly, only about
12% of underqualified workers report being underskilled. Hence, a majority of over- and under-
qualified workers report that their skills match their jobs' requirements well. Flisi et al. (2017) even
find a negative correlation between qualification and skills mismatch based on an analysis of PIAAC
data.
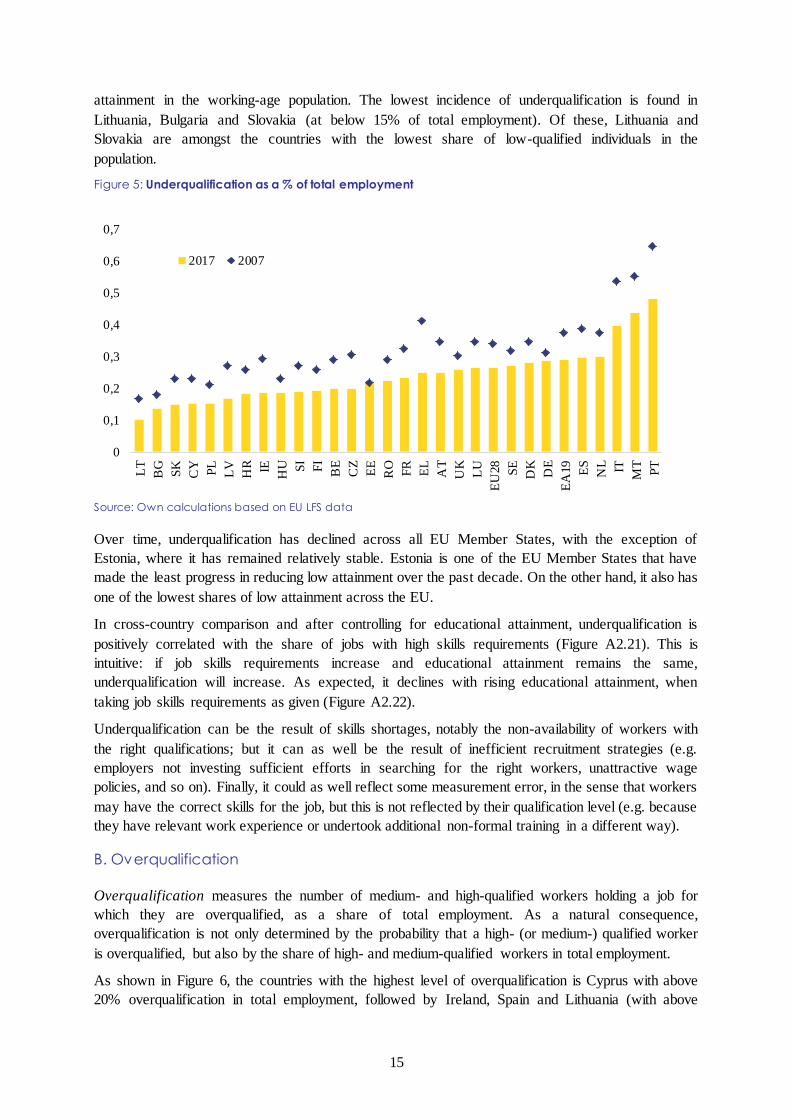
A. Underqualification
Underqualification measures the number of low- and medium-qualified workers that hold a job for
which they are underqualified, as a share of total employment. Therefore, underqualification is not
only determined by the probability that a low- (or medium-) qualified worker is underqualified, but
also by the share of low- and medium-qualified workers in total employment.
As shown in Figure 5, Portugal, Malta, and Italy have the highest incidence of underqualification (with
above 30% of total employment), most likely as a result of the general low level of educational
19 EUROSTAT has recently initiated work on the development of indicators of horizontal mismatch based on the EU-LFS,
but as yet, the available indicators remain experimental due to the remaining challenges in the underlying methodology. 20 ISCO 1-digit categories are specified as follows: 1 - Managers; 2 - Professionals; 3 - Technicians and associate
professionals; 4 - Clerical support workers; 5 - Service and sales workers; 6 - Skilled agricultural, forestry and fishery
workers; 7 - Craft and related trades workers; 8 - Plant and machine operators, and assemblers; 9 - Elementary occupations.
21 ECB (2012: 74) proposes a slightly different classification, notably assuming that jobs at ISCO levels 7-9 do not require
any qualification.
22 The PIAAC and the European Skills and Jobs Survey, which currently provide the best measures on skills (including
subjective reports of overskilling and underskilling) consist of only one data round. While it offers unique data on direct
measures of skills, PIAAC currently covers an incomplete set of European Member States: BG, HR, HU, LU, LV, MT, PT and RO are missing.
15
attainment in the working-age population. The lowest incidence of underqualification is found in
Lithuania, Bulgaria and Slovakia (at below 15% of total employment). Of these, Lithuania and
Slovakia are amongst the countries with the lowest share of low-qualified individuals in the
population.
Figure 5: Underqualification as a % of total employment
Source: Own calculations based on EU LFS data
Over time, underqualification has declined across all EU Member States, with the exception of
Estonia, where it has remained relatively stable. Estonia is one of the EU Member States that have
made the least progress in reducing low attainment over the past decade. On the other hand, it also has
one of the lowest shares of low attainment across the EU.
In cross-country comparison and after controlling for educational attainment, underqualification is
positively correlated with the share of jobs with high skills requirements (Figure A2.21). This is
intuitive: if job skills requirements increase and educational attainment remains the same,
underqualification will increase. As expected, it declines with rising educational attainment, when
taking job skills requirements as given (Figure A2.22).
Underqualification can be the result of skills shortages, notably the non-availability of workers with
the right qualifications; but it can as well be the result of inefficient recruitment strategies (e.g.
employers not investing sufficient efforts in searching for the right workers, unattractive wage
policies, and so on). Finally, it could as well reflect some measurement error, in the sense that workers
may have the correct skills for the job, but this is not reflected by their qualification level (e.g. because
they have relevant work experience or undertook additional non-formal training in a different way).
B. Overqualification
Overqualification measures the number of medium- and high-qualified workers holding a job for
which they are overqualified, as a share of total employment. As a natural consequence,
overqualification is not only determined by the probability that a high- (or medium-) qualified worker
is overqualified, but also by the share of high- and medium-qualified workers in total employment.
As shown in Figure 6, the countries with the highest level of overqualification is Cyprus with above
20% overqualification in total employment, followed by Ireland, Spain and Lithuania (with above
0
0,1
0,2
0,3
0,4
0,5
0,6
0,7
LT
BG
SK
CY
PL
LV
HR IE
HU SI
FI
BE
CZ
EE
RO
FR
EL
AT
UK
LU
EU
28
SE
DK
DE
EA
19
ES
NL IT
MT
PT
2017 2007

16
18% overqualification), all countries with above-average tertiary attainment. The lowest level of
overqualification is found in Luxembourg, Malta and Portugal – even if tertiary attainment in
Luxembourg is relatively high (higher than for Spain). Over the last decade, overqualification has
increased significantly in Greece, Cyprus, Ireland, Latvia and Austria.23
Figure 6: Overqualification as a % of total employment
Source: Own calculations based on EU LFS data
Overqualification and underqualification are negatively correlated with each other (see Figure A2.20).
A remarkable exception is Spain, which combines a high rate of overqualification with a high rate of
underqualification. Cyprus and Ireland also have much higher rates of underqualification than what
one would expect based on the incidence of overqualification in these countries.
Overqualification declines with the share of jobs with high skills requirements (when keeping
educational attainment constant) and increases with educational attainment (when controlling for jobs'
skills requirements (Figure A2.23 and Figure A2.24).
Some have argued that the expansion of higher education necessarily leads to higher rates of
overqualification. Interestingly, however, the positive correlation between overqualification and
tertiary attainment is driven by those countries with very low tertiary attainment and hardly any
overqualification as a result. Among the countries with high tertiary attainment (for instance above
30% as in Figure A2.19), there no longer is a significant correlation between tertiary attainment and
overqualification. The reason is that in some countries, growing tertiary attainment has coincided with
a correspondingly strong growth in jobs with higher skills requirements, while in other countries the
growing number of tertiary graduates has seemingly not been absorbed into higher skilled jobs,
resulting in overqualification. Different factors may be at play here, including policy-related ones such
as quality assurance institutions in education, policies that promote the alignment between education
and training systems and the labour market, but also business regulations allowing for firm entry,
growth, sectoral reallocation and policies supporting labour mobility and innovation.
To a certain extent, overqualification can be the result of rational decision-making at the individual or
the household level. For example, Frank (1978)'s "differential overqualification theory" argues that
23 Most of the increase in overqualification in Austria was due to a methodological change, where several post -secondary qualifications (ISCED level 4) were reclassified as tertiary qualifications (ISCED level 5) as of 2014.
0,00
0,05
0,10
0,15
0,20
0,25
LU
MT
PT
CZ IT
RO
SE
HU
HR
NL SI
DE
DK
SK PL
EA
19 FI
EU
28
BG
BE
FR
AT
EL
EE
UK
LV
LT
ES IE
CY
2017 2007

17
women are often constrained in their job search by their husband's job choice.24
By facing a "smaller"
labour market than men, they have a higher chance of being overqualified. These predictions have
been empirically tested by McGoldrick and Robst (1996) and Büchel and Battu (2002). While the
former rejected its validity, the latter did find some evidence that higher commuting distances strongly
reduce the probability of being overqualified; and that individuals living in rural areas run a higher risk
of being overeducated. The argument that spatial mobility constraints lead employees to accept a job
with lower formal requirements has broadly been accepted in the economic literature (e.g. Reichelt
and Abraham, 2017). Furthermore, Sicherman (1991) suggests that some workers may accept jobs for
which they are overqualified with a view to receiving on-the-job training and experience needed for
future jobs. Similarly, recent immigrants or mobile workers might accept jobs with lower formal
requirements temporarily whilst building up the necessary language skills for a more requiring job.
Some employers may prefer to hire overqualified workers,25
as they want to promote innovation and
decentralised decision-making.26
Individuals tend to undertake education not only to expand their
labour market opportunities, but also to some extent for personal development and fulfilment.27
Some
reports of overqualification can also result from measurement error: there is some evidence that
workers with lower levels of skills than the average for their qualification level are more likely to be
overqualified for their jobs (LaRochelle-Côté and Hango 2016; Erdsiek 2017; Reichelt and Abraham,
2017).
However, if overqualification is widespread, it tends to occur in environments where labour market
demand for high-qualified individuals is weak. Furthermore, it tends to be even weaker for lower-
qualified individuals, suggesting that high-qualified individuals mostly take up jobs with lower
qualification requirements because there are no other jobs available that would allow them to fully
exploit their skills; and that low labour market returns to low- and medium qualification levels
strengthen incentives for tertiary educational attainment (Figure A2.27).
2.4. ARE MISMATCHES INCREASING OVER TIME IN THE EU?
Over the last decade, macro-economic skills mismatch has largely followed a countercyclical pattern in
the EU-28, with a notable uptick over the crisis years (Figure 7, Figure 8). As noted earlier in Section
2.2, the aggregate picture hides diverging evolutions at the Member State level. On the one hand, a
strong declining trend is observed in EU-13 countries.28
On the other hand, in EU-15 countries, a
growing trend in macro-economic skills mismatch is observed, with a remarkable acceleration over the
crisis period, and a slight improvement after 2014 (see Figure A2.10).
24 Notably, Frank (1978) argues that women are often "tied stayers" or "tied movers", as they have to stay in a certain area or
to move to a certain area where their husband has found a job. Note that at the time of his writing, men were typically better
educated and had higher earning power than women. This difference is slowly fading away by now. Still, optimising job
decisions in a couple is bound to be subject to more constraints than optimising individual job decisions.
25 See e.g. Verhaest et al. (2018)
26 See e.g. Blundell et al. (2016) who consider decentralised decision-making as a skills-biased innovation.
27 See e.g. Green and Henseke (2016)
28 In this paper, EU-13 comprises the EU Member States that joined the EU as of 2004 (Bulgaria, Cyprus, Czech Republic,
Estonia, Croatia, Hungary, Lithuania, Latvia, Malta, Poland, Romania, Slovenia, and Slovakia). EU-15 comprises those
countries which were already EU Member States before 2004, notably Austria, Belgium, Germany, Denmark, Greece, Spain, Finland, France, Ireland, Italy, Luxembourg, the Netherlands, Portugal, Sweden, and the United Kingdom.

18
Figure 7: Evolution of macro-economic skills
mismatch and skills shortages in the EU-28
Figure 8: Evolution of underqualification and
overqualification in the EU-28
Note: The EU-28 aggregate reflects population-weighted averages. In the case of skills shortages, these av erages take into account the countries for which data are available in each respective year.
For most of the EU-13 countries, the high level of mismatch is a legacy from transition (Figure
A2.10): the collapse of the Soviet Union generated macro-economic skills mismatch at a large scale,
as economic production systems were being thoroughly disrupted. Typically, activation support and
adult learning policies in these countries are rather weak, resulting in relatively little support being
given to lower-qualified persons for labour market reintegration. Throughout the process of transition,
however, macroeconomic mismatch is gradually declining in EU-13 countries. In contrast, the EU-15
countries saw a strong upsurge in macroeconomic mismatch since the crisis in 2008, albeit from a
much lower starting level.
Skills shortages are also observed to move broadly with the economic cycle (Figure 7, Figure 8), and
particularly so in EU-13 countries. They increase during economic recoveries, and decline in times of
economic slack. Skills shortages reached a peak in 2007 and a trough in 2009. In other words, this
mismatch indicator does not seem to show a consistent upward or downward structural trend over
time.
Underqualification (overqualification) is on a long term declining (increasing) trend, mostly driven by
upward trends in educational attainment (Figure 8). The reduction in underqualification is driven by a
decline of the population share with low educational attainment; the increase in overqualification is
driven by an increase of the population share with tertiary attainment. In some countries, however, the
increase in tertiary attainment is not (e.g. Germany, Estonia, Luxembourg) or hardly (e.g. Denmark)
significantly related with overqualification (See Figure A2.6).29
3. RELATIONSHIP BETWEEN SKILLS MISMATCHES AND
PRODUCTIVITY
The question of how human capital in general and skills mismatch in particular is related with
productivity has been explored previously in the literature (see Section 3.1). Most of these studies
have considered skills mismatch in terms of on-the-job mismatch (under- or over-qualification or
29 This is all the more remarkable, as it implies that overqualification among tertiary graduates must decline to allow the share of overqualified in employment to remain stable while tertiary attainment increases.

19
under- or over-skilling); and some studies have looked at skills shortages. The question of how macro-
economic skills mismatch and productivity are related is a relatively novel question, which has not yet
attracted significant attention in the literature, possibly because the link is more indirect than for other
dimensions of skills mismatch.
Our analysis looks at labour productivity, a productivity measure that is easy to calculate, and
intuitively closely related to per capita GDP levels and living standards (per capita GDP can be
decomposed into labour productivity (GDP per hour worked) and labour resource utilisation (hours
worked per capita)). Figure 9 presents a view of how EU Member States compare against each other in
terms of labour productivity levels. The best performing Member States are Luxemburg, Ireland and
Denmark. At the other end of the spectrum are Bulgaria, Romania and Poland. As can be seen, labour
productivity increases were considerably larger over the period 1997-2007 than over the most recent
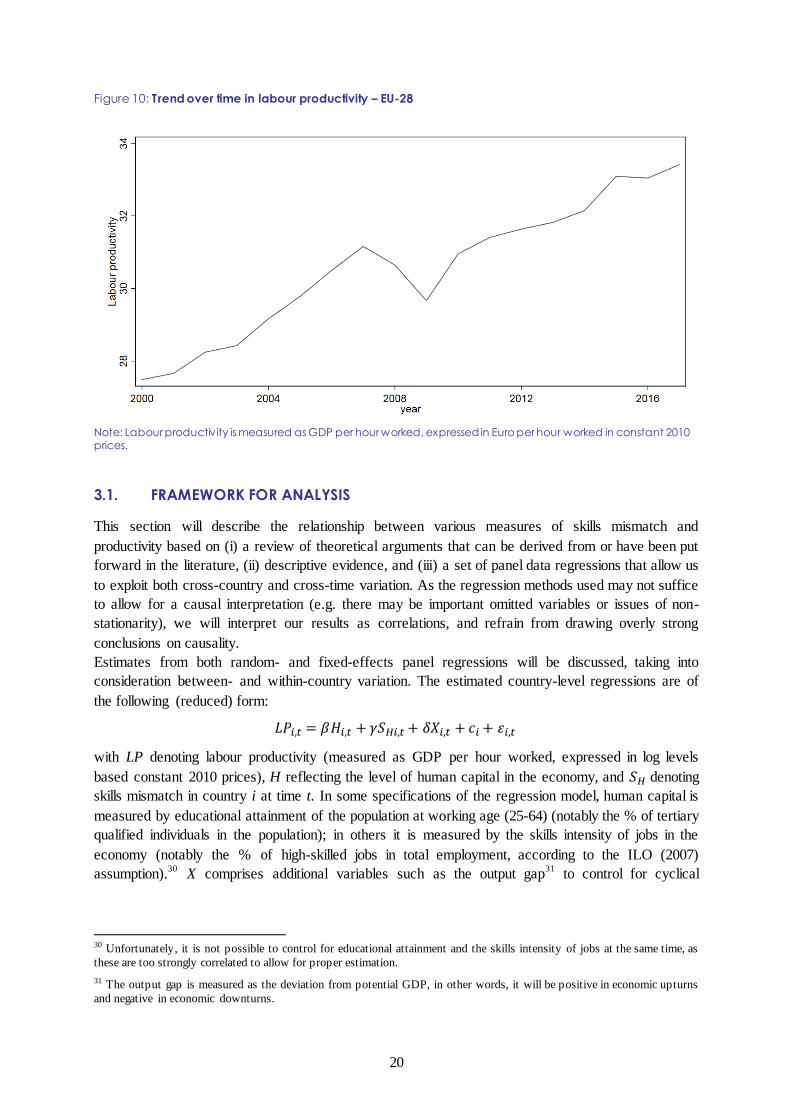
decade, reflecting the recent slowdown in productivity growth. Figure 10 provides a longer time
perspective on labour productivity trends in the EU, showing that labour productivity has been
considerably affected by the economic crisis (as of 2009).
Figure 9: Labour productivity (€ per hour worked) across EU Member States
Source: AMECO Note: Labour productivity is measured as GDP per hour worked, expressed in Euro and in constant 2010 prices.
0
10
20
30
40
50
60
70
80
90
BG RO PL HU LV LT HR EE CZ PT SK EL MT SI CY ES IT UK AT FI DE FR SE NL BE DK IE LU
2017
2007
1997
20
Figure 10: Trend over time in labour productivity – EU-28
Note: Labour productivity is measured as GDP per hour worked, expressed in Euro per hour worked in constant 2010 prices.
3.1. FRAMEWORK FOR ANALYSIS
This section will describe the relationship between various measures of skills mismatch and
productivity based on (i) a review of theoretical arguments that can be derived from or have been put
forward in the literature, (ii) descriptive evidence, and (iii) a set of panel data regressions that allow us
to exploit both cross-country and cross-time variation. As the regression methods used may not suffice
to allow for a causal interpretation (e.g. there may be important omitted variables or issues of non-
stationarity), we will interpret our results as correlations, and refrain from drawing overly strong
conclusions on causality.
Estimates from both random- and fixed-effects panel regressions will be discussed, taking into
consideration between- and within-country variation. The estimated country-level regressions are of
the following (reduced) form:
𝐿𝑃𝑖,𝑡 = 𝛽𝐻𝑖,𝑡 + 𝛾𝑆𝐻𝑖,𝑡 + 𝛿𝑋𝑖,𝑡 + 𝑐𝑖 + 휀𝑖,𝑡
with LP denoting labour productivity (measured as GDP per hour worked, expressed in log levels
based constant 2010 prices), H reflecting the level of human capital in the economy, and 𝑆𝐻 denoting
skills mismatch in country i at time t. In some specifications of the regression model, human capital is
measured by educational attainment of the population at working age (25-64) (notably the % of tertiary
qualified individuals in the population); in others it is measured by the skills intensity of jobs in the
economy (notably the % of high-skilled jobs in total employment, according to the ILO (2007)
assumption).30
X comprises additional variables such as the output gap31
to control for cyclical
30 Unfortunately, it is not possible to control for educational attainment and the skills intensity of jobs at the same time, as
these are too strongly correlated to allow for proper estimation.
31 The output gap is measured as the deviation from potential GDP, in other words, it will be positive in economic upturns
and negative in economic downturns.

21
influences, and 𝑐𝑖 includes country fixed effects. Dependent variables are expressed in logs and
independent variables in percentages.32
This reduced form model can be derived from a production function expressed in labour productivity
terms as in (𝑌
𝐿)
𝑖𝑡= 𝐴𝑖𝑡 (
𝐾
𝐿)
𝑖𝑡
𝛼
or, in logs ln 𝑦𝑖𝑡 = ln 𝐴𝑖𝑡 + 𝛼 ln 𝑘𝑖𝑡, where 𝑌
𝐿 denotes GDP per hour
worked, 𝐴 denotes total factor productivity (TFP), 𝐾
𝐿 denotes capital intensity and 𝛼 denotes the factor
elasticity of capital. To account for the possibility that human capital (and as a result also skills
mismatch) is related with labour productivity through capital accumulation and through innovation and
total factor productivity, we use the following theoretical framework to underpin our regression
analysis: we assume that both ln 𝐴𝑖𝑡 and ln 𝑘𝑖𝑡 depend on 𝐻𝑖𝑡 (human capital), 𝑆𝑖𝑡 (skills mismatch)
and possible other covariates (𝑋𝑖𝑡). The regressions reported in Annex 4 (regression TFP levels on 𝐻, 𝑆
and 𝑋) and Annex 5 (regressing capital intensity on 𝐻, 𝑆 and 𝑋)) test the validity of these assumptions
and suggest that human capital and skills mismatch indeed correlate with both TFP and capital
intensity in a similar way as with labour productivity. As ln 𝑘𝑖𝑡 = 𝑓1 (𝐻𝑖𝑡 ,𝑆𝑖𝑡 ,𝑋𝑖𝑡) and ln 𝐴𝑖𝑡 =
𝑓2(𝐻𝑖𝑡 ,𝑆𝑖𝑡 ,𝑋𝑖𝑡), this implies that labour productivity can be written as 𝑦𝑖𝑡 = 𝑓(𝐻𝑖𝑡 , 𝑆𝑖𝑡 ,𝑋𝑖𝑡), the
empirical specification of which is described by the equation above.
The literature examining the way human capital accumulation may sustain growth and motivating as
such the positive correlation between labour productivity and the level of education (see e.g. Schultz,
1962) supports the setup of our model above. Human capital can have a positive impact on labour
productivity both by raising TFP and by fostering physical capital accumulation. The positive
relationship between human capital and TFP - implied in our reduced form model by our assumption
that ln𝐴𝑖𝑡 = 𝑓2(𝐻𝑖𝑡 ,𝑆𝑖𝑡 ,𝑋𝑖𝑡) - arises from increasing knowledge raising the capacity to innovate and to
adapt and operate new technologies (e.g. Benhabib and Spiegel, 1994; Miller and Upadhyay, 2000).
Complementarities between human and physical capital, which we imply in our reduced form model
by our assumption that ln 𝑘𝑖𝑡 = 𝑓1 (𝐻𝑖𝑡 ,𝑆𝑖𝑡 ,𝑋𝑖𝑡), have also been frequently emphasised. For example,
Acemoglu (1996) argues that firms are willing to invest more in physical capital if the workforce is
raising its education and skills levels. Lucas (1990) hypothesises that lower stocks of human capital
restrict capital inflow (and as such, growth) in poor countries. Barro (1991) discusses that if human
capital has positive spillover effects (as hypothesised in Lucas (1988)), upskilling will lead to higher
rates of investment, both in human and in physical capital, and as a result, to higher per capita growth.
Goldin and Katz (1998) conclude that the complementarity between physical and human capital is not
a new phenomenon, as it was already observed in the early 20th
century. It can even be argued that
human capital, in a form or another, is behind any source of growth, whether it has been explicitly
accounted for or not.33
The complementarities between physical and human capital underlie our choice
not to add capital intensity as a control variable, as this would possibly cover up some of the
relationship between human capital (and skills mismatch) and productivity in the reduced form
equation.
32 Note that correcting the standard errors for heteroscedasticity and within-cluster correlation at the country level yields
similar results in terms of significance in most cases. However, for the on-the-job skills mismatch indicators significance levels decrease. Since robust standard errors may be overestimated with less than 40 clusters (see Angrist and Pischke 2008),
we conclude that there is still evidence for significant results.
33 For instance, in models of embodied technical progress (e.g. Greenwood et al., 1997) the increasing quality of equipment
goods could well be interpreted to be the result of the increasing degree of sophistication of engineering. Models of
expanding product variety (e.g. Grossman and Helpman, 1991) consider that R&D in product innovation uses growing human capital to create new and better varieties.

22
Productivity regressions are run in levels, following the approach taken (amongst others) by McGowan
and Andrews (2015) and in Acemoglu et al. (2014). Education (and therefore also skills mismatch)
may generally affect economic and productivity growth through different channels (see Lucas, 1988 or
Barro, 2001), for instance by increasing the innovation capacity and the general quality of the
workforce, which also leads to higher absorption of new techniques and technologies. Consequently, a
country's level of human capital (and therefore also skills mismatches) can have an impact on
productivity levels (referred to as a "level-level" effect) and/or on the rate of productivity growth (a
"level-growth" effect). In turn, the "level-growth" literature emphasises the interaction between the
human capital stock and technological change (see for instance Benhabib and Spiegel 1994). The
major difference between the two strands relates to the actual transmission channels at work: while the
first emphasises the productivity-enhancing effects of schooling (and the associated skill-upgrading of
the labour force), the second strand stresses the adoption and innovation channels (shifting the
boundaries of the production possibilities outwards due to technological progress). Both channels work
in parallel. Which one tends to be more conducive to growth appears to be country-specific.34
The reduced form model described in this section allows estimating the unconstrained direct
relationship between education and mismatch on the one hand, and productivity on the other hand, but
is little informative about the channels of these relationships. To test empirically the channels at play
in determining the relationship between education and mismatch with productivity, one could resort to
specific structural models. The education and growth literature has proposed different types of models
that integrate human capital in standard production functions (see De la Fuente 2011 for a brief
review). These models could be adjusted to incorporate the relationship with skills mismatch.
Developing a structural model is however beyond the scope of this exploratory note and left for future
work.
In what follows, we discuss for each of the four measures of skills mismatch described in Section 2,
their expected relationship with labour productivity, some descriptive results, and then the results of
our regressions.
3.2. MACRO-ECONOMIC SKILLS MISMATCH
3.2.1. Theoretical arguments
Macro-economic skills mismatch points at the presence of substantial differences in employment rates
between different qualification groups. In practice, this implies that employment rates of low- and/or
medium-qualified individuals are low compared to those of other groups, while they make out a
substantial share of the population; in other words, that there is a significant composition bias towards
high-qualified workers in employment. Usually this is associated with generally low aggregate
employment rates.
From a theoretical perspective, it is not straightforward to relate this type of mismatch to labour
productivity. In a growth accounting framework, it would link more directly to labour utilisation than
to labour productivity (see for example European Commission, 2008:117). At the same time, the
exclusion of low-qualified workers from employment can raise labour quality and as such raise labour
34 We tested level-growth and growth-growth relationships but did not find evidence for significant relationships. Note that
concerning the level-level relationship one might say that, since the variables in question are in levels with a trending
behaviour - indicating non-stationarity, their relationship may be spurious if there is no co-integrating relationship. However,
we somewhat control for possible residual non-stationarity by adding educational attainment or occupation indicators, which are typically also trending variables.
23
productivity, as high-qualified workers are expected to be more productive than low- or medium-
qualified workers (see e.g. European Commission, 2008: 44). Given the stronger link with labour
utilisation than with labour productivity, the relationship between macro-economic skills mismatch
and GDP per capita is expected to be negative.
However, other factors may be at play simultaneously, adding "noise" to the relationship between
labour productivity and macro-economic skills mismatch. First there is a possible concern about
reverse causality. Past literature has argued that productivity growth tends to be associated with
aggregate employment growth (see e.g. Saltari and Travaglini 2009; Chirinko 1995; Christiano et al
2003). If technological progress is skill-biased35
and wages show downward rigidities, productivity
growth will reinforce the composition bias of employment towards high-qualified workers, hence
increasing skills mismatch (Moreno-Galbis and Sneessens 2007). This would strengthen the positive
correlation between productivity and skills mismatch, but lead to an over-estimation of the relationship
between skills mismatch and productivity.
In addition, there may be some cyclical factors at play. Macro-economic skills mismatch behaves to
some extent countercyclically. As low-qualified employment is more sensitive to the cycle than high-
qualified employment, macro-economic skills mismatch will increase during economic downturns.
Economic studies that have looked specifically into the cyclicality of labour productivity find striking
discrepancies between theoretical predictions and empirical observations. Notably, theory would
predict that in perfectly competitive markets, profit-maximising firms will produce according to a
production function with decreasing marginal returns. As a result, during an economic upturn, firms
expand production and hire marginally less productive workers, with a negative impact on average
labour productivity. During an economic downturn, less productive workers are fired first, increasing
average labour productivity.36
This implies that labour productivity should show countercyclical
movements (see e.g. Aizcorbe 1992).
Interestingly, however, most economists have observed that labour productivity moves with the cycle
instead (see e.g. Baily et al., 2001).37
The most popular explanation for why labour productivity moves
with the cycle is the labour hoarding hypothesis, which argues that in the presence of transaction costs
for hiring and firing, firms adjust factor utilisation during downturns (e.g. by letting employees work
less intensively), resulting in lower output production with the same staff – while the intensity of
factor utilisation is difficult to observe (see e.g. Oi, 1962; Solow, 1964; Rotemberg and Summers,
1990; Bernanke and Parkinson, 1991; Burnside, Eichenbaum and Rebelo, 1993, Basu, 1996; Wen,
2004; Barnichon, 2014). Some scholars have suggested as well that a drop in the speed of production
(and an associated drop in employment at the firm level) leads to a decline in the degree of
specialisation (as the remaining workers are reorganised along the assembly line), resulting in lower
labour productivity (Aizcorbe 1992). These theoretical arguments would not establish a causal link
between macro-economic skills mismatch and productivity, but they could offer an explanation for a
possible negative correlation between productivity (which is procyclical) and skills mismatch (which
is countercyclical, as low-skilled employment is more sensitive to the cycle (Maré and Hyslop 2008;
35 See e.g. Bound and Johnson (1995), Berman et al. (1994); Johnson (1997), Machin and Van Reenen (1998); Akerman et al.
(2015)
36 Along the same lines, Devereux (2002) finds that new hires are more qualified during economic downturns than during
economic upturns; and Pollmann-Schult (2005) provides evidence of crowding out of low-qualified workers during economic
downturns.
37 However, focussing mainly on the US, a number of scholars finds this pro-cyclicality of labour productivity to have
become more subdued since the early 1980s (see for instance Blanchard and Watson, 1986, Galí and van Rens, 2014 or Stiroh, 2009).

24
Abraham and Haltiwanger 1995; Saint-Paul 1993). In our regressions, we try to filter out these
cyclical elements by controlling for the output gap.
There could as well be some dynamic impacts on productivity, through different channels. First, long
unemployment spells may lead to human capital depreciation or skill loss, including because the
unemployed lose opportunities to learn by doing (Martin and Rogers, 2000), leading to a permanent
loss of productivity and potential output (hysteresis) (Blanchard and Summers, 1986). On the other
hand, a wider dispersion in employment outcomes between workers of different qualifications may
increase the incentive to invest in education. Some scholars have argued that economic downturns
may reduce incentives to drop out of school prematurely and raise educational attainment as such (see
e.g. Dellas 2003; Alessandrini et al., 2015). There is some evidence that this has indeed happened in
the countries where the 2008 economic crisis hit hardest (Quarina 2017; European Commission 2015).
These issues could as well contribute to a positive hysteresis with a more skilled labour force, lower
macro-economic skills mismatch, and higher productivity when the economy picks up.
Finally, there is a strand of economic literature arguing that recessions have positive impacts on
productivity when the crisis unwinds and recovery takes hold. Saint-Paul (1993) provides a brief
review of these effects, including the "lame duck" effect (less productive firms being less likely to
survive recessions); "discipline effects" (the recession would put pressure on firms to reorganise and
raise productivity); and "intertemporal substitution effects", where firms allocate a larger share of their
labour force to productivity-improving activities (such as training or reorganisation) during a
recession, when the opportunity cost of doing so is lower than during upturns. Our analysis however
focuses on contemporary links between mismatch and productivity, without considering dynamic
relationships.
As a result, our hypothesis on the link between mismatch and productivity is as follows:
Macro-economic skills mismatch is expected to be positively related with productivity,
after controlling for cyclical elements.
3.2.2. Empirical findings
The data however show a relatively strong negative correlation between macro-economic skills
mismatch and productivity, both in a cross-section comparison and when considering variation within
countries over time, even after controlling for the output gap (Figure 11). This negative relationship is
mostly driven by EU-13 countries. With only a few exceptions such as Estonia and Latvia, these
countries combine a relatively high level of skills mismatch with a relatively low level of labour
productivity – but while skills mismatch is on a structural downward trend (mostly as a result of
upskilling), labour productivity is on a structural upward trend as a result of catching up effects. When
zooming in on EU-15 countries, we do find the expected positive relationship between labour
productivity and macro-economic skills mismatch (Figure 12).

25
Figure 11: Fixed effects correlation between labour
productivity and macro-economic skills mismatch
(all MS), controlling for output gap (2000-17)
Figure 12: Fixed effects correlation between labour
productivity and macro-economic skills mismatch
(EU-15 only), controlling for output gap (2000-17)
Source: Labour productivity data are taken from AMECO and measured as GDP per hour worked, expressed in log lev els based on constant 2010 prices. Macro-economic skills mismatch data are based on own calculations drawing on LFS data. Note: In the Figures abov e, all countries appear 18 times – once for each year included in the sample.
Regression results, controlling for cyclical elements by the output gap, educational attainment or
occupation levels and country-specific effects, confirm the observed negative relationship both for the
cross-sectional and the within-country dimensions. They suggest that an increase of 10 ppt in macro-
mismatch38
is associated with a reduction of 19% in labour productivity (or of 23% in the fixed effects
regression model). The magnitude of the relationship is similar in size (but opposite in sign) to the
relationship between raising the level of high-skilled jobs or of tertiary attainment in the economy by
10 ppt and labour productivity. The sign of the output gap is positive, suggesting that labour
productivity behaves as a pro-cyclical variable (fitting for instance the labour hoarding hypothesis).
The Hausman test suggests that the fixed effects model is the preferred one, in other words that time-
invariant country-specific variables are correlated with labour productivity, and that it is therefore
better to control for these in the regression.
If the sample is split between EU-15 and EU-13 countries, a positive relationship is revealed for EU-
15 countries, fitting more closely our prior expectations (either because mismatch ispositively related
with productivity or because of skills-biased technological change). In EU-13 countries, however, the
negative relationship remains, possibly reflecting other time-variant factors (omitted variables) that
lead both to reducing macroeconomic skills mismatch and improving labour productivity.39
It is
beyond the scope of this paper, however, to go deeper into these issues.
38 A 10 percentage-point difference in macro-mismatch is roughly equivalent to the difference in mismatch between RO and
UK in 2017 or to the rise observed in ES observed over 2007-17.
39 Possible contributing factors could be FDI inflows or business regulations supporting firm entry and growth.

26
Table 1a: Random-effects regressions of labour productivity and macro-economic skills mismatch40
Table 1b: Fixed-effects regressions of labour productivity and macro-economic skills mismatch
40 The reported R² value for this and other random-effects regressions in this paper is the overall-R². Note that this does not have the same properties as the usual OLS R².
(1) (2) (3) (4) (5) (6)
VARIABLES re re re-EU-15 re-EU-15 re-EU-13 re-EU-13
Output gap 0.001 0.005*** 0.004** 0.008*** 0.007*** 0.007***
(0.002) (0.001) (0.002) (0.002) (0.002) (0.002)
% High-skilled jobs 0.019*** 0.011*** 0.021***
(0.002) (0.002) (0.003)
Macro-economic skills mismatch -0.025*** -0.017*** 0.010*** 0.010*** -0.035*** -0.019***
(0.002) (0.002) (0.003) (0.003) (0.003) (0.003)
% Tertiary attainment 0.017*** 0.009*** 0.021***
(0.001) (0.001) (0.002)
Constant 2.935*** 3.083*** 3.147*** 3.330*** 2.582*** 2.511***
(0.109) (0.112) (0.076) (0.077) (0.157) (0.150)
Observations 493 489 267 263 226 226
R-squared 0.608 0.436 0.735 0.531 0.472 0.234
Number of geo 28 28 15 15 13 13
Wald chi2 258.587 437.729 81.302 159.167 243.368 313.327
Prob>chi2 0.000 0.000 0.000 0.000 0.000 0.000
Standard errors in parentheses
*** p<0.01, ** p<0.05, * p<0.1
(1) (2) (3) (4) (5) (6)
VARIABLES fe fe fe-EU-15 fe-EU-15 fe-EU-13 fe-EU-13
Output gap 0.001 0.005*** 0.003* 0.008*** 0.007*** 0.007***
(0.002) (0.001) (0.002) (0.002) (0.002) (0.002)
% High-skilled jobs 0.018*** 0.008*** 0.021***
(0.002) (0.001) (0.003)
Macro-economic skills mismatch -0.024*** -0.017*** 0.009*** 0.009*** -0.035*** -0.019***
(0.002) (0.002) (0.003) (0.003) (0.003) (0.004)
% Tertiary attainment 0.017*** 0.009*** 0.022***
(0.001) (0.001) (0.002)
Constant 2.956*** 3.065*** 3.267*** 3.321*** 2.573*** 2.477***
(0.076) (0.050) (0.063) (0.042) (0.138) (0.115)
Observations 493 489 267 263 226 226
R-squared 0.344 0.486 0.179 0.385 0.528 0.597
Number of geo 28 28 15 15 13 13
Standard errors in parentheses
*** p<0.01, ** p<0.05, * p<0.1

27
3.3. SKILLS SHORTAGES
3.3.1. Theoretical arguments
Skills shortages generally reflect the lack of availability of (skilled) labour. Several scholars have
assessed the relationship between skills shortages and productivity. From a theoretical perspective, one
would expect skills shortages to be negatively related with productivity, as they may lead to loss of
production due to unfilled jobs for a certain period of time; or to the recruitment of workers with lower
skills or qualifications than what their vacancies would ideally require, resulting in underskilling and
underqualification (Bennett and McGuinness, 2009). Another argument that is commonly made is that
skills shortages inhibit investment and the adoption of new technologies, reducing productivity growth
(e.g. Foley and Watts, 1994). By raising labour costs (e.g. because firms need to spend more on
training, recruitment or wages), they could distort the optimal allocation of resources. Some scholars
have argued as well that skills shortages put workers in a better bargaining position, allowing them to
demand an easier pace at work (Haskel and Martin, 1993a).41
Empirical evidence on the magnitude of these relationships has however produced mixed results. On
the one hand, Forth and Mason (2004) and McGuinness and Bennett (2006) identified no clear link
between productivity and unfilled vacancies based on their analysis of firm-level data. On the other
hand, Haskel and Martin (1993a) find that skills shortages have reduced productivity growth in the
United Kingdom by around 0.7 percentage-points per year over the period 1983-86. Furthermore,
Nickell and Nicolatsis (1997) argue that a 10% increase in the number of firms reporting a skills
shortage leads to a (permanent) 10% reduction in fixed capital investment and a (temporary) 4%
reduction in spending on research and development. Tang and Wang (2005) find a negative impact on
the performance of small- and medium-sized companies; and Bennett and McGuinness (2009) find,
after controlling for selection bias arising from the fact that more productive firms are more likely to
experience skills shortages, a substantial impact of those shortages on firm-level productivity.
A complicating factor pertains to cyclical elements: while skills shortages may prevail during
economic expansions, as more firms will be hiring new workers, we have seen above that economic
expansions are typically associated with higher productivity. This relationship may mitigate the
observed negative relationship of skills shortages with labour productivity and underlines the
importance of controlling for the cyclical elements.
As a result, our hypothesis on the link between skills shortages and productivity is as follows:
Skills shortages are expected to be negatively related with productivity, after controlling
for cyclical elements.
3.3.2. Empirical findings
When we look at the data, however, we do not observable any relevant link between labour
productivity and skills shortages in a cross-sectional comparison. The apparently negative link in
Figure 13 is entirely driven by an outlier (Hungary) and not statistically significant. In the fixed effects
correlation plot shown in Figure 14 (which considers the variation over time within countries), a faint
(but significant) positive correlation can be observed, even after controlling for cyclical elements;
driven in particular by EU-15 countries.
41 On the other hand, a paper by the same authors finds that firms often adapt to shortages by adjusting overtime – especially
when shortages are perceived as cyclical - which would have the opposite effect on the pace of work of workers in shortage positions (Haskel and Martin, 1993b)

28
Figure 13: Labour productivity in relation to skills
shortages, cross-sectional comparison (2017)
Figure 14: Fixed-effects correlation between
labour productivity and skills shortages (2000-17)
Source: Labour productivity data are taken from AMECO and measured as GDP per hour worked, expressed in log
lev els based on constant 2010 prices. Macro-economic skills mismatch data are based on own calculations drawing on LFS data. Note: In Figure 14, all countries appear 18 times – once for each year included in the sample.
Our best explanation of this counter-intuitive positive correlation is possible endogeneity as a result of
omitted variables or even reverse causality; with countries who are performing better in terms of
labour market outcomes (on a structural basis)42
and have higher labour productivity, also exhibiting
higher needs for high-skilled labour, and running into shortages when supply is insufficient.43
This
relationship seems to outweigh the potentially negative relationship between skills shortages and
labour productivity.
Countries with the highest skills shortages in EU-15 are Germany, Sweden, and the United Kingdom.
These have good labour market conditions in general – not only for high-qualified workers. The
countries with the lowest skills shortages in EU-15 are Greece, Spain, Italy, and Portugal. These
combine low productivity with high unemployment among high-qualified individuals (as well as
among the general population).44
As a matter of fact, in none of the countries with the highest skills
shortages (Hungary, the United Kingdom, Sweden, Poland, Germany, and Estonia), the unemployment
rate of high-skilled workers exceeds 4%.45
Regression results also provide evidence for a positive relationship between labour productivity and
skills shortages. The positive relationship persists when controlling for educational attainment and
high-skilled occupations, and, as can be seen from split sample regressions, is mostly driven by results
for EU-15 countries.46
The size of the relationship is not large, however, as an increase in skills
shortages by 10 percentage-points is associated with an increase of about 4% in labour productivity
42 Figure A2.18 shows that skills shortages are strongly correlated with the cyclically adjusted unemployment rate measured
as the non-accelerating wage rate of unemployment (NAWRU) (Havik et al., 2014).
43 E.g. because there is a time lag between new needs arising in the economy and adequate labour supply response (e.g.
because new training programs need to be developed, students need to be trained).
44 These countries have aggregate unemployment rates above 10% and unemployment rates of at least 8% for high-qualified workers.
45 Interestingly, unemployment of high-qualified workers has no link with tertiary attainment in the population: while HU, PL
and DE have less than 30% tertiary attainment and are therefore on the lower side within the EU; UK, SE and EE are amongst
the EU countries with the highest tertiary attainment (around 40% or more).
46 The results are impacted by outliers HU and EL; if these outliers are dropped, the results become stronger and more robust across different regression specifications.

29
(both in random and fixed-effects regressions). These results can also be turned around, to say that
relatively small increases in labour productivity can already go hand in hand with a sizeable
relationship with the perception of skills shortages in an economy.
Table 2a: Random-effects regressions of labour productivity and skills shortages
(1) (2) (3) (4) (5) (6)
VARIABLES re re re-EU-15 re-EU-15 re-EU-13 re-EU-13
Output gap -0.000 0.005*** 0.002* 0.004*** -0.001 0.008***
(0.002) (0.002) (0.001) (0.001) (0.003) (0.003)
% High-skilled jobs 0.014*** 0.005*** 0.022***
(0.002) (0.001) (0.004)
Skills shortages 0.004*** 0.000 0.004*** 0.003*** 0.004* -0.002
(0.001) (0.001) (0.001) (0.001) (0.002) (0.002)
% Tertiary attainment 0.014*** 0.004*** 0.025***
(0.001) (0.001) (0.002)
Constant 2.675*** 2.849*** 3.466*** 3.580*** 1.846*** 2.065***
(0.115) (0.118) (0.074) (0.068) (0.173) (0.102)
Observations 323 322 174 173 149 149
R-squared 0.362 0.213 0.596 0.385 0.164 0.168
Number of geo 24 24 13 13 11 11
Wald chi2 49.735 145.870 56.745 67.554 29.614 162.918
Prob>chi2 0.000 0.000 0.000 0.000 0.000 0.000
Standard errors in parentheses
*** p<0.01, ** p<0.05, * p<0.1

30
Table 2b: Fixed-effects regressions of labour productivity and skills shortages
Note that our results do not imply that skills shortages have a positive impact on labour productivity.
Rather, we are not able to isolate the potentially negative impact of skills shortages based on our
analysis at the aggregate level. Micro-econometric analyses based on firm-level data may be more
adequate to measure this impact. The correct interpretation of our findings would be that skills
shortages tend to occur in an environment of economic expansion and growing productivity.
3.4. MEASURES OF ON-THE-JOB SKILLS MISMATCH
We now turn to our two measures of on-the-job skills mismatch: underqualification and
overqualification.
3.4.1. Theoretical arguments
In the existing literature, inferences on the productivity of workers have mostly been drawn from
observations on their wages – which are considered as proxies for labour productivity. Workers with
higher qualifications tend to fetch higher wages than workers with lower qualifications. Wages also
tend to grow with the occupational status of someone's job: managers, professionals and technicians
tend to earn more than clerks, sales workers, and artisans. If wages correctly reflect productivity, this
implies that productivity is increasing with a worker's qualification level and with the occupational
level of his/her job. Aggregate data indeed suggest a positive correlation between labour productivity
and the share of high-skilled jobs on the one hand (Figure 15) and between labour productivity and the
share of tertiary attainment on the other hand (Figure 16).
(1) (2) (3) (4) (5) (6)
VARIABLES fe fe fe-EU-15 fe-EU-15 fe-EU-13 fe-EU-13
Output gap -0.001 0.005*** 0.002* 0.004*** -0.001 0.008***
(0.002) (0.002) (0.001) (0.001) (0.003) (0.003)
% High-skilled jobs 0.012*** 0.004*** 0.022***
(0.002) (0.001) (0.005)
Skills shortages 0.004*** 0.000 0.004*** 0.003*** 0.005** -0.002
(0.001) (0.001) (0.001) (0.001) (0.002) (0.002)
% Tertiary attainment 0.014*** 0.004*** 0.025***
(0.001) (0.001) (0.002)
Constant 2.734*** 2.850*** 3.523*** 3.589*** 1.835*** 2.060***
(0.083) (0.032) (0.054) (0.024) (0.164) (0.047)
Observations 323 322 174 173 149 149
R-squared 0.130 0.326 0.264 0.302 0.172 0.544
Number of geo 24 24 13 13 11 11
Standard errors in parentheses
*** p<0.01, ** p<0.05, * p<0.1

31
Figure 15: Linear fit between productivity and
employment share of high-skilled occupations
(2017)
Figure 16: Linear fit between productivity and
qualification level of the population (2017)
Note: High-skilled jobs are occupations with ISCO 1-digit codes 1-3. Tertiary attainment is measured as the share of indiv iduals holding a tertiary degree (ISCED levels 5-8) in age group 25-64. The R²adj-values of the linear models are respectiv ely 0.47 and 0.30.
Countries with a higher share of high-skilled occupations typically also have a higher labour
productivity. The relationship between the share of high-qualified individuals in the working
population and productivity is a bit less strong. In countries such as Lithuania and Cyprus, where, as
we will see in subsequent analysis, the degree of overqualification is relatively high, labour
productivity is below what one would expect in a country with such a high share of tertiary educated
workers.
A. Underqualification
Underskilling or underqualification implies that workers do not have the skills or qualifications, which
would allow them to attain the highest possible productivity in their jobs. The argument that skilled
workers are more capable of using new technologies has been made earlier by Katz and Autor (1999),
Acemoglu (2002) and Link and Siegel (2003). Acemoglu and Zilibotti (2001) argue that less
developed countries, which import technologies developed by more advanced countries, are unable to
achieve the same productivity levels, resulting in considerable output gaps. They attribute this to
"skills scarcity", implying that in less-developed countries, unskilled workers perform the tasks that
are carried out by skilled workers in developed countries.
Empirical studies on the contribution of workers' human capital to productivity find that workers with
higher educational attainment achieve higher sales per worker (e.g. Abowd and Kramaz, 2005) and
contribute to raising total factor productivity (e.g. Ilmakunnas et al., 2004). Based on an analysis of
PIAAC data, both McGowan and Andrews (2015a) and Zira (2016) find a negative relationship
between underskilling and firm-level productivity. Based on linked employer-employee panel data,
similar results have been found for underqualification (Kampelmann and Rycx, 2012; Grunau, 2016).
The relationship between underqualification and aggregate productivity depends on the perspective
taken. If one compares productivity of underqualified workers with productivity of workers with the
right (higher) educational attainment in a similar job, it is clear that underqualification leads to lower
aggregate productivity. On the other hand, if one compares the productivity level of underqualified
workers with the productivity level of workers with similar educational attainment in a well-matched
job (in other words, a job with lower skills requirements), the underqualified worker will have a higher
32
labour productivity as jobs with higher skills requirements tend to be more productive. It is also
important to mention that underqualification might actually be a sign of the successful labour market
integration of low-qualified workers, strengthening effective labour resource utilisation, and as such be
positively related with aggregate output. Figure A2.25 and Figure A2.26 in Annex 2 show the positive
correlation between underqualification and employment outcomes for low-qualified workers. See also
e.g. Maré et al. (2015) for a paper considering the impact of "skills dilution" as a result of strong
employment growth for workers with relatively low skills on firm-level productivity growth.
B. Overqualification
Overqualification implies that workers have a higher qualification level than their job requires, or than
they can use in their jobs. The literature has identified several theoretical channels through which
overqualification (or the related – albeit not identical – phenomenon of overskilling) can be related
with productivity of workers. On the one hand, as mentioned in Section 3.1 human capital theory
predicts that education and skills have a positive impact on productivity – and this would apply even
beyond the qualifications or skills that are strictly required for a job (although at a lesser rate).47
On the
other hand, overqualification has been argued to reduce job satisfaction and motivation and increase
turnover, reducing productivity (Tsang, 1987; Tsang et al., 1991; Hersch 1991).48
Over time,
overqualification may as well lead to cognitive decline (De Grip et al., 2008). These relationships
mitigate the positive relationship between overqualification and productivity at the micro-level.
Empirical work suggests that overqualified workers typically earn more than workers with a similar
job and matching qualifications; but less than workers with a similar qualification level and a
matching job (see e.g. Sicherman, 1991; Sloane et al., 1999; Cohn and Ng, 2000; Dolton and Silles,
2008; Levels et al., 2014). Hence, if wages reflect productivity,49
overqualification raises productivity
compared to the case where a worker would have a lower qualification in the same job; but reduces
productivity compared to the case where a worker would have the same qualification level but a more
requiring job.
Some researchers have directly assessed the impact of overqualification on firm-level productivity. For
example, Rycx and co-authors find that overeducation has a positive impact on productivity (implicitly
controlling for jobs' skills requirements); and in particular so for firms with a higher share of high-
skilled jobs, in high-tech industries, and in a more uncertain economic environment (Kampelmann and
Rycx, 2012; Mahy et al., 2015).
47 Note that some scholars have argued against the human capital theory, arguing that the positive correlation between education and productivity reflects to a certain extent the signalling value of education for individuals who already had a
higher innate ability (and hence productivity) before undertaking education (e.g. Arrow, 1973; Spence, 1973; 1974). Brown
and Sessions (1999) and by Psacharopolous (1979) found some evidence in favour of this hypothesis; however, a substantial
number of studies refute these results and point at a substantial impact of education on productivity (e.g. Chevalier et al.,
2004; Layard and Psacharopolous, 1974; Groot and Oosterbeek, 1994; Kroch and Sjoblom, 1994; Johnes, 1998; Dickson, 2013). An interesting argument in this context is made by Pericles Rospigliosi et al. (2014), who argue that most (40-70%)
graduate job vacancies are open to graduates of any subject; imply ing that employers are not interested in subject-specific
knowledge per se (see as well Roberts 2006) as it rapidly becomes outdated; but rather in the fact that they are "specialists in
the practice of learning", reflecting a strong ability and willingness to "learn on-the-job". In their view, the propensity to learn
benefits graduates (who earn higher wages), employers, as well as economies at large (who benefit from increased resilience if the workforce has a higher capacity to adapt to rapid change).
48 Some counterevidence is however provided by Büchel (2002).
49 Human capital theory asserts that wage differentials reflect differences in productivity (Becker, 1964). Labour market
regulations and bargaining institutions can however generate a mismatch between productivity and wages in the short run (see
e.g. Weeden, 2002). A recent study by Rycx et al. (2015) argues that qualifications have a stronger impact on productivity than on wages; as productivity dispersion tends to exceed wage dispersion.

33
McGowan and Andrews (2015a) argue that, while firm-level productivity may indeed increase with
overqualification, there may still be a negative association between aggregate productivity of an
economy and overqualification as a result of a suboptimal allocation of resources (referring to the
"potential productivity" higher-skilled workers could have if they were in well-matched jobs). Their
main argument is that if (less productive) firms recruit highly qualified workers for jobs that do not
require such qualifications; while other firms face a shortage of or have difficulties accessing highly
qualified workers for the (more productive) jobs they offer, such misallocation of resources constrains
entry and expansion of more productive firms and as such reduces aggregate productivity.50
Potential
causes include policy variables such as rigid labour market regulations, barriers to competition and to
firm entry and exit, but also structural factors (such as housing policies etc.) leading to low geographic
labour mobility (McGowan and Andrews, 2015b).
The ensuing hypotheses on the sign of the relationship between on-the-job mismatch and productivity
are as follows:
Underqualification is expected to be negatively related with productivity, after
controlling for jobs' qualification requirements in the economy (in which case the
counterfactual consists of those with the right – and hence higher - qualification in the
same job).
Underqualification is expected to be positively related with productivity, after controlling
for educational attainment in the economy (in which case the counterfactual considers
those with similar qualifications in less-requiring jobs).
Overqualification is expected to be positively related with productivity, when controlling
for jobs' skills requirements in the economy (in which case the counterfactual consists of
those with the right – and hence lower - qualification in the same job.
Overqualification is expected to be negatively related with productivity, when controlling
for educational attainment in the economy (in which case the counterfactual considers
those with similar qualifications in more-requiring jobs).
3.4.2. Empirical findings
Figure 17 shows that there is a positive cross-country correlation between underqualification and
labour productivity. The correlation becomes even stronger when outliers such as Italy, Malta and
Portugal are dropped from the plot. Again, the relationship seems strongly influenced by divergences
between EU-15 and EU-13 countries. While the former generally have higher labour productivity, they
also have more underqualification. The difference in underqualification results from the fact that EU-
13 countries have on average lower shares of low-qualified individuals (and higher levels of medium
attainment).51
Moreover, those who are low-qualified are significantly less likely to be employed
(given high levels of macro-economic skills mismatch in EU-13 countries), again reducing the extent
of underqualification (as the latter only accounts for those individuals who hold a job).
50 This argument is also used by Berton et al. (2017) as a starting point for their analysis of the impact of deregulation of
employment protection legislation on skills mismatch and productivity.
51 The share of individuals with low educational attainment in the New Member States is 13%, as compared to 20% in 2016 in the Old Member States (excluding Portugal, Malta, Italy and Spain).

34
Figure 17: Linear fit between labour productivity and underqualification (2017)
Source: Own calculations based on LFS. The R²adj-values of the linear models are respectiv ely 0.06 (all MS included) and 0.37 (without PT, MT, and IT).
Fixed-effects correlations in
Figure 18 suggest that, as one would expect, the relationship between labour productivity and
underqualification over time is negative, once controls for job skills requirements are included. If one
controls for educational attainment instead, the relationship becomes insignificant, suggesting that the
relationship between underqualification and labour productivity mostly coincides with the relationship
between educational attainment and the latter.
Figure 18: Fixed-effects correlations between labour productivity and underqualification (2000-17)
(a) controlling for % high-skilled jobs (b) controlling for tertiary attainment
Note: In the Figures abov e, all countries appear 18 times – once for each year included in the sample.
As Figure 19 shows, there is no significant cross-country correlation between labour productivity and
overqualification. This could be related to the fact that overqualification relates positively to tertiary
attainment (which relates positively with labour productivity) on the one hand, and it relates
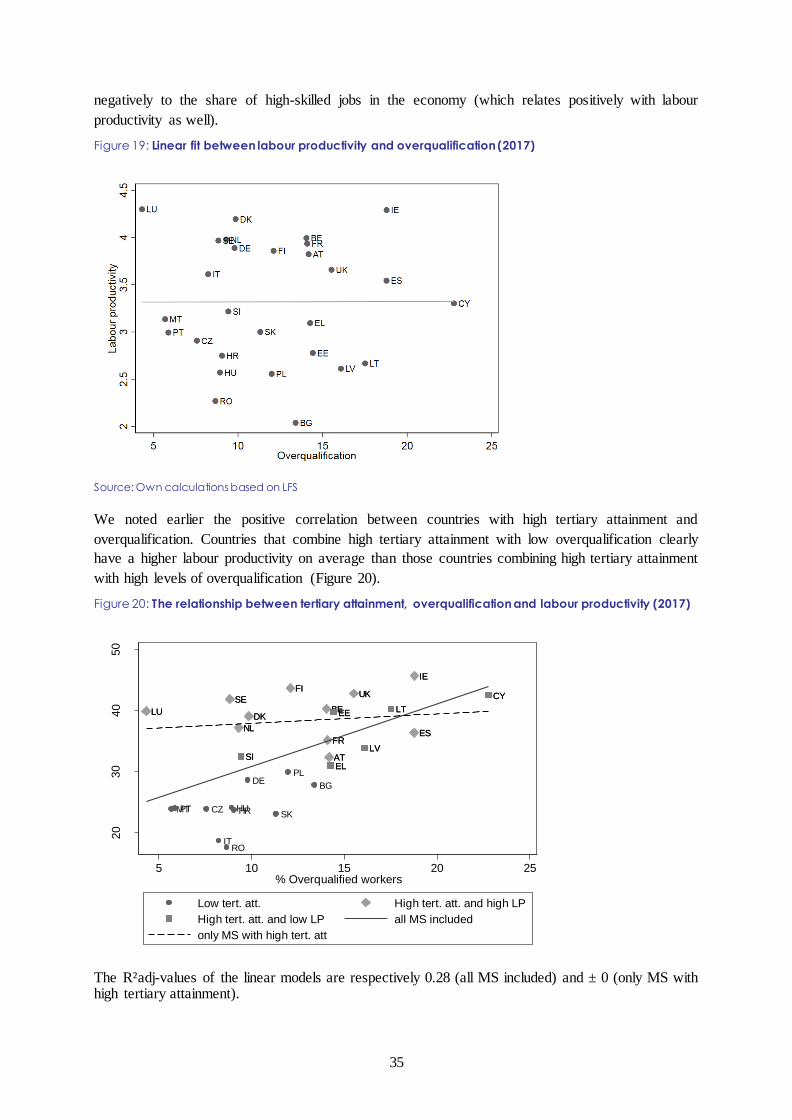
35
negatively to the share of high-skilled jobs in the economy (which relates positively with labour
productivity as well).
Figure 19: Linear fit between labour productivity and overqualification (2017)
Source: Own calculations based on LFS
We noted earlier the positive correlation between countries with high tertiary attainment and
overqualification. Countries that combine high tertiary attainment with low overqualification clearly
have a higher labour productivity on average than those countries combining high tertiary attainment
with high levels of overqualification (Figure 20).
Figure 20: The relationship between tertiary attainment, overqualification and labour productivity (2017)
The R²adj-values of the linear models are respectively 0.28 (all MS included) and ± 0 (only MS with high tertiary attainment).
AT
BE
BG
CY
CZ
DE
DK EE
EL
ES
FI
FR
HRHU
IE
IT
LTLU
LV
MT
NL
PL
PT
RO
SE
SI
SK
UK
AT
BEDK
ES
FI
FR
IE
LU
NL
SEUK CY
EE
EL
LT
LVSI
20
30
40
50
Tert
iary
attain
ment
5 10 15 20 25% Overqualified workers
Low tert. att. High tert. att. and high LP
High tert. att. and low LP all MS included
only MS with high tert. att

36
When exploiting within country variation over time, we find a positive relationship with
overqualification when controlling for job skills requirements; and a negative relationship when
controlling for educational attainment, in line with what one would expect.
Figure 21: Fixed- effects correlations between labour productivity and overqualification (2000-17)
(a) controlling for job skills requirements (b) controlling for educational attainment
Note: In the Figures abov e, all countries appear 18 times – once for each year included in the sample.
Regression results in Table 3a and 3b confirm the expected relationships outlined above, i.e.
overqualification is positively correlated with labour productivity when controlling for occupation
levels and negatively when controlling for educational attainment. In terms of the sise of the
relationship, an increase of 10 percentage-points in overqualification will increase labour productivity
by 24%, if we keep the share of high-skilled jobs equal. Note that this implicitly means that attainment
is increased, while no additional jobs are generated that require a higher degree. If on the other hand
one keeps the share of tertiary attainment equal, however, an increase of 10 percentage-points in
overqualification will reduce productivity by 11%.52
Note that this implicitly means that jobs' skills
requirements are reduced.
The relationship between underqualification and productivity has the opposite sign. An increase in
underqualification by 10 percentage-points reduces productivity by 10-12%, when controlling for jobs'
skills intensity. When controlling for attainment, however, this relationship loses significance, even if
it has the expected positive sign. This again aligns with our earlier finding that the relationship
between underqualification and productivity works mainly through the channel of educational
attainment.
52 These results refer to the random-effects regression estimations. The size of the relationship is similar (resp. +25% and -10% according to the fixed-effects regression estimations.

37
Table 3a: Random-effects regressions of labour productivity and on-the-job mismatch indicators
Table 3b: Fixed-effects regressions of labour productivity and on-the-job mismatch indicators
(1) (2) (3) (4) (5) (6) (7)
VARIABLES re re re re re re re
Overqualification 0.023*** -0.012*** 0.005 -0.012**
(0.003) (0.004) (0.005) (0.005)
Underqualification -0.010*** 0.002 -0.009*** 0.000
(0.001) (0.002) (0.002) (0.002)
Output gap 0.008*** 0.008*** 0.009*** 0.008*** 0.009*** 0.008*** 0.009***
(0.002) (0.001) (0.002) (0.001) (0.002) (0.001) (0.001)
% High-skilled jobs 0.012*** 0.009*** 0.009***
(0.002) (0.002) (0.002)
Tertiary attainment 0.022*** 0.020*** 0.022*** 0.018***
(0.002) (0.002) (0.002) (0.001)
Constant 2.531*** 2.760*** 3.167*** 2.615*** 3.073*** 2.745*** 2.748***
(0.113) (0.101) (0.129) (0.133) (0.157) (0.141) (0.119)
Observations 586 581 586 581 586 581 585
R-squared 0.124 0.317 0.005 0.298 0.010 0.327 0.217
Number of geo 28 28 28 28 28 28 28
Wald chi2 237.698 448.552 261.698 435.802 260.751 442.572 453.796
Prob>chi2 0.000 0.000 0.000 0.000 0.000 0.000 0.000
Standard errors in parentheses
*** p<0.01, ** p<0.05, * p<0.1
(1) (2) (3) (4) (5) (6) (7)
VARIABLES fe fe fe fe fe fe fe
Overqualification 0.024*** -0.010** 0.003 -0.011**
(0.003) (0.004) (0.005) (0.005)
Underqualification -0.012*** 0.001 -0.011*** -0.001
(0.001) (0.002) (0.002) (0.002)
Output gap 0.008*** 0.008*** 0.009*** 0.009*** 0.009*** 0.008*** 0.009***
(0.002) (0.001) (0.002) (0.001) (0.002) (0.001) (0.001)
% High-skilled jobs 0.011*** 0.007*** 0.007***
(0.002) (0.002) (0.002)
Tertiary attainment 0.021*** 0.019*** 0.020*** 0.018***
(0.002) (0.002) (0.002) (0.001)
Constant 2.593*** 2.798*** 3.325*** 2.728*** 3.276*** 2.867*** 2.790***
(0.053) (0.022) (0.096) (0.094) (0.131) (0.110) (0.021)
Observations 586 581 586 581 586 581 585
R-squared 0.303 0.450 0.340 0.444 0.341 0.450 0.448
Number of geo 28 28 28 28 28 28 28
Standard errors in parentheses
*** p<0.01, ** p<0.05, * p<0.1

38
4. CONCLUSION AND POLICY IMPLICATIONS
In conclusion, we have provided theoretical considerations on the relationship between skills
mismatch and productivity and have shown a correlational analysis thereof. These considerations have
shown the complexity of this relationship and the need for further work in terms of developing a
structural model.
In terms of skills mismatch developments our data suggest that certain types of skills mismatch are
indeed on the rise in the EU, notably skills shortages (especially in those countries with good labour
market performances) and overqualification (especially in those countries where tertiary attainment
has expanded considerably, without being accompanied by a commensurate rise in high-skilled jobs).
Other types are on a long-term declining trend (e.g. underqualification) or follow more complex
patterns over time (e.g. macro-economic skills mismatch). Nevertheless, there are significant
differences across EU Member States in the levels of these indicators as well as in their evolutions
over time.
In terms of the relationship between skills mismatch and productivity, our analysis suggests that it is
not as clear-cut as it may seem.
Table presents a schematic overview of our findings.
Table 4: Overview of our findings
Skills mismatch indicator Expected relationship Empirical relationship
Macro-economic skills mismatch (+) as high macro-economic skills
mismatch is associated with low
employment rates of lower qualified
individuals and labour productivity
is expected to be higher if
employment is biased towards the
higher-qualified
(-) for the full sample, possibly due
to strong correlation with economic
growth
(+) for the EU-15
Skills shortages (-) (+) possibly due to strong correlation
with economic growth
Overqualification (+) within a given job category,
(-) within a given qualification
(+) within a given job category,
(-) within a given qualification
Underqualification (-) within a given job category,
(+) within a given qualification
(-) within a given job category,
(+) within a given qualification
In the case of macro-economic skills mismatch and skills shortages, our results contradict our prior
hypotheses – potentially pointing to other factors at play that may require some further investigation.
In the case of macro-economic skills mismatch, the results should not entirely surprise us as similar
inconsistencies between what theory predicts under common assumptions have been found in the
existing literature at the level of the cyclical behaviour of productivity, where it has for example been
explained by the labour hoarding hypothesis. The hypothesis that higher macro-economic skills
mismatch (i.e. a right-skewed distribution of employment towards higher qualified workers) is
correlated with higher productivity is, however, confirmed for EU-15 countries.
For skills shortages, while one would theoretically expect a negative relationship with productivity,
across countries and across time, we mostly observe that those countries doing better in terms of

39
economic growth (beyond what is captured by the output gap) generally combine labour productivity
growth with a higher incidence of skills shortages. This by no means implies that skills shortages are a
desirable feature. It rather means that they are often an undesirable side effect of an otherwise positive
phenomenon (economic expansion). To accurately analyse their relationship with productivity, micro-
level analysis based on firm-level data might be more appropriate than the type of macro-level analysis
we have pursued.
Finally, in the case of on-the-job mismatch indicators, our macro-level findings align closely with
earlier findings from micro-level studies. They imply that educational expansion is positively related
with productivity, but to be exploited to its full potential, it needs to be accompanied by a general
upgrading of jobs in order to put these higher skills to their best use. Important framework conditions
are quality assurance in education, policies that promote the alignment between education and training
systems and the labour market, and a policy setting that encourages the creation of higher value-added
jobs.
What options are available to policymakers wanting to address skills mismatch?
Macro-economic skills mismatch is typically caused by a weak integration in the labour market of
less-skilled workers, while they still make out a substantial share of the population. Skills mismatch
can decline through a reduction in the share of less -skilled workers – e.g. through prevention of
early school leaving, by making available appropriate means to allow individuals to upskill and reskill
themselves (including through work-based learning) and fight skills obsolescence (active labour
market policies, the accessibility of vocational training and higher education for adults and so on).
When not caused by general labour shortages, skills shortages often reflect the lack of specific skills
or profiles among individuals available for work. To some extent, skills shortages may result from
inertia in wage adjustment (for certain types of shortages wage increases can raise labour supply)
and/or reflect the unavoidable lag between emerging labour market demands (e.g. as a result of the
development of new sectors) and the response of labour supply (as education and training programs
typically take a few years). It may be solved through market mechanisms. Economists argue indeed
that the demand side issues such as wage setting practices are also important responses to mismatch
(Rathelot and van Rens 2017). In view of the important role of wages, also the wider policy context
such as labour market and welfare policies should be considered. However, to address structural
skills shortages, measures that allow individuals to upskill and reskill themselves , including
through “Upskilling pathways”53
and work-based learning, are crucial here too.54
In this context, the
European Commission has been promoting the European Pillar of Social Rights55
since 2017 – with as
first principle that "Everyone [should have] the right to quality and inclusive education, training and
life-long earning in order to maintain and acquire skills that enable them to participate fully in society
and manage successfully transitions in the labour market". Furthermore, the “New Skills Agenda for
Europe”56
, proposed by the European Commission in 2016, aims at improving training, skills and
support available to people in the EU as well as enhancing the skill matching process and proposes ten
actions (“Upskilling Pathways” is one of them). It includes dimensions related to improving skills
matching, also by developing labour market intelligence and by better aligning skills to labour market
53 See EC (2016) Council Recommendation of 19 December 2016 on Upskilling Pathways: New Opportunities for Adults
(2016/C 484/01). 54 For a more detailed review of some policy options, see e.g. EP (2015) 55 See https://ec.europa.eu/commission/priorities/deeper-and-fairer-economic-and-monetary-union/european-pillar-social-
rights_en 56 See SWD(2016) 195 final.

40
needs (such as for instance the “Europass”57
framework, the “European Alliance for Apprenticeships
(EAfA)58
” or the “European multilingual classification of Skills, Competences, Qualifications and
Occupations (ESCO)59
”). Labour market intelligence and skill governance are measures that
inform prospective students about labour market outcomes of specific training programs (based for
instance on graduate tracking surveys), reports on expected skills needs by growing sectors, the
involvement of social partners in the development and update of education and training curricula or
effective tools for workforce planning in specific sectors (such as healthcare). Effective immigration
policies for specific higher skills profiles can also help address skills shortages in a relative short-term. 60
When it comes to overqualification, some degree of overqualification can be acceptable. However, if
overqualification is widespread, persistent, involuntary, and results from gaps in the quality of
education or from a lack of labour demand (of graduates of a specific type), it is an important reason
for policy concern. Strategies to address it include ensuring the quality and labour market
relevance of education and training programs (e.g. if graduates are lacking specific skills
indispensable to employers),61
and broader initiatives to promote regional development of skills -
intensive industries62
and reduce possible barriers to firm entry, exit and growth63
to foster the
creation of jobs that can effectively exploit available human capital. Reducing overqualification by
restricting access to tertiary attainment may in the end not be an optimal policy response, given that
our results suggest a positive relationship between higher attainment and productivity, even in case of
overqualification, where it is attenuated. Moreover, upskilling of the population can reduce macro-
economic skills mismatch, address skills shortages, and reduce underqualification and may have a
positive relationship with productivity and/or output through these channels as well.
Likewise, underqualification can be a sign of successful labour market integration of less-skilled
workers, for example through non-formal vocational training courses that are not necessarily leading
to higher formal qualifications. It is certainly more desirable to have underqualified workers than to
have high unemployment or inactivity rates among less-skilled workers. On the other hand,
underqualification can be mitigated by reducing the share of low-qualified workers in the
population by preventing early school leaving and providing adequate "Upskilling pathways" (see
above). A considerable share of the underqualified are workers that left school without at least an
upper secondary school degree. However, upper secondary education is nowadays generally
considered as the minimum qualification for a successful integration in the labour market and in
society more generally. Educational requirements can be expected to strengthen further due to ongoing
societal trends of globalisation, skill-biased technological change, and the need to raise productivity to
counteract demographic challenges in Europe. This is attested by the observation that employment
expansion in occupations with higher skills requirements has outpaced employment growth in other
occupations over recent decades.
57 See SWD(2016) 320 final 58 See https://ec.europa.eu/social/main.jsp?catId=1147 59 See https://ec.europa.eu/esco/portal/home 60 See European Migration Network, EMN (2015) 61 For example, Erdsiek (2017) finds that overqualification persistence is partly attributable to ability and choice of study
field. The negative impact of ability on the probability of overqualification has been highlighted before by Büchel and Pollmann-Schult (2004) and Chevalier and Lindley (2009). Erdsiek (2014) has found social capital to play a role as well. 62 For example by strengthening local knowledge conditions (Roper et al., 2017) 63 See e.g. McGowan and Andrews (2015b) on firm entry and exit regulations and mismatch. There are different reasons why
barriers to firm growth may constrain the knowledge intensity of the economy. For example, large firms may invest more in
R&D due to their easier access to external capital (Czarnitzki and Hottenrott, 2011). Moreover, growth options can mitigate the R&D investment dampening effect of uncertainty (Czarnitzki and Toole, 2013)

41
Note that in this paper, we have not looked explicitly at horizontal skills mismatches, notably that a
mismatch can exist between workers’ fields of study and the field of their jobs. The main reason is we
have not been able to identify a robust indicator of horizontal mismatch that covers all or most EU
countries, and can be calculated on a yearly basis. As mentioned above in Section 2.3, horizontal
mismatch is more difficult to measure than vertical mismatch (Sellami et al., 2018), and arguably less
problematic from a policy perspective as horizontally mismatched workers are less likely to suffer
from a wage penalty than overqualified workers (Montt, 2017). Yet, in terms of policy implications,
reskilling workers is often as important as upskilling them. Reskilling often involves shorter and
more flexible training programs, and is of particular importance for workers who have left initial
education and are seeking to update their skills or reorient their skills set towards new demands of the
labour market.

42
5. REFERENCES
Abowd, J.M., Kramaz, F. (2005) Human capital and worker productivity: direct evidence from linked emp loyer-employee data. Annales d'Économie et de Statistique, No. 79/80: 323-338.
Abraham, K. G., Haltiwanger, J. C. (1995). Real wages and the business cycle. Journal of Economic Literature, 33(3), 1215-1264.
Acemoglu, D. (1996) A microfoundation for social increasing returns in human capital accumulation. The
Quarterly Journal of Economics 111(3): 779-804.
Acemoglu, D. (2002). Technical change, inequality, and the labour market. Journal of Economic Literature, 40(1), 7-72.
Acemoglu, D., Gallego, F.A., Robinson, J.A. (2014) Institutions, Human Capital, and Development. Annual Review of Economics, 6: 875-912.
Acemoglu, D., Zilibotti, F. (2001): Productivity differences, Quarterly Journal of Economics, 116 (2): 563-606.
Aizcorbe, A. M. (1992). Procyclical labour productivity, increasing returns to labour and labour hoarding in car
assembly plant employment. The Economic Journal, 102(413), 860-873.
Akerman, A., Gaarder, I., & Mogstad, M. (2015). The skill complementarity of broadband internet. The Quarterly Journal of Economics, 130(4), 1781-1824.
Alessandrini, D., Kosempel, S., Stengos, T. (2015) The business cycle human capital accumulation nexus and its effect on hours worked volatility. Journal of Economic Dynamics and Control, 51: 356-377.
Angrist, J. D., Pischke, J. S. (2008). Mostly harmless econometrics: An empiricist's companion. Princeton
university press.
Arpaia, A., Kiss, A., Turrini, A. (2014) Is unemployment structural or cyclical? Main features of job matching in
the EU after the crisis. European Economy Economic Papers 527, European Commission. Downloadable from http://ec.europa.eu/economy_finance/publications/economic_paper/2014/pdf/ecp527_en.pdf
Arrow, K. J. (1973). Higher education as a filter. Journal of Public Economics, 2(3), 193-216.
Baily, M.N., Bartelsman, E.J., Haltiwanger, J. (2001) Labour productivity: structural change and cyclical
dynamics. The Review of Economics and Statistics, 83(3): 420-433.
Barnichon, R. (2014) The Shimer puzzle and the endogeneity of productivity. Working Paper, Centre de Recerca en Economia Internacional (CREI), Barcelona.
Barro, R. J. (1991). Economic growth in a cross section of countries. The quarterly journal of economics, 106(2), 407-443.
Barro, R. J. (2001). Human Capital and Growth, American Economic Review, 91(2), 12–17.
Basu, S. (1996). Procyclical productivity: increasing returns or cyclical utilization? Quarterly Journal of
Economics 111 (3).
Becker, G. S. (1964). Human capital theory. Columbia, New York.
Benhabib, J., Spiegel, M. M. (1994). The role of human capital in economic development evidence from aggregate cross-country data. Journal of Monetary economics, 34(2), 143-173.
Bennett, J., McGuinness, S. (2009) Assessing the impact of skill shortages on the productivity performance of high-tech firms in Northern Ireland, Applied Economics, 41(6): 727-737.
Berman, E., Bound, J., & Griliches, Z. (1994). Changes in the demand for skilled labour within US
manufacturing: evidence from the annual survey of manufactures. The Quarterly Journal of Economics, 109(2), 367-397.

43
Bernanke, B. and M. Parkinson (1991). Procyclical labour productivity and competing theories of the business
cycle: Some evidence from interwar U.S. manufacturing industries. Journal of Political Economy 99 (3), 439-459.
Berton, F., Devicienti, F., Grubanov-Boskovic, S. (2017) Employment protection legislation and mismatch: evidence from a reform. IZA Discussion Paper No. 10904.
Blanchard, O. J., & Summers, L. H. (1986). Hysteresis and the European unemployment problem. NBER
macroeconomics annual, 1, 15-78.
Blanchard, O. and M. Watson (1986). Are busines s cycles all alike? In R. Gordon (Ed.), Continuity and Change in the American Business Cycle. NBER and the University of Chicago Press.
Blundell, R., Green, D.A., Jin, W. (2016) The UK Wage Premium Puzzle: How did a Large Increase in
University Graduates Leave the Education Premium Unchanged? IFS Working Paper W16/01. Institute for
Fiscal Studies, London, UK.
Bosworth, D.L., Dutton, P.A. (1990) Skill shortages: an overview. International Journal of Manpower, 11(2): 54-57.
Bound, J., Johnson, G. (1995) What are the causes of rising wage inequality in the United States? Economic Policy Review, 1(1).
Brown, S., & Sessions, J. G. (1999). Education and employment status: a test of the strong screening hypothesis
in Italy. Economics of Education Review, 18(4), 397-404.
Büchel, F. (2002) The effects of overeducation on productivity in Germany – the firms' viewpoint. Economics of Education Review, 21(3): 263-275.
Büchel, F., Battu, H. (2002) The theory of differential overqualification: does it work? IZA Discussion Paper No. 511.
Büchel, F., Pollmann-Schult, M. (2004) Overeducation and Human Capital Endowments. International Journal
of Manpower, 25(2): 150-166.
Budría, S., & Moro-Egido, A. (2014). Overqualification, skill mismatches and wages in private sector employment in Europe. Technological and Economic Development of Economy, 20(3), 457-483.
Burnside, C., M. Eichenbaum, and S. Rebelo (1993). Labour hoarding and the business cycle. Journal of Political Economy 101 (2), 245–273.
Büttner, T., Jacobebbinghaus, P., Ludsteck, J. (2010) Occupational Upgrading and the Business Cycle in West
Germany. Economics – The Open-Access, Open-Assessment E-Journal, 4: 2010-10.
Capelli, P.H. (2015) Skill gaps, skill shortages, and skill mismatches: evidence and arguments for the Un ited States. ILR Review, 68(2): 251-290.
CEDEFOP (2015) Skill shortages and gaps in European enterprises: Striking a balance between vocational
education and training in the labour market. European Centre for Development of Vocational Training,
Thessaloniki, Greece.
Chevalier, A., Harmon, C., Walker, I., & Zhu, Y. (2004). Does education raise productivity, or just reflect it?. The Economic Journal, 114: F499-F517.
Chevalier, A., Lindley, J. (2009) Overeducation and the skills of UK graduates. Journal of the Royal Statistical Society: Series A, 172(2): 307-337.
Chirinko, R. S. (1995). Nonconvexities, labour hoarding, technology shocks, and procyclical productivity A
structural econometric analysis. Journal of Econometrics, 66(1), 61-98.
Christiano, L. J., Eichenbaum, M., & Vigfusson, R. (2003). What happens after a technology shock? National Bureau of Economic Research Working Paper No. 9819.
Cohn, E., Ng, Y. C. (2000). Incidence and wage effects of overschooling and underschooling in Hong Kong. Economics of Education Review, 19(2), 159-168.

44
Czarnitzki, D., Hottenrott, H. (2011) R&D investment and financing constraints of small and medium-sized
firms. Small Business Economics, 36(1): 65-83.
Czarnitzki, D., Toole, A.A. (2013) The R&D Investment-Uncertainty Relationship: Do Competition and Firm Size Matter? ZEW Discussion Paper No. 08-013.
De Grip, A., Bosma, H., Willems, D., van Boxtel, M. (2008) Job-Worker Mismatch and Cognitive Decline. Oxford Economic Papers, 60 (2): 237–253. Available online at, www.jstor.org/stable/25167687.
De la Fuente, A. (2011): Human capital and productivity, Barcelona Economics Working Paper Series, Working
Paper No. 330.
Dellas, H. (2003) Business cycles and schooling. European Journal of Political Economy, 19(4): 843-859.
Desjardins, R., Rubenson, K. (2011). An analysis of skill mismatch using direct measures of skills. OECD Education Working Paper No. 63.
Devereux, P. (2002) Occupational Upgrading and the Business Cycle. Labour, 16(3):423-452.
Dickson, M. (2013) The causal effect of education on wages revisited. Oxford Bulletin of Economics and Statistics, 75(4): 477-498.
Dixon, R. (2006): Male and female unemployment rate dispersion in a large Australian city. Australasian
Journal of Regional Studies, 12 (2): 205-216.
Dolton, P.J., Silles, M.A. (2008) The effects of over-education on earnings in the graduate labour market. Economics of Education Review, 27: 125-139.
Duffy, J., Papageorgiou, C., Perez-Sebastian, F. (2004) Capital-skill complementarity? Evidence from a panel of countries. The Review of Economics and Statistics, 86 (1): 327-344.
Durbin, S. (2004) Workplace Skills, Technology Adoption and Firm Productivity: A Review. New Zealand
Treasury Working Paper 04/16.
ECB. (2012). Euro area labour markets and the crisis. Structural issues report, European Central Bank (Frankfurt am Main).
EMN (2015) Determining labour shortages and the need for labour migration from third countries in the EU: Synthesis Report for the EMN Focussed Study 2015, European Migration Network.
EP (2015) Labour market shortages in the European Union. European Parliament, Directorate General for
Internal Policies, Policy Department A: Economic and Scientific Policy.
Erdsiek, D. (2014) Overqualification of graduates: assessing the role of family background. ZEW Discussion paper No. 14-130.
Erdsiek, D. (2017) Dynamics of Overqualification: Evidence from the Early Career of Graduates. ZEW Discussion paper No. 17-020.
Estevão, M., and E. Tsounta (2011), “Has the Great Recession Raised U.S. Structural Unemployment?” IMF
Working Paper 11/105.
European Commission (2008) The LIME assessment framework (LAF): a methodological tool to compare, in
the context of the Lisbon Strategy, the performance of EU Member States in terms of GDP an din terms of
twenty policy areas affecting growth. European Economy Occasional Papers 41, DG Economic and Financial
Affairs and the Economic Policy Committee, European Commission.
European Commission (2015) Labour market and wage developments in Europe 2015.
European Commission (2016), "Employment and Social Developments in Europe 2015", http://ec.europa.eu/social/main.jsp?catId=738&langId=en&pubId=7859&furtherPubs=yes
Flisi, S., Goglio, V., Meroni, E.C., Rodriguez, M., Vera-Toscano, E. (2017) Measuring Occupational Mismatch:
Overeducation and Overskill in Europe – Evidence from PIAAC. Social Indicators Research, 131(3): 1211-
1249.

45
Foley, P., Watts, D. (1994) Skills shortages and training: a forgotten dimension in new technology. R&D
Management, 24(3): 279-289.
Forth, J., Mason, G. (2004). The impact of high-level skill shortages on firm-level performance: evidence from
the UK Technical Graduates Employers Survey. National Institute of Economic and Social Research Discussion Paper No. 235.
Frank, R.H. (1978) Why women earn less: the theory and estimation of differential overqualification. American
Economic Review, 68(3): 360-373.
Galenianos, M., Trapeznikova, I., Fontaine, F., Bagger, J. (2015). Hiring, separations, vacancies and productivity. Society for Economic Dynamics, 2015 Meeting Papers No. 1249.
Galí, J., & Van Rens, T. (2014). The vanishing procyclicality of labour productivity. CEPR Discussion Paper No. 9853.
Goldin, C., Katz, L.F. (1998) The origins of technology-skill complementarity. Quarterly Journal of Economics.
Green, F., Ashton, D. (1992). Skill shortage and skill deficiency: a critique. Work, Employment and Society,
6(2), 287-301.
Green, F., Henseke, G. (2016) Should governments of OECD countries worry about graduate underemployment? Oxford Review of EconomicPolicy, 32(4): 514-537.
Greenwood, J., Hercowitz, Z., Krusell, P. (1997). Long-run implications of investment-specific technological change. American Economic Review, 87(3): 342-362.
Groot, W., Oosterbeek, H. (1994). Earnings effects of different components of human capital vs. screening,
Review of Economics and Statistics, 76: 317–321.
Grossman, G. M., Helpman, E. (1991). Quality ladders in the theory of growth. The Review of Economic Studies, 58(1), 43-61.
Grunau, P. (2016). The impact of overeducated and undereducated workers on firm-level productivity: First evidence for Germany, International Journal of Manpower, 37(2): 258-283.
Haskel, J. and C. Martin (1993a), Do skill shortages reduce productivity? Theory and evidence from the United
Kingdom, The Economic Journal, Vol. 103, pp. 386-394.
Haskel, J. and C. Martin (1993b) The Causes of Skill Shortages in Britain. Oxford Economic Papers, New Series, 45(4): 573-588.
Havik, K., Mc Morrow, K., Orlandi, F., Planas, C., Raciborski, R., Röger, W., Rossi, A., Thum-Thysen,
A.,Vandermeulen, V. (2014). The Production Function Methodology for Calculating Potential Growth Rates &
Output Gaps European Economy Economic Paper Nr. 535, Directorate General Economic and Financial Affairs, European Commission.
Hersch, J. (1991) Education match and job match. Review of Economics and Statistics, 79(1991): 140-144.
Ilmakunnas, P., Maliranta, M., & Vainiomäki, J. (2004). The roles of employer and employee characteristics for plant productivity. Journal of Productivity Analysis, 21(3), 249-276.
Johnes, G. (1998). Human capital versus sorting: new data and a new test, Applied Economics Letters, 5: 665–
667.
Johnson, G.E. (1997) Changes in Earnings Inequality: the role of Demand Shifts. Journal of Economic Perspectives, 11(2): 41-54.
Kampelmann, S., Rycx, F. (2012) The impact of educational mismatch on firm productivity: evidence from linked panel data. Economics of Education Review, 31(6): 918-931.
Katz, L.F., Autor, D.H. (1999) Changes in the Wage Structure and Earnings Inequality. In: Ashenfelter, O.C.,
Card, D. (eds.) Handbook of Labour Economics Volume 3A. Handbooks in Economics, North Holland.
Kiss, A., Vandeplas, A. (2015) Measuring skills mismatch. DG EMPL Analytical webnote 7/2015, European Commission. Downloadable from http://ec.europa.eu/social/BlobServlet?docId=14974&langId=en.

46
Kroch, E., Sjoblom, K. (1994). Schooling as human capital or a signal, Journal of Human Resources, 29: 156–
180.
LaRochelle-Côté, S., Hango, D. (2016) Overqualification, skills and job satisfaction. Insights on Canadian Society, Catalogue no. 75-006-X, Statistics Canada.
Layard, R., Psacharopolous, G. (1974). The screening hypothesis and the returns to education, Journal of Political Economy, 82: 985–998.
Levels, M., van der Velden, R., Allen, J. (2014), Educational Mismatches and Skills: New Empirical Tests of
Old Hypotheses, Oxford Economic Papers, 66(4): 959-982.
Link, A. N., Siegel, D. (2003). Technological change and economic performance . Routledge.
Lipsey, R. G. (1960) The Relation between Unemployment and the Rate of Change of Money Wage Rates in the United Kingdom, 1862-1957: A Further Analysis. Economica, 27(105): 1-31. doi:10.2307/2551424.
Lucas, R. E. (1990). Why doesn't capital flow from rich to poor countries? The American Economic Review, 80(2), 92-96.
Lucas, R.E. (1988) On the mechanics of economic development, Journal of Monetary Economics, 22: 3-42.
Machin, S., & Van Reenen, J. (1998). Technology and changes in skill structure: evidence from seven OECD
countries. The Quarterly Journal of Economics, 113(4): 1215-1244.
Mahy, B., Rycx, F., Vermeylen, G. (2015). Educational mismatch and firm productivity: Do skills, technology and uncertainty matter? De Economist, 163(2): 233-262.
Mankiw, N. G., Romer, D., Weil, D. N. (1992). A contribution to the empirics of economic growth. The Quarterly Journal of Economics, 107(2), 407-437.
Maré, D. C., & Hyslop, D. (2008). Cyclical earnings variation and the composition of employment. Report by
Statistics New Zealand.
Maré, D. C., Hyslop, D. R., & Fabling, R. (2016). Firm productivity growth and skill. New Zealand Economic Papers, 1-25.
Martin, P., Rogers, C.A. (2000) Long-term growth and short-term economic instability. European Economic Review, 44: 359-381.
Mavromaras, K., McGuinness, S., Fok, Y.K. (2009) Assessing the incidence and wage effects of overskilling in
the Australian labour market. Economic Record, 85(268): 60-72.
McGoldrick, K.M., Robst, J. (1996) Gender differences in overeducation: a test of the theory of differential overqualification. American Economic Review, 86(2): 280-284.
McGowan, M., Andrews, D. (2015) Skill mismatch and public policy in OECD countries. Economics Department Working Papers No. 1210. ECO/WKP(2015)28, Paris, France.
McGowan, M., Andrews, D. (2015): Labour market mismatch and labour productivity. Evid ence from PIAAC
data, OECD Economics Department Working Paper No. 1209. ECO/WKP(2015)27, Paris, France.
McGuinness, S., Bennett, J. (2006). Examining the link between skill shortages, training composition and
productivity levels in the construction industry: evidence from Northern Ireland. The International Journal of Human Resource Management, 17(2), 265-279.
Miller, S.M., Upadhyay, M.P. (2000) The effects of openness, trade orientation, and human capital on total
factor productivity. Journal of Development Economics, 63(2): 399-423.
Montt, G. (2017) Field-of-study mismatch and overqualification: labour market correlates and their wage penalty. IZA Journal of Labour Economics, 6: 2.
Moreno-Galbis, E., Sneessens, H. (2007) Low-skilled unemployment, capital-skill complementarity and embodied technical progress. Recherches économiques de Louvain, 2007/3 (73): 241-272.
Mortensen, D. (1970) Job Search, the Duration of Unemployment and the Phillips Curve. American Economic
Review, 60: 847-862.

47
Nickell, S., Nicolatsis, D. (1997) Human capital, investment and innovation: what are the connections? Centre
for Economic Performance Discussion Paper No. 20, London School of Economics.
OECD (2017) Getting skills right: skills for jobs indicators, OECD Publishing, Paris.
OECD. (2009). Employment Outlook. Paris: OECD Publishing.
Oi, W. Y. (1962). Labour as a quasi-fixed factor. Journal of Political Economy 70, 538-555.
Pericles Rospigliosi, A., Greener, S., Bourner, T., & Sheehan, M. (2014). Human capital or signalling, unpacking the graduate premium. International Journal of Social Economics, 41(5), 420-432.
Perry, A., Maehler, D.B. (2017). "Migrants in the OECD. Over-qualified but under-skilled? An international
comparison of labour market integration." 5. GEBF-Tagung der Gesellschaft für Empirische Bildungsforschung,
Heidelberg, 13.03.2017.
Perry, A., Wiederhold, S., Ackermann-Piek, D. (2016). How can skill mismatch be measured? New approaches with PIAAC. methods, data, analyses, 8(2): 137-174.
Peters, D. (2000) Manufacturing in Missouri: Skills-Mismatch Index, ESA-0900-2, Research and Planning,
Missouri: Department of Economic Development, available at:
http://www.missourieconomy.org/industry/manufacturing/mismatch.stm
Pollmann-Schult, M. (2005) Crowding-out of Unskilled Workers in the Business Cycle: Evidence from West Germany. European Sociological Review, 21(5): 467-480.
Psacharopoulos, G. (1979). On the weak versus the strong version of the screening hypothesis. Economics Letters, 4(2), 181-185.
Quarina, Q. (2017). An analysis of the determinants and scarring effects of economic inactivity and
unemployment in the UK. Doctoral dissertation, Lancaster University.
Quintini, G. (2011), “Right for the Job: Over-qualified or Under-skilled?”, OECD Social, Employment and Migration Working Papers, No. 120, OECD Publishing.
Ramos, M. (2014). Mismatched mismatch measures. Does the definition of over-and under-qualification matter? Working paper.
Rathelot, R. And T. van Rens (2017): Rethinking the skills gap, IZA World of Labour: 2017: 391.
Reder, M. (1955) The Theory of Occupational Wage Differentials, American Economic Review, 45(5): 833-852.
Reichelt, M., Abraham, M. (2017) Occupational and regional mobility as substitutes: a new approach to
understanding job changes and wage inequality. Social Forces, 95(4): 1399-1426.
Roberts, L. (2006) After you graduate: finding and getting work you will enjoy , Open University Press, Berkshire.
Roper, S., Love, J.H., Bonner, K. (2017) Firms' knowledge search and local knowledge externalities in innovation performance. Research Policy, 46(1): 43-56.
Rotemberg, J. and L. Summers (1990). In‡exible prices and procyclical productivity. Quarterly Journal of
Economics 105(November), 851–874.
Rycx, F., Saks, Y., Tojerow, I. (2015) Does education raise productivity and wages equally? The moderating role of age, gender and industry. IZA Discussion Paper No. 9043.
Şahin, A., Song, J., Topa, G., & Violante, G. L. (2014). Mismatch unemployment. The American Economic Review, 104(11), 3529-3564.
Saint-Paul, G. (1993) Productivity growth and the structure of the business cycle. European Economic Review,
37: 861-890.
Saltari, E., Travaglini, G. (2009). The productivity slowdown puzzle. Technological and non-technological shocks in the labour market. International Economic Journal, 23(4), 483-509.
Schultz, T. (1962) Reflections on Investment in Man, Journal of Political Economy, 70(5) Part 2: 1-8.
48
Sellami, S., Verhaest, D., Van Trier, W. (2018) How to measure field-of-study mismatch? A comparative
analysis of the different methods. LABOUR, 32(4): 141-173.
Shah, C., & Burke, G. (2003). Skills Shortages: Concepts, Measurement and Implications. Working Paper No. 52. Centre for the Economics of Education and Training, Monash University.
Sicherman, N. (1991) "Overeducation" in the Labour Market. Journal of Labour Economics, 9(2), 101-122.
Sloane, P. J. (2014). Overeducation, skill mismatches, and labour market outcomes for college graduates. IZA World of Labour.
Sloane, P. J., Battu, H., Seaman, P. T. (1999). Overeducation, undereducation and the British labour market.
Applied Economics, 31(11), 1437-1453.
Solow, R. M. (1964). On the short-run relation between employment and output. Presidential address to the econometric society.
Spence, M. (1973). Job market signaling. The quarterly journal of Economics, 87(3), 355-374.
Spence, M. (1974) Market signalling: informational transfer in hiring and related screening processes. Cambridge, MA: Harvard University Press.
Stiroh, K. J. (2009). Volatility accounting: A production perspective on increased economic stability. Journal of
the European Economic Association 7 (4), 671–696.
Tang, J., Wang, W. (2005), “Product Market Competition, Skills Shortages and Productivity: Evidence from Canadian Manufacturing Firms”, Journal of Productivity Analysis, Vol. 23, pp. 317-339.
Toner, P. (2011), “Workforce Skills and Innovation: An Overview of Major Themes in the Literature”, OECD
Directorate for Science, Technology and Industry Working Paper Series, SG/INNOV (2011)1, OECD
Publishing.
Tsang, M.C. (1987) the impact of underutilization of education on productivity: a case study of the US Bell companies. Economics of Education Review, 6(3): 1987.
Tsang, M.C., Rumberger, R.W., Levin, H.M. (1991) The impact of surplus schooling on worker productivity. Industrial Relations, 30(2): 209-228.
UKCES (2012) UK Commission's Employer Skills Survey 2011: UK Results. Evidence Report 45. UK
Commission for Employment and Skills.
Verhaest, D., Bogaert, E., Dereymaeker, J., Mestdagh, L., Baert, S. (2018) Do employers prefer overqualified graduates? A field experiment. Industrial Relations, forthcoming.
Weeden, K.A. (2002) Why do some occupations pay more than others? Social closure and earnings inequality in the United States. American Journal of Sociology, 108(1): 55-101.
Wen, Y. (2004). What does it take to explain procyclical productivity. B.E. Journals, Contributions to
Macroeconomics 4 (1).
Zira, E. (2016), The impact of skill mismatch on aggregate productivity: cross -country analysis in OECD economies, Master Thesis, KTH Royal Institute of Technology, Stockholm, Sweden.

49
ANNEX I: DATA SOURCES AND COVERAGE
The table below presents in more detail the sources and coverage of the data used in the analysis in
this paper.
Table A1.1: Data sources and coverage
Indicator Data source Description
Productivity
Labour productivity (LP) – GDP per hour worked
AMECO
(no sectoral information)
Definition: GDP in Euros and constant prices at 2010 reference level per hours worked
Frequency: Annual data
Member states covered: all
Time coverage: EU15: 1970-2018; EU12: 1995-2018
Total factor productivity (TFP )
DG ECFIN-B3 based on AMECO (no sectoral information)
Definition: TFP is calculated as the Solow residual i.e. the residual of a log-linearised Cobb-Douglas production function with assumed factor elasticities of 0.65 for labour and 0.35 for capital and employment is expressed in terms of hours worked. European Economy Forecast
Frequency: Annual data
Member states covered: all
Time coverage: EU15: 1961-2018; EU12: 1995-2018
Capital intensity AMECO
(no sectoral information)
Definition: Net capital stock in 1000 Euros and constant prices at 2010 reference level per hours worked
Frequency: Annual data
Member states covered: all
Time coverage: EU15: 1970-2018; EU12: 1995-2018
Mismatch variables
Macro-economic skills mismatch (mismatch_macro) – based on employment rates
DG EMPL calculations based on LFS data
Definition: relative dispersion of employment rates (Eurostat code: lfsa_ergaed) by educational attainment, weighted by their importance in the working age population (Eurostat code: lfsq_pgaed)
Frequency: quarterly or annual data
Member States covered: all
Time coverage: as of 2007q2 for HR, as of 2005q1 for all others; as of 1998q1 for some; up to 2017Q4 (last update 07.12.2017)
Macro-economic skills mismatch (mismatch_macro) –
DG EMPL calculations based on LFS
Definition: relative dispersion of unemployment rates (Eurostat code: lfsa_urgaed) by educational attainment, weighted by their importance in the active

50
based on unemployment rates
data population (Eurostat code: lfsq_agaed)
Frequency: quarterly or annual data
Member States covered: all
Time coverage: as of 2007q2 for HR, as of 2005q1 for all others; as of 1998q1 for some; up to 2017Q4 (last update 07.12.2017)
Overqualification, normative measure (overqual)
DG EMPL calculations based on LFS data
Definition: Share of overqualified medium- and high-qualified workers (as percentage of employment) (Eurostat code for employment by occupation: lfsa_egised; Eurostat code for population by educational attainment level: edat_lfse_03)
Frequency: quarterly data
Member States covered: all
Time coverage: as of around 2005 for quarterly data; as of around 2000 for annual data.
Underqualification, normative measure (underqual)
DG EMPL calculations based on LFS data
Definition: Share of underqualified low- and medium-qualified workers (as percentage of employment) (Eurostat code for employment by occupation: lfsa_egised; Eurostat code for population by educational attainment level: edat_lfse_03)
Frequency: quarterly data
Member States covered: all
Time coverage: as of around 2005 for quarterly data; as of around 2000 for annual data.
Skills shortages – industry
Business & Consumer Surveys; Eurostat
Definition: % companies in industry sector reporting that labour is a factor constraining their production (Eurostat code: ei_bsin_q_r2)
Frequency: Quarterly data
Member States covered: all except for IE
Time coverage: for some MS as of 1982; as of 1996 for all except for 5 (IE, HR, CY, LV, MT), for all except IE as of 2008
Skills shortages – services
Business & Consumer Surveys; Eurostat
Definition: % companies in services sector reporting that labour is a factor constraining their production (Eurostat code: ei_bsse_q_r2)
Frequency: Quarterly data
Member States covered: all except for IE and LU
Time coverage: as of around 2003
Skills shortages – construction
Business & Consumer Surveys; Eurostat
Definition: % companies in construction sector reporting that labour is a factor constraining their production (Eurostat code: ei_bsse_q_r2)
Frequency: Monthly data

51
Member States covered: all except for IE
Time coverage: for some MS already as of 1985. At EU level: as of 1993
Skills shortages (LS_tot) Business & Consumer Surveys; Eurostat and AMECO
Weighted average of the three sectoral skills shortages indicators above. Weights are constructed based on sectoral gross value added figures in 2010 prices from AMECO.
Possible control variables
Educational attainment (ISCED_58, ISCED_02)
EU-LFS Definition: % of 25-64 year old population with tertiary educational attainment (as measured by ISCED
64 levels 5-8) or with low educational
attainment (as measured by ISCED levels 0-2) (Eurostat code for population by educational attainment level: edat_lfse_03)
Frequency: Annual data
Member states covered: all
Time coverage: EU15: around 1992-2017; EU12: around 2000-2017
Share of occupations requiring high skills (ISCO_high)
EU-LFS Definition: % of employed population with an occupation requiring tertiary educational attainment according to ILO (2007), notably occupations in ISCO levels 1-3. (Eurostat code for employment by occupation: lfsa_egised)
Frequency: Annual data
Member states covered: all
Time coverage: EU15: around 1992-2017; EU12: around 2000-2017
Output gap (OG) DG ECFIN-B3 calculations based on AMECO data
Definition: % difference between actual GDP and potential GDP (for calculations of potential GDP see Havik et al. 2014)
Frequency: Annual data
Member states covered: all
Time coverage: EU15: around 1965-2018; EU12: around 1997-2018
64
http://uis.unesco.org/en/topic/international-standard-classification-education-isced

52
ANNEX II: DESCRIPTIVE STATISTICS AND GRAPHS
Table A2.1: Summary statistics
Obs Mean St. Dev. Min. Max.
Log(Labour productivity) 1052 3.267 0.637 1.322 4.353
Log(Total factor productivity) 1065 -7.285 0.377 -8.329 -6.375
Log(Capital intensity) 1054 -2.777 0.789 -4.849 -1.632
Output gap 1133 -0.226 2.966 -15.810 16.868
Overqualification 590 9.150 4.444 0.000 22.763
Underqualification 590 31.661 12.158 10.071 73.794
Macro-economic skills mismatch 521 18.364 5.202 4.307 33.307
Skills shortages 347 7.549 6.558 0.162 36.800
% High-skilled jobs 600 37.264 7.289 16.248 62.834
% Medium-skilled jobs 600 53.243 7.099 30.719 77.477
% Low-skilled jobs 600 9.493 2.534 4.591 18.015
% Tertiary attainment 588 24.522 8.982 5.400 45.900
% Upper secondary attainment 592 46.880 15.638 9.500 76.900
% Lower attainment 592 28.527 16.938 5.200 82.200

53
Table A2.2. Correlation table
Log(Labour productivity) 1,00
Log(Total factor productivity) 0,87 * 1,00
0,00
Log(Capital intensity) 0,89 * 0,89 * 1,00
0,00 0,00
Output gap 0,01 0,07 * -0,07 * 1,00
-0,82 -0,02 -0,02
Overqualification -0,03 -0,01 -0,02 -0,10 * 1,00
-0,45 -0,73 -0,60 -0,02
Underqualification 0,23 * 0,16 * 0,25 * 0,08 * -0,65 * 1,00
0,00 0,00 0,00 -0,04 0,00
Macro-economic skills mismatch -0,46 * -0,40 * -0,46 * -0,05 0,14 * -0,49 * 1,00
0,00 0,00 0,00 -0,30 0,00 0,00
Skills shortages 0,06 0,12 * -0,04 0,55 * 0,13 * -0,25 * -0,07 1,00
-0,29 -0,03 -0,51 0,00 -0,02 0,00 -0,20
% High-skilled jobs 0,62 * 0,68 * 0,57 * -0,05 0,18 * -0,27 * -0,08 0,28 * 1,00
0,00 0,00 0,00 -0,19 0,00 0,00 -0,08 0,00
% Medium-skilled jobs -0,61 * -0,69 * -0,54 * 0,03 -0,31 * 0,24 * 0,12 * -0,25 * -0,94 * 1,00
0,00 0,00 0,00 -0,45 0,00 0,00 -0,01 0,00 0,00
% Low-skilled jobs -0,09 * -0,02 -0,14 * 0,07 0,35 * 0,13 * -0,10 * -0,11 -0,25 * -0,10 * 1,00
-0,03 -0,71 0,00 -0,10 0,00 0,00 -0,02 -0,05 0,00 -0,01
% Tertiary attainment 0,47 * 0,48 * 0,43 * -0,12 * 0,69 * -0,52 * -0,17 * 0,27 * 0,70 * -0,73 * 0,04 1,00
0,00 0,00 0,00 0,00 0,00 0,00 0,00 0,00 0,00 0,00 -0,36
% Upper secondary attainment -0,42 * -0,36 * -0,43 * 0,02 0,09 * -0,68 * 0,46 * 0,09 0,01 0,13 * -0,39 * -0,14 * 1,00
0,00 0,00 0,00 -0,57 -0,04 0,00 0,00 -0,10 -0,89 0,00 0,00 0,00
% Lower attainment 0,16 * 0,10 * 0,18 * 0,04 -0,44 * 0,90 * -0,35 * -0,28 * -0,37 * 0,26 * 0,34 * -0,40 * -0,85 * 1,00
0,00 -0,02 0,00 -0,30 0,00 0,00 0,00 0,00 0,00 0,00 0,00 0,00 0,00
Underquali
fication
Log
(Labour
prod.)
Log (Total
factor
prod.)
Log
(Capital
intensity)
Output gapOverqualifi
cation
% Upper
secondary
att.
% Lower
att.
Macro-
economic
skills
mismatch
Skills
shortages
% High-
skilled jobs
% Medium-
skilled jobs
% Low-
skilled jobs
% Tertiary
att.

Figure A2.1 Trends in labour productivity across the European Union
Note: Labour productivity is expressed as logarithm (GDP in EUR (2010 prices) per hour worked).
3.5
3.6
3.7
3.8
3.9
3.6
3.7
3.8
3.9
4
1.4
1.6
1.8
22
.2
33
.13
.23
.3
22
.53
3.5
3.6
3.7
3.8
3.9
3.8
3.9
44
.14
.2
1.5
22
.53
33
.13
.23
.3
3.4
3.4
53
.53
.55
3.4
3.6
3.8
4
3.6
3.8
4
2.4
2.5
2.6
2.7
2.8
2.4
2.5
2.6
2.7
2.8
33
.54
4.5
3.4
3.5
3.6
3.7
1.5
22
.53
4.1
54
.24
.25
4.3
4.3
5
1.5
22
.53
2.8
2.9
33
.13
.2
3.6
3.7
3.8
3.9
4
22
.22
.42
.6
2.8
2.8
52
.92
.95
3
1.8
22
.22
.4
3.6
3.7
3.8
3.9
4
33
.13
.23
.3
22
.53
3.4
3.6
3.8
4
1990 2000 2010 2020 1990 2000 2010 2020 1990 2000 2010 2020 1990 2000 2010 2020
1990 2000 2010 2020 1990 2000 2010 2020 1990 2000 2010 2020 1990 2000 2010 2020
1990 2000 2010 2020 1990 2000 2010 2020 1990 2000 2010 2020 1990 2000 2010 2020
1990 2000 2010 2020 1990 2000 2010 2020 1990 2000 2010 2020 1990 2000 2010 2020
1990 2000 2010 2020 1990 2000 2010 2020 1990 2000 2010 2020 1990 2000 2010 2020
1990 2000 2010 2020 1990 2000 2010 2020 1990 2000 2010 2020 1990 2000 2010 2020
1990 2000 2010 2020 1990 2000 2010 2020 1990 2000 2010 2020 1990 2000 2010 2020
AT BE BG CY
CZ DE DK EE
EL ES FI FR
HR HU IE IT
LT LU LV MT
NL PL PT RO
SE SI SK UK
Lab
our
pro
ductivity

55
Figure A2.2 Trends in total factor productivity and capital intensity across the European Union
Note: Total factor productivity is expressed as lograrithm. Capital intensity is expressed as logarithm (1000 EUR (2010 prices) per hour worked).
-2.2
-2.1
-2-1
.9-1
.8
-2.2
-2.1
-2-1
.9
-4.8-4
.6-4
.4-4
.2-4
-3.8
-3.2
-3-2
.8-2
.6
-3.4-
3.3-
3.2-3
.1-3
-2.9
-2.4
-2.3
-2.2
-2.1
-2
-2.1
-2-1
.9-1
.8
-4.5
-4-3
.5-3
-2.7
-2.6
-2.5
-2.4
-2.3
-2.6
-2.4
-2.2
-2
-2.3
-2.2
-2.1
-2-1
.9
-2.2
-2.1
-2-1
.9-1
.8
-4-3
.8-3
.6-3
.4-3
.2
-4-3
.8-3
.6-3
.4
-2.4
-2.2
-2-1
.8
-2.4
-2.3
-2.2
-2.1
-4.5
-4-3
.5
-1.9
5-1
.9-1
.85-1
.8-1
.75
-4.8
-4.6
-4.4
-4.2
-3.5
-3.4
-3.3
-3.2
-2.1
5-2.1-
2.0
5-2-
1.9
5-1.9
-4.4-4
.2-4
-3.8-3
.6-3
.4
-3.4
-3.2
-3-2
.8-2
.6
-4.8-
4.6-
4.4-
4.2
-4-3
.8
-2-1
.9-1
.8-1
.7-1
.6
-3.6
-3.4
-3.2
-3
-4-3
.8-3
.6-3
.4
-2.6
-2.5
-2.4
-2.3
-2.2
-7.1
5 -7.1-7
.05
-7
-6.9
5
-6.9
-6.8
5 -6.8
-6.7
5
-8.3
-8.2
-8.1
-8-7
.9
-7.2
5-7
.2-7
.15
-7.1
-7.8
-7.7
-7.6
-7.5
-7.4
-7.1
-7-6
.9-6
.8
-6.8-6
.75 -6
.7-6.6
5 -6.6
-8-7
.5
-7.6
-7.5
-7.4
-7.3
-7.2
-7.1
8-7.1
6-7.1
4-7.1
2
-7.2
-7.1
-7-6
.9-6
.8
-7
-6.9
5 -6.9-6
.85 -6
.8
-7.7
-7.6
-7.5
-7.4
-7.8
-7.7
-7.6
-7.5
-7.4
-7.2
-7-6
.8-6
.6
-7.1
-7.0
5
-7
-8.2
-8-7
.8-7
.6-7
.4
-6.5
5 -6.5-6
.45 -6
.4-6
.35
-8.2
-8-7
.8-7
.6-7
.4
-7.6
-7.5
-7.4
-7.3
-7.2
-6.9
5 -6.9-6
.85 -6
.8-6
.75
-8-7
.9-7
.8-7
.7-7
.6
-7.5
5-7
.5-7
.45
-7.4
-8.4
-8.2
-8-7
.8
-7.2
-7-6
.8
-7.5
-7.4
-7.3
-7.2
-7.8
-7.6
-7.4
-7.2
-7.2
-7.1
-7-6
.9
1990 2000 2010 2020 1990 2000 2010 2020 1990 2000 2010 2020 1990 2000 2010 2020
1990 2000 2010 2020 1990 2000 2010 2020 1990 2000 2010 2020 1990 2000 2010 2020
1990 2000 2010 2020 1990 2000 2010 2020 1990 2000 2010 2020 1990 2000 2010 2020
1990 2000 2010 2020 1990 2000 2010 2020 1990 2000 2010 2020 1990 2000 2010 2020
1990 2000 2010 2020 1990 2000 2010 2020 1990 2000 2010 2020 1990 2000 2010 2020
1990 2000 2010 2020 1990 2000 2010 2020 1990 2000 2010 2020 1990 2000 2010 2020
1990 2000 2010 2020 1990 2000 2010 2020 1990 2000 2010 2020 1990 2000 2010 2020
AT BE BG CY
CZ DE DK EE
EL ES FI FR
HR HU IE IT
LT LU LV MT
NL PL PT RO
SE SI SK UK
Total factor productivity (lhs) Capital intensity (rhs)
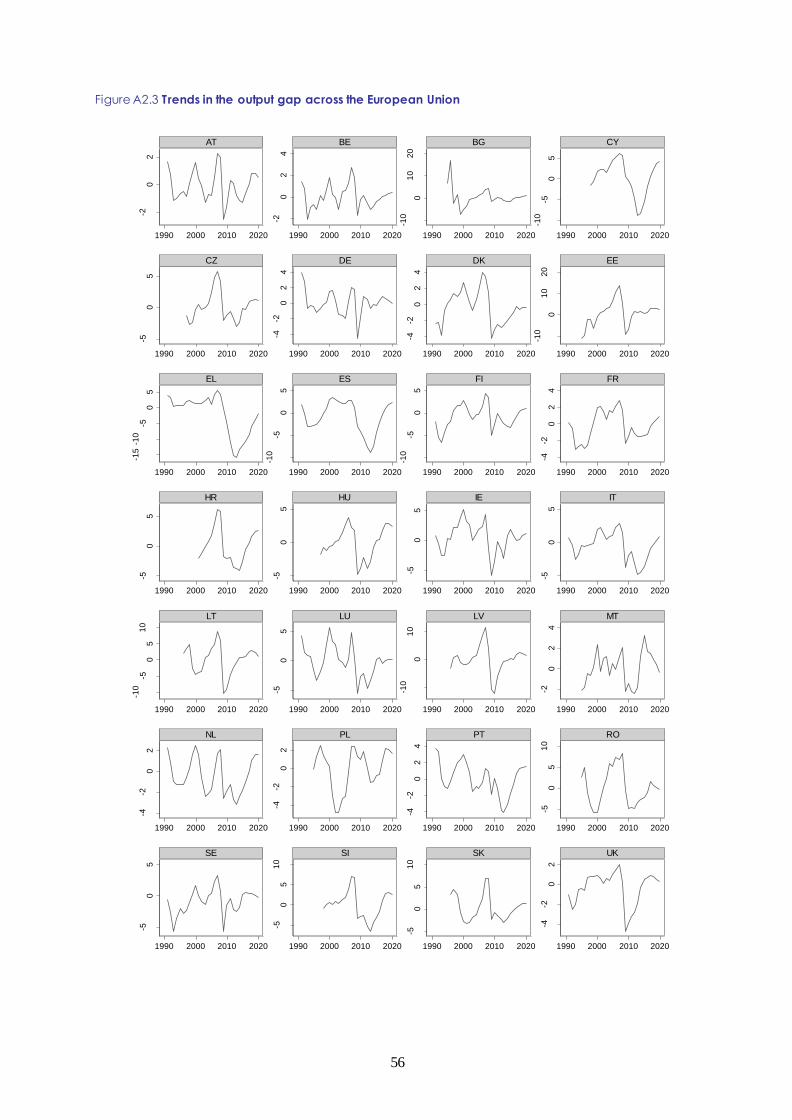
56
Figure A2.3 Trends in the output gap across the European Union
-20
2
-20
24
-10
01
02
0
-10
-50
5
-50
5
-4-2
02
4
-4-2
02
4
-10
01
02
0
-15
-10
-50
5
-10
-50
5
-10
-50
5
-4-2
02
4
-50
5
-50
5
-50
5
-50
5
-10
-50
51
0
-50
5
-10
01
0
-20
24
-4-2
02
-4-2
02
-4-2
02
4
-50
51
0
-50
5
-50
51
0
-50
51
0
-4-2
02
1990 2000 2010 2020 1990 2000 2010 2020 1990 2000 2010 2020 1990 2000 2010 2020
1990 2000 2010 2020 1990 2000 2010 2020 1990 2000 2010 2020 1990 2000 2010 2020
1990 2000 2010 2020 1990 2000 2010 2020 1990 2000 2010 2020 1990 2000 2010 2020
1990 2000 2010 2020 1990 2000 2010 2020 1990 2000 2010 2020 1990 2000 2010 2020
1990 2000 2010 2020 1990 2000 2010 2020 1990 2000 2010 2020 1990 2000 2010 2020
1990 2000 2010 2020 1990 2000 2010 2020 1990 2000 2010 2020 1990 2000 2010 2020
1990 2000 2010 2020 1990 2000 2010 2020 1990 2000 2010 2020 1990 2000 2010 2020
AT BE BG CY
CZ DE DK EE
EL ES FI FR
HR HU IE IT
LT LU LV MT
NL PL PT RO
SE SI SK UK
Outp
ut
gap

57
Figure A2.4 Trends in jobs' skills requirements and tertiary attainment across the European Union
10
15
20
25
30
35
25
30
35
40
18
20
22
24
26
28
25
30
35
40
45
10
15
20
25
22
24
26
28
30
25
30
35
40
30
35
40
15
20
25
30
15
20
25
30
35
20
25
30
35
40
45
15
20
25
30
35
16
18
20
22
24
10
15
20
25
20
25
30
35
40
45
81
01
21
41
61
8
20
25
30
35
40
10
20
30
40
50
15
20
25
30
35
51
01
52
02
5
20
25
30
35
40
10
15
20
25
30
51
01
52
02
5
81
01
21
41
61
8
25
30
35
40
45
15
20
25
30
35
10
15
20
25
20
25
30
35
40
45
30
35
40
45
40
42
44
46
48
28
30
32
34
36
25
30
35
34
36
38
40
42
38
40
42
44
46
35
40
45
50
35
40
45
28
30
32
34
25
30
35
40
42
44
46
48
35
40
45
28
30
32
34
36
30
32
34
36
30
35
40
45
25
30
35
40
30
35
40
45
30
40
50
60
30
35
40
45
30
35
40
45
45
50
25
30
35
40
20
25
30
35
16
18
20
22
24
40
45
50
55
25
30
35
40
45
32
34
36
38
35
40
45
50
1990 2000 2010 2020 1990 2000 2010 2020 1990 2000 2010 2020 1990 2000 2010 2020
1990 2000 2010 2020 1990 2000 2010 2020 1990 2000 2010 2020 1990 2000 2010 2020
1990 2000 2010 2020 1990 2000 2010 2020 1990 2000 2010 2020 1990 2000 2010 2020
1990 2000 2010 2020 1990 2000 2010 2020 1990 2000 2010 2020 1990 2000 2010 2020
1990 2000 2010 2020 1990 2000 2010 2020 1990 2000 2010 2020 1990 2000 2010 2020
1990 2000 2010 2020 1990 2000 2010 2020 1990 2000 2010 2020 1990 2000 2010 2020
1990 2000 2010 2020 1990 2000 2010 2020 1990 2000 2010 2020 1990 2000 2010 2020
AT BE BG CY
CZ DE DK EE
EL ES FI FR
HR HU IE IT
LT LU LV MT
NL PL PT RO
SE SI SK UK
% High-skilled jobs (lhs) Tertiary attainment (rhs)
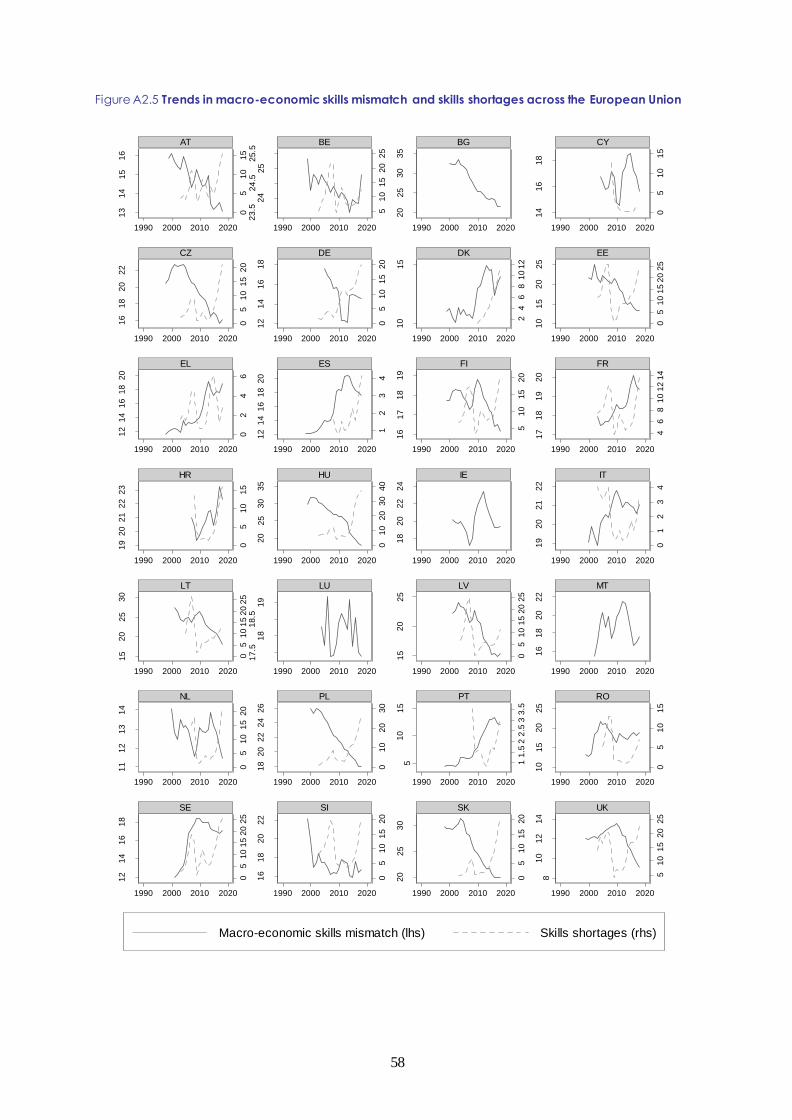
58
Figure A2.5 Trends in macro-economic skills mismatch and skills shortages across the European Union
05
10
15
51
01
52
02
5
05
10
15
05
10
15
20
05
10
15
20
24
68
10
12
05
10
15
20
25
02
46
12
34
51
01
52
0
46
81
01
21
4
05
10
15
01
02
03
04
0
01
23
4
05
10
15
20
25
05
10
15
20
25
05
10
15
20
01
02
03
0
11
.52
2.5
33
.5
05
10
15
05
10
15
20
25
05
10
15
20
05
10
15
20
51
01
52
02
5
13
14
15
16
23
.52
42
4.5
25
25
.5
20
25
30
35
14
16
18
16
18
20
22
12
14
16
18
10
15
10
15
20
25
12
14
16
18
20
12
14
16
18
20
16
17
18
19
17
18
19
20
19
20
21
22
23
20
25
30
35
18
20
22
24
19
20
21
22
15
20
25
30
17
.51
81
8.5
19
15
20
25
16
18
20
22
11
12
13
14
18
20
22
24
26
51
01
5
10
15
20
25
12
14
16
18
16
18
20
22
20
25
30
81
01
21
4
1990 2000 2010 2020 1990 2000 2010 2020 1990 2000 2010 2020 1990 2000 2010 2020
1990 2000 2010 2020 1990 2000 2010 2020 1990 2000 2010 2020 1990 2000 2010 2020
1990 2000 2010 2020 1990 2000 2010 2020 1990 2000 2010 2020 1990 2000 2010 2020
1990 2000 2010 2020 1990 2000 2010 2020 1990 2000 2010 2020 1990 2000 2010 2020
1990 2000 2010 2020 1990 2000 2010 2020 1990 2000 2010 2020 1990 2000 2010 2020
1990 2000 2010 2020 1990 2000 2010 2020 1990 2000 2010 2020 1990 2000 2010 2020
1990 2000 2010 2020 1990 2000 2010 2020 1990 2000 2010 2020 1990 2000 2010 2020
AT BE BG CY
CZ DE DK EE
EL ES FI FR
HR HU IE IT
LT LU LV MT
NL PL PT RO
SE SI SK UK
Macro-economic skills mismatch (lhs) Skills shortages (rhs)

59
Figure A2.6 Trends in overqualification and underqualification across the European Union
25
30
35
40
20
25
30
35
40
10
15
20
25
30
15
20
25
30
35
20
22
24
26
28
30
26
28
30
32
26
28
30
32
34
36
18
19
20
21
22
23
20
30
40
50
60
30
35
40
45
50
55
20
25
30
35
40
25
30
35
40
15
20
25
30
15
20
25
30
35
20
25
30
35
40
45
40
45
50
55
60
10
12
14
16
18
20
25
30
35
40
45
50
15
20
25
30
40
50
60
70
80
30
35
40
45
15
20
25
30
35
50
55
60
65
70
75
20
25
30
35
40
45
26
28
30
32
34
20
25
30
35
40
15
20
25
30
25
30
35
40
45
51
01
5
10
12
14
81
01
21
4
10
15
20
25
56
78
8.5
99
.51
01
0.5
78
91
0
14
16
18
20
51
01
5
51
01
52
0
68
10
12
51
01
5
56
78
9
46
81
0
51
01
52
0
24
68
12
14
16
18
12
34
5
10
12
14
16
02
46
46
81
0
68
10
12
02
46
46
81
0
67
89
24
68
10
78
91
01
1
51
01
5
1990 2000 2010 2020 1990 2000 2010 2020 1990 2000 2010 2020 1990 2000 2010 2020
1990 2000 2010 2020 1990 2000 2010 2020 1990 2000 2010 2020 1990 2000 2010 2020
1990 2000 2010 2020 1990 2000 2010 2020 1990 2000 2010 2020 1990 2000 2010 2020
1990 2000 2010 2020 1990 2000 2010 2020 1990 2000 2010 2020 1990 2000 2010 2020
1990 2000 2010 2020 1990 2000 2010 2020 1990 2000 2010 2020 1990 2000 2010 2020
1990 2000 2010 2020 1990 2000 2010 2020 1990 2000 2010 2020 1990 2000 2010 2020
1990 2000 2010 2020 1990 2000 2010 2020 1990 2000 2010 2020 1990 2000 2010 2020
AT BE BG CY
CZ DE DK EE
EL ES FI FR
HR HU IE IT
LT LU LV MT
NL PL PT RO
SE SI SK UK
Overqualification (lhs) Underqualification (rhs)

60
Additional graphs on macro-economic skills mismatch
Figure A2.7 Fixed-effects correlation between macro-economic skills mismatch and employment in the
construction sector (2000-17)
Figure A2.8 Fixed-effects correlation between macro-economic skills mismatch and employment in
high-skilled occupations (2000-17)
ESES
SKSKES
ES
MT
ES
SKIEBG
ES
IE
PTPT
PT
IE
SE
PT
PL
BG
LT
SE
PT
EE
SK
SE
CY
BGHR
CY
HR
MT
BG
IECY
IE
SE
SK
BG
SE
HR
IT
EE
ELES
FIFIEL
LT
IEHRSE
PTEE
SI
EEEECY
FI
RO
EL
LV
FI
BG
LV
LTLVELLV
IEIEFR
SI
UK
ROEE
RO
MTFISI
EE
RO
LT
EL
DK
HU
NLHRSI
CZ
EL
DK
SI
LT
PL
LV
SE
RO
IT
EL
IT
DK
FR
SIUKDK
HU
PLNL
IEBE
CZ
HU
BECY
LT
SK
LVCYNL
RO
NL
CZ
LVLV
UK
MT
LU
IT
BEFI
RO
DK
PL
BE
ES
HU
FR
UKBEBENLSINL
CZ
CZ
PL
BG
RO
LTLT
LU
DK
BE
RO
UKCZ
SI
DEHU
NL
PL
LVCZ
SK
FRITRO
PL
ELLUHR
UK
FISI
LUAT
LT
PL
CZCZ
CZ
MT
LU
LT
DK
DE
UKNL
DE
SI
LV
DEUK
DKLU
SI
CZ
FR
IT
SE
EE
PL
HUHULUATAT
ITATSIAT
PT
ATUKATAT
DK
PLDEDEIT
DE
CZ
IT
ATITUK
AT
AT
UK
NL
DE
PLLT
DE
CZ
ATLUNLNL
DK
EE
BE
MTSK
DK
ROITNL
DE
EE
LUFRLUDEFIBEFRLU
HU
HU
LT
DE
AT
FRSI
HU
LV
FRRO
MTFRDK
HU
HU
ATBE
DE
PL
UK
CY
MT
IT
EE
HU
BEBE
HU
EE
ES
RO
FRUKBG
LV
MT
LU
BEFRNL
SE
FI
HU
FR
NLDK
FR
DK
LT
BEROMT
BG
MT
BE
UKEL
HU
LU
EL
BE
HU
EE
ROFRFI
UK
EE
LTNL
CZ
IE
ITFIUK
PLPT
EL
ES
MT
PL
FI
LU
BE
BG
LV
EE
ITFIHUFI
FI
IT
CY
LV
IE
ITSK
BG
IT
CZCY
BG
FIBE
SE
SIDK
CZIENL
MTEL
BG
IT
CY
ELSI
ELRO
PT
UKDK
BG
MTPLDK
EE
SK
EL
SKES
PL
CYUK
HR
NL
PTSKPT
DK
NL
ELPT
PL
HR
PT
SE
MT
MTCZ
PT
SK
SE
BG
FIPL
PT
PTELEL
PT
CYFI
LT
IE
SK
SK
SE
CYCZ
PT
SE
ES
LV
SK
ES
SI
SE
SKSI
BG
SK
SE
BGHRHR
SE
HR
CY
ES
IE
SI
LV
ESBG
LV
IE
LT
RO
RO
ES
EE
ES
IE
EE
LT
IE
ES
-10
-50
5
Mac
ro-e
cono
mic
ski
lls m
ism
atch
-4 -2 0 2 4Employment in construction
coef = -1.0448912, se = .09880151, t = -10.58
LU
LU
LU
LU
LU
SK
UK
SK
EE
SK
SK
UK
SK
IT
AT
EL
SE
IT
AT
IT
CY
ITBG
SI
UK
EL
PT
CY
EL
SI
HU
AT
PTSK
AT
LV
HU
PT
FRFR
BG
SE
LV
FI
RO
SI
MT
PT
PTUK
ES
EE
CY
RO
FI
LT
BG
ES
UK
SE
BE
FR
UK
BG
EL
HR
ES
BG
RO
PT
HR
PT
FR
LV
MT
LT
HU
CZ
MT
BEIE
ES
BE
ES
EL
PT
IT
FR
ES
BG
NL
IT
IE
RO
IT
NL
EE
SE
SI
IT
SE
BG
SE
SE
SE
ES
PT
SI
DK
UK
CZ
IT
SI
EE
IT
FI
RO
IT
NL
UK
CZ
BG
HR
CZ
BGBG
BE
DEMT
CZ
PL
BGCZBG
IE
HU
PL
DK
IEFRFI
EL
PL
CY
CZ
FI
AT
IE
NL
UK
HR
LT
DK
CZ
PL
DKLT
DE
BE
EL
DE
MT
LT
LT
EE
IE
NL
BE
MT
LV
AT
SE
PLMT
CZ
CZ
BE
NL
NL
DK
PL
MT
LV
EE
DE
NL
SE
EL
PL
FR
IE
FI
LV
LT
DKEL
LT
LV
IE
PL
NL
PLIE
DE
HU
DE
HR
UK
CZ
PL
CYPLPL
HR
FIAT
DK
DE
PL
FI
FIFI
DK
SE
FRBENL
FI
RO
HU
NL
HU
HU
SI
RO
LV
SI
EE
LV
MT
EL
PT
PT
ATDE
DKIENL
HR
HU
HU
DK
DEAT
EEDK
IE
SK
MT
AT
EESI
ATBE
RO
UK
LT
CZ
CY
IE
DK
EL
HU
DK
ROIECY
PT
LV
HR
PL
CYLV
LV
DK
SK
DECY
LT
ES
IE
BG
BEFI
NL
BE
EERO
RO
RO
BE
CY
HU
FIBE
LT
SKHU
EE
RO
NLDEES
EE
SE
BE
PL
DK
DK
DK
ESDK
LT
BE
EE
FI
HU
SK
RO
ES
LT
DE
LT
BE
SIAT
SI
ES
MT
BG
ES
HU
LT
NL
LT
RO
LV
EE
DE
ESEE
LV
SISI
SI
RO
EECY
MT
ES
MT
LV
HU
RO
LT
BE
CZ
LV
EE
FRAT
IE
NL
FI
ELHR
SE
CZSI
RO
PL
ES
MT
EL
CZSI
HU
CY
FR
HU
PL
SI
ES
FI
FR
PT
FI
FI
LUSINLFR
EE
ES
FR
IELU
SK
SK
HR
MT
AT
FRCZ
AT
IT
CZ
CY
NL
AT
BE
PL
FR
LU
EL
SK
HR
EL
CY
LV
SEMT
AT
SK
CZ
ELELELATUK
PT
UK
UK
UK
SK
IT
SE
SK
SKIE
BG
ITUKSK
LU
LU
UK
PT
LU
UK
IT
IT
PT
PT
PT
IT
LU
SE
BG
IT
SE
LU
BG BG
LU
-6-4
-20
24
Macro
-eco
nom
ic s
kills
mis
matc
h
-10 -5 0 5 10% High-skilled jobs
coef = .20635715, se = .0416681, t = 4.95
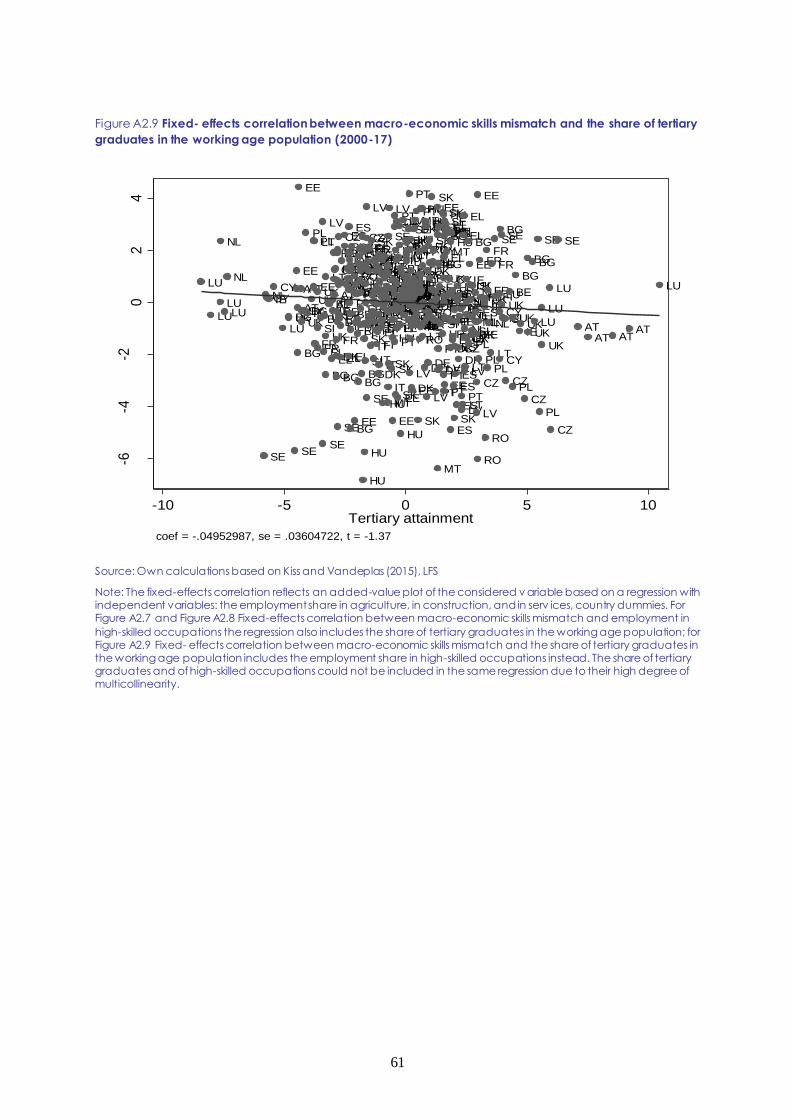
61
Figure A2.9 Fixed- effects correlation between macro-economic skills mismatch and the share of tertiary
graduates in the working age population (2000-17)
Source: Own calculations based on Kiss and Vandeplas (2015), LFS
Note: The fixed-effects correlation reflects an added-value plot of the considered v ariable based on a regression with independent variables: the employment share in agriculture, in construction, and in serv ices, country dummies. For Figure A2.7 and Figure A2.8 Fixed-effects correlation between macro-economic skills mismatch and employment in
high-skilled occupations the regression also includes the share of tertiary graduates in the working age population; for Figure A2.9 Fixed- effects correlation between macro-economic skills mismatch and the share of tertiary graduates in the working age population includes the employment share in high-skilled occupations instead. The share of tertiary graduates and of high-skilled occupations could not be included in the same regression due to their high degree of multicollinearity.
LU
LU
LU
NL
LU
NL
SE
NLCYIECY
LUBGUK
SE
EE
AT
AT
BG
EE
AT
UKCYBG
PL
IE
UK
PL
EE
LT
FRFR
UK
SIBE
LV
SE
EL
UK
BG
LT
UK
BEAT
EL
IEAT
RO
AT
ATCZRO
FR
BG
DK
BE
PL
SE
LV
AT
DK
CZ
MT
DKLT
EL
FI
UK
UK
ESPL
NL
ESIEIE
EL
DE
ES
PT
LV
DEAT
BG
BE
FR
UKSK
CZ
AT
RO
EE
CZPLPT
FI
PL
FI
LT
BG
SILV
CZ
ES
FR
CZ
ESMT
FR
LT
BG
CZ
CZ
HU
SK
HU
PT
SI
BG
SI
EE
PL
CZ
LV
SE
CZ
ES
MTDK
CZ
FI
HR
IT
SK
FIFI
CYRO
IT
PT
EL
ES
IESK
PT
IE
DE
SI
FI
BE
NL
EL
DK
HR
ES
ES
IT
NLSK
LT
SI
SE
DK
SI
FIIE
HU
SE
LTBE
LV
FI
BESEROPL
HRHU
MT
MT
HU
UK
PL
IT
FI
SE
SK
LV
BE
SK
EE
HU
DK
SK
SI
RO
PL
PT
EE
PTSE
SI
LT
SK
FI
HR
HRHU
EL
DK
IT
EE
HU
LT
DKDE
LU
HU
ES
MT
PT
BEDEIE
RO
RO
LV
FRNL
SIHU
ITIT
HR
IE
PL
SKRO
SI
MT
HU
ITPT
SE
CYDEBE
MT
IT
PT
LV
FRITFR
PT
HU
SK
HU
SI
DK
LV
RO
EE
ROIT
EL
DEDE
CYMT
DK
MT
NL
MT
IT
HRIT
PT
ITCY
ELCZ
ELSI
SK
PLMTFR
IT
RO
HR
ITFIRO
NL
PT
LU
IT
LT
BE
EL
HU
HRLT
FI
CY
DE
RO
HUDKSEEE
HR
LV
DK
RO
DE
ROSK
ES
IT
EL
DE
SK
SI
BGELCY
LV
CZ
DE
PL
PT
MTBESK
EE
MT
DK
PT
DE
BG
EE
FI
LV
SI
SK
HR
PT
UK
BE
HU
BE
PT
EL
BG
EE
EE
SEMTLT
MT
EL
BE
BGHU
CY
BE
CY
IE
ES
HU
DK
EL
FR
LTEE
ES
SK
ES
SKLV
ES
IE
ES
LU
ES
CZ
FI
DK
NLBE
PT
LV
NL
LT
EL
EL
LV
NLCY
LT
IEDK
IE
NL
NL
PL
BG
EE
UK
LT
LU
SIDK
SINL
ESNLEE
LV
CZ
EE
RO
PL
NL
FR
FIFIIEUK
RO
FR
PL
FR
NL
LT
FR
SE
FILU
CY
CY
BGSE
UK
IESI
CZ
BE
PL
UK
BG
IEUK
CZ
BG
UK
BG
LU
SE
PL
LU
UK
LU
CZ
SE
ATAT AT
AT
LU
-6-4
-20
24
Macro
-eco
nom
ic s
kills
mis
matc
h
-10 -5 0 5 10Tertiary attainment
coef = -.04952987, se = .03604722, t = -1.37

62
Figure A2.10 Broad trends in macro-economic skills mismatch for EU-13 and EU-15 countries
Macro-economic skills mismatch reflects weaknesses in labour resource utilisation. This is reflected in
the figures below through a negative correlation (in cross-country comparison) between macro-
economic skills mismatch and the aggregate employment rate, and a positive one between macro-
economic skills mismatch and the cyclically adjusted unemployment rate measured as the non-
accelerating wage rate of unemployment (NAWRU) (Havik et al. 2014).
Figure A2.11 Linear fit between macro-economic
skills mismatch and aggregate employment rate,
all Member States (2017)
Figure A2.12 Linear fit between macro-economic
skills mismatch and aggregate employment rate,
excl. ES, PT, EL (2017)
Note: R² adj of linear regression= 0.40 Note: R² adj of linear regression= 0.62
15
20
25
30
35
2000 2005 2010 2015 2000 2005 2010 2015
EU-13 EU-15
Based on employment Based on unemployment
Macro
-econom
ic s
kills
mis
matc
h
year
Graphs by OLDMS
AT
BE
BG
CY
CZ
DE
DKEE
ELES
FI
FR
HR
HU
IE
IT
LT
LU
LV
MT
NL
PL
PT
RO
SESI
SK
UK
10
15
20
25
Macro
-econom
ic s
kills
mis
matc
h
50 55 60 65 70 75 80Aggregate employment rate
AT
BE
BG
CY
CZ
DE
DKEE
FI
FR
HR
HU
IE
IT
LT
LU
LV
MT
NL
PLRO
SESI
SK
UK
10
15
20
25
Macro
-econom
ic s
kills
mis
matc
h
55 60 65 70 75 80Aggregate employment rate
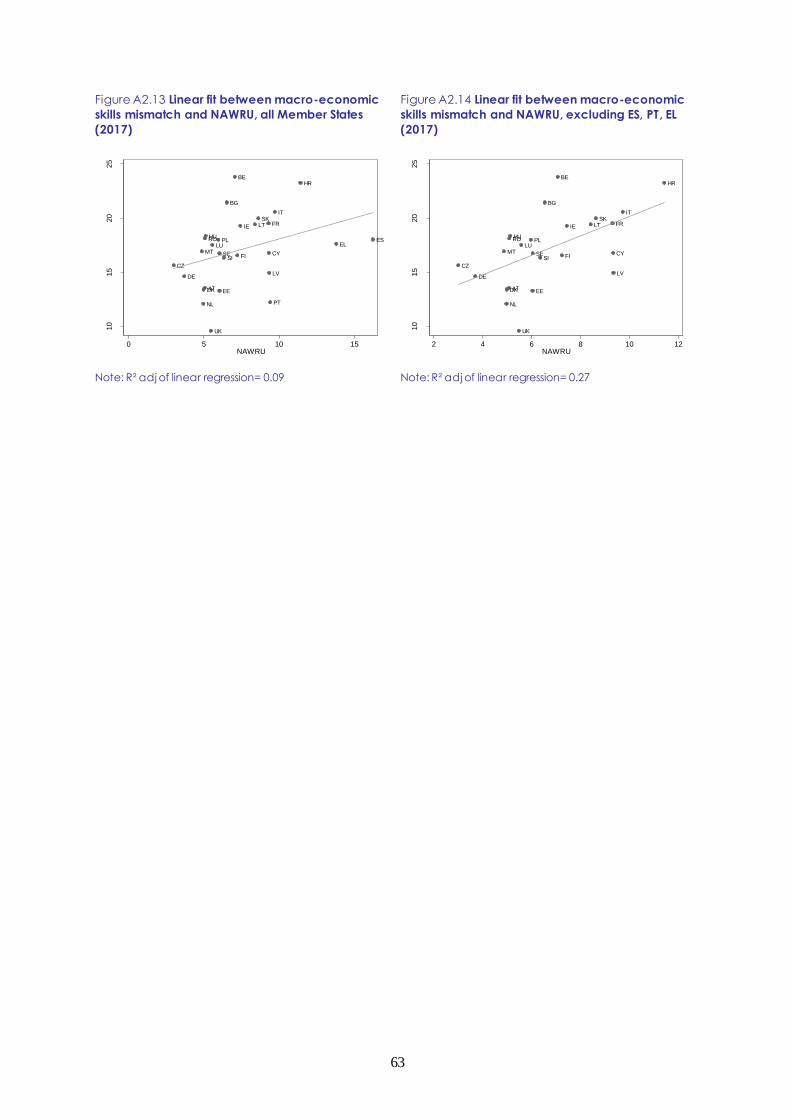
63
Figure A2.13 Linear fit between macro-economic
skills mismatch and NAWRU, all Member States
(2017)
Figure A2.14 Linear fit between macro-economic
skills mismatch and NAWRU, excluding ES, PT, EL
(2017)
Note: R² adj of linear regression= 0.09 Note: R² adj of linear regression= 0.27
AT
BE
BG
CY
CZ
DE
DK EE
ELES
FI
FR
HR
HU
IE
IT
LT
LU
LV
MT
NL
PL
PT
RO
SESI
SK
UK
10
15
20
25
Macro
-econom
ic s
kills
mis
matc
h
0 5 10 15NAWRU
AT
BE
BG
CY
CZ
DE
DK EE
FI
FR
HR
HU
IE
IT
LT
LU
LV
MT
NL
PLRO
SESI
SK
UK
10
15
20
25
Macro
-econom
ic s
kills
mis
matc
h
2 4 6 8 10 12NAWRU

64
Additional graphs on skills shortages
Figure A2.15 Linear fit between composite
measure of skills shortages and unemployment
among low-qualified individuals (2017)
Figure A2.16 Linear fit between composite
measure of skills shortages and unemployment
among medium-qualified individuals (2017)
Note: R² adj of linear regression ± 0
Note: R² adj of linear regression = 0.43
Figure A2.17 Linear fit between composite
measure of skills shortages and unemployment
among high-qualified individuals (2017)
Figure A2.18 Linear fit between composite
measure of skills shortages and the NAWRU
(2017)
Note: R² adj of linear regression = 0.50 Note: R² adj of linear regression = 0.37 Source: Own calculations based on European Business Survey and AMECO
AT
BE
CY
CZ
DE
DK
EE
ES
FI
FR
HR
IT
LT
LV
NL
PL
PT
SE
SI
SK
UK
05
10
15
20
25
Skills
short
ages
5 10 15 20 25 30 35Unemployment of low-qualified individuals
AT
BE
CY
CZ
DE
DK
EE
ES
FI
FR
HR
IT
LT
LV
NL
PL
PT
SE
SI
SK
UK
05
10
15
20
25
Skills
short
ages
0 5 10 15 20Unemployment of medium-qualified individuals
AT
BE
CY
CZ
DE
DK
EE
ES
FI
FR
HR
IT
LT
LV
NL
PL
PT
SE
SI
SK
UK
05
10
15
20
25
Skills
short
ages
2 4 6 8 10Unemployment of high-qualified individuals
AT
BE
CY
CZ
DE
DK
EE
ES
FI
FR
HR
IT
LT
LV
NL
PL
PT
SE
SI
SK
UK
05
10
15
20
25
Skills
short
ages
0 5 10 15NAWRU

65
Additional graphs on on-the-job mismatch
Figure A2.19 Cross-country correlation between tertiary attainment and overqualification (2017)
Note: "High" tertiary attainment is defined as exceeding a share of 30% of the population in age group 25-64. Source: EC own elaborations based on EUROSTAT-LFS data
Figure A2.20 Linear fit between overqualification and underqualification (2017)
Source: Own calculations based on Eurostat-LFS data Note: R² adj. = 0.23
AT
BE
BG
CY
CZ
DE
DK EE
EL
ES
FI
FR
HRHU
IE
IT
LTLU
LV
MT
NL
PL
PT
RO
SE
SI
SK
UK
AT
BE
CY
DK EE
EL
ES
FI
FR
IE
LTLU
LV
NL
SE
SI
UK
20
30
40
50
Tert
iary
attain
ment
5 10 15 20 25% Overqualified workers
Low tert. att. High tert. att.
all MS included only MS with high tert. att
ATBEBG
CY
CZ
DEDK
EE EL
ES
FI
FR
HRHU
IE
IT
LT
LU
LV
MT
NL
PL
PT
RO SESI
SK
UK
510
15
20
25
Overq
ualif
ication
10 20 30 40 50Underqualification

66
Figure A2.21 Linear fit between underqualification
and ISCO after controlling for ISCED (2017)
Figure A2.22 Linear fit between underqualification
and ISCED after controlling for ISCO (2017)
Figure A2.23 Linear fit between overqualification
and ISCO after controlling for ISCED (2017)
Figure A2.24 Linear fit between overqualification
and ISCED after controlling for ISCO (2017)
CY
ES
EL
RO
BG
IE
LT SK
HU
FI
PL
LV
EE
PT
AT
HR
UKDK
BE
CZ
SI
FR
NL
IT
SE
DE
MT
LU
-10
010
20
Underq
ualif
ication
-10 -5 0 5 10 15% High-skilled jobs
coef = .62488042, se = .27821557, t = 2.25
IT
MT
DE
CZ
LU
HR
PT
HU
SK
RO
SI
PL
FR
AT
NL
LV
SEDK
BG
BE
EE
UKEL
FI
LT
ES
IE
CY
-10
010
20
30
Underq
ualif
ication
-10 -5 0 5 10 15Tertiary attainment
coef = -.68368019, se = .25672068, t = -2.66
CY
ES
EL
RO
BG IE LT
SK
HU
FI
PL
LV
EE
PT
AT
HRUK
DK
BE
CZSI
FR
NL
IT
SE
DE
MT
LU
-10
-50
510
Overq
ualif
ication
-10 -5 0 5 10 15% High-skilled jobs
coef = -.53896913, se = .07631833, t = -7.06
IT
MT
DE
CZ
LU
HR
PT
HU
SK
RO
SI
PL
FRAT
NL
LV
SEDK
BG
BEEE
UK
EL
FI
LTES
IE
CY
-50
510
Overq
ualif
ication
-10 -5 0 5 10 15Tertiary attainment
coef = .63152549, se = .07042199, t = 8.97

67
Figure A2.25 Linear fit between underqualification
and employment rates of low-qualified (2017)
Figure A2.26 Linear fit between underqualification
and unemployment rates of low-qualified (2017)
Note: R² adj of linear regression= 0.57 Note: R² adj of linear regression= 0.12
Figure A2.27 Linear fit between overqualification and the difference (in percentage-points) between
unemployment rates for medium and for high-qualified individuals (2017)
Note: R² adj of linear regression= 0.20. Source: Eurostat, based on LFS
AT
BE
BGCY
CZ
DEDK
EE
EL
ES
FI
FR
HR HUIE
IT
LT
LU
LV
MT
NL
PL
PT
RO
SE
SI
SK
UK
10
20
30
40
50
Underq
ualif
ication
20 30 40 50 60Employment rate low-qualified
AT
BE
BGCY
CZ
DEDK
EE
EL
ES
FI
FR
HRHU IE
IT
LT
LU
LV
MT
NL
PL
PT
RO
SE
SI
SK
UK
10
20
30
40
50
Underq
ualif
ication
5 10 15 20 25 30Unemployment rate low-qualified
AT BEBG
CY
CZ
DEDK
EE EL
ES
FI
FR
HRHU
IE
IT
LT
LU
LV
MT
NL
PL
PT
ROSESI
SK
UK
510
15
20
25
Overq
ualif
ication
0 2 4 6 8Difference (ppt) in unemployment rates between medium and high-qualified

68
ANNEX III: THEORITICAL APPROACHES TO MODELLING THE RELATIONSHIP BETWEEN SKILLS MISMATCH AND PRODUCTIVITY
The literature has proposed several approaches that integrate human capital in production functions for growth accounting, or as a basis for the development of more structural models. These approaches typically start out from a simple Cobb-Douglas production function framework:
𝑌𝑖𝑡 = 𝐴𝑖𝑡𝐾𝑖𝑡𝛼𝐿𝑖𝑡
(1−𝛼) (1)
with 𝑌𝑖𝑡 ,𝐾𝑖𝑡 , 𝐿𝑖𝑡 and 𝐴𝑖𝑡 denoting respectively GDP, the capital stock, hours worked and total factor productivity (TFP) in country 𝑖 and time 𝑡. 𝛼 denotes the factor elasticity of capital. If both sides of the
equation are multiplied by 𝐿𝑖𝑡−1, we obtain
(𝑌
𝐿)
𝑖𝑡= 𝐴𝑖𝑡 (
𝐾
𝐿)
𝑖𝑡
𝛼
(2)
or, in logs:
ln 𝑦𝑖𝑡 = ln 𝐴𝑖𝑡 + 𝛼 ln 𝑘𝑖𝑡 (3)
implying that labour productivity (𝑦 = Y/L) is a function of TFP65
(𝐴𝑖𝑡) and capital intensity (k = K/L). Human capital has been integrated in these equations in several ways, including by considering it as a labour-augmenting factor in the following way:
𝑌𝑖𝑡 = 𝐴𝑖𝑡𝐾𝑖𝑡𝛼(𝐻𝑖𝑡𝐿𝑖𝑡)(1−𝛼) such that ln 𝑦𝑖𝑡 = ln 𝐴𝑖𝑡 + (1 − 𝛼) ln 𝐻𝑖𝑡 + 𝛼 ln 𝑘𝑖𝑡 (4)
where 𝐻𝑖𝑡 denotes human capital, or as a separate production factor (next to capital and labour):66
𝑌𝑖𝑡 = 𝐴𝑖𝑡𝐾𝑖𝑡𝛼𝐻𝑖𝑡
𝛽𝐿𝑖𝑡
(1−𝛼−𝛽) such that ln 𝑦𝑖𝑡 = ln 𝐴𝑖𝑡 + 𝛽 ln ℎ𝑖𝑡 + 𝛼 ln 𝑘𝑖𝑡 (5)
where ℎ𝑖𝑡 = 𝐻𝑖𝑡/𝐿 is a measure of skills intensity. In both of these cases, human capital accumulation has a direct positive relationship with labour productivity as well as an indirect positive relationship through its complementary with physical capital accumulation. Using more generalised versions of the production function such as a constant elasticity of substitution (CES) specification allows assuming even stronger complementarities between human and physical capital accumulation (see e.g. Duffy et
al., 2004). TFP – denoted by 𝐴𝑖𝑡 – is assumed to be exogenous, in the sense of not being affected by human capital accumulation.
Alternatively, human capital can also enter more simply as a determinant of total factor productivity (or TFP growth – as in De La Fuente (2011) and in Benhabib and Spiegel (1994)
67), in which case the
complementarity between human and physical capital accumulation becomes less explicit.
Skills mismatch could be incorporated in these models as a factor correcting human capital (upwards or downwards, depending on the type of mismatch and the measure of human capital), for instance as follows (based on equation (5) above):
𝑌𝑖𝑡 = 𝐴𝑖𝑡𝐾𝑖𝑡𝛼(𝑆𝐻)𝑖𝑡
𝛽(𝐿𝑖𝑡)1−𝛼−𝛽 (6)
resulting in labour productivity
65 Total factor productivity measures the efficiency of all inputs used in the economy by capturing the growth contribution of
disembodied65 technological change (stemming e.g. from general knowledge, spillovers or organisational structures (OECD 2001)). It is harder to measure than labour productivity and as it is typically measured as a residual of a production funct ion
estimate it includes measurement errors. The choice of the productivity measure to be used depends on the purpose of the
analysis and on data availability.
66 See e.g. Mankiw et al. (1992) or De La Fuente (2011)
67 Note that the equations below represent a simplified and at the same time slightly extended version of Benhabib and
Spiegel's (1994) model.
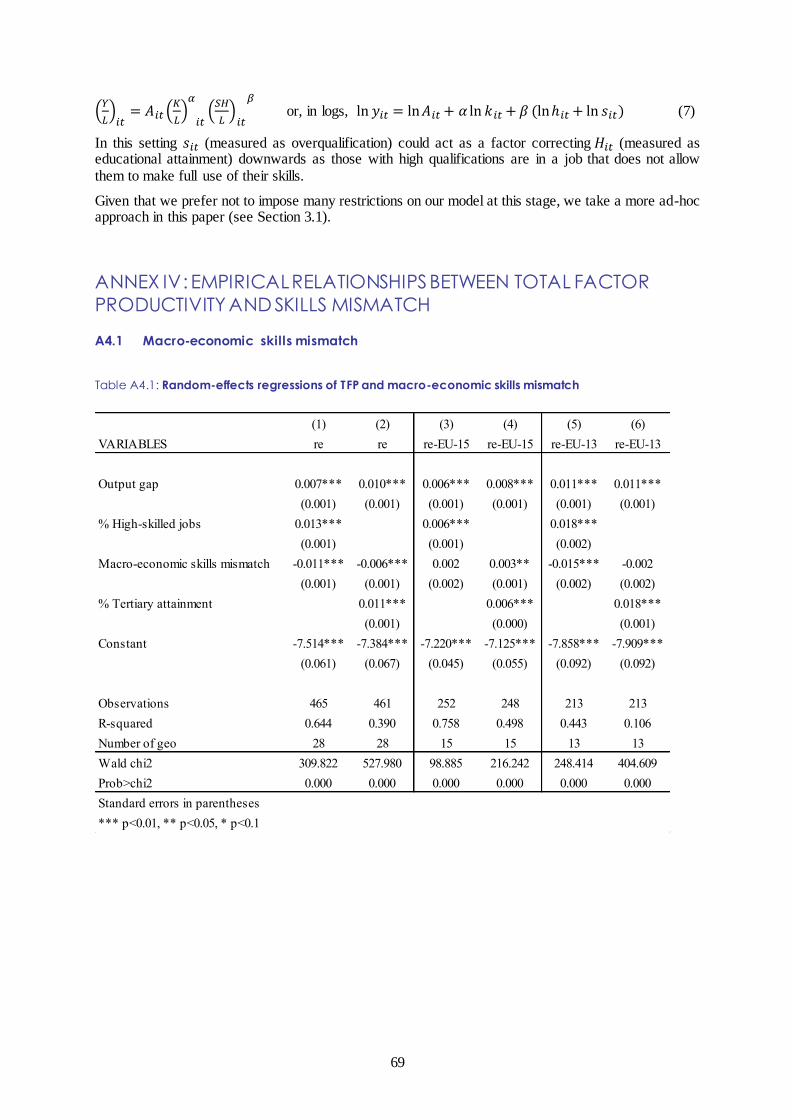
69
(𝑌
𝐿)
𝑖𝑡= 𝐴𝑖𝑡 (
𝐾
𝐿)
𝛼
𝑖𝑡(
𝑆𝐻
𝐿)
𝑖𝑡
𝛽
or, in logs, ln 𝑦𝑖𝑡 = ln 𝐴𝑖𝑡 + 𝛼 ln 𝑘𝑖𝑡 + 𝛽 (ln ℎ𝑖𝑡 + ln 𝑠𝑖𝑡) (7)
In this setting 𝑠𝑖𝑡 (measured as overqualification) could act as a factor correcting 𝐻𝑖𝑡 (measured as educational attainment) downwards as those with high qualifications are in a job that does not allow them to make full use of their skills.
Given that we prefer not to impose many restrictions on our model at this stage, we take a more ad-hoc approach in this paper (see Section 3.1).
ANNEX IV: EMPIRICAL RELATIONSHIPS BETWEEN TOTAL FACTOR
PRODUCTIVITY AND SKILLS MISMATCH
A4.1 Macro-economic skills mismatch
Table A4.1: Random-effects regressions of TFP and macro-economic skills mismatch
(1) (2) (3) (4) (5) (6)
VARIABLES re re re-EU-15 re-EU-15 re-EU-13 re-EU-13
Output gap 0.007*** 0.010*** 0.006*** 0.008*** 0.011*** 0.011***
(0.001) (0.001) (0.001) (0.001) (0.001) (0.001)
% High-skilled jobs 0.013*** 0.006*** 0.018***
(0.001) (0.001) (0.002)
Macro-economic skills mismatch -0.011*** -0.006*** 0.002 0.003** -0.015*** -0.002
(0.001) (0.001) (0.002) (0.001) (0.002) (0.002)
% Tertiary attainment 0.011*** 0.006*** 0.018***
(0.001) (0.000) (0.001)
Constant -7.514*** -7.384*** -7.220*** -7.125*** -7.858*** -7.909***
(0.061) (0.067) (0.045) (0.055) (0.092) (0.092)
Observations 465 461 252 248 213 213
R-squared 0.644 0.390 0.758 0.498 0.443 0.106
Number of geo 28 28 15 15 13 13
Wald chi2 309.822 527.980 98.885 216.242 248.414 404.609
Prob>chi2 0.000 0.000 0.000 0.000 0.000 0.000
Standard errors in parentheses
*** p<0.01, ** p<0.05, * p<0.1

70
Table A4.1: Fixed-effects regressions of TFP and macro-economic skills mismatch
A4.2 Skills shortages
Table A4.2: Random-effects regressions of TFP and skills shortages
(1) (2) (3) (4) (5) (6)
VARIABLES fe fe fe-EU-15 fe-EU-15 fe-EU-13 fe-EU-13
Output gap 0.007*** 0.010*** 0.005*** 0.008*** 0.011*** 0.011***
(0.001) (0.001) (0.001) (0.001) (0.001) (0.001)
% High-skilled jobs 0.013*** 0.005*** 0.018***
(0.001) (0.001) (0.002)
Macro-economic skills mismatch -0.011*** -0.006*** 0.002 0.003** -0.015*** -0.001
(0.001) (0.001) (0.002) (0.001) (0.002) (0.002)
% Tertiary attainment 0.011*** 0.006*** 0.018***
(0.001) (0.000) (0.001)
Constant -7.501*** -7.396*** -7.196*** -7.138*** -7.863*** -7.927***
(0.042) (0.027) (0.032) (0.021) (0.080) (0.062)
Observations 465 461 252 248 213 213
R-squared 0.405 0.549 0.282 0.484 0.552 0.674
Number of geo 28 28 15 15 13 13
Standard errors in parentheses
*** p<0.01, ** p<0.05, * p<0.1
(1) (2) (3) (4) (5) (6)
VARIABLES re re re-EU-15 re-EU-15 re-EU-13 re-EU-13
Output gap 0.004*** 0.007*** 0.006*** 0.008*** 0.002 0.006***
(0.001) (0.001) (0.000) (0.000) (0.002) (0.001)
% High-skilled jobs 0.008*** 0.005*** 0.009***
(0.001) (0.001) (0.002)
Skills shortages 0.002*** -0.000 0.001*** 0.000 0.003** 0.001
(0.001) (0.001) (0.000) (0.000) (0.001) (0.001)
% Tertiary attainment 0.008*** 0.004*** 0.013***
(0.001) (0.000) (0.001)
Constant -7.524*** -7.426*** -7.182*** -7.070*** -7.859*** -7.811***
(0.059) (0.065) (0.041) (0.042) (0.088) (0.059)
Observations 300 299 161 160 139 139
R-squared 0.396 0.225 0.649 0.439 0.170 0.113
Number of geo 24 24 13 13 11 11
Wald chi2 106.594 310.487 326.365 422.048 32.578 254.872
Prob>chi2 0.000 0.000 0.000 0.000 0.000 0.000
Standard errors in parentheses
*** p<0.01, ** p<0.05, * p<0.1

71
Table A4.3: Fixed-effects regressions of TFP and skills shortages
A4.3. Measures of on-the-job skilss mismatch
Table A4.4: Random-effects regressions of TFP and on-the-job skills mismatch
(1) (2) (3) (4) (5) (6)
VARIABLES fe fe fe-EU-15 fe-EU-15 fe-EU-13 fe-EU-13
Output gap 0.004*** 0.007*** 0.006*** 0.008*** 0.002 0.006***
(0.001) (0.001) (0.000) (0.000) (0.002) (0.001)
% High-skilled jobs 0.007*** 0.005*** 0.009***
(0.001) (0.001) (0.002)
Skills shortages 0.002*** 0.000 0.001*** 0.000 0.003*** 0.001
(0.001) (0.001) (0.000) (0.000) (0.001) (0.001)
% Tertiary attainment 0.008*** 0.004*** 0.013***
(0.001) (0.000) (0.001)
Constant -7.497*** -7.428*** -7.171*** -7.068*** -7.846*** -7.812***
(0.040) (0.015) (0.023) (0.010) (0.080) (0.021)
Observations 300 299 161 160 139 139
R-squared 0.283 0.531 0.722 0.762 0.202 0.670
Number of geo 24 24 13 13 11 11
Standard errors in parentheses
*** p<0.01, ** p<0.05, * p<0.1
(1) (2) (3) (4) (5) (6) (7)
VARIABLES re re re re re re re
Overqualification 0.016*** -0.001 0.002 -0.006*
(0.002) (0.002) (0.003) (0.003)
Underqualification -0.008*** -0.002** -0.007*** -0.003***
(0.001) (0.001) (0.001) (0.001)
Output gap 0.011*** 0.011*** 0.011*** 0.011*** 0.011*** 0.011*** 0.011***
(0.001) (0.001) (0.001) (0.001) (0.001) (0.001) (0.001)
% High-skilled jobs 0.009*** 0.007*** 0.007***
(0.001) (0.001) (0.001)
Tertiary attainment 0.012*** 0.010*** 0.011*** 0.012***
(0.001) (0.001) (0.001) (0.001)
Constant -7.708*** -7.517*** -7.238*** -7.387*** -7.269*** -7.328*** -7.521***
(0.063) (0.059) (0.073) (0.081) (0.089) (0.085) (0.070)
Observations 560 554 560 554 560 554 558
R-squared 0.183 0.257 0.028 0.128 0.031 0.146 0.238
Number of geo 28 28 28 28 28 28 28
Wald chi2 385.781 541.428 450.714 554.327 449.216 554.611 579.835
Prob>chi2 0.000 0.000 0.000 0.000 0.000 0.000 0.000
Standard errors in parentheses
*** p<0.01, ** p<0.05, * p<0.1

72
Table A4.5: Fixed-effects regressions of TFP and on-the-job skills mismatch
(1) (2) (3) (4) (5) (6) (7)
VARIABLES fe fe fe fe fe fe fe
Overqualification 0.017*** -0.000 0.001 -0.005*
(0.002) (0.002) (0.003) (0.003)
Underqualification -0.008*** -0.003*** -0.008*** -0.004***
(0.001) (0.001) (0.001) (0.001)
Output gap 0.011*** 0.011*** 0.011*** 0.011*** 0.011*** 0.011*** 0.011***
(0.001) (0.001) (0.001) (0.001) (0.001) (0.001) (0.001)
% High-skilled jobs 0.008*** 0.005*** 0.005***
(0.001) (0.001) (0.001)
Tertiary attainment 0.012*** 0.009*** 0.010*** 0.012***
(0.001) (0.001) (0.001) (0.001)
Constant -7.673*** -7.497*** -7.147*** -7.322*** -7.159*** -7.258*** -7.499***
(0.031) (0.013) (0.054) (0.056) (0.073) (0.065) (0.013)
Observations 560 554 560 554 560 554 558
R-squared 0.426 0.511 0.483 0.520 0.483 0.524 0.521
Number of geo 28 28 28 28 28 28 28
Standard errors in parentheses
*** p<0.01, ** p<0.05, * p<0.1

73
ANNEX V: EMPIRICAL RELATIONSHIPS BETWEEN CAPITAL INTENSITY AND SKILLS MISMATCH
A5.1 Macro-economic skills mismatch
Table A4.6: Random-effects regressions of capital intensity and macro-economic skills mismatch
Table A4.7: Fixed-effects regressions of capital intensity and macro-economic skills mismatch
(1) (2) (3) (4) (5) (6)
VARIABLES re re re-EU-15 re-EU-15 re-EU-13 re-EU-13
Output gap -0.013*** -0.008*** -0.013*** -0.006*** -0.005** -0.006***
(0.002) (0.001) (0.002) (0.001) (0.002) (0.002)
% High-skilled jobs 0.031*** 0.014*** 0.044***
(0.002) (0.001) (0.003)
Macro-economic skills mismatch -0.022*** -0.011*** 0.012*** 0.014*** -0.028*** -0.005
(0.002) (0.002) (0.003) (0.002) (0.003) (0.004)
% Tertiary attainment 0.023*** 0.013*** 0.034***
(0.001) (0.001) (0.002)
Constant -3.595*** -3.196*** -2.874*** -2.696*** -4.559*** -4.286***
(0.134) (0.140) (0.071) (0.068) (0.191) (0.196)
Observations 493 489 267 263 226 226
R-squared 0.533 0.335 0.646 0.489 0.349 0.094
Number of geo 28 28 15 15 13 13
Wald chi2 557.230 727.363 456.422 1128.614 471.314 432.642
Prob>chi2 0.000 0.000 0.000 0.000 0.000 0.000
Standard errors in parentheses
*** p<0.01, ** p<0.05, * p<0.1
(1) (2) (3) (4) (5) (6)
VARIABLES fe fe fe-EU-15 fe-EU-15 fe-EU-13 fe-EU-13
Output gap -0.013*** -0.008*** -0.013*** -0.007*** -0.005** -0.006***
(0.002) (0.001) (0.001) (0.001) (0.002) (0.002)
% High-skilled jobs 0.031*** 0.013*** 0.044***
(0.002) (0.001) (0.003)
Macro-economic skills mismatch -0.022*** -0.011*** 0.012*** 0.013*** -0.028*** -0.004
(0.002) (0.002) (0.003) (0.002) (0.003) (0.004)
% Tertiary attainment 0.023*** 0.013*** 0.035***
(0.001) (0.001) (0.002)
Constant -3.589*** -3.213*** -2.854*** -2.711*** -4.578*** -4.311***
(0.076) (0.052) (0.055) (0.030) (0.131) (0.121)
Observations 493 489 267 263 226 226
R-squared 0.544 0.614 0.642 0.820 0.688 0.673
Number of geo 28 28 15 15 13 13
Standard errors in parentheses
*** p<0.01, ** p<0.05, * p<0.1

74
A5.2 Skills shortages 68
Table A4.8: Random-effects regressions of capital intensity and skills shortages
Table A4.9: Fixed-effects regressions of capital intensity and skills shortages
68 Data are missing for IE and LU (in EU-15) and BG and MT (in EU-13)
(1) (2) (3) (4) (5) (6)
VARIABLES re re re-EU-15 re-EU-15 re-EU-13 re-EU-13
Output gap -0.018*** -0.011*** -0.014*** -0.010*** -0.018*** -0.011***
(0.002) (0.002) (0.001) (0.001) (0.003) (0.003)
% High-skilled jobs 0.023*** 0.009*** 0.039***
(0.002) (0.001) (0.004)
Skills shortages 0.005*** 0.000 0.003*** 0.001* 0.007*** 0.000
(0.001) (0.001) (0.001) (0.000) (0.002) (0.002)
% Tertiary attainment 0.018*** 0.009*** 0.028***
(0.001) (0.001) (0.002)
Constant -3.665*** -3.248*** -2.497*** -2.360*** -4.985*** -4.217***
(0.141) (0.158) (0.072) (0.071) (0.211) (0.173)
Observations 323 322 174 173 149 149
R-squared 0.322 0.179 0.334 0.130 0.133 0.101
Number of geo 24 24 13 13 11 11
Wald chi2 281.622 445.349 335.309 849.113 189.507 309.230
Prob>chi2 0.000 0.000 0.000 0.000 0.000 0.000
Standard errors in parentheses
*** p<0.01, ** p<0.05, * p<0.1
(1) (2) (3) (4) (5) (6)
VARIABLES fe fe fe-EU-15 fe-EU-15 fe-EU-13 fe-EU-13
Output gap -0.018*** -0.011*** -0.014*** -0.010*** -0.018*** -0.011***
(0.002) (0.002) (0.001) (0.001) (0.003) (0.003)
% High-skilled jobs 0.022*** 0.009*** 0.040***
(0.002) (0.001) (0.004)
Skills shortages 0.005*** 0.000 0.003*** 0.001* 0.007*** 0.000
(0.001) (0.001) (0.001) (0.000) (0.002) (0.002)
% Tertiary attainment 0.018*** 0.008*** 0.028***
(0.001) (0.001) (0.002)
Constant -3.647*** -3.247*** -2.476*** -2.349*** -5.019*** -4.222***
(0.081) (0.032) (0.043) (0.014) (0.150) (0.050)
Observations 323 322 174 173 149 149
R-squared 0.495 0.600 0.684 0.845 0.583 0.693
Number of geo 24 24 13 13 11 11
Standard errors in parentheses
*** p<0.01, ** p<0.05, * p<0.1

75
A5.3 Measures of on-the-job skills mismatch
Table A4.10: Random-effects regressions of capital intensity and on-the-job skills mismatch
Table A4.11: Fixed-effects regressions of capital intensity and on-the-job skills mismatch
(1) (2) (3) (4) (5) (6) (7)
VARIABLES re re re re re re re
Overqualification 0.033*** 0.011** 0.016*** 0.008
(0.003) (0.004) (0.005) (0.005)
Underqualification -0.013*** -0.004** -0.008*** -0.002
(0.001) (0.002) (0.002) (0.002)
Output gap -0.004*** -0.005*** -0.004*** -0.005*** -0.004** -0.005*** -0.006***
(0.002) (0.002) (0.002) (0.002) (0.002) (0.002) (0.002)
% High-skilled jobs 0.017*** 0.015*** 0.015***
(0.002) (0.002) (0.002)
Tertiary attainment 0.019*** 0.019*** 0.018*** 0.022***
(0.002) (0.002) (0.002) (0.001)
Constant -3.788*** -3.401*** -2.982*** -3.183*** -3.284*** -3.282*** -3.376***
(0.143) (0.134) (0.152) (0.158) (0.176) (0.167) (0.152)
Observations 588 582 588 582 588 582 586
R-squared 0.109 0.122 0.010 0.094 0.027 0.092 0.182
Number of geo 28 28 28 28 28 28 28
Wald chi2 565.571 700.657 566.444 690.329 583.689 690.882 688.948
Prob>chi2 0.000 0.000 0.000 0.000 0.000 0.000 0.000
Standard errors in parentheses
*** p<0.01, ** p<0.05, * p<0.1
(1) (2) (3) (4) (5) (6) (7)
VARIABLES fe fe fe fe fe fe fe
Overqualification 0.034*** 0.012*** 0.015*** 0.008
(0.003) (0.004) (0.005) (0.005)
Underqualification -0.014*** -0.005*** -0.010*** -0.003*
(0.001) (0.002) (0.002) (0.002)
Output gap -0.004*** -0.005*** -0.004** -0.005*** -0.004** -0.004*** -0.006***
(0.002) (0.002) (0.002) (0.002) (0.002) (0.002) (0.002)
% High-skilled jobs 0.017*** 0.013*** 0.013***
(0.002) (0.002) (0.002)
Tertiary attainment 0.018*** 0.017*** 0.016*** 0.022***
(0.002) (0.002) (0.002) (0.001)
Constant -3.725*** -3.355*** -2.849*** -3.062*** -3.125*** -3.160*** -3.325***
(0.054) (0.023) (0.099) (0.100) (0.134) (0.117) (0.022)
Observations 588 582 588 582 588 582 586
R-squared 0.508 0.564 0.520 0.564 0.528 0.566 0.553
Number of geo 28 28 28 28 28 28 28
Standard errors in parentheses
*** p<0.01, ** p<0.05, * p<0.1


EUROPEAN ECONOMY DISCUSSION PAPERS European Economy Discussion Papers can be accessed and downloaded free of charge from the following address: https://ec.europa.eu/info/publications/economic-and-financial-affairs-publications_en?field_eurovoc_taxonomy_target_id_selective=All&field_core_nal_countries_tid_selective=All&field_core_date_published_value[value][year]=All&field_core_tags_tid_i18n=22617. Titles published before July 2015 under the Economic Papers series can be accessed and downloaded free of charge from: http://ec.europa.eu/economy_finance/publications/economic_paper/index_en.htm.


GETTING IN TOUCH WITH THE EU In person All over the European Union there are hundreds of Europe Direct Information Centres. You can find the address of the centre nearest you at: http://europa.eu/contact. On the phone or by e-mail Europe Direct is a service that answers your questions about the European Union. You can contact this service:
• by freephone: 00 800 6 7 8 9 10 11 (certain operators may charge for these calls),
• at the following standard number: +32 22999696 or • by electronic mail via: http://europa.eu/contact.
FINDING INFORMATION ABOUT THE EU Online Information about the European Union in all the official languages of the EU is available on the Europa website at: http://europa.eu. EU Publications You can download or order free and priced EU publications from EU Bookshop at: http://publications.europa.eu/bookshop. Multiple copies of free publications may be obtained by contacting Europe Direct or your local information centre (see http://europa.eu/contact). EU law and related documents For access to legal information from the EU, including all EU law since 1951 in all the official language versions, go to EUR-Lex at: http://eur-lex.europa.eu. Open data from the EU The EU Open Data Portal (http://data.europa.eu/euodp/en/data) provides access to datasets from the EU. Data can be downloaded and reused for free, both for commercial and non-commercial purposes.