skill acquisition and use across the life course: support ... · web viewthis document was...
TRANSCRIPT
Skill acquisition and use across the life course: Current trends, future prospects—Support document
BILL MARTIN
NATIONAL INSTITUTE OF LABOUR STUDIES
This document was produced by the author based on research for the report Skill acquisition and use across the life course: Current trends, future prospects, and is an added resource for further information. The report is available on NCVER’s website: <http://www.ncver.edu.au>
The views and opinions expressed in this document are those of the author and do not necessarily reflect the views of the Australian Government, state and territory governments or NCVER. Any errors and omissions are the responsibility of the author.
© Australian Government, 2007
This work has been produced by the National Centre for Vocational Education Research (NCVER) on behalf of the Australian Government and state and territory governments with funding provided through the Australian Department of Education, Science and Training. Apart from any use permitted under the CopyrightAct 1968, no part of this publication may be reproduced by any process without written permission. Requests should be made to NCVER.
SUPP
OR
T D
OC
UM
EN
T

2 13/05/2023 13/05/2023 Publication name

Tables and figuresFigure 1: Living Arrangements by sex and age,
Australia, 1981-2001 3Figure 2:Participation in paid work by sex and age,
Australia, 1981-2001 8Figure 3:Participation in part-time and full-time post-
secondary study by sex and age, Australia, 1981-2001 12
Bill Martin, NILS document.doc 3
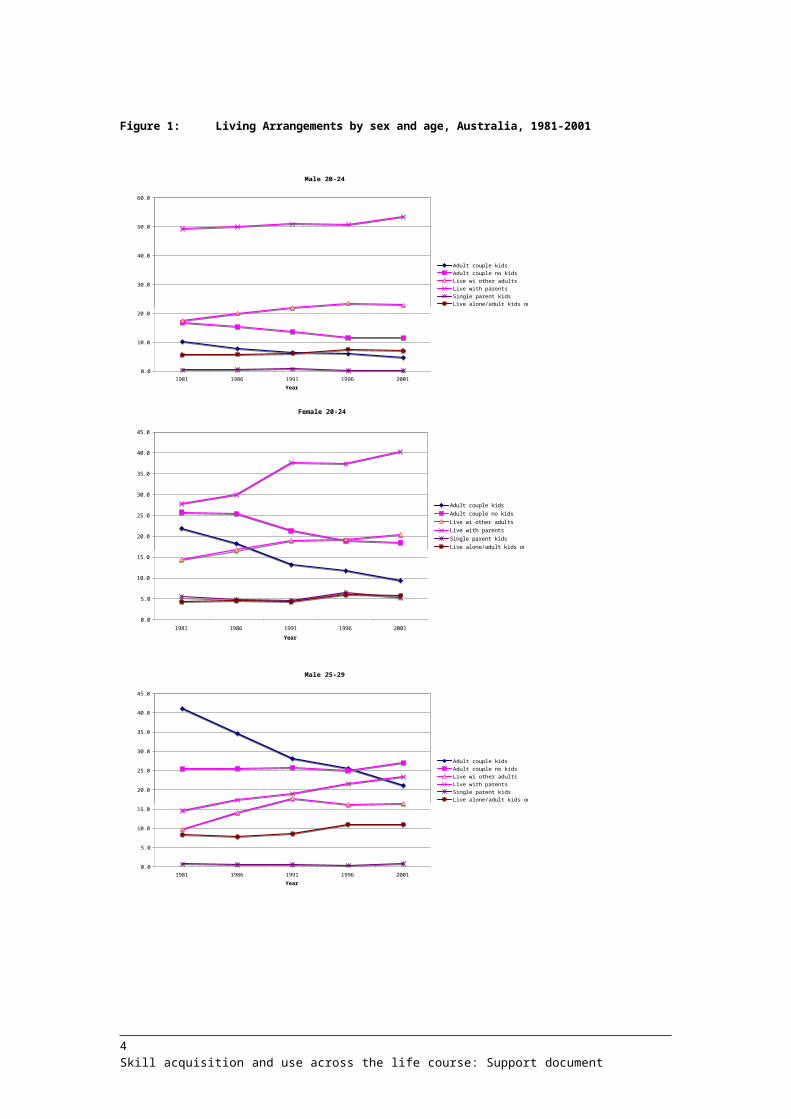
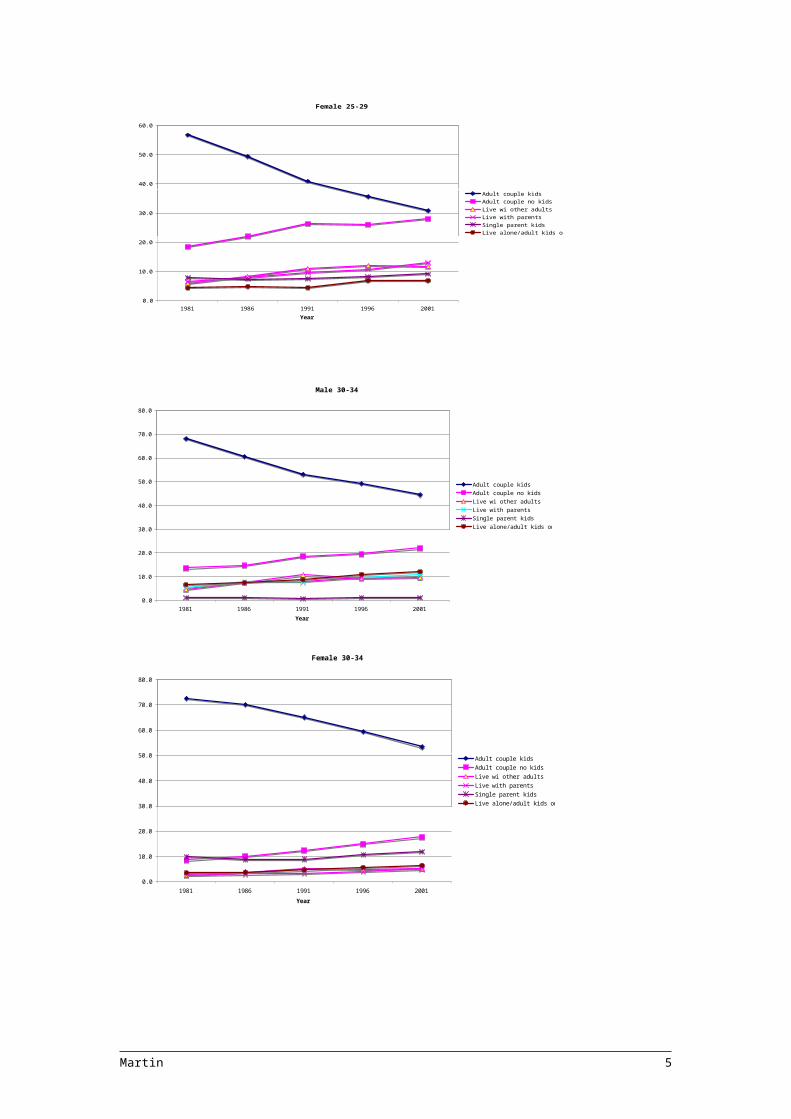
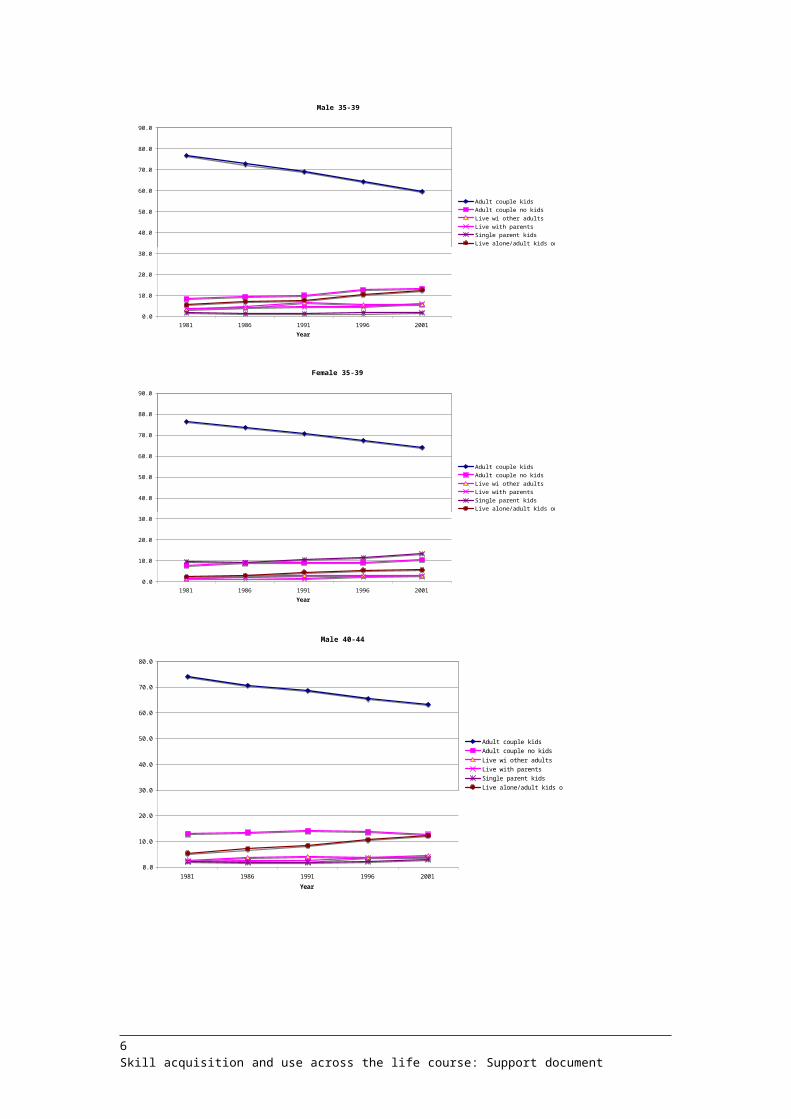
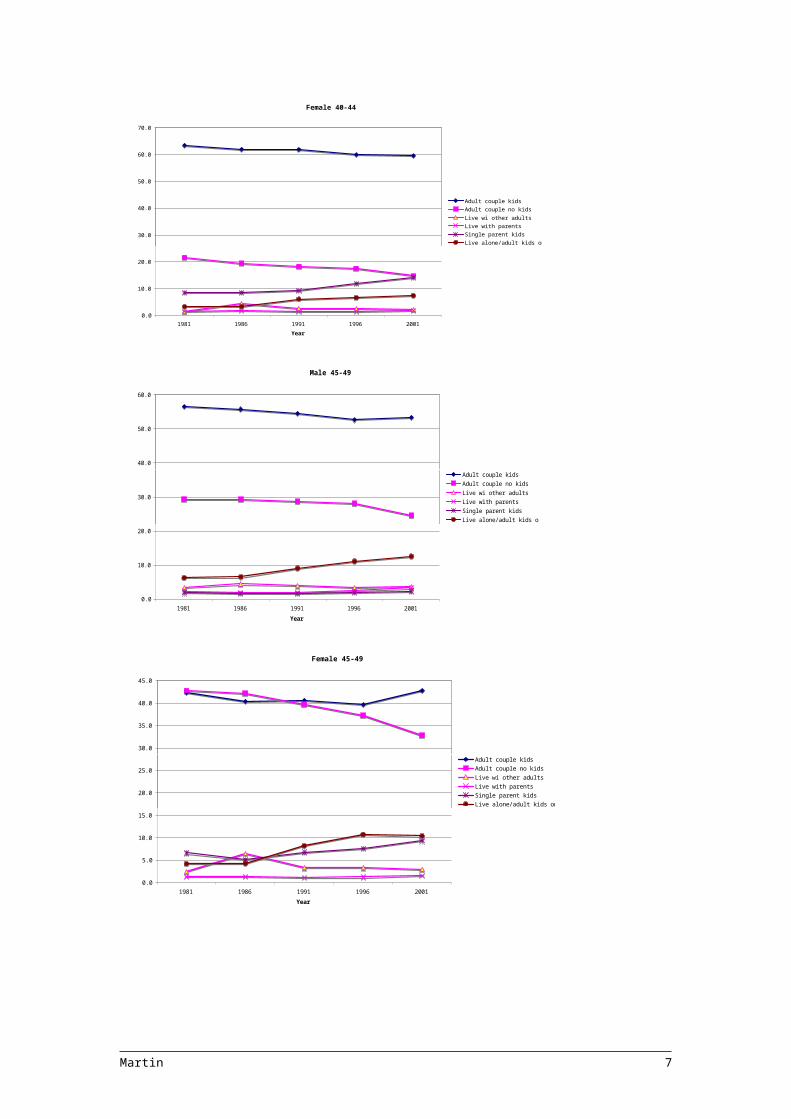
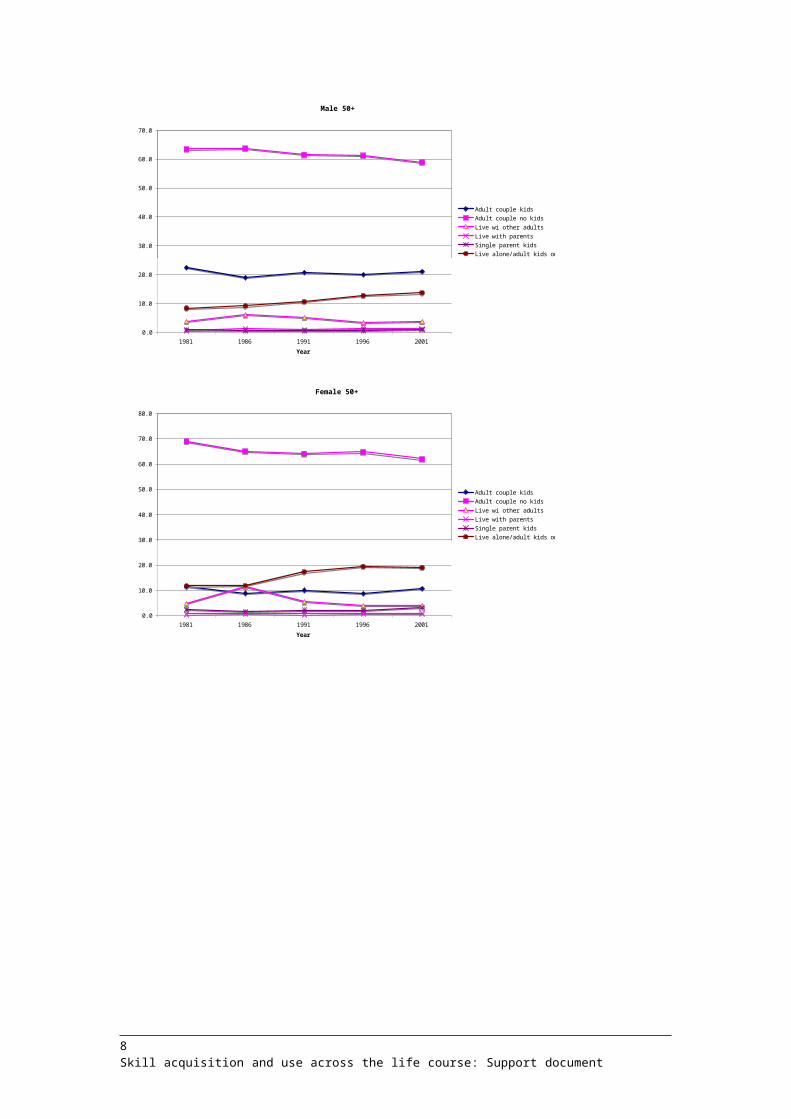
Figure 1: Living Arrangements by sex and age, Australia, 1981-2001
Male 20-24
0.0
10.0
20.0
30.0
40.0
50.0
60.0
1981 1986 1991 1996 2001Year
Perc
enta
ge
Adult couple kidsAdult couple no kidsLive wi other adultsLive with parentsSingle parent kidsLive alone/adult kids only
Female 20-24
0.0
5.0
10.0
15.0
20.0
25.0
30.0
35.0
40.0
45.0
1981 1986 1991 1996 2001Year
Perc
enta
ge
Adult couple kidsAdult couple no kidsLive wi other adultsLive with parentsSingle parent kidsLive alone/adult kids only
Male 25-29
0.0
5.0
10.0
15.0
20.0
25.0
30.0
35.0
40.0
45.0
1981 1986 1991 1996 2001Year
Perc
enta
ge
Adult couple kidsAdult couple no kidsLive wi other adultsLive with parentsSingle parent kidsLive alone/adult kids only
4 Skill acquisition and use across the life course: Support document
Female 25-29
0.0
10.0
20.0
30.0
40.0
50.0
60.0
1981 1986 1991 1996 2001Year
Perc
enta
ge Adult couple kidsAdult couple no kidsLive wi other adultsLive with parentsSingle parent kidsLive alone/adult kids only
Male 30-34
0.0
10.0
20.0
30.0
40.0
50.0
60.0
70.0
80.0
1981 1986 1991 1996 2001Year
Perc
enta
ge
Adult couple kidsAdult couple no kidsLive wi other adultsLive with parentsSingle parent kidsLive alone/adult kids only
Female 30-34
0.0
10.0
20.0
30.0
40.0
50.0
60.0
70.0
80.0
1981 1986 1991 1996 2001Year
Perc
enta
ge
Adult couple kidsAdult couple no kidsLive wi other adultsLive with parentsSingle parent kidsLive alone/adult kids only
Martin 5
Male 35-39
0.0
10.0
20.0
30.0
40.0
50.0
60.0
70.0
80.0
90.0
1981 1986 1991 1996 2001Year
Perc
enta
ge
Adult couple kidsAdult couple no kidsLive wi other adultsLive with parentsSingle parent kidsLive alone/adult kids only
Female 35-39
0.0
10.0
20.0
30.0
40.0
50.0
60.0
70.0
80.0
90.0
1981 1986 1991 1996 2001Year
Perc
enta
ge
Adult couple kidsAdult couple no kidsLive wi other adultsLive with parentsSingle parent kidsLive alone/adult kids only
Male 40-44
0.0
10.0
20.0
30.0
40.0
50.0
60.0
70.0
80.0
1981 1986 1991 1996 2001Year
Perc
enta
ge
Adult couple kidsAdult couple no kidsLive wi other adultsLive with parentsSingle parent kidsLive alone/adult kids only
6 Skill acquisition and use across the life course: Support document
Female 40-44
0.0
10.0
20.0
30.0
40.0
50.0
60.0
70.0
1981 1986 1991 1996 2001Year
Perc
enta
ge
Adult couple kidsAdult couple no kidsLive wi other adultsLive with parentsSingle parent kidsLive alone/adult kids only
Male 45-49
0.0
10.0
20.0
30.0
40.0
50.0
60.0
1981 1986 1991 1996 2001Year
Perc
enta
ge
Adult couple kidsAdult couple no kidsLive wi other adultsLive with parentsSingle parent kidsLive alone/adult kids only
Female 45-49
0.0
5.0
10.0
15.0
20.0
25.0
30.0
35.0
40.0
45.0
1981 1986 1991 1996 2001Year
Perc
enta
ge
Adult couple kidsAdult couple no kidsLive wi other adultsLive with parentsSingle parent kidsLive alone/adult kids only
Martin 7
Male 50+
0.0
10.0
20.0
30.0
40.0
50.0
60.0
70.0
1981 1986 1991 1996 2001Year
Perc
enta
ge
Adult couple kidsAdult couple no kidsLive wi other adultsLive with parentsSingle parent kidsLive alone/adult kids only
Female 50+
0.0
10.0
20.0
30.0
40.0
50.0
60.0
70.0
80.0
1981 1986 1991 1996 2001Year
Perc
enta
ge
Adult couple kidsAdult couple no kidsLive wi other adultsLive with parentsSingle parent kidsLive alone/adult kids only
8 Skill acquisition and use across the life course: Support document
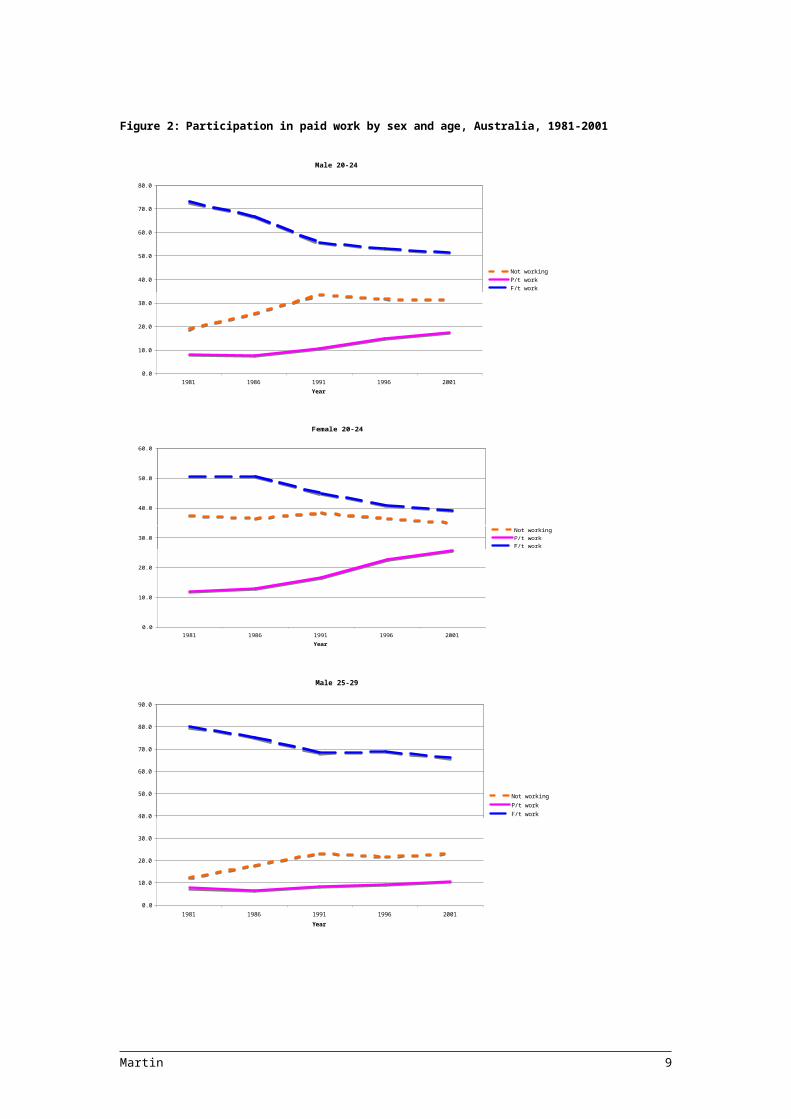
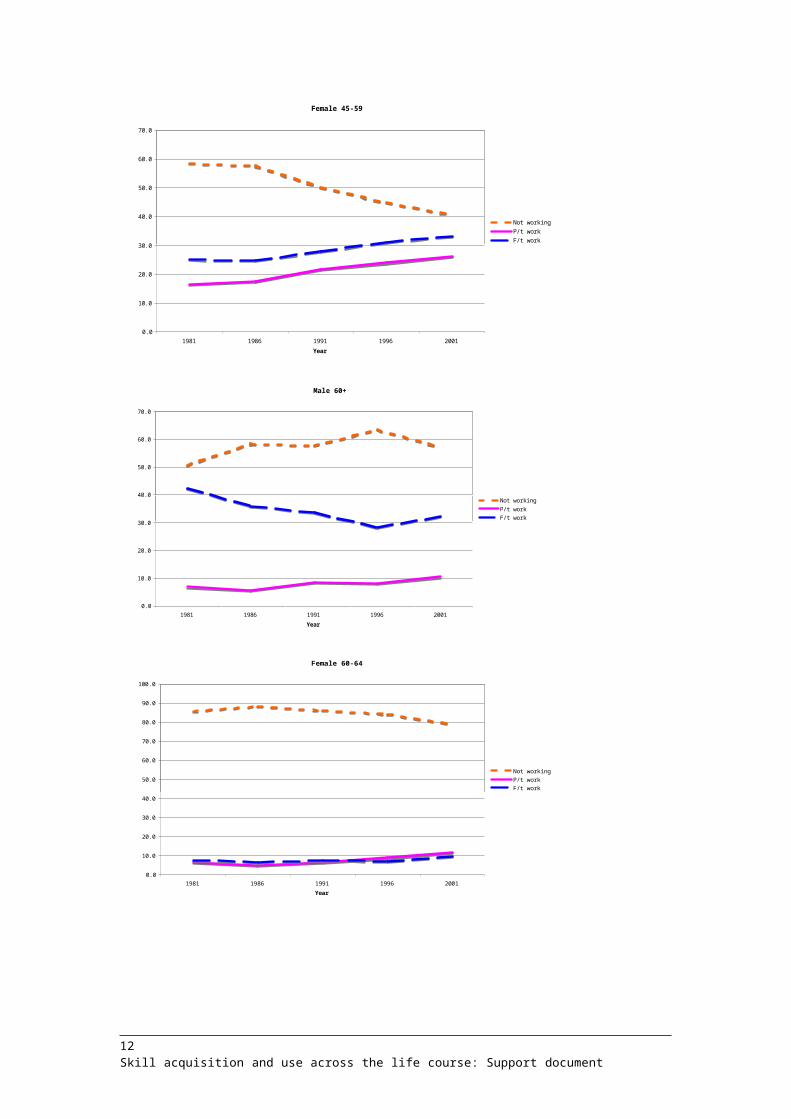
Figure 2: Participation in paid work by sex and age, Australia, 1981-2001
Male 20-24
0.0
10.0
20.0
30.0
40.0
50.0
60.0
70.0
80.0
1981 1986 1991 1996 2001Year
Perc
enta
ge
Not working P/t workF/t work
Female 20-24
0.0
10.0
20.0
30.0
40.0
50.0
60.0
1981 1986 1991 1996 2001Year
Perc
enta
ge
Not working P/t workF/t work
Male 25-29
0.0
10.0
20.0
30.0
40.0
50.0
60.0
70.0
80.0
90.0
1981 1986 1991 1996 2001Year
Perc
enta
ge Not working P/t workF/t work
Martin 9

Female 25-29
0.0
10.0
20.0
30.0
40.0
50.0
60.0
1981 1986 1991 1996 2001Year
Perc
enta
ge
Not working P/t workF/t work
Male 30-34
0.0
10.0
20.0
30.0
40.0
50.0
60.0
70.0
80.0
90.0
1981 1986 1991 1996 2001Year
Perc
enta
ge
Not working P/t workF/t work
Female 30-34
0.0
10.0
20.0
30.0
40.0
50.0
60.0
1981 1986 1991 1996 2001Year
Perc
enta
ge Not working P/t workF/t work
10 Skill acquisition and use across the life course: Support document

Male 35-44
0.0
10.0
20.0
30.0
40.0
50.0
60.0
70.0
80.0
90.0
1981 1986 1991 1996 2001Year
Perc
enta
ge Not working P/t workF/t work
Female 35-44
0.0
5.0
10.0
15.0
20.0
25.0
30.0
35.0
40.0
45.0
50.0
1981 1986 1991 1996 2001Year
Perc
enta
ge Not working P/t workF/t work
Male 45-59
0.0
10.0
20.0
30.0
40.0
50.0
60.0
70.0
80.0
90.0
1981 1986 1991 1996 2001Year
Perc
enta
ge Not working P/t workF/t work
Martin 11
Female 45-59
0.0
10.0
20.0
30.0
40.0
50.0
60.0
70.0
1981 1986 1991 1996 2001Year
Perc
enta
ge Not working P/t workF/t work
Male 60+
0.0
10.0
20.0
30.0
40.0
50.0
60.0
70.0
1981 1986 1991 1996 2001Year
Perc
enta
ge Not working P/t workF/t work
Female 60-64
0.0
10.0
20.0
30.0
40.0
50.0
60.0
70.0
80.0
90.0
100.0
1981 1986 1991 1996 2001Year
Perc
enta
ge
Not working P/t workF/t work
12 Skill acquisition and use across the life course: Support document
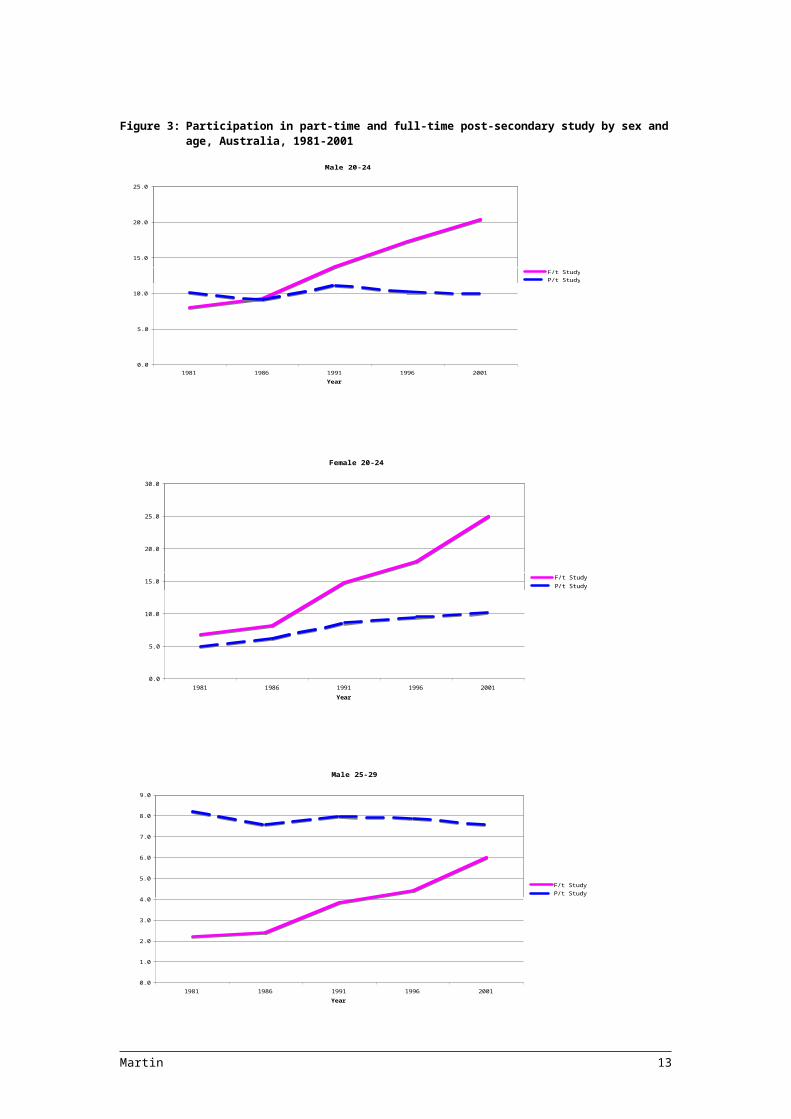
Male 20-24
0.0
5.0
10.0
15.0
20.0
25.0
1981 1986 1991 1996 2001Year
Perc
enta
ge
F/t StudyP/t Study
Female 20-24
0.0
5.0
10.0
15.0
20.0
25.0
30.0
1981 1986 1991 1996 2001Year
Perc
enta
ge
F/t StudyP/t Study
Figure 3: Participation in part-time and full-time post-secondary study by sex and age, Australia, 1981-2001
Male 25-29
0.0
1.0
2.0
3.0
4.0
5.0
6.0
7.0
8.0
9.0
1981 1986 1991 1996 2001Year
Perc
enta
ge
F/t StudyP/t Study
Martin 13
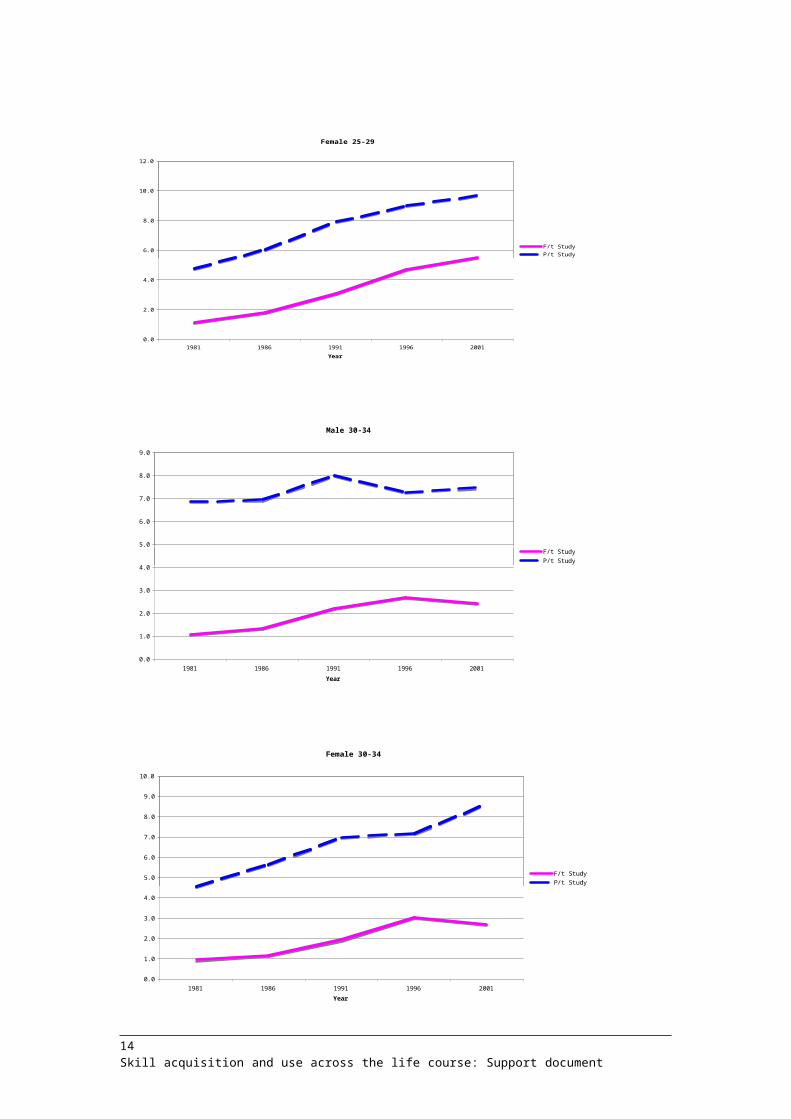
Female 25-29
0.0
2.0
4.0
6.0
8.0
10.0
12.0
1981 1986 1991 1996 2001Year
Perc
enta
ge
F/t StudyP/t Study
Male 30-34
0.0
1.0
2.0
3.0
4.0
5.0
6.0
7.0
8.0
9.0
1981 1986 1991 1996 2001Year
Perc
enta
ge
F/t StudyP/t Study
Female 30-34
0.0
1.0
2.0
3.0
4.0
5.0
6.0
7.0
8.0
9.0
10.0
1981 1986 1991 1996 2001Year
Perc
enta
ge
F/t StudyP/t Study
14 Skill acquisition and use across the life course: Support document

Male 35-39
0.0
1.0
2.0
3.0
4.0
5.0
6.0
7.0
1981 1986 1991 1996 2001Year
Perc
enta
ge
F/t StudyP/t Study
Female 35-39
0.0
1.0
2.0
3.0
4.0
5.0
6.0
7.0
8.0
9.0
1981 1986 1991 1996 2001Year
Perc
enta
ge
F/t StudyP/t Study
Male 40-54
0.0
0.5
1.0
1.5
2.0
2.5
3.0
3.5
4.0
1981 1986 1991 1996 2001Year
Perc
enta
ge
F/t StudyP/t Study
Martin 15
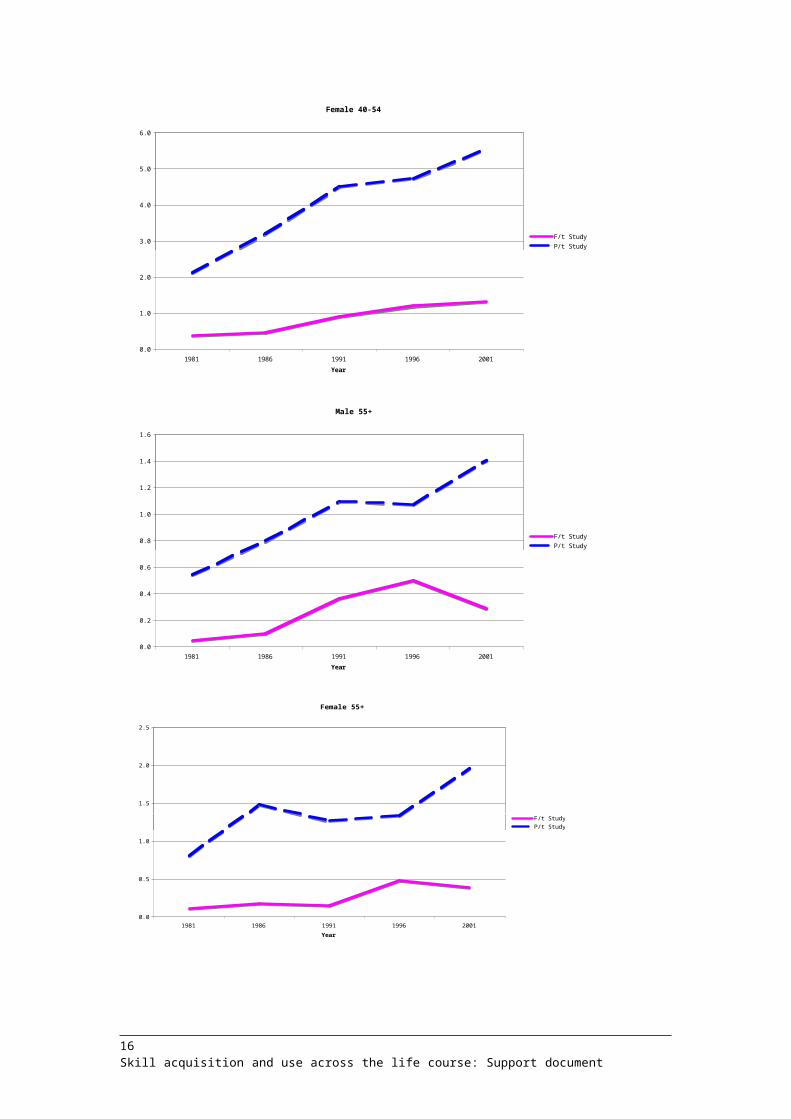
Female 40-54
0.0
1.0
2.0
3.0
4.0
5.0
6.0
1981 1986 1991 1996 2001Year
Perc
enta
ge
F/t StudyP/t Study
Male 55+
0.0
0.2
0.4
0.6
0.8
1.0
1.2
1.4
1.6
1981 1986 1991 1996 2001Year
Perc
enta
ge
F/t StudyP/t Study
Female 55+
0.0
0.5
1.0
1.5
2.0
2.5
1981 1986 1991 1996 2001Year
Perc
enta
ge
F/t StudyP/t Study
16 Skill acquisition and use across the life course: Support document