sketch-based interaction advances in mathematical...
TRANSCRIPT
Sketch-Based Interaction
38 January/February 2007 Published by the IEEE Computer Society 0272-1716/07/$20.00 © 2007 IEEE
M athematical sketching is a pen-based,gestural interaction paradigm for
mathematical problem solving and concept visualiza-tion, deriving from the familiar pencil-and-paperprocess of drawing supporting diagrams to facilitatethe formulation of mathematical expressions.1 Howev-er, with mathematical sketching, users can also lever-age their physical intuition by watching theirhand-drawn diagrams animate in response to continu-
ous or discrete parameter changesin their written formulas. Implicitassociations that are inferred�either automatically or with gestur-al guidance�from mathematicalexpressions, diagram labels, anddrawing elements drive diagramanimation.
In theory, you could use mathe-matical sketching to make any kindof dynamic illustration. However,devising a general framework tosupport any type of dynamic illus-tration is a difficult problem (see the“Related Work in Creating DynamicIllustrations” sidebar near the endof the article). Thus, the Brown Uni-versity Graphics Group’s focus hasbeen on a particular subset of
dynamic illustrations in which objects are animatedthrough or as a result of affine transformations. In otherwords, a mathematical sketch can create a dynamic illus-tration in which objects can translate and rotate orstretch on the basis of other moving objects. We definethese affine transformations using functions of timewith known domains or through numerical simulation.
Given our current focus, mathematical sketching letsusers create dynamic illustrations based on simple
Newtonian physics for exploring concepts such as har-monic and projectile motion, linear and rotationalkinematics, and collisions. Although our focus has beenexclusively on this subset, we’re still presented withsignificant research challenges, given the number ofdynamic illustrations possible in this subspace, cou-pled with our goal of having a simple, yet powerful,sketch-based interface for creating mathematicalsketches.
To explore mathematical sketching, we’ve createdMathPad2 (see Figure 1), a Tablet PC-based applica-tion that lets users create and explore mathematicalsketches as well as graph functions, evaluate expres-sions, and solve equations.2 In this article, I presentour most recent advances with MathPad2, as a meanstoward realizing mathematical sketching’s full poten-tial, which includes support for dynamic illustrationsbased on use of open-form solutions, evaluation of cal-culus expressions, solving of ordinary differential andsimultaneous equations, and improved mathematicalsymbol recognition and drawing rectification. I also discuss the essential components that make math-ematical sketching possible and briefly mentionusability evaluation.
Gestural user interface An important goal of mathematical sketching is to
facilitate mathematical problem solving without impos-ing any interaction burden beyond those of traditionalmedia. Because pencil-and-paper users switch fluidlybetween writing equations and drawing supporting dia-grams, a modeless interface is highly desirable. Thetechnical challenge then for mathematical sketching’sgestural user interface is that its gestures not interferewith the entry of drawings or equations and still bedirect and natural enough to feel fluid. We use a three-fold strategy to accomplish this task:
MathPad2 is a Tablet PC-basedapplication that lets userscreate and exploremathematical sketches, graphfunctions, evaluate expressions,and solve equations through aneasy-to-use interface. Theauthor describes the work donewith MathPad2 thus far andpresents recent advancestoward realizing mathematicalsketching’s full potential to aidin mathematical problemsolving and visualization.
Joseph J. LaViola Jr.Brown University
Advances inMathematicalSketching: Moving Toward the Paradigm’s Full Potential
■ First, we use context sensitivity to deter-mine what operations to perform with a sin-gle gesture.
■ Next, we use location-aware gestures sothat a single gesture can invoke differentcommands based on its location and size.
■ Finally, we use the notion of punctuatedgestures3�compound gestures with one ormore strokes and terminal punctuation��to help resolve ambiguities among gestures,mathematics, and drawings.
Combining these techniques lets the entireinterface be completely modeless, and also letsus reduce the gesture set while maintaining ahigh level of functionality.
One of the important issues with gesturalinterfaces is whether the gestures actuallymake sense, because a completely modelessuser interface with a poor gesture set mightnot work well. We chose our gesture set (seeTable 1 on the next page for a summary of theset) using two important criteria:
■ The gestures should be easy to perform andlearn.
■ If a particular gesture makes sense for two or moredifferent operations, it should invoke all those oper-ations.
This approach also eases learning, because users neednot remember additional gestures. (Details on how ourgestures are recognized are available elsewhere.2)
Writing, recognizing, and correctingmathematics
Writing mathematical expressions with mathemati-cal sketching is straightforward: users draw with a stylusas they would with pencil and paper. The only compli-cation in writing expressions is how errant strokes arecorrected. We first designed a scribble erase gesture inwhich the user scribbles with the pen back and forth overthe ink strokes to be deleted. However, the system oftenrecognized scribble erase gestures when in fact the userhad intended to draw ink and not erase anything. To alle-viate this problem, we used a punctuated gesturebecause of its relative simplicity and ease of execution.Thus, our current definition of scribble erase is the scrib-ble stroke followed directly by a tap. In practice, usersfound this compound gesture easy to learn, effective ineliminating false positives, and not significantly moredifficult or slower than the simple scribble gesture.
After a user writes mathematical expressions, the sys-tem must recognize them. We chose a manual segmen-tation approach to avoid problems associated withautomatic segmentation of multiple mathematicalexpressions. In this approach, users explicitly select aset of strokes comprising a single mathematical expres-sion by drawing a lasso. Because in a modeless interfacea lasso is indistinguishable from a closed curve, we usedpunctuated gestures—this time drawing a lasso arounda line of mathematics and then tapping inside the lasso.
We made the tap inside the lasso so we could performother lasso and tap operations, as I describe later.
We can correct symbol recognition errors in two ways:
■ First, users can tap on a recognized symbol to bringup an n-best list of alternatives for that symbol. Click-ing the correct symbol updates the mathematicalexpression.
■ Alternatively, users can simply scribble erase theoffending symbols, rewrite them, and rerecognize theexpression.
In addition to correcting symbol recognition errors,users also need to correct parsing errors arising whenthe mathematical expression recognizer has incorrect-ly determined the relationship between symbols. Userscan correct parsing mistakes by moving mathematicalsymbols to new positions relative to the other symbolsin the expression. When the user finishes moving thesesymbols, the system automatically rerecognizes theexpression. To move a symbol or group of symbols, usersmake a lasso around the symbols of interest and then,starting inside the lasso, use the stylus to drag the sym-bols to the desired location. This approach is easy andmakes intuitive sense because a lasso implies users wantto operate on the selected symbols, and dragging themaround is the most direct method of moving them.
Making drawingsUsers sketch diagrams in the same way as mathemat-
ical expressions except that the diagrams need not berecognized. In considering the value of a primitives-based drawing system against the added interactionoverhead of specifying primitives, we decided that ouronly primitive would be unrecognized ink strokes as away to maintain the pencil-and-paper aesthetic we wantto achieve with mathematical sketching.
IEEE Computer Graphics and Applications 39
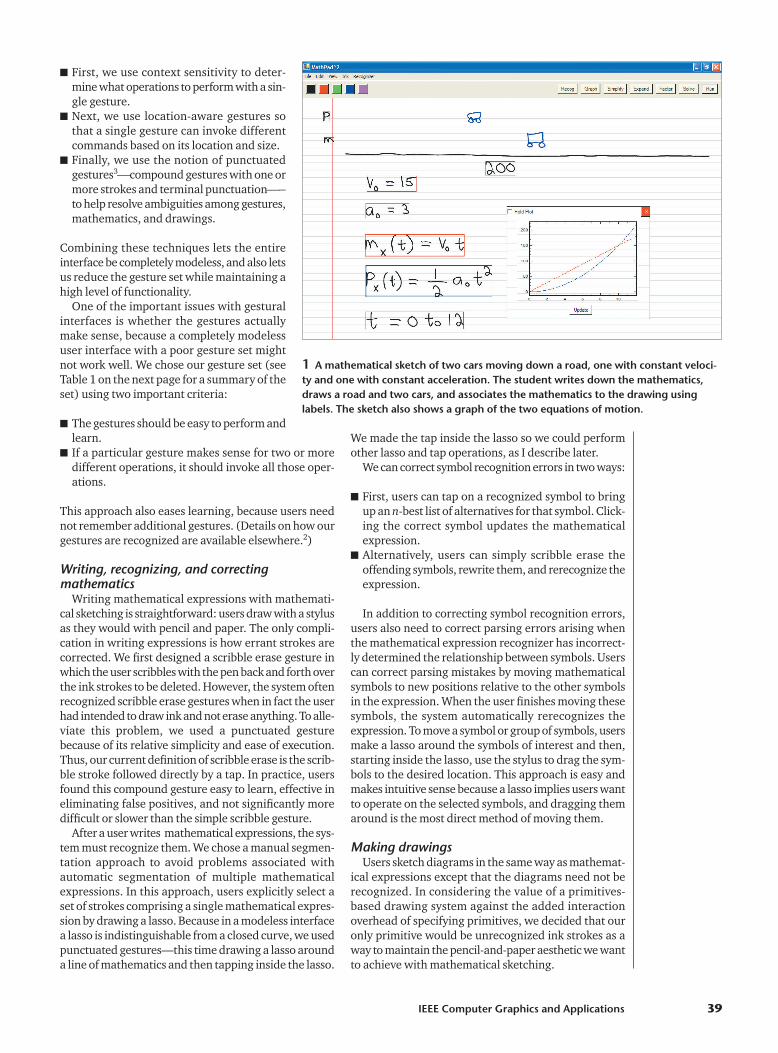
1 A mathematical sketch of two cars moving down a road, one with constant veloci-ty and one with constant acceleration. The student writes down the mathematics,draws a road and two cars, and associates the mathematics to the drawing usinglabels. The sketch also shows a graph of the two equations of motion.
Nailing diagram components. In reviewing abroad range of mathematical illustrations, we found thatthe single low-level behavior of stretching a diagram ele-ment can be powerful. Thus, we support the nails con-cept to pin a diagram element to the background or pina point on a diagram element to another diagram ele-ment. If either diagram element is moved, the other ele-ment either moves rigidly to stay attached at the nail (ifit has only one nail) or stretches so that all its nails main-tain their points of attachment.
The user creates a nail by drawing a lasso around theappropriate location in the drawing and making a tapgesture inside it (the tap disambiguates the nail gesturefrom a circle that is part of a drawing). This lasso andtap gesture is the same as that used to recognize math-ematical expressions and seems to be a logical choicebecause it’s analogous to drawing a nail head and thenhammering it in with the tap.
Grouping diagram components.Because many drawings involve creating onelogical object from a set of strokes (drawingelements), we need to be able to groupstrokes together. We can use the same lassoand tap gesture for a grouping operation andcan distinguish the grouping gesture on thebasis of tap location. If the tap falls within afew pixels of the lasso, we perform a group-ing operation. After the operation, we drawa green box around the strokes to show thatwe’ve made a grouping and to distinguish itfrom a recognized expression. Although wecould easily define a different gesture forgrouping, we believe that maintaining a sim-ple contextually overloaded gesture set iseasier for users than the alternative largergesture set.
AssociationsThe most important part of a mathemati-
cal sketch is the associations between math-ematical expressions and diagrams. Userscan make associations between scalar math-ematical expressions and angle arcs or oneof the three special values of a diagram ele-ment�its x, y, or rotation coordinates.
Implicit associations. Implicit asso-ciations are based on the familiar variableand constant names found in mathematicsand physics texts. These variable and con-stant labels appear so regularly in theseillustrations that we can use them not forjust labeling but also for making associa-tions. Mathematical sketching supportspoint and angle associations implicitly anduses the recognized label and linked draw-ing element to infer associations with otherexpressions on the page.
To create an implicit point association,users draw a variable name or constant valuenear the intended drawing element and thenuse the mathematical expression recognition
gesture to recognize the label. The tap location can havetwo meanings in completing the point association:
■ If the recognition gesture’s tap falls within its lasso,the label is linked to the closest drawing element with-in some global distance threshold.
■ If the tap location is outside the lasso, it specifies boththe drawing element to be linked to the label and thedrawing element’s center of rotation (this point isused only for rotational labels).
The tap must be located on the drawing element orin a grouped drawing element’s bounding box. We’vefound that users prefer tapping on the drawing elementrather than inside the lasso to make a point association,probably because they prefer choosing the drawing ele-ment with which the mathematics is associated ratherthan letting the computer choose for them.
Sketch-Based Interaction
40 January/February 2007
Gesture Result Description
Lasso and tap to recognize an expression
Scribble and tap to delete ink
Create a graph, line starts in recognized math, no cusps or intersections
Line through math and click on drawing makes association
Release makes rotation point
Solves equation, includes simultaneous and ordinary differential equations
Evaluate an expression; includes integrals, derivatives, summations, and so on
Makes implicit association using label family ‘P’
Makes implicit association with explicit tap on object
Implicit angle association and rectification
Nail two drawing elements by small circle and tap
Group strokes
Lasso and drag symbol to change position
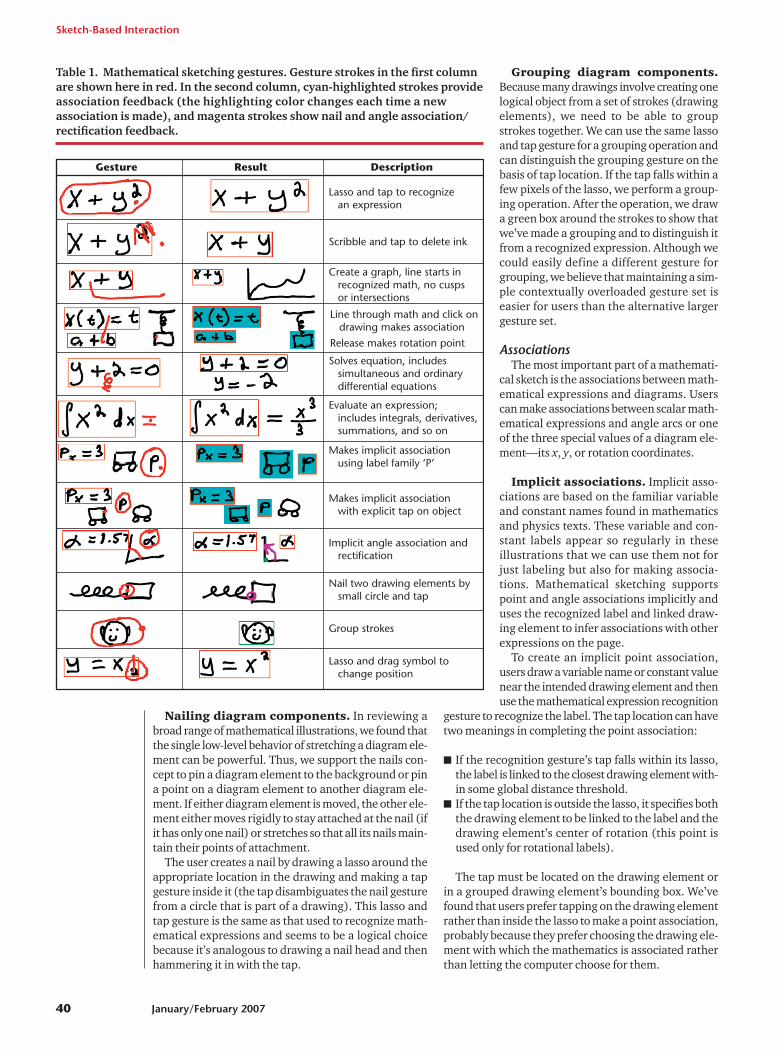
Table 1. Mathematical sketching gestures. Gesture strokes in the first columnare shown here in red. In the second column, cyan-highlighted strokes provideassociation feedback (the highlighting color changes each time a newassociation is made), and magenta strokes show nail and angle association/rectification feedback.
To create an implicit angle association, userswrite a label, then draw an angle arc such thatthe label is enclosed within the arc and the twoink strokes the arc connects. Users then makea tap whose location on the arc determines theactive line�the line attached to the arc thatwill move when the angle changes. The sys-tem marks the angle’s apex with a green dot,and an arrowhead on the angle arc indicatesthe active line. We don’t detect or supportcyclical association relationships, such as thespecification of each angle in a triangle.
Explicit associations. For slightly morecontrol over associations and to reduce a dia-gram’s information density, users can alsocreate associations explicitly without usingvariable name labels. The user makes anexplicit association by drawing a line througha set of related mathematical expressions andthen tapping on a drawing element. Thistechnique provides greater flexibility thanthe implicit association techniques in twoways:
■ Explicit associations can specify the precise point ofrotation. Instead of just tapping on the drawing ele-ment (which sets the point of rotation at the drawingelement’s center), users can press down on the ele-ment to select it, move the stylus, and then lift the sty-lus to the desired center of rotation, even if it isn’t onthe drawing element.
■ Explicit associations are somewhat faster than theirimplicit counterparts because they don’t require usersto write down a label first.
Supporting a mathematical toolset MathPad2 also supports mathematical tools for
graphing, solving, simplifying, and evaluating recog-nized functions and equations. This toolset’s utility istwofold. It provides traditional tools found in other soft-ware packages, so mathematical sketching becomes amore complete problem-solving and visualizationapproach. In addition, the tools can help users createmathematical sketches�for example, solving a differen-tial equation to obtain motion equations for a sketch orintegrating F � ma to find velocity as a function of time.
Graphing equations Users can graph recognized functions with a simple
line gesture that begins on the function and ends at thegraph’s intended location. The graphing gesture isessentially the same as that used for creating explicitassociations, except that it must have a minimum lengthand its endpoint must fall outside any of the recognizedexpressions’ bounding boxes.
The graphing gesture must have a minimum length(about 160 pixels) so that the system doesn’t interpretit as a mathematical symbol such as a fraction line. Thisgesture lets users graph more than one function at a timeby making sure that any part of the gesture line (exceptthe endpoint) intersects an expression’s bounding box.
The graphing gesture produces a movable, resizablegraph widget displaying the function’s plot.
Solving equationsMathPad2 also lets users solve equations (see Figure
2). A squiggle gesture invokes the solver. This gestureresembles the graphing gesture except it must have twoself-intersections whereas the graphing gesture musthave none. We could have overloaded the graphing ges-ture and then examined the context of the intersectedrecognized expressions to determine whether a graph-ing or solving operation was intended, but it makes moresense to have two distinct gestures for these tasksbecause graphing and solving are two distinct opera-tions. The squiggle gesture is somewhat arbitrary butusers have found it easy to remember and perform.
In our previous MathPad2 implementation, userscould solve only simple equations.1 Given the success ofour overloaded lasso-and-tap gesture, we extendedMathPad2 so that users can solve single equations,simultaneous equations, and ordinary differential equa-tions (with and without initial conditions) using thesame squiggle gesture. When users make a squiggle ges-ture, MathPad2 examines the recognized equationsintersected by that gesture to determine what type ofsolving routine to perform.
If there is only one recognized equation and it has noderivatives, we call a single equation solver. If the equa-tion contains derivatives, we call an ordinary differen-tial equation solver. If more than one recognizedequation is intersected, we check whether any deriva-tives are present. If so, we examine the other equationsto see if they give valid initial conditions for the differ-ential equation. If so, we call an ordinary differentialequation solver. If none of the recognized equations havederivatives, we call a simultaneous equation solver (wealso support simultaneous ordinary differential equa-tions). With this approach, users need to remember only
IEEE Computer Graphics and Applications 41
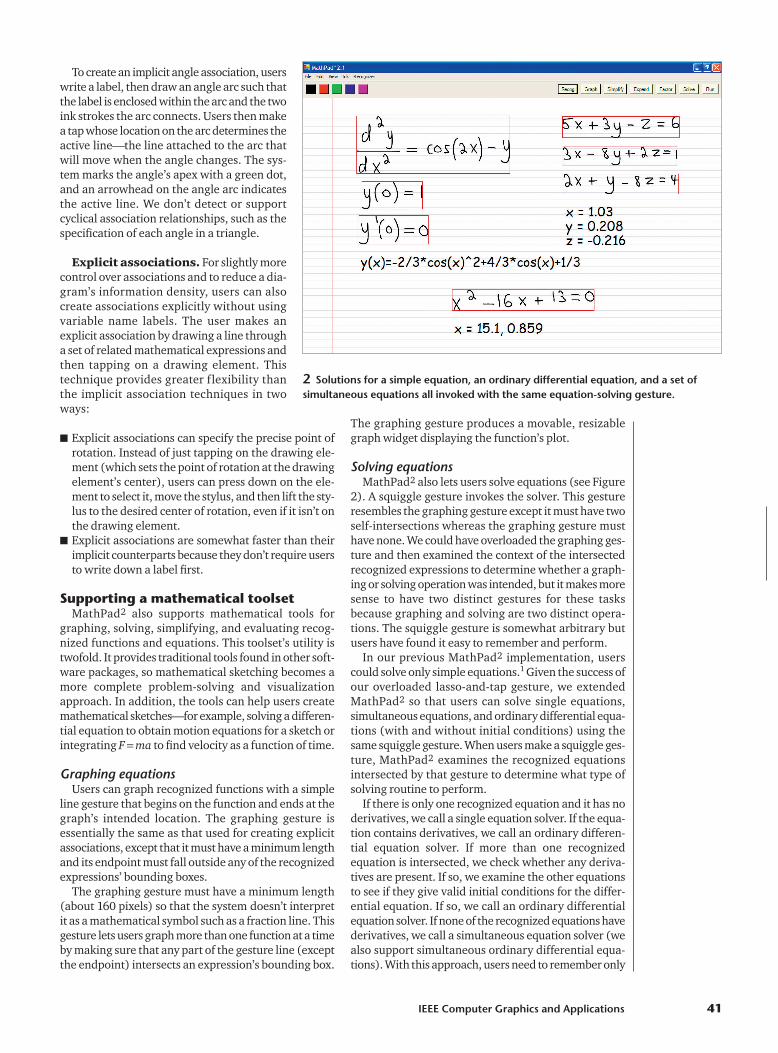
2 Solutions for a simple equation, an ordinary differential equation, and a set ofsimultaneous equations all invoked with the same equation-solving gesture.
one gesture, making the interface much simpler whilemaking the MathPad2 application more powerful.
Evaluating expressionsUsers can evaluate a variety of mathematical expres-
sions using the supporting toolset. To evaluate a recog-nized expression, users make an equal sign and then tapinside the equal sign’s bounding box on the right side of theexpression. Choosing an equal sign as part of our evalua-tion gesture is logical because it’s one of the most commonmathematical symbols and has an understood meaning.
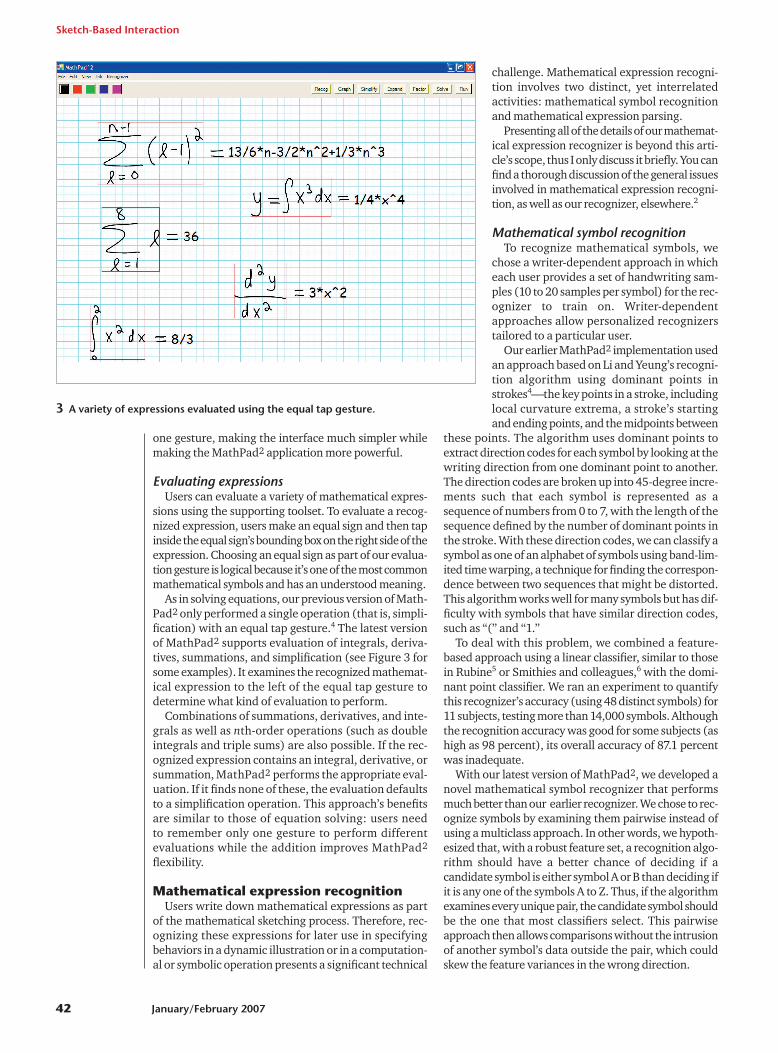
As in solving equations, our previous version of Math-Pad2 only performed a single operation (that is, simpli-fication) with an equal tap gesture.4 The latest versionof MathPad2 supports evaluation of integrals, deriva-tives, summations, and simplification (see Figure 3 forsome examples). It examines the recognized mathemat-ical expression to the left of the equal tap gesture todetermine what kind of evaluation to perform.
Combinations of summations, derivatives, and inte-grals as well as nth-order operations (such as doubleintegrals and triple sums) are also possible. If the rec-ognized expression contains an integral, derivative, orsummation, MathPad2 performs the appropriate eval-uation. If it finds none of these, the evaluation defaultsto a simplification operation. This approach’s benefitsare similar to those of equation solving: users need to remember only one gesture to perform different evaluations while the addition improves MathPad2
flexibility.
Mathematical expression recognition Users write down mathematical expressions as part
of the mathematical sketching process. Therefore, rec-ognizing these expressions for later use in specifyingbehaviors in a dynamic illustration or in a computation-al or symbolic operation presents a significant technical
challenge. Mathematical expression recogni-tion involves two distinct, yet interrelatedactivities: mathematical symbol recognitionand mathematical expression parsing.
Presenting all of the details of our mathemat-ical expression recognizer is beyond this arti-cle’s scope, thus I only discuss it briefly. You canfind a thorough discussion of the general issuesinvolved in mathematical expression recogni-tion, as well as our recognizer, elsewhere.2
Mathematical symbol recognitionTo recognize mathematical symbols, we
chose a writer-dependent approach in whicheach user provides a set of handwriting sam-ples (10 to 20 samples per symbol) for the rec-ognizer to train on. Writer-dependentapproaches allow personalized recognizerstailored to a particular user.
Our earlier MathPad2 implementation usedan approach based on Li and Yeung’s recogni-tion algorithm using dominant points instrokes4�the key points in a stroke, includinglocal curvature extrema, a stroke’s startingand ending points, and the midpoints between
these points. The algorithm uses dominant points toextract direction codes for each symbol by looking at thewriting direction from one dominant point to another.The direction codes are broken up into 45-degree incre-ments such that each symbol is represented as asequence of numbers from 0 to 7, with the length of thesequence defined by the number of dominant points inthe stroke. With these direction codes, we can classify asymbol as one of an alphabet of symbols using band-lim-ited time warping, a technique for finding the correspon-dence between two sequences that might be distorted.This algorithm works well for many symbols but has dif-ficulty with symbols that have similar direction codes,such as “(” and “1.”
To deal with this problem, we combined a feature-based approach using a linear classifier, similar to thosein Rubine5 or Smithies and colleagues,6 with the domi-nant point classifier. We ran an experiment to quantifythis recognizer’s accuracy (using 48 distinct symbols) for11 subjects, testing more than 14,000 symbols. Althoughthe recognition accuracy was good for some subjects (ashigh as 98 percent), its overall accuracy of 87.1 percentwas inadequate.
With our latest version of MathPad2, we developed anovel mathematical symbol recognizer that performsmuch better than our earlier recognizer. We chose to rec-ognize symbols by examining them pairwise instead ofusing a multiclass approach. In other words, we hypoth-esized that, with a robust feature set, a recognition algo-rithm should have a better chance of deciding if acandidate symbol is either symbol A or B than deciding ifit is any one of the symbols A to Z. Thus, if the algorithmexamines every unique pair, the candidate symbol shouldbe the one that most classifiers select. This pairwiseapproach then allows comparisons without the intrusionof another symbol’s data outside the pair, which couldskew the feature variances in the wrong direction.
Sketch-Based Interaction
42 January/February 2007
3 A variety of expressions evaluated using the equal tap gesture.
An issue with this pairwise approach is that the number of comparisons would bem(m � 1)/2, so a reasonably sized m wouldslow the recognizer considerably. We hadobserved, through some empirical analysis,that the Microsoft handwriting recognizer hasthe correct classification in its n-best list morethan 99 percent of the time. Therefore, weincorporated it into our symbol recognizer asa first pass to prune down the number of pairs,making the algorithm much faster.
The key to this approach is to have a robustfeature set and a set of associated weights onthose features for pairwise discrimination. Wecan find the weights on these features using avariety of algorithms,5,6 assuming the featuresare normally distributed; however, our fea-tures don’t necessarily have this property. Wetherefore decided to use AdaBoost7 to find fea-ture weights because of its invariance to distri-bution assumptions, its ability to deal withsimple classifiers, and its simplicity. AdaBoosttakes a series of simple or base classifiers andcalls them repeatedly in a series of rounds ontraining data.
Each weak learner’s importance or weightis updated after each round on the basis of its perfor-mance on the training set. With this recognizer, usingthe same 11 subjects, we obtained an overall accuracy of95.1 percent, which is significantly better than our pre-vious approach.
Mathematical expression parsingOnce the mathematical symbol recognizer classifies a
set of ink strokes as a set of particular symbols, the sys-tem must structurally analyze these symbols to deter-mine their relationships with one another and parsethem to create a coherent mathematical expression. Aswith mathematical symbol recognition, the parsing sys-tem can be writer independent or dependent. We choseto make our parser mostly writer independent becausewe use ascender and descender information (for exam-ple, an ascender would be “b” while a descender wouldbe “p”) from the user’s writing samples to help deal withimplicit operators (such as subscripts, superscripts, andimplied multiplication). A key issue with this approachis making the spatial relationship rules broad enough tocapture how different users write mathematical expres-sions without making them too broad to maintain accu-racy. Unfortunately, no set rule of thumb exists formaking these rules. Therefore, we chose the spatial rulesbased on a neatness and consistency criterion. Of course,not all users will fit within the set criteria, but many will,and those who don’t can adapt to the rules over time.
We based our approach to parsing mathematicalexpressions on two methods: a coordinate grammar8
and procedurally coded syntax rules.9 We chose a coor-dinate grammar for ease of implementation and codedsyntax rules to help resolve ambiguities and to allowmore complex methods for dealing with and reducingparsing decisions. Our coordinate grammar is brokenup into a set of spatial relationship rules and a context-
free grammar. We used the spatial relationship rules toconvert the 2D mathematical expressions into a 1D rep-resentation as we parsed the expression with the con-text-free grammar.
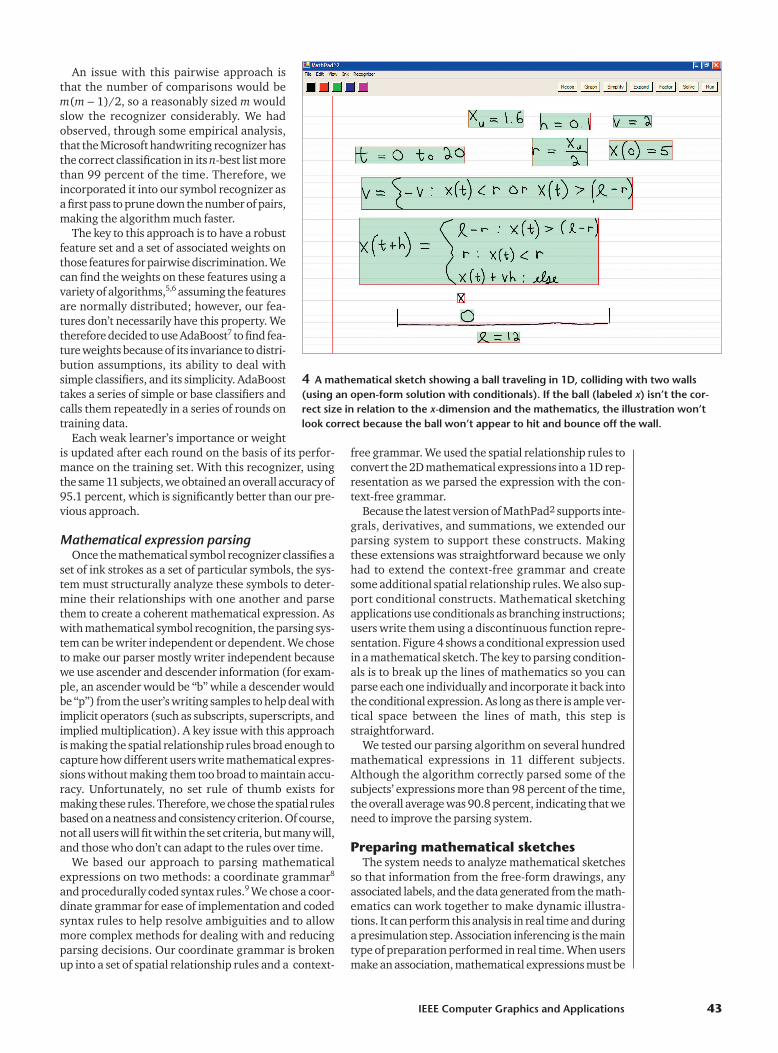
Because the latest version of MathPad2 supports inte-grals, derivatives, and summations, we extended ourparsing system to support these constructs. Makingthese extensions was straightforward because we onlyhad to extend the context-free grammar and createsome additional spatial relationship rules. We also sup-port conditional constructs. Mathematical sketchingapplications use conditionals as branching instructions;users write them using a discontinuous function repre-sentation. Figure 4 shows a conditional expression usedin a mathematical sketch. The key to parsing condition-als is to break up the lines of mathematics so you canparse each one individually and incorporate it back intothe conditional expression. As long as there is ample ver-tical space between the lines of math, this step isstraightforward.
We tested our parsing algorithm on several hundredmathematical expressions in 11 different subjects.Although the algorithm correctly parsed some of thesubjects’ expressions more than 98 percent of the time,the overall average was 90.8 percent, indicating that weneed to improve the parsing system.
Preparing mathematical sketches The system needs to analyze mathematical sketches
so that information from the free-form drawings, anyassociated labels, and the data generated from the math-ematics can work together to make dynamic illustra-tions. It can perform this analysis in real time and duringa presimulation step. Association inferencing is the maintype of preparation performed in real time. When usersmake an association, mathematical expressions must be
IEEE Computer Graphics and Applications 43
4 A mathematical sketch showing a ball traveling in 1D, colliding with two walls(using an open-form solution with conditionals). If the ball (labeled x) isn’t the cor-rect size in relation to the x-dimension and the mathematics, the illustration won’tlook correct because the ball won’t appear to hit and bounce off the wall.
attached to a particular drawing element. The presim-ulation step of mathematical sketch preparation, per-formed just before the sketch animates, gathersimportant information from the sketch so it can runproperly. This requires dimensional analysis and draw-ing rectification.
Association inferencingWhen users make implicit associations they label
drawing elements. We use these labels to determinewhich written mathematical expressions to associatewith a particular drawing element. An expressionshould be associated with a drawing element if it takesany part in that element’s behavioral specification. Wecan associate two types of labels to drawing elements.
■ Constants. With these associations, inferencing is triv-ial: if a label is a number or equal to a number, thelabel is the only mathematical expression collectedand the association is complete. For example, a usermight want to associate the number 100 to a horizon-tal line to indicate its length.
■ Variable names. These associations are slightly morecomplicated than constants because they generallyrefer to other mathematical expressions. We use labelfamilies to infer which mathematical expressions toassociate with the labeled drawing element.1
Drawing dimension analysisMathPad2 assumes a global Cartesian coordinate sys-
tem with the �x-axis pointing to the right and the �y-axis pointing up. However, users must define theoverall scale of the coordinate system�how muchscreen space is equal to one coordinate unit along eitheraxis. Individual drawing elements have their own local
coordinate systems, originating at the ele-ment’s center. However, these local coordinatesystems are scaled based on the global coordi-nate dimensions. Mathematical sketch dimen-sioning is important because the animationsystem needs to know how to transform datafrom simulation to animation space. Withmany mathematical sketch diagrams, enoughinformation is in place for the system to inferthe sketch’s dimensions, either by using thediagram elements’ initial locations or by label-ing linear dimensions within a diagram.1
Drawing rectificationMathematical sketches often have inherent
discrepancies between what the mathematicsspecifies and what the user draws. In otherwords, because users write precise mathemat-ical specifications and make imprecise free-form drawings, the correspondence mismatchbetween the two often yields a dynamic illus-tration that looks incorrect. Rectification is theprocess of fixing the correspondence betweendrawings and mathematics so that somethingmeaningful is displayed. Our previous versionof MathPad2 only supported angle rectifica-tion. Our latest version includes location and
size rectification, which are critical in many of the math-ematical sketches created with open-form solutions (as Idescribe later).
Angle rectification. When an angle is associatedwith mathematics, we rectify the drawing in one of two ways.
First, the system computes the angle between the twolines connected by the angle arc. Next, it determines ifa mathematical expression corresponding to the anglelabel already exists. If so, it rotates the active line asdetermined by the difference between the drawn angleand numerical label to the correct place based on themathematical specification. If not, it uses the angle com-puted from the drawing as the numerical specificationof the angle’s value. Currently, this angle is represent-ed internally and used during simulation.
Our angle-rectification strategy works well whenangles are defined by two isolated drawing elements,but fails in certain situations. For example, two separatedrawing elements must define an angle. If users drawan angle’s initial and terminal sides with one stroke (forexample, the first two sides of a triangle), the angle rec-tification algorithm can’t handle it. We could deal withthis issue by detecting vertices and breaking the strokeinto parts. However, the problem gets more difficultwhen dealing with drawings such as triangles. Moredetails on angle rectification are available elsewhere.2
Location rectification. User drawings often con-tain drawing elements placed in relation to other ele-ments. If a user places a drawing element incorrectlywith respect to other drawing elements and their math-ematical specifications, the dynamic illustration does-n’t look correct and might not present the right
Sketch-Based Interaction
44 January/February 2007
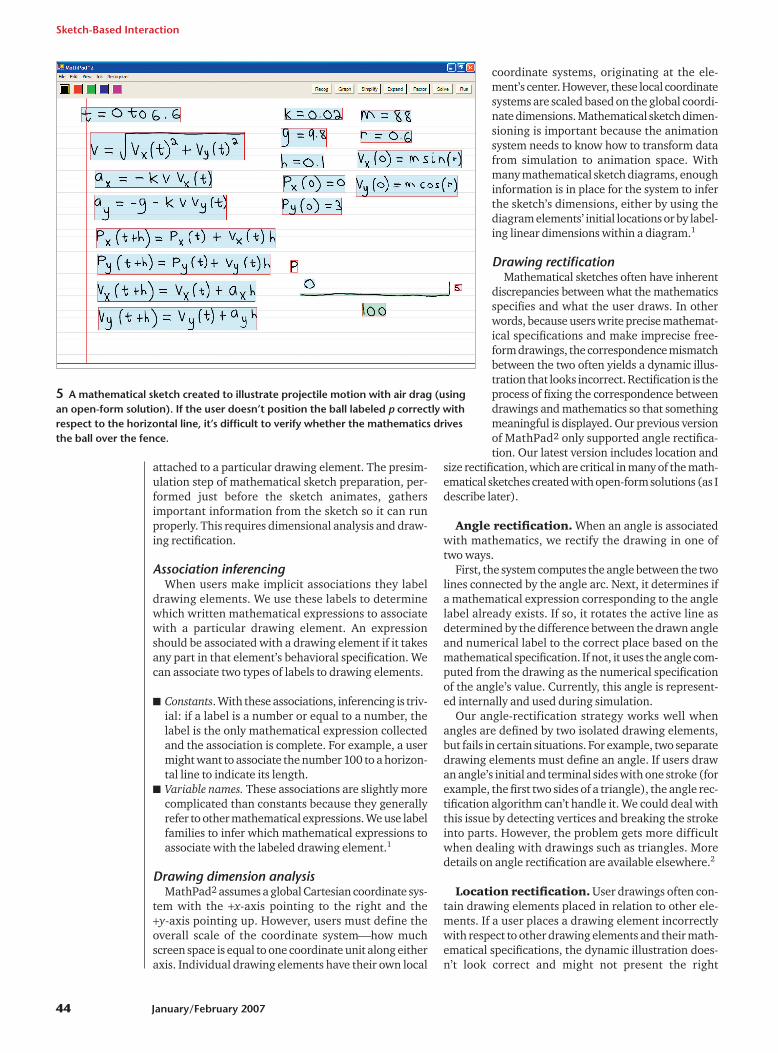
5 A mathematical sketch created to illustrate projectile motion with air drag (usingan open-form solution). If the user doesn’t position the ball labeled p correctly withrespect to the horizontal line, it’s difficult to verify whether the mathematics drivesthe ball over the fence.
visualization. Consider the sketch in Figure 5. The userdraws the ball but positions it a bit to the right on thehorizontal line. However, to see whether the ball willtravel over the fence (a distance of 100 units), the usershould place the ball so that it starts at distance zero,which is at the start of the horizontal line. Because thisis a 2D sketch, the ball should also be placed at a certainheight from the ground. In both cases, we want to placethe ball using the initial conditions of the mathematicalspecification in relation to any labeled drawing ele-ments. In our example, the ball should be at location (0,3) with respect to the horizontal line, because the ini-tial conditions for its position are defined by px(0) andpy(0). The system must now rectify the ball’s position tomake a valid correspondence among the ball, thelabeled lines, and the mathematics.
We begin location rectification by looking at all draw-ing elements associated with functions of time. Wecheck each of these elements for explicitly written initialconditions specified by mathematical expressions,found using the drawing element’s core label. If themathematical expressions associated with the drawingelement contain the core label on the left-hand side ofthe equal sign as a function evaluation, such as px(0)andpy(0), we consider the right-hand sides of these expres-sions as the initial condition values. If there is no corelabel (because an explicit association is used) or noexplicitly written initial conditions, we can still find ini-tial conditions for the drawing element by looking at thesimulation data’s initial values. Once we find a drawingelement’s initial conditions, we examine the remainingdrawing elements and use the information from draw-ing dimension analysis to relocate the drawing element.
We base the drawing element relocations not only onthe dimensioning of an axis, but also on the drawing ele-ment’s location from which that dimension came,because we want to maintain the relationship betweenthe two. Therefore, we examine each drawing elementnot associated with a function of time to see if it has a linelabel and a dimension for the x- or y-axis. If it has a dimen-sion for the x-axis, we look at its start and end x-coordi-nates and choose the smallest, because we assume theorigin along the x-axis is always defined as the drawingelement’s leftmost x-coordinate. With the x-coordinatesfor the origin ox, initial condition px0, and the center ofthe drawing element dx we want to relocate, we calculatea translation factor tx � �(d � ox) � px0 � sax, where sax isthe dimensioning factor for the x-axis defined earlier.
Next, we use tx to translate the drawing element to itsrectified location in the x-direction. If the drawing ele-ment with the associated line label has a dimension forthe y-axis, we use the x translation procedure to trans-late the drawing element we want to rectify in the y-direction, the only difference being that we choose thedrawing element’s bottommost y-coordinate, with theline label as the origin along the y-axis. Choosing theorigin point this way facilitates an origin with the �x-axis pointing to the right and the �y-axis pointing up.
Two important issues arise in our location-rectifica-tion procedure. First, a 2D mathematical sketch mightcontain only one drawing element with a line label,meaning that only the x- or y-axis is dimensioned. Our
drawing dimension procedure handles this by simplydimensioning the other axis with the same dimension-al information. Because location rectification uses theinformation from drawing dimension analysis, a draw-ing element’s relocation will reflect this information.
The other important issue is determining what hap-pens when a sketch contains more than one x- or y-axisline label, resulting in more than one x or y origin coor-dinate. In these cases, we assume that when users makedrawings they intend to put these elements in approxi-mately the right place. We can thus choose the originpoint closest to the drawing element we want to relo-cate. However, if we make this choice, we might take thex- and y-dimensions from another drawing element orelements with line labels. This could override the dimen-sions, but could cause problems if another time-varyingdrawing element uses them. If this happens, we needseparate x- and y-dimensions for each time-varyingdrawing element.
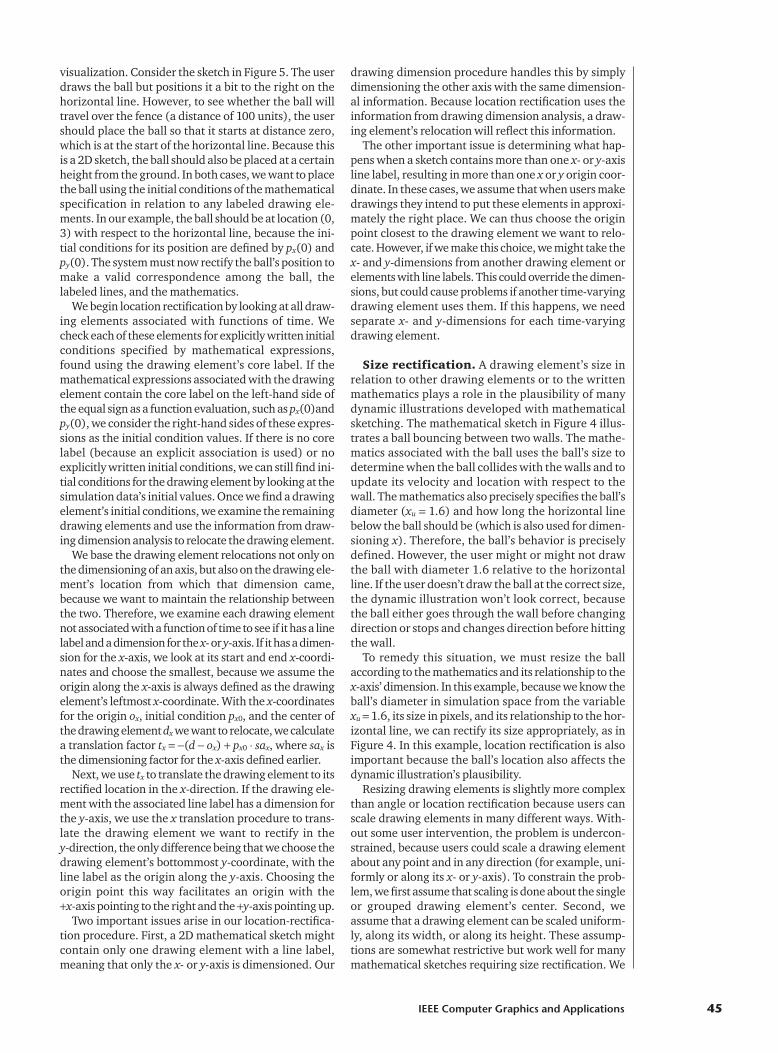
Size rectification. A drawing element’s size inrelation to other drawing elements or to the writtenmathematics plays a role in the plausibility of manydynamic illustrations developed with mathematicalsketching. The mathematical sketch in Figure 4 illus-trates a ball bouncing between two walls. The mathe-matics associated with the ball uses the ball’s size todetermine when the ball collides with the walls and toupdate its velocity and location with respect to thewall. The mathematics also precisely specifies the ball’sdiameter (xu � 1.6) and how long the horizontal linebelow the ball should be (which is also used for dimen-sioning x). Therefore, the ball’s behavior is preciselydefined. However, the user might or might not drawthe ball with diameter 1.6 relative to the horizontalline. If the user doesn’t draw the ball at the correct size,the dynamic illustration won’t look correct, becausethe ball either goes through the wall before changingdirection or stops and changes direction before hittingthe wall.
To remedy this situation, we must resize the ballaccording to the mathematics and its relationship to thex-axis’ dimension. In this example, because we know theball’s diameter in simulation space from the variable xu � 1.6, its size in pixels, and its relationship to the hor-izontal line, we can rectify its size appropriately, as inFigure 4. In this example, location rectification is alsoimportant because the ball’s location also affects thedynamic illustration’s plausibility.
Resizing drawing elements is slightly more complexthan angle or location rectification because users canscale drawing elements in many different ways. With-out some user intervention, the problem is undercon-strained, because users could scale a drawing elementabout any point and in any direction (for example, uni-formly or along its x- or y-axis). To constrain the prob-lem, we first assume that scaling is done about the singleor grouped drawing element’s center. Second, weassume that a drawing element can be scaled uniform-ly, along its width, or along its height. These assump-tions are somewhat restrictive but work well for manymathematical sketches requiring size rectification. We
IEEE Computer Graphics and Applications 45
specify a drawing element’s size using its core label sub-scripted with u, w, or h, respectively.
For example, to specify a drawing element’s width, wewrite xw � <width>. Using this notation works whenmathematics is associated to a drawing element implicit-ly or explicitly and doesn’t place any extra burden on users.
To perform size rectification, we first examine alltime-varying drawing elements, checking to see if anysize information is associated to them. We find size infor-mation by looking at the drawing element’s core labeland determining if any variable names with the corelabel have subscripts with u, h, or w. If so, the algorithmextracts the values assigned to the size variables fromthe right-hand side of these equations. Using the infor-mation from drawing dimension analysis that gives usthe simulation-to-animation-space transformation fac-tors, we create scaling factors for each drawing elementand resize them appropriately. If no core label is pre-sent, the algorithm looks for variables starting with u, w,or h, and extracts the values from those equations.
As with location rectification, size rectification’s com-plexity increases when more than one drawing elementhas a line label, resulting in more than one choice indimensioning the x- and/or y-axis. We can deal with thisproblem, much as in location rectification, by eitherupdating the x- or y-axis dimensions based on whichline-labeled drawing element is closer to the drawingelement we want to rectify or simply keeping multipledimensions for each axis and applying them according-ly during animation.
Another important concern with our size-rectificationapproach is what happens when the associated mathe-matics lacks size information. In these cases, we can stillinfer scale by examining the drawing element’s size inpixels and using the drawing dimensions to create thedrawing element’s correct size in simulation space. How-ever, figuring out the type of size rectification to perform
(for example, uniformly or across width orheight) would be difficult without some userintervention.
Translating and visualizingmathematical sketches
In MathPad2, the mathematical specifica-tions that users write as part of mathematicalsketches are essentially small programs thatmust be translated into the proper format tobe executed in a computational engine (Mat-lab in our case). The data these programs gen-erate, along with information from thesketch-preparation routines, let the animationengine animate drawing elements. However,we want users writing mathematical specifi-cations to perceive them not as a program thatrequires an ordered list of instructions, butrather as a collection of mathematical state-ments that they might write in their notebooksto solve a problem. This collection of mathe-matical statements should be order indepen-dent from the user’s perspective and not havethe rigid structure required by conventionalprogramming languages. To facilitate a more
notational style, the mathematical specifications usedin mathematical sketching don’t require variable decla-rations: users simply write variables and constants with-out any regard to whether they are integers or reals. Themathematical specifications also need not be writtenlinearly: users can write their specifications anywhereon the page, as they might in a notebook.
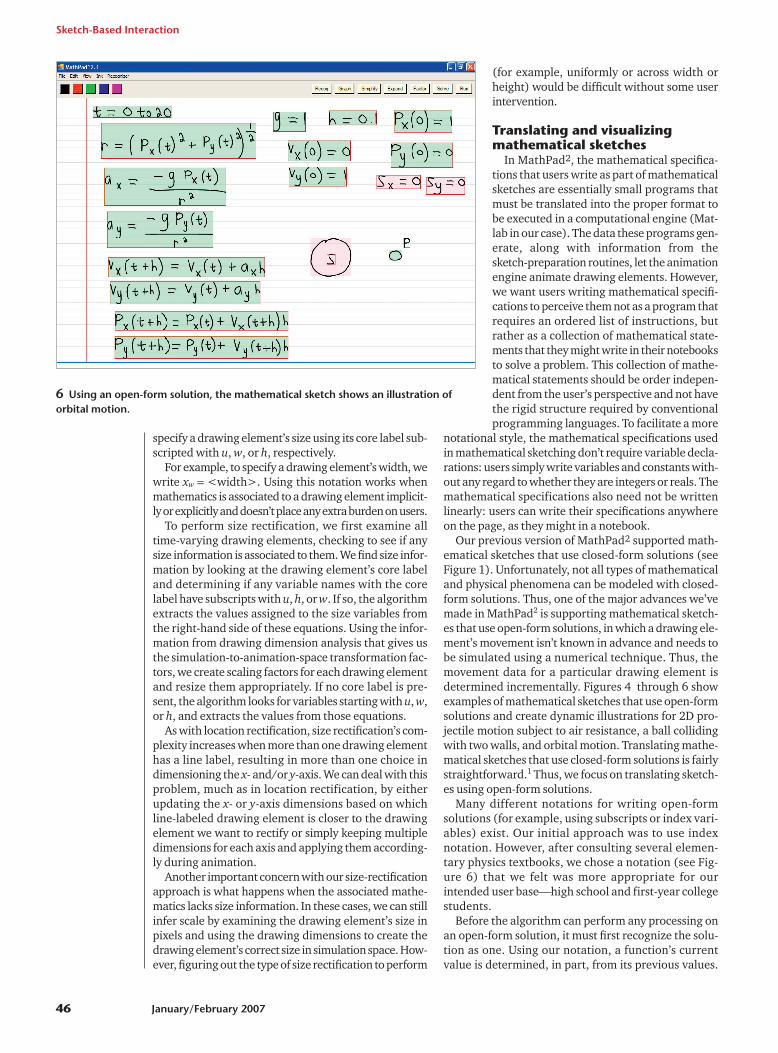
Our previous version of MathPad2 supported math-ematical sketches that use closed-form solutions (seeFigure 1). Unfortunately, not all types of mathematicaland physical phenomena can be modeled with closed-form solutions. Thus, one of the major advances we’vemade in MathPad2 is supporting mathematical sketch-es that use open-form solutions, in which a drawing ele-ment’s movement isn’t known in advance and needs tobe simulated using a numerical technique. Thus, themovement data for a particular drawing element isdetermined incrementally. Figures 4 through 6 showexamples of mathematical sketches that use open-formsolutions and create dynamic illustrations for 2D pro-jectile motion subject to air resistance, a ball collidingwith two walls, and orbital motion. Translating mathe-matical sketches that use closed-form solutions is fairlystraightforward.1 Thus, we focus on translating sketch-es using open-form solutions.
Many different notations for writing open-formsolutions (for example, using subscripts or index vari-ables) exist. Our initial approach was to use indexnotation. However, after consulting several elemen-tary physics textbooks, we chose a notation (see Fig-ure 6) that we felt was more appropriate for ourintended user base�high school and first-year collegestudents.
Before the algorithm can perform any processing onan open-form solution, it must first recognize the solu-tion as one. Using our notation, a function’s currentvalue is determined, in part, from its previous values.
Sketch-Based Interaction
46 January/February 2007
6 Using an open-form solution, the mathematical sketch shows an illustration oforbital motion.
Thus, the left-hand sides of expressions fitting this criteria have as input parameter t � <variable>, wherethe variable is a time increment�for example, px(t � h)� px(t) � a2. We examine the mathematical expressionsassociated with a given drawing element: if any of themhave t � <variable> on the left-hand side of the equalsign and the time increments (that is, the symbol to theright of the “t �”) are all the same variable, we assumean open-form solution.
Open-form solutions have a preprocessing and com-putation step. In the preprocessing step, the algorithm
extracts user-defined function names and their parame-ters from the mathematical expressions associated withdrawing elements. We need to know these names totranslate the expressions to Matlab-compatible stringsand to convert them into proper functions with appro-priate indexing. Once the function names and parame-ters are extracted, the preprocessing step looks foriteration constructs, extracting information from themused in the computation step. The last part of the prepro-cessing routine deals with the initial conditions. If a user-defined function has a number as a parameter (for
IEEE Computer Graphics and Applications 47
Related Work in Creating DynamicIllustrations
The idea of using computers to create dynamicillustrations of mathematical concepts has a long history.One of the earliest dynamic illustration environments wasBorning’s ThingLab, a simulation laboratory environmentfor constructing dynamic models of experiments ingeometry and physics that relied heavily on constraintsolvers and inheritance classes.1 Other systems, such asInteractive Physics and the Geometer’s SketchPad, also letusers create dynamic illustrations. Interactive Physics uses anunderlying physics engine and lets users create a variety of2D dynamic illustrations based on Newtonian mechanics.The Geometer’s SketchPad is a general-purposemathematical visualization tool using geometric constraints.These systems are all WIMP-based and the resulting modeswitching and loss of fluidity within the interface makesthem difficult to use. Although users of these systems canvisualize their illustrations’ dynamic behavior, it’s difficult forthem to gain a solid understanding of the underlyingmathematical phenomena because they can’t write themathematics. Because mathematical sketching useshandwritten mathematical expressions, users can leveragetheir knowledge of mathematical notation to createmathematical sketches. When users actually write themathematics, they gain a better understanding of theconcepts illustrated and can learn from their mistakes.
Special-purpose languages have also been developed tocreate dynamic illustrations. For example, Feiner, Salesin,and Banchoff developed DIAL, a diagrammatic animationlanguage for creating dynamic illustrations of mathematicalconcepts.2 Brown and Sedgewick developed the BrownAlgorithm Simulator and Animator (Balsa), one of the firstsystems for interactive algorithm animation.3 Staskodeveloped the Xtango4 and Samba5 animation systems,which use high-level scripting languages to create dynamicillustrations, with algorithm animation the focus. Squeak,based on the SmallTalk programming language, is a moremodern system for creating dynamic illustrations using ahigh-level scripting language.6
Visual languages for creating dynamic illustrations alsoexist.7 Although these languages are powerful and let userscreate a variety of dynamic illustrations, they require usersto learn a new language and don’t exploit the naturalnessof a pencil-and-paper interaction approach. In contrast,mathematical sketching requires minimal learning, becauseusers already know how to write mathematical expressions.In addition to the WIMP and programmatic approaches to
making dynamic illustrations, pen-based systems have alsobeen developed. For example, Alvarado’s Assist system letsusers sketch diagrams that are recognized as drawingprimitives and sent to a mechanical engineering softwarepackage for simulation.8 A similar system lets users sketchdrawings of simple vibratory mechanical systems; thesystem recognizes the primitives and creates a dynamicillustration of the simulation.9 The key to these systems isthat they use domain knowledge about Newtonianmechanics and recognize users’ sketches as specificprimitives. Thus, although these systems provide powerfulillustrations of physics and mathematics concepts, they’relimited in their domain knowledge and in hiding theunderlying mathematical formulations from the user.Because mathematical sketching uses mathematics as itsprimary method of telling the system how drawings shouldbehave, our approach is more general and users can createmore types of dynamic illustrations.
References1. A. Borning, “ThingLab: A Constraint-Oriented Simulation Labo-
ratory,” doctoral dissertation, Dept. Computer Science, StanfordUniv., 1979.
2. S. Feiner, D. Salesin, and T. Banchoff, “Dial: A Diagrammatic Ani-mation Language,” IEEE Computer Graphics and Applications, vol.2, no. 7, 1982, pp. 43-54.
3. M.H. Brown and R. Sedgewick, “A System for Algorithm Anima-tion,” Proc. Siggraph, ACM Press, 1984, pp. 177-186.
4. J.T. Stasko, “Animating Algorithms with XTANGO,” SIGACT News,vol. 23, no. 2, 1992, pp. 67-71.
5. J.T. Stasko, “Using Student-Built Algorithm Animations as Learn-ing Aids,” tech. report GIT-GVU-96-19, Graphics, Visualization,and Usability Center, Georgia Inst. of Technology, Aug.1996.
6. M. Guzdial, Squeak: Object-Oriented Design with Multimedia Appli-cations, Prentice Hall, 2000.
7. P. Carlson, M. Burnett, and J. Cadiz, “A Seamless Integration ofAlgorithm Animation into a Visual Programming Language,” Proc.Workshop Advanced Visual Interfaces (AVI), ACM Press, 1996, pp.194-202.
8. C.J. Alvarado, “A Natural Sketching Environment: Bringing theComputer into Early Stages of Mechanical Design,” master’s the-sis, Dept. Electrical Eng. and Computer Science, Mass. Inst. ofTechnology, May 2000.
9. L.B. Kara, L. Gennari, and T.F. Stahovich, “A Sketch-Based Inter-face for the Design and Analysis of Simple Vibratory MechanicalSystems,” Proc. ASME Int’l Design Eng. Technical Conf., ASME Press,2004.
example, px(0)), we assume it defines an initial condi-tion for that function.
For each animatable drawing element, the computa-tion step first determines which user-defined functionsshould be included within an iteration construct byexamining their parameters. Using the time incrementvariable found when examining the mathematicalsketch to see if it was an open-form solution, we calcu-late the number of iterations using (Tfinal � Tinitial)/�t, where �t is the time increment variable. With thisinformation, we construct and execute the Matlab codeand store the data in arrays named after the user-definedfunctions in the mathematical specification. Once thedata is generated, the animation engine uses it to ani-mate the dynamic illustration. More details on thisprocess are available elsewhere.2
Preliminary evaluation We conducted a preliminary evaluation of MathPad2
by examining the user interface’s intuitiveness and theapplication’s perceived usefulness.10 We asked sevensubjects to perform tasks such as making mathemati-cal sketches, graphing functions, evaluating expres-sions, and solving equations. The usability study’sresults suggest that the MathPad2 user interface is gen-erally intuitive, with subjects picking up the interfacewith relative ease. With only minimal training, mostgestures are easy to remember and use. One exceptionwas the equation-solving gesture. Some subjects hadtrouble remembering this gesture and performing itaccurately. This indicates that this gesture isn’t as intu-itive as the others.
Although most subjects performed the tasks with lit-tle trouble, a few had some difficulty, stemming primar-ily from problems with mathematical expressionrecognition, indicating that we need better recognitionaccuracy. However, these subjects also said they werewilling to accept these recognition problems, givenMathPad2’s functionality. Finally, subjects thought theapplication was a powerful tool that beginning physicsand mathematics students could use to help solve prob-lems and better understand scientific concepts.
Conclusion With our additions to MathPad2, we’ve made strides
to reaching mathematical sketching’s full potential, butMathPad2 still needs significantly more work before wecan attain the mathematical sketching vision. Onefuture direction to explore is adding an underlyingphysics engine so that users could write down a sketch’smain components (for example, the forces or accelera-tion equations) and have the system fill in the details.We believe that this approach would provide evengreater flexibility in the type of mathematical sketchesMathPad2 can support. ■
Acknowledgments We give special thanks to John Hughes, David Laid-
law, and Andries van Dam for valuable discussions. Agift from Microsoft sponsored this work in part.
References 1. J. LaViola and R. Zeleznik, “MathPad2 : A System for the
Creation and Exploration of Mathematical Sketches,” ACMTrans. Graphics (Proc. Siggraph 2004), vol. 23, no. 3, 2004,pp. 432-440.
2. J. LaViola, “Mathematical Sketching: A New Approach toCreating and Exploring Dynamic Illustrations,” doctoraldissertation, Dept. Computer Science, Brown Univ., 2005.
3. R. Zeleznik and T. Miller, “Fluid Inking: Augmenting theMedium of Free-Form Inking with Gestures,” Proc. Graph-ics Interface, Canadian Human–Computer Comm. Soc.,2006, pp. 155-162.
4. X. Li and D.-Y. Yeung, “On-Line Handwritten Alphanumer-ic Character Recognition Using Dominant Points inStrokes,” Pattern Recognition, vol. 30, no. 1, pp. 31-44.
5. D. Rubine, “Specifying Gestures by Example,” Proc. Sig-graph, ACM Press, 1991, pp. 329-337.
6. S. Smithies, K. Novins, and J. Arvo, “A Handwriting-BasedEquation Editor,” Proc. Graphics Interface, Morgan Kauf-mann, 1999, pp. 84-91.
7. R. Schapire, “A Brief Introduction to Boosting,” Proc. 16thInt’l Joint Conf. Artificial Intelligence, Morgan Kaufmann,1999, pp. 1401-1406.
8. K.-F. Chan and D.-Y. Yeung, “An Efficient SyntacticApproach to Structural Analysis of On-Line HandwrittenMathematical Expressions,” Pattern Recognition, vol. 33,no. 3, 2000, pp. 375-384.
9. H.-J. Lee and J.-S. Wang, “Design of a MathematicalExpression Recognition System,” Pattern Recognition Let-ters, no. 18, 1997, pp. 289-298.
10. J. LaViola, “An Initial Evaluation of a Pen-Based Tool forCreating Dynamic Mathematical Illustrations,” Eurograph-ics Sketch-Based Interfaces and Modeling, 2006, pp. 157-164.
Joseph J. LaViola Jr. is an adjunctassistant research professor in theComputer Science Department atBrown University. His research inter-ests include pen-based interactivecomputing, 3D interaction tech-niques, predictive motion tracking,multimodal interaction in virtual
environments, and user interface evaluation. LaViola hasa PhD in computer science from Brown University. Con-tact him at [email protected].
Sketch-Based Interaction
48 January/February 2007