skema business school the balance of payments iv external debt analysis. balance of... · skema...
TRANSCRIPT

04/10/2017
1
SKEMA BUSINESS SCHOOL
The Balance of Payments IVExternal debt analysis
Michel Henry Bouchet
Roots of external financial crisis
Consumption > Savings =
excessive absorption
Rising money supply
+ large and cheap bank credit
+ budget deficit
Large spending on domestic
and foreign goods
= Shrinking net income
Inflationary pressures
+ exchange rate overvaluation
+ declining FX reserves + flight capital
Balance of payments
crisis - Exchange rate adjustment + control of the money supply:
shrinking creation of reserve money + declining money multiplier of the deposit money banks + interest rate rise + ∆ reserve requirements
- Fiscal adjustment + cuts in public spending
- Structural measures to stimulate competitiveness
IMF’s financing +
macroeconomic
stabilization
ADJUSTMENT
Michel Henry Bouchet (c) Skema 2017 2
Debt restructuring + return to market access (?)

04/10/2017
2
EXTERNAL FINANCING HELPS BOOSTING GDP GROWTH
IIF, Washington, D.C.
WHY/WHEN DOES A FINANCIAL CRISIS ERUPT?GROSS AND NET FLOWS
▶Gross Capital Inflows =
Long-term + Short-term capital flows
▶Net Flows =
Gross Inflows - Debt Repayments
▶Net Transfers =
Net Flows - Interest Payments
▶Total debt service payments =
Debt payments + Interest payments
04/10/2017
3
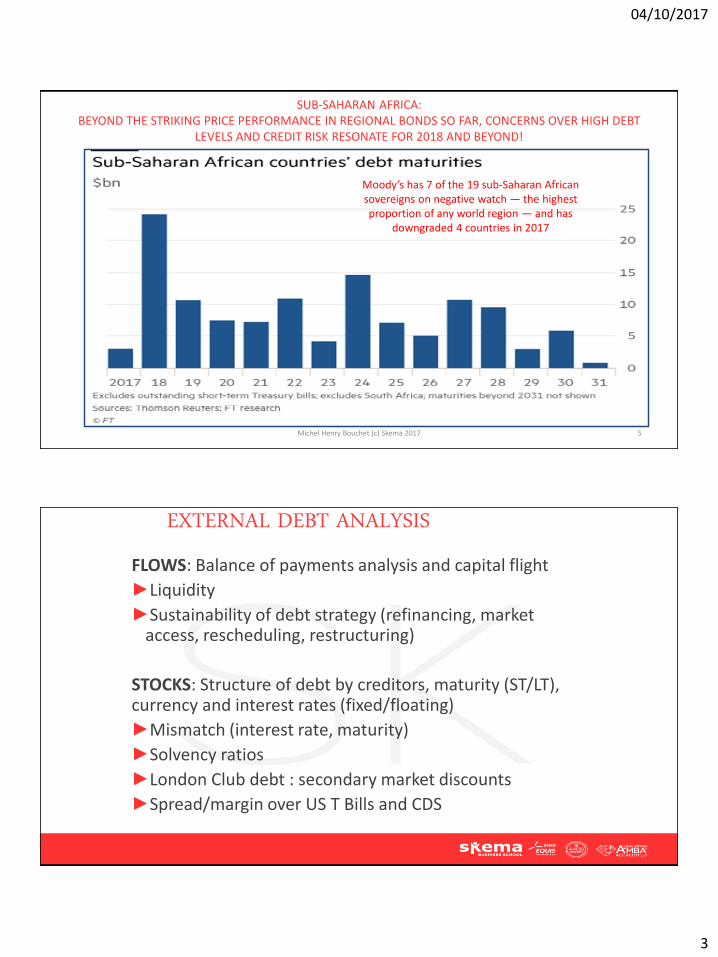
SUB-SAHARAN AFRICA: BEYOND THE STRIKING PRICE PERFORMANCE IN REGIONAL BONDS SO FAR, CONCERNS OVER HIGH DEBT
LEVELS AND CREDIT RISK RESONATE FOR 2018 AND BEYOND!
Michel Henry Bouchet (c) Skema 2017 5
Moody’s has 7 of the 19 sub-Saharan African sovereigns on negative watch — the highest proportion of any world region — and has
downgraded 4 countries in 2017
EXTERNAL DEBT ANALYSISFLOWS: Balance of payments analysis and capital flight
▶Liquidity
▶Sustainability of debt strategy (refinancing, market access, rescheduling, restructuring)
STOCKS: Structure of debt by creditors, maturity (ST/LT), currency and interest rates (fixed/floating)
▶Mismatch (interest rate, maturity)
▶Solvency ratios
▶London Club debt : secondary market discounts
▶Spread/margin over US T Bills and CDS

04/10/2017
4
Michel Henry Bouchet (c) Skema 2017 7
+ Export of goods f.o.b.
- Imports of goods f.o.b.
= Trade balance
+/- Exports/Imports of non-financial services
- Interest payments
+ Investment income (dividends) credit/debit)
+ (-) Private/Official unrequited transfers
= Current account balance
+/- FDI
+/- Portfolio capital Flows
+ LT Capital Inflows
- Debt Servicing Payments
+/- ST Capital Flows
+/- Reserve Variation
RISK MANAGEMENT AND BOP ANALYSIS

04/10/2017
5
Michel Henry Bouchet (c) Skema 2017
EXTERNAL DEBT ANALYSIS:THE DUAL FACE OF COUNTRY RISK
Liquidity Risk
▶Debt Service Ratio:
(P+I/X)
▶Interest Ratio (I/X)
▶Current account/GDP
▶Growth rate of exports/ Average external interest rate
Solvency Risk
▶Debt/Export ratio
▶Debt/GDP ratio
▶Debt/Reserves
▶ST Debt/Total Debt
▶ST Debt/Reserves
▶Reserve/Import ratio
9
LIQUIDITY AND SOLVENCY THRESHOLDS
Stock variable
▶Solvency = Debt/GDP < 100%
Debt/Exports < 150%
Reserves/months of Imports > 6 months
Flow variable
▶Liquidity = Debt Service ratio < 33% of X Interest/X ratio < 25%

04/10/2017
6
Michel Henry Bouchet (c) Skema 2017
EXTERNAL DEBT ANALYSIS I
LIBOR
Average growth rate of Exports of Goods & Services
How to stabilize the Interest/Export ratio?
Necessary condition: the growth rate of exports must be at least equal to the average interest rate on total external indebtedness
Time
Interest payments grow every year at the average interest rate time * overall indebtedness
11
EXTERNAL DEBT ANALYSIS II
▶DEBT t= DEBT t-1 * (1+r) – Primary Budget Balance
▶GDP t = GDP t-1 * (1 + g)
▶DEBT t = DEBT t-1 * (1+r) – Primary Budget Balance
GDP GDP t-1 * (1+g) GDP
DEBTGDP t
DEBT GDP t-1
1 + r
1 + g
- Primary Budget Balance
GDP
Reducing DEBT= Reducing r, increasing g, or boosting primary surplus
r = average rate of interest and g = average GDP growth rate
*=

04/10/2017
7
Michel Henry Bouchet (c) Skema 2017
EXTERNAL DEBT ANALYSIS III
Deficit/GDP
Average Debt/GDP
How to stabilize the Debt/GDP ratio?
Necessary condition: Deficit must be < (Debt/GDP * GDP growth rate)
If Debt/GDP= 85%If GDP growth = 2%
Then deficit must be < 1,7%
Time13
Debt/GDP %Deficit/GDP%
OVERALL NATIONAL DEBT BURDENS
Michel Henry Bouchet (c) Skema 2017
0%
50%
100%
150%
200%
250%
300%
350%
400%
450%
Japan Portugal Spain USA Greece Italy € Zone UK France China Germany
Private Public
0
50
100
150
200
250
Public debt to GDP % 2017
14

04/10/2017
8
GLOBAL PRIVATE SECTOR DEBT IN % OF GLOBAL GDP (COMPANIES AND HOUSEHOLDS)
Michel Henry Bouchet (c) Skema
2017
15
CAPITAL MARKET GLOBALIZATION = INVESTMENT FUNDS AND RATING AGENCIES IN THE DRIVING SEAT
Source: FT, IMF, Natixis, US Treasury 2017 Michel Henry Bouchet (c) Skema 201716
0%
10%
20%
30%
40%
50%
60%
70%
80%
90%
100%Share of Public Debt held by foreign investors in 2017 %

04/10/2017
9
SUCCESSFUL ECONOMIC ADJUSTMENT:LONG-TERM TRENDS IN EMCS’ SOLVENCY RATIOS (DROP IN DEBT/X %)
0
20
40
60
80
100
120
140
160
180
1998 1999 2000 2001 2002 2003 2004 2005 2006 2007 2008 2009 2010 2011 2012 2013 2014 2015 2016 2017
Source: IMF
110% of Exports
35% GDP
Michel Henry Bouchet (c) Skema 2017 17
TWO COUNTRIES = TWO DEBT TRAJECTORIESSolvencia
Public Debt/GDP= 100%
▶Diversified export base
▶Diversified markets
▶Mainly official creditors
▶Long-term maturities= 12 years
▶Fixed rate for 80% of debt
▶Similar currency structure X revenues/liabilities
= no mismatch!
Liquidia
Public Debt/GDP= 100%
▶Main export: hydrocarbons
▶One main export destination: EU
▶X revenues in €/debt payments in $
▶Average debt maturity: 3 years
▶66% of debt on floating rates
▶Large and growing private debt(corporate, bank and households)
▶Large reliance on private capital markets
Michel Henry Bouchet (c) Skema 201718

04/10/2017
10
EXTERNAL FINANCING PROFILES IN 2017-18
GABON
-9%
45%
C
7700
5
8%
164
ECUADOR
-3%
35%
C
6500
2
<1%
114
Michel Henry Bouchet (c) Skema 2017 19
RATIOS
1. CA/GDP
2. Debt/GDP
3. Coface
4. GDP pc $
5. R/M
6. FDI/GDP
7. Doing Bus
VIETNAM
+2%
50%
B
2200
2
8%
82
DEBT DATA?
▶http://www.bis.org/statistics/annex_map.htm
▶http://stats.bis.org/statx/srs/table/A6?c=TN&p=20144
▶http://www.clubdeparis.org/en/communications/page/as-of-31-december-2015

04/10/2017
11
Michel Henry Bouchet (c) Skema
2017
BALANCE of PAYMENTS ($ million) 2003 2004 2005 2006 2007 2008 2009 2010 2011 2012 2013 2014 2015 2016
Trade Balance -1 130 -411 -1 577 -2 494 -4 000 -1 050 1 040 1 270 300 -500 -1 500 -4 000 -3 850 750
Merchandise exports 4 882 6 151 7 910 8 061 9 000 10 500 11 000 12 000 13 800 14000 13500 12000 13650 15000
Merchandise imports -6 012 -6 562 -9 487 -10 555 -13 000 -11 550 -9 960 -10 730 -13 500 -14500 -15000 -16000 -17500 -14250
Balance on Services, Income & Transfers -699 -529 -1 044 -2 201 -3 281 -2 107 -75 629 403 465 -184 -1 967 -3 010 -1 263
Services & income receipts 824 1 008 1 464 1 652 1 447 1 629 2 251 2 594 2 730 2 590 2 769 2 244 2 150 2 750
Exports of services 697 879 1 130 1 152 1 286 1 500 1 571 1 714 1 800 1 750 1 929 1 714 1500 1850
Interest receipts 124 120 317 486 146 70 650 850 900 800 800 500 600 850
Other services & income receipts 2 9 17 15 15 59 30 30 30 40 40 30 50 50
Services & income payments -1 737 -1 832 -3 133 -4 448 -5 197 -4 352 -3 077 -2 796 -3 207 -2 825 -3 452 -4 611 -5 385 -4 913
Imports of services -902 -984 -1 423 -1 583 -1 950 -1 733 -1 494 -1 610 -2 025 -2 175 -2 250 -2 400 -2 625 -2 138
Interest payments -831 -835 -1 681 -2 831 -3 197 -2 460 -1 433 -1 006 -992 -450 -802 -1 711 -2 235 -2 224
Other services & income payments -4 -12 -29 -33 -50 -160 -150 -180 -190 -200 -400 -500 -525 -551
Transfers, net 214 295 625 594 469 616 750 830 880 700 500 400 225 900
Private transfers, net 103 182 320 394 269 565 600 630 630 450 400 300 125 650
Official transfers, net 111 113 305 200 200 51 150 200 250 250 100 100 100 250
Current Account -1 829 -940 -2 621 -4 695 -7 281 -3 157 965 1 899 703 -35 -1 684 -5 967 -6 860 -513
Solvencia - case study
21