sixth national development plan 2011 2015sixth national development plan 2011 – 2015 i foreword...
TRANSCRIPT

Republic of Zambia
SIXTH NATIONAL DEVELOPMENT PLAN
2011 – 2015
“SUSTAINED ECONOMIC GROWTH AND POVERTY REDUCTION”
JANUARY 2011

Sixth National Development Plan 2011 – 2015
i
FOREWORD
The Sixth National Development Plan (SNDP,) which covers the period 2011 – 2015, charts an
ambitious path to transform the lives of Zambians. ThisPlan is the successor to the Fifth National
Development Plan (FNDP), 2006 – 2010, the first in the series of medium-term plans aimed at
making Zambia “a prosperous middle-income country by 2030”.
The SNDP was developed through a consultative process and provides a comprehensive
medium-term strategy for an all inclusive development agenda. It builds on the achievements and
lessons learnt during the implementation of the FNDP.
During the FNDP period, Zambia managed to achieve significant growth averaging 6.1 percent.
Despite this achievement, the nation still faced a number of challenges particularlyin the areas of
infrastructure, human development and effects of the global financial crisis.
In this regard, the theme of the SNDP is “Sustained economic growth and poverty reduction”.
This will be achieved through acceleratedinfrastructureand human development, enhanced
economic growth and diversification,and promotion of rural development.
Delivering development in the country requires concerted efforts and commitment of all
stakeholders. I,therefore, urge all Zambians from all walks of life to be fully committed and
participate in the development process of the country. I call upon the National Development
Coordinating Committee (NDCC), Sector Advisory Groups (SAGs), Provincial Development
Coordinating Committees (PDCCs), District Development Coordinating Committees (DDCCs),
Area Development Committees (ADCs), Cooperating Partners, Civil Society Organizations,
Faith-Based Organizations and the ordinary Zambians to be pillars in the implementation,
supervision and monitoring of progress in the various sectors.
I am convinced that through our joint effort during the next five years, we will be able to achieve
the objectives of the SNDP. I have every confidence in Zambia‟s ability to implement this Plan
efficiently and effectively.
Rupiah Bwezani Banda
PRESIDENT OF THE REPUBLIC OF ZAMBIA

Sixth National Development Plan 2011 – 2015
ii
ACKNOWLEDGEMENT
The development of this Plan has been accomplished with the involvement and participation of
stakeholders.
Let me acknowledge the guidance and technical support from a number of stakeholders, such as
theSector Advisory Groups (SAGs),Cooperating Partners, Provincial Development Coordinating
Committees (PDCCs) and District Development Coordinating Committees (DDCCs). I also wish
to acknowledge the invaluable advice from their Royal Highnesses Traditional Leaders and my
fellow Honourable Members of Parliament.
Lastly, I wish to thank all the Experts and Consultants who, in many and varied ways,
contributed to the formulation of this Plan.
SitumbekoMusokotwane (Dr), MP
MINISTER OF FINANCE AND NATIONAL PLANNING

Sixth National Development Plan 2011 – 2015
iii
TABLE OF CONTENTS
FOREWORD ............................................................................................................................................................................................................................................ I
ACKNOWLEDGEMENT ...................................................................................................................................................................................................................... II
FIGURES VII
ABBREVIATIONS AND ACRONYMS ............................................................................................................................................................................................ VIII
1. INTRODUCTION ............................................................................................................................................................................................................... XII
PART I ................................................................................................................................................................................................................................................ 1
ECONOMIC AND SOCIAL DEVELOPMENTS ............................................................................................................................................................................... 1
2. MACROECONOMIC POLICIES AND STRUCTURAL REFORMS .................................................................................................................................... 2
3. CROSS-CUTTING ISSUES ................................................................................................................................................................................................. 24
4. FINANCING ........................................................................................................................................................................................................................ 47
PART II .............................................................................................................................................................................................................................................. 54
INFRASTRUCTURE .......................................................................................................................................................................................................................... 54
5. TRANSPORT ....................................................................................................................................................................................................................... 55
6. ENERGY .............................................................................................................................................................................................................................. 67
7. HOUSING ............................................................................................................................................................................................................................ 75
PART III .............................................................................................................................................................................................................................................. 80
HUMAN DEVELOPMENT ................................................................................................................................................................................................................ 80
8. HEALTH .............................................................................................................................................................................................................................. 81
9. EDUCATION AND SKILLS DEVELOPMENT .................................................................................................................................................................. 91
10. WATER AND SANITATION ............................................................................................................................................................................................ 101
11. CHILD, YOUTH AND SPORTS DEVELOPMENT .......................................................................................................................................................... 110
PART IV ............................................................................................................................................................................................................................................ 107
GROWTH SECTORS ....................................................................................................................................................................................................................... 107
12. AGRICULTURE, LIVESTOCK AND FISHERIES ........................................................................................................................................................... 108
13. MINING ............................................................................................................................................................................................................................. 120
14. TOURISM .......................................................................................................................................................................................................................... 126
15. MANUFACTURING .......................................................................................................................................................................................................... 133
16. COMMERCE AND TRADE .............................................................................................................................................................................................. 140
PART V ............................................................................................................................................................................................................................................ 146
SUPPORT SECTORS ....................................................................................................................................................................................................................... 146
17. SCIENCE, TECHNOLOGY AND INNOVATION ............................................................................................................................................................ 147
18. INFORMATION AND COMMUNICATIONS TECHNOLOGY ....................................................................................................................................... 153
19. NATURAL RESOURCES .................................................................................................................................................................................................. 158
20. LOCAL GOVERNMENT AND DECENTRALISATION .................................................................................................................................................. 168
21. SOCIAL PROTECTION ..................................................................................................................................................................................................... 174
PART VI ............................................................................................................................................................................................................................................ 179
REGIONAL DEVELOPMENT ........................................................................................................................................................................................................ 179
22. REGIONAL DEVELOPMENT .......................................................................................................................................................................................... 180
PART VII ........................................................................................................................................................................................................................................... 210
MONITORING AND EVALUATION INSTITUTIONAL ARRANGEMENT ............................................................................................................................ 210
23. IMPLEMENTATION, MONITORING AND EVALUATION INSTITUTIONAL ARRANGEMENT ............................................................................. 211
Sixth National Development Plan 2011 – 2015
iv
TABLES TABLE 1: MACROECONOMIC PERFORMANCE (2006-2009) ........................................................................................................................................ 3
TABLE 2: DOMESTIC REVENUE PERFORMANCE DURING THE FNDP AS PERCENTAGE OF GDP .................................................................................. 4
TABLE 3: NATIONAL KEY PERFORMANCE INDICATORS ........................................................................................................................................... 13
TABLE 4: OBJECTIVES, STRATEGIES AND PROGRAMMES ......................................................................................................................................... 20
TABLE 5: SECTOR OUTPUT MATRIX ........................................................................................................................................................................ 21
TABLE 6: KEY PERFORMANCE INDICATORS ............................................................................................................................................................. 23
TABLE 7: OBJECTIVES, STRATEGIES AND PROGRAMMES ......................................................................................................................................... 25
TABLE 8: SECTOR OUTPUT MATRIX ........................................................................................................................................................................ 25
TABLE 9: KEY PERFORMANCE INDICATORS ............................................................................................................................................................. 26
TABLE 10: SECTOR BUDGET AND FINANCING (K‟ BILLION) - GOVERNANCE ........................................................................................................... 27
TABLE 11: OBJECTIVES, STRATEGIES AND PROGRAMMES ....................................................................................................................................... 29
TABLE 12: KEY PERFORMANCE INDICATORS ........................................................................................................................................................... 29
TABLE 13: OBJECTIVES, STRATEGIES AND PROGRAMMES ....................................................................................................................................... 31
TABLE 14: SECTOR OUTPUT MATRIX ...................................................................................................................................................................... 31
TABLE 15: KEY PERFORMANCE INDICATORS ........................................................................................................................................................... 32
TABLE 16: SECTOR BUDGET AND FINANCING (K‟ BILLION) - GENDER .................................................................................................................... 33
TABLE 17: OBJECTIVES, STRATEGIES AND PROGRAMMES ....................................................................................................................................... 34
TABLE 18: KEY PERFORMANCE INDICTORS ............................................................................................................................................................. 35
TABLE 19: OBJECTIVES, STRATEGIES AND PROGRAMMES ....................................................................................................................................... 36
TABLE 20: SECTOR BUDGET AND FINANCING – DISABILITY AND DEVELOPMENT ................................................................................................... 37
TABLE 21: OBJECTIVES, STRATEGIES AND PROGRAMMES ....................................................................................................................................... 38
TABLE 22: SECTOR OUTPUT MATRIX ...................................................................................................................................................................... 39
TABLE 23: KEY PERFORMANCE INDICATORS ........................................................................................................................................................... 41
TABLE 24 : SECTOR BUDGET AND FINANCING (K‟ BILLION) – ENVIRONMENT ........................................................................................................ 42
TABLE 25: OBJECTIVES, STRATEGIES AND PROGRAMMES ....................................................................................................................................... 43
TABLE 26: SECTOR OUTPUT MATRIX ...................................................................................................................................................................... 44
TABLE 27: KEY PERFORMANCE INDICATORS ........................................................................................................................................................... 45
TABLE 28: SECTOR BUDGET AND FINANCING (K‟ BILLION) – DISASTER RISK MANAGEMENT ................................................................................ 46
TABLE 29: PROJECTED REVENUES AND EXPENDITURES AS A SHARE OF GDP (%) .................................................................................................. 47
TABLE 30: ESTIMATES OF RESOURCES AVAILABLE FOR SNDP PROGRAMMES ....................................................................................................... 48
TABLE 31: ALLOCATION OF RESOURCES BY SECTORS (K‟ BILLION) ....................................................................................................................... 50
TABLE 32: PIPELINE PROJECTS UNDER PPP ............................................................................................................................................................. 52
TABLE 33: OBJECTIVES, STRATEGIES AND PROGRAMMES-ROADS, BRIDGES AND RAILWAYS ................................................................................. 59
TABLE 34: OBJECTIVES, STRATEGIES AND PROGRAMMES - MARITIME AND INLAND WATERWAYS ........................................................................ 59
TABLE 35: OBJECTIVES, STRATEGIES AND PROGRAMMES -AIR TRANSPORT ........................................................................................................... 60
TABLE 36: SECTOR OUTPUT MATRIX ...................................................................................................................................................................... 60
TABLE 37: KEY PERFORMANCE INDICATORS - AIR TRANSPORT .............................................................................................................................. 62
TABLE 38: SECTOR BUDGET AND FINANCING (K‟ BILLION) - ROADS AND BRIDGES* ............................................................................................. 63
TABLE 39: SECTOR BUDGET AND FINANCING (K‟ BILLION) - RAILWAY TRANSPORT .............................................................................................. 63
TABLE 40: SECTOR BUDGET AND FINANCING (K‟ BILLION) - AIR TRANSPORT ....................................................................................................... 64
TABLE 41: SECTOR BUDGET AND FINANCING (K‟ BILLION)–MARITIME AND INLAND WATER TRANSPORT ............................................................ 65
TABLE 42: OBJECTIVES, STRATEGIES AND PROGRAMMES ....................................................................................................................................... 70
TABLE 43: SECTOR OUTPUT MATRIX ...................................................................................................................................................................... 71
TABLE 44: KEY PERFORMANCE INDICATORS ........................................................................................................................................................... 73
TABLE 45: SECTOR BUDGET AND FINANCING (K‟ BILLION) - ENERGY .................................................................................................................... 74
TABLE 46: OBJECTIVES STRATEGIES AND PROGRAMMES ........................................................................................................................................ 76
TABLE 47: SECTOR OUTPUT MATRIX ...................................................................................................................................................................... 77
TABLE 48: KEY PERFORMANCE INDICATORS ........................................................................................................................................................... 78
TABLE 49: SECTOR BUDGET AND FINANCING (K‟ BILLION) - HOUSING .................................................................................................................. 79
TABLE 50: OBJECTIVES, STRATEGIES AND PROGRAMMES ....................................................................................................................................... 85
TABLE 51:SECTOR OUTPUT MATRIX ....................................................................................................................................................................... 87
TABLE 52: KEY PERFORMANCE INDICATORS ........................................................................................................................................................... 89
TABLE 53:SECTOR BUDGET AND FINANCING (K‟ BILLION) - HEALTH ..................................................................................................................... 90
TABLE 54: OBJECTIVES, STRATEGIES AND PROGRAMMES ....................................................................................................................................... 94
TABLE 55: SECTOR OUTPUT MATRIX ...................................................................................................................................................................... 96
TABLE 56: KEY PERFORMANCE INDICATORS ........................................................................................................................................................... 98
TABLE 57: SECTOR BUDGET AND FINANCING (K‟ BILLION) – EDUCATION AND SKILLS DEVELOPMENT ............................................................... 100
TABLE 58: OBJECTIVES, STRATEGIES AND PROGRAMMES - WATER RESOURCES MANAGEMENT AND DEVELOPMENT ......................................... 103
TABLE 59: OBJECTIVES, STRATEGIES AND PROGRAMMES - WATER SUPPLY AND SANITATION ............................................................................. 104

Sixth National Development Plan 2011 – 2015
v
TABLE 60: SECTOR OUTPUT MATRIX - WATER RESOURCES MANAGEMENT AND DEVELOPMENT ......................................................................... 105
TABLE 61: SECTOR OUTPUT MATRIX - WATER SUPPLY AND SANITATION ............................................................................................................ 107
TABLE 62: KEY PERFORMANCE INDICATORS WATER SUPPLY AND SANITATION ................................................................................................... 108
TABLE 63: SECTOR BUDGET AND FINANCING (K‟ BILLION) – WATER DEVELOPMENT .......................................................................................... 109
TABLE 64: SECTOR BUDGET AND FINANCING (K‟ BILLION) – WATER AND SANITATION ...................................................................................... 109
TABLE 65: OBJECTIVES, STRATEGIES AND PROGRAMMES ..................................................................................................................................... 111
TABLE 66: SECTOR OUTPUT MATRIX .................................................................................................................................................................... 112
TABLE 67: KEY PERFORMANCE INDICATORS ......................................................................................................................................................... 113
TABLE 68: SECTOR BUDGET AND FINANCING (K‟ BILLION) – CHILD, YOUTH AND SPORTS DEVELOPMENT ......................................................... 114
TABLE 69: CROP PRODUCTION IN METRIC TONNES (2005-2010) .......................................................................................................................... 109
TABLE 70: LIVESTOCK PRODUCTION (2006-2009) ................................................................................................................................................. 110
TABLE 71: FISH PRODUCTION IN METRIC TONNES (2005-2009) ............................................................................................................................ 110
TABLE 72: OBJECTIVES, STRATEGIES AND PROGRAMMES - CROPS ........................................................................................................................ 112
TABLE 73: OBJECTIVES, STRATEGIES AND PROGRAMMES - LIVESTOCK AND FISHERIES ....................................................................................... 114
TABLE 74: SECTOR OUTPUT MATRIX .................................................................................................................................................................... 115
TABLE 75: KEY PERFORMANCE INDICATORS ......................................................................................................................................................... 118
TABLE 76: SECTOR BUDGET AND FINANCING (K‟ BILLION)- AGRICULTURE, LIVESTOCK AND FISHERIES ............................................................ 119
TABLE 77: EXPLORATION PROJECTS 2006-2010 .................................................................................................................................................... 121
TABLE 78: OBJECTIVES, STRATEGIES AND PROGRAMMES ..................................................................................................................................... 122
TABLE 79: SECTOR OUTPUT MATRIX .................................................................................................................................................................... 123
TABLE 80: KEY PERFORMANCE INDICATORS ......................................................................................................................................................... 124
TABLE 81: SECTOR BUDGET AND FINANCING (K‟ BILLION) - MINING ................................................................................................................... 125
TABLE 82: OBJECTIVES, STRATEGIES AND PROGRAMMES...................................................................................................................................... 128
TABLE 83:SECTOR OUTPUT MATRIX ..................................................................................................................................................................... 130
TABLE 84: KEY PERFORMANCE INDICATORS ......................................................................................................................................................... 131
TABLE 85: SECTOR BUDGET AND FINANCING (K‟ BILLION) – TOURISM – ARTS AND CULTURE ............................................................................ 132
TABLE 86: OBJECTIVES, STRATEGIES AND PROGRAMMES ..................................................................................................................................... 136
TABLE 87: SECTOR OUTPUT MATRIX .................................................................................................................................................................... 137
TABLE 88: KEY PERFORMANCE INDICATORS ......................................................................................................................................................... 138
TABLE 89: SECTOR BUDGET AND FINANCING (K‟ BILLION) - MANUFACTURING ................................................................................................... 139
TABLE 90: OBJECTIVES, STRATEGIES AND PROGRAMMES ..................................................................................................................................... 142
TABLE 91: SECTOR OUTPUT MATRIX .................................................................................................................................................................... 143
TABLE 92: KEY PERFORMANCE INDICATORS ......................................................................................................................................................... 144
TABLE 93: SECTOR BUDGET AND FINANCING (K‟ BILLION) – COMMERCE AND TRADE ........................................................................................ 145
TABLE 94: OBJECTIVES, STRATEGIES AND PROGRAMMES ..................................................................................................................................... 149
TABLE 95: SECTOR OUTPUT MATRIX .................................................................................................................................................................... 149
TABLE 96: KEY PERFORMANCE INDICATORS ......................................................................................................................................................... 151
TABLE 97: SECTOR BUDGET AND FINANCING (K‟ BILLION) – SCIENCE, TECHNOLOGY AND INNOVATION ............................................................ 152
TABLE 98: OBJECTIVES, STRATEGIES AND PROGRAMMES ..................................................................................................................................... 155
TABLE 99: SECTOR OUTPUT MATRIX .................................................................................................................................................................... 155
TABLE 100: KEY PERFORMANCE INDICATORS ....................................................................................................................................................... 156
TABLE 101: SECTOR BUDGET AND FINANCING (K‟ BILLION) – INFORMATION AND COMMUNICATIONS TECHNOLOGY ........................................ 157
TABLE 102: OBJECTIVES, STRATEGIES AND PROGRAMMES ................................................................................................................................... 159
TABLE 103: SECTOR OUTPUT MATRIX .................................................................................................................................................................. 161
TABLE 104: KEY PERFORMANCE INDICATOR MATRIX........................................................................................................................................... 166
TABLE 105: SECTOR BUDGET AND FINANCING (K‟ BILLION) – NATURAL RESOURCE ........................................................................................... 167
TABLE 106: OBJECTIVES, STRATEGIES AND PROGRAMMES ................................................................................................................................... 169
TABLE 107: SECTOR OUTPUT MATRIX .................................................................................................................................................................. 170
TABLE 108: KEY PERFORMANCE INDICATORS ....................................................................................................................................................... 171
TABLE 109: SECTOR BUDGET AND FINANCING (K‟ BILLION) – LOCAL GOVERNMENT AND DECENTRALISATION ................................................. 173
TABLE 110: OBJECTIVES, STRATEGIES AND PROGRAMMES ................................................................................................................................... 175
TABLE 111: SECTOR OUTPUT MATRIX .................................................................................................................................................................. 176
TABLE 112: KEY PERFORMANCE INDICATORS ....................................................................................................................................................... 177
TABLE 113: SECTOR BUDGET AND FINANCING (K‟ BILLION) – SOCIAL PROTECTION ............................................................................................ 178
TABLE 114: RURAL ROADS - 2009 ......................................................................................................................................................................... 181
TABLE 115: 2005 AND 2010 CROP PRODUCTION FIGURES (IN METRIC TONNES) ................................................................................................... 182
TABLE 116: BASIC EDUCATION INFRASTRUCTURE DURING THE FNDP PERIOD 2006 - 2009 ................................................................................. 183
TABLE 117: HEALTH RELATED INFRASTRUCTURE CONSTRUCTED DURING THE FNDP PERIOD............................................................................. 183
TABLE 118: WATER PROGRAMMES BY PROVINCE ................................................................................................................................................. 184
TABLE 119: PROVINCIAL DEVELOPMENT INDEX (PDI) .......................................................................................................................................... 186
TABLE120: OBJECTIVES, STRATEGIES AND PROGRAMMES ................................................................................................................................... 188

Sixth National Development Plan 2011 – 2015
vi
TABLE 121: OBJECTIVES, STRATEGIES AND PROGRAMMES .................................................................................................................................. 190
TABLE 122: OBJECTIVES, STRATEGIES AND PROGRAMMES .................................................................................................................................. 192
TABLE 123: OBJECTIVES, STRATEGIES AND PROGRAMMES .................................................................................................................................. 193
TABLE 124: OBJECTIVES, STRATEGIES AND PROGRAMMES .................................................................................................................................. 195
TABLE 125: OBJECTIVES, STRATEGIES ANDPROGRAMMES .................................................................................................................................... 197
TABLE 126: OBJECTIVES, STRATEGIES AND PROGRAMMES ................................................................................................................................... 199
TABLE 127: OBJECTIVES, STRATEGIES AND PROGRAMMES ................................................................................................................................... 201
TABLE 128: OBJECTIVES, STRATEGIES AND PROGRAMMES ................................................................................................................................... 203
TABLE 129: UNDER FIVE MORTALITY AND INFANT MORTALITY BASELINE (2007) .............................................................................................. 208
TABLE 130: REGIONAL BUDGET AND FINANCING (K‟ BILLION) ............................................................................................................................ 209
Sixth National Development Plan 2011 – 2015
vii
FIGURES
FIGURE 1: PERFORMANCE CHAIN FRAMEWORK ...................................................................................................................................................... 12
FIGURE 2 : PAVED ROAD NETWORK CONDITION (TMD) ......................................................................................................................................... 56
FIGURE 3: UNPAVED TMD ROAD NETWORK CONDITION ........................................................................................................................................ 57
FIGURE 4: CONTRIBUTIONS OF MANUFACTURING SECTOR 2006-2009 .................................................................................................................. 133
FIGURE 5: PERCENTAGE GROWTH OF MANUFACTURING SECTOR (2005-2009) ..................................................................................................... 134
FIGURE 6: PERCENTAGE CHANGE IN SUB-SECTOR GROWTH TO THE CONTRIBUTION OF MANUFACTURING GDP (2005 – 2009) ........................... 134
FIGURE 7: TRADE FLOWS (2006-2009) .................................................................................................................................................................. 140
FIGURE 8: SHARE OF NON-TRADITIONAL EXPORTS TO TOTAL EXPORTS 2006-2009 ............................................................................................. 141
FIGURE 9: POVERTY AND INCOME- POVERTY LEVELS (2006) ................................................................................................................................ 205
FIGURE 10: HOUSEHOLD INCOME (2006) ............................................................................................................................................................... 206
FIGURE 11: EDUCATION - COMPLETION RATES (2006) .......................................................................................................................................... 206
FIGURE 12: ENROLMENT RATES BY PROVINCE (2006) ........................................................................................................................................... 207
FIGURE 13: HEALTH – UNDERWEIGHT PREVALENCE (2007) ................................................................................................................................. 208
FIGURE 14: INSTITUTIONAL ARRANGEMENT FOR PLANS IMPLEMENTATION ......................................................................................................... 212
Sixth National Development Plan 2011 – 2015
viii
ABBREVIATIONS AND ACRONYMS ACC Anti-Corruption Commission ADCs Area Development Committees
AIDS Acquired Immune-Deficiency Syndrome ABS Access Benefit Sharing
APR Annual Progress Report
APRM African Peer Review Mechanism ARV Anti-Retro Viral
ART Anti-Retroviral Therapy
BHCP Basic Health Care Package BO Budget Office
CBPP Contagious Bovine Pleuro-Pneumonia
CBC Community Based Care CBU Copperbelt University
CCS Commitment Control System
CCT Confidential Counselling and Testing CDF Constituency Development Fund
CDM Clean Development Mechanisms
CEC Copperbelt Electricity Cooperation CEDAW Convention on the Elimination of All Forms of Discrimination against Women
CEEC Citizens Economic Empowerment Commission
CFI Commission for Investigation COSETCO Copperbelt Secondary Teachers‟ College
CPs Cooperating Partners
CPD Continuous Professional Development CSO Central Statistical Office
CSOs Civil Society Organisations
CT Counselling and Testing CVRI Central Veterinary Research Institute
DDCCs District Development Coordinating Committees
DEC Drug Enforcement Commission DFZ Disease Free Zone
DIP Decentralisation Implementation Plan
DMMU Disaster Management and Mitigation Unit DoL Division of Labour
DPP Director of Public Prosecution
DPOs Disabled Persons Organisations DS Decentralisation Secretariat
DTTM Digital Terrestrial Television Migration
DWA Department of Water Affairs EAZ Economics Association of Zambia
ECCDE Early Childhood Care, Development and Education
ECF East Coast Fever ECZ Electoral Commission of Zambia
ECZ Environmental Council of Zambia
EER Environmental Emergency Response EIA Environmental Impact Assessment
EMoC Emergency Obstetric Care
ENRMMP Environmental and Natural Resources Management, and Mainstreaming Programme EPAs Economic Partnership Agreements
FANTA Food and Nutrition Technical Assistance
FD Forestry Department FDI Foreign Direct Investment
FIs Financial Institutions FMD Foot and Mouth Disease
FNDP Fifth National Development Plan
FTA Free Trade Area FTAs Free Trade Agreements
FTCs Farmer Training Centres
FTI Farmer Training Institute FSDP Financial Sector Development Programme
GBV Gender Based Violence
GDP Gross Domestic Product GHG Green House Gas
GIDD Gender in Development Division
GMA Game Management Area GMPs Game Management Plans
GNI Gross National Income

Sixth National Development Plan 2011 – 2015
ix
GPI Gender Parity Index
GRZ Government of the Republic of Zambia GS Governance Secretariat
Ha Hectares
HARID Home Affairs Research, Planning and Information Department HBC Home Based Care
HCAZ Hotel and Catering Association of Zambia
HFIAS Household Food Insecurity and Access Scale HIV Human Immune-Deficiency Virus
HQ Headquarters
HRC Human Rights Commission HTTIT Hotel and Tourism Training Institute Trust
IAD Internal Audit Department
ICT Information and Communications Technology IDPs Integrated Development Plans
IFMIS Integrated Financial Management Information System
IKS Indigenous Knowledge System ITCP Inter-Agency Technical Committee on Population
IWRM-WEP Integrated Water Resources Management and Water Efficiency Plan
JASZ Joint Assistance Strategy for Zambia KPIs Key Performance Indicators
Kw Kilowatts
K-Economy Knowledge and Innovation Economy LAs Local Authorities
LCHs Low Capacity Households
LCMS Living Conditions Monitoring Survey LDT Livestock Development Trust
LSEN Learners with Special Education Needs MACO Ministry of Agriculture and Cooperatives
M & E Monitoring and Evaluation
MCDSS Ministry of Community Development and Social Security MCT Ministry of Communication and Transport
MCTI Ministry of Commerce, Trade and Industry
MDGs Millennium Development Goals MEWD Ministry of Energy and Water Development
MFEZ Multi-Facility Economic Zone
MHA Ministry of Home Affairs
MIBS Ministry Of Information and Broadcasting Services
MICE Meetings, Incentives, Conventions and Exhibitions
MIS Management Information Systems MLFD Ministry of Livestock and Fisheries Development
MLGH Ministry of Local Government and Housing
MLSS Ministry of Labour and Social Security MMMD Ministry of Mines and Minerals Development
MNCH Maternal New-born and Child Health
MoESPs Ministry of Education Strategic Plans MOE Ministry of Education
MoFNP Ministry of Finance and National Planning
MoH Ministry of Health MoJ Ministry of Justice
MPs Members of Parliament
MPSAs Ministries, Provinces and other Spending Agencies MSc Master of Science
MSME Micro, Small and Medium-scale Enterprises
MSTVT Ministry of Science Technology and Vocational Training MSYCD Ministry of Sport, Youth and Child Development
Mt Metric Tonnes
MTCT Mother To Child Transmission MTEF Medium-Term Expenditure Framework
MTENR Ministry of Tourism Environment and Natural Resources
MNTE Maternal Neonatal Tetanus Elimination MTR Mid-Term Review
MWS Ministry of Works and Supply
NAC National AIDS Council NACP National Anti-Corruption Policy
NBSAP National Biodiversity Strategy and Action Plan
NDP National Development Plan NDP National Decentralisation Policy
NDPs National Development Plans
NDCC National Development Coordinating Committee

Sixth National Development Plan 2011 – 2015
x
NEAC National Economic Advisory Council
NEPAD New Economic Partnership for African Development NER Net Enrolment Ratio
NFNC National Food and Nutrition Commission
NGOs Non–Governmental Organisations NGOCC Non-Governmental Organisation Coordinating Council
NHA National Housing Authority
NHCC National Heritage Conservation Commission NIFs National Implementation Frameworks
NISIR National Institute for Scientific and Industrial Research
NMB National Museum Board NPE National Policy on Environment
NRDC Natural Resources Development College
NRWSSP National Rural Water Supply and Sanitation Programme NTEs Non-Traditional Exports
NTIMP National Transport Infrastructure Master Plan
NUWSSP National Urban Water Supply and Sanitation Programme NWASCO National Water Supply and Sanitation Council
OAG Office of the Auditor General
ODA Official Development Assistance OSBP One Stop Border Post
OVC Orphans and other Vulnerable Children
OVP Office of the Vice President PDCCs Provincial Development Coordinating Committees
PDI Provincial Development Index
PEMFA Public Expenditure Management and Financial Accountability PFM Public Financial Management
PhD Doctor of Philosophy PMTCT Prevention of Mother-To-Child Transmission
PPPs Public Private Partnerships
PS Prison Services PRSP Poverty Reduction Strategy Paper
PSDRP Private Sector Development Reform Programme
PSMD Public Service Management Division PSRP Public Service Reform Programme
PTR Pupil Teacher Ratio
PWAS Public Welfare Assistance Scheme
PWDs Persons with Disabilities
R & D Research and Development
RDA Road Development Agency RDP Research Development Programme
RDI Research, Development and Innovation
REMP Rural Electrification Master Plan ROADSIP Road Sector Investment Programme
RSZ Railway Systems of Zambia
RWSS Rural Water Supply and Sanitation SADC Southern African Development Community
SAGs Sector Advisory Groups
SCCI Seed Control and Certification Institute SEED Support to Economic Expansion Diversification
SGBV Sexual and Gender Based Violence
SCTs Social Cash Transfers SNDP Sixth National Development Plan
STI Science, Technology and Innovation
STR Simplified Trade Regime SME‟s Small and Medium Scale Enterprises
SWAPs Sector Wide Approach Programmes
TADs Trans-boundary Animal Diseases TAZARA Tanzania-Zambia Railways Authority
TB Tuberculosis
TCZ Tourism Council of Zambia TDAU Technology Development Advisory Unit
TDRC Tropical Diseases Research Centre
TEVET Technical Education, Vocational and Entrepreneurship Training TMD Trunk, Main and District Roads
TNDP Transitional National Development Plan
TSA Treasury Single Account UNCRPD United Nations Convention on the Rights of Persons With Disabilities
UNZA University of Zambia
UPP Uniform Petroleum Prices

Sixth National Development Plan 2011 – 2015
xi
UTH University Teaching Hospital
UWSS Urban Water Supply and Sanitation VAT Value Added Tax
VCT Voluntary Counselling and Testing
VSU Victim Support Unit WMO World Maritime Organisation
WRMD Water Resources Management and Development
WSS Water Supply and Sanitation WHO World Health Organisation
ZABS Zambia Bureau of Standards
ZACSMBA Zambia Chambers of Small and Medium Business Association ZADP Zambia Association of Persons with Disabilities
ZAMISE Zambia Institute of Special Education
ZAPD Zambia Agency for Persons with Disabilities ZARI Zambia Agricultural Research Institute
ZDA Zambia Development Agency
ZDHS Zambia Demographic Health Survey ZAMISE Zambia Institute of Special Education
ZAMTEL Zambia Telecommunications Company Limited
ZAWA Zambia Wildlife Authority ZNS Zambia National Service
ZP Zambia Police
ZRA Zambia Revenue Authority ZRL Zambia Railways Limited

Sixth National Development Plan 2011 – 2015
xii
1. INTRODUCTION
The Sixth National Development Plan (SNDP) 2011–2015 is the successor to the Fifth National
Development Plan (FNDP), aimed at actualising the aspirations of the Vision 2030 of becoming
“a prosperous middle-income nation by 2030”. While the FNDP set the pace for improving
economic infrastructure and investing in human development, the SNDP aims to build on the
gains of the FNDP in the process of attaining the Vision 2030.
During the FNDP period, the economy attained macroeconomic stability and continued
economic growth averaging 6.1 percent while also achieving positive gains in infrastructure
development. In the social sectors there was generally an improvement in the Maternal and
Infant Mortality Rates and Education Enrolment Rates. Despite the gains, the reductions in
unemployment and poverty levels were not significant.
The theme of the SNDP is “Sustained economic growth and poverty reduction”. In line with
this theme, the SNDP focuses on policies, strategies and programmes that will contribute
significantly to addressing the challenges of realising broad-based pro-poor growth, employment
creation and human development. Thus, the strategic focus of the SNDP is “infrastructure and
human development”. The focus is guided by the principles of accountability, decentralization
and efficient resource allocation.
The objectives of the SNDP are to: accelerate infrastructure development; economic growth and
diversification; promote rural investment and accelerate poverty reduction and enhance human
development. While recognizing the importance of balanced growth in all sectors of the
economy, the SNDP priority growth sectors are Agriculture, Livestock and Fisheries, Mining,
Tourism, Manufacturing and Commerce and Trade.
During the SNDP period, investment in rural areas will be an important factor in increasing
employment and reducing poverty. The Plan will, therefore, promote increased rural investment
in infrastructure such as roads, rail, Information and Communication Technology, energy, water
and sanitation, education and health.
While recognizing the importance of all sectors, the SNDP contains only sector programmes that
have been identified as critical to achieving the overall objectives of the Plan. In view of this, the
Plan contains the following sections: Economic and Social Developments; Infrastructure; Human
Development; Growth sectors; Support sectors; Regional Development and Monitoring and
Evaluation Institutional Arrangement. Cross-cutting issues such as Governance, Human
Immune-Deficiency Virus and Acquired Immune-Deficiency Syndrome, Gender, Disability,
Nutrition, Environment and Disaster Risk Management have been mainstreamed. This is a
deliberate and strategic approach to incorporate and ensure effective implementation
mechanisms of these critical issues in the sector programmes. Details of other programmes will
appear in the relevant sector strategic plans and the Medium-Term Expenditure Frameworks.

Sixth National Development Plan 2011 – 2015
1
Part I
Economic and Social
Developments

Sixth National Development Plan 2011 – 2015
2
2. MACROECONOMIC POLICIES AND STRUCTURAL REFORMS
2.1 Macroeconomic Developments
Economic growth improved during the Fifth National Development Plan (FNDP)period
averaging 6.1 percent per annum over the period 2006-2009 compared with an average of 4.8
percent attained during the Poverty Reduction Strategy Paper(PRSP)/Transitional National
Development Plan (TNDP)(2002-2005) period. Macroeconomic stability, growth in exports and
overall improvements in the investment climate had a positive impact on economic growth. The
improvements in the investment climate contributed to the increase in Foreign Direct Investment
(FDI) especially in the mining, construction and services sectors.
The annual average growth over the FNDP period was, however, still below the envisaged
average growth target of 7.0 percent. This outcome was partly due to the weak performance of
key sectors such as agriculture, manufacturing and tourism, as well as the effects of the external
factors that included high crude oil prices and unfavourable weather conditions.
Annual inflation was much lower, averaging 11.3 percent as compared to 20 percent during the
PRSP/TNDP period. This reduction was, however, below the FNDP target of single digit
inflation, largely due to the adverse effects of crude oil prices over the 2006/2007 period and the
global economic recession over the2008/2009 period.
With regard to lending rates, these showed a declining trend during the FNDP period. The annual
average commercial bank lending interest rates, though still high, declined to 27.3 percent from
46.2 percent during the PRSP/TNDP period. The high levels of lending rates and the limited
availability of long-term finance remained the major constraints to growth, particularly for small
to medium-scale enterprises.
The exchange rate of the Zambian Kwacha against major currencies steadily appreciated during
the FNDP period. This was mainly as a result of improved Terms of Trade buoyed by high
copper prices and output and large capital portfolio and investment inflows. The external
position, however, continued to be characterised by the dominance of copper that accounted for
an annual average of 77 percent of exports during the FNDP period, up from an annual average
of 61 percent during the 2002-2005 period. This over-dependence on copper makes the country
vulnerable to shifts in its demand and prices and has had a major influence on the exchange rate
in the recent years.
The general macroeconomic performance of the economy during the period is as highlighted in
Table 1.

Sixth National Development Plan 2011 – 2015
3
Table 1: Macroeconomic Performance (2006-2009)
Average
2002-
2005
2006 2007 2008 2009 Average
2006-
2009
National Accounts and Prices
GDP at Constant Prices 4.8 6.2 6.2 5.7 6.4 6.1
GDP at market prices (K‟ billion ) - 38,560.8 46,194.8 54,839.4 64,615.6 -
Consumer Prices
Consumer Prices (average) 20.0 9.0 10.7 12.4 13.4 11.4
Consumer Prices (end of period) 19.3 8.2 8.9 16.6 9.9 10.9
Domestic Credit to the Private Sector 39.6 54.3 43.0 50.2 14.3 40.5
Interest Rates
Weighted Lending Rate (end-December) % 41.5 27.9 24.4 26.9 29.2 27.1
Savings Rate (end-December) % 5.6 6.1 4.8 4.8 4.7 5.1
Central Government Budget Balance
Overall Balance (including grants) -3.9 18.9 -0.2 -2.2 -3.0 3.4
Overall Balance(excluding grants) -10.5 -7.6 -4.8 -6.0 -7.2 -6.3
External Sector
Current Account Balance
(including current and capital grants) -7.8 3.0 -4.6 -5.6 -1.0 -2.0
(excluding grants) -0.7 -9.2 -9.4 -5.6 -6.0
Terms of Trade 5.0 55.2 8.4 -16.4 -17.1 7.5
Average Exchange Rate (Kwacha per US Dollar) 4,572.3 3,601.0 4,002.0 3,754.0 5,058.0 4,103.8
Gross International Reserves (months of import
cover)
1.2 2.2 2.1 2.8 4.0 3.0
National Debt
Private and Parastatal as % of GDP 11.6 10.1 8.8 6.2 17.6 10.7
Public Debt as % of GDP* 88.1 28.7 26.7 22.9 25.2 25.9
External 68.8 8.7 8.8 7.5 9.0 8.5
Domestic 19.3 20.0 17.9 15.5 16.2 17.4
External Debt Stock (US $‟M) - 930.4 1,018.7 1,093.1 1,156.9 - *Public debt refers to sum of external and domestic debt
Fiscal Performance
The implementation of the envisaged fiscal outlays proved to be a challenge, mainly due to
shortfalls in domestic revenues and grants from Cooperating Partners. As a result, fiscal deficit
averaged 1.9 percent of Gross Domestic Product (GDP) during the period against the FNDP
average target of 1.7 percent of GDP.
Domestic Revenues
Total domestic revenue collections during the FNDP period averaged 17.5 percent and were
below the average target of 17.7 percent of GDP. During the second and the third years of the
Plan period, total domestic revenues performed above expectations, with collections being at
18.4 percent and 18.3 percent of GDP in 2007 and 2008, respectively. Total domestic revenues
declined to 15.7 percent in 2009 and thereafter rose marginally to 17.9 percent in 2010 (see
Table 2). This was mainly on account of the global financial crisis that was experienced in 2008.
Further, fiscal incentives that were granted in form of tax concessions to various sectors to attract
investment also contributed to lower revenue inflows.

Sixth National Development Plan 2011 – 2015
4
Table 2: Domestic Revenue Performance during the FNDP as Percentage of GDP
2006 2007 2008 2009 2010* Period
Average
FNDP
Target**
Total Domestic Revenues 17.2 18.4 18.3 15.7 17.9 17.5 17.7 Total Tax Revenues 16.4 17.7 17.3 14.7 16.8 16.6 17.1
Income Tax 7.7 8.3 8.3 7.7 9 8.2 -
Value Added Tax(VAT) 4.6 4.8 4.0 3.8 4.2 4.3 -
Customs and Excise Duties 4.0 4.6 5.1 3.3 3.6 4.1 -
Non-Tax Revenue 0.8 0.7 1.0 1.0 1.1 0.9 0.6
*2010 figures are based on actuals upto September and projected for the last quarter
Foreign Grants
As a percentage of GDP, total grants averaged 4.1 percent during the FNDP period against the
target of an average of 5.4 percent. This was asa result of low disbursements by Cooperating
Partners during the Plan period.
Public Expenditures
Total expenditure averaged 23.1 percent of GDP over the FNDP period, compared to the target
of an average of 23.8 percent of GDP. In line with the trend in revenues and grants, total
expenditure was 23.5 percent and 24.3 percent of GDP in 2006 and 2007 respectively. The
expenditure, however, declined in the latter part of the Plan period reaching an average of 21.2
percent of GDP by 2010.
While the Plan had projected a gradual reduction in current spending from 18.5 percent of GDP
in 2006 to 17.5 percent of GDP in 2010, actual current expenditures for the first four years of the
Plan had been high averaging 19.2 percent of GDP. As a consequence, capital expenditures
which were projected to average 6percent of GDP over the Plan period were reduced to an
average of 3.7 percent.In addition, revenues did not increase in proportion to GDP growth during
the Plan period while current expenditures increased, making it difficult for the Government to
provide quality goods and services to the people.
Over the FNDP period, current expenditures were actually higher than domestically generated
revenues. The implication is that part of the deficit financing was directed towards sustaining
current expenditure rather than investment.
Domestic Debt
Domestic debt increased by 25.9 percent to K10, 455.22 billion as at end-December 2009 from
K7, 720.42 billion at the beginning of the FNDP period. The increase in domestic debt emanated
from two expenditure categories, namelyinterest payments on government securities and
payments towards awards and compensations which recorded an upswing of 43.4 percent and
over 400 percent respectively. As a proportion of GDP, domestic debt, however, fell from 20
percent in 2006 to 16.2 percent in 2009.
Labour Market Developments
The labour force1 increased by 10 percent from 4.9 million in 2005 to 5.4 million in 2008. Total
employment grew by 26.4 percent to 5.2 million in 2008 from 4.1 million in 2005. This was
largely attributed to informal sector employment which grew by 47.6 percent to 4.7 million in
1Population aged 15 to 64 years

Sixth National Development Plan 2011 – 2015
5
2008 from 3.1 million in 2005. Formalsector employment2 grew from 416, 324 in 2005
to522,761 in 2008 representing a 25.6 percent increase. Its proportion however, remained low at
10 percent of total employment. In the formal sector, male employment accounted for 71 percent
compared to 29 percent for females. Between 2005 and 2008 the level of unemployment
remainedaround 15.5 percentof the total labour force of which 30 percent were in rural areas and
70 percent in urban areas3.
2.2 External Sector Developments
Balance of Payments
The external balances of the country improved significantly during the FNDP period. The current
account deficit averaged 4.8 percent of GDP compared to 11.3 percent of GDP during the
PRSP/TNDP period (2002-2005),and in 2009 it further narrowed to 3.2 percent of GDP. Exports
of goods and services increased by an annual average of 22.8 percent and its share inGDP rose to
33.4 percent in the FNDP period from 28 percent in the PRSP/TNDP period. This increase in
exports was attributed to the favourable metal prices on the international markets.
Non-traditional exports also continued to grow, though at a reduced rate, increasing by an annual
average of 13 percent during the FNDP period from an annual average of 16.1 percent of GDP in
the period 2002-2005. Imports increased by an annual average of 17 percent. However, its share
in GDP fell to 27.1 percent compared to 31.4 percent in the PRSP/TNDP period, partly due to
the sharp decline in imports in 2009 as a result of the effects of the global economic slowdown.
The increase in export earnings coupled with a significant increase in FDI contributed to the
favourable balance of payments position throughout the FNDP period. The increase in exports
contributed to the rise in international reserves to US $1.8 billion in 2009. In terms of import
coverage, this represented an increase to over 4 months in 2009 from 1.5 months in 2005.
External Debt
Total national external debt increased by 16.1 percent from US $2, 014.4 million in 2006 to US
$3, 407.3 million at end 2009. This was mainly on account of a higher increase in private and
parastatal debt of over 100 percent from US $1, 084.0 million in 2006 to US $2, 250.4 million in
2009 while the public debt increased by 24.4 percent from US $930 million in 2006 to US $1,
156.9 million in 2009. As a proportion of GDP, external debt remained at around 9 percent and
was sustainable.
2.3 Social Developments and Constraints to Growth
In line with the Vision of becoming a “prosperous middle-income nation by 2030”, the country
has made progress towards its attainment. The country‟s per capita4Gross National Income
(GNI) increased from US $680 in 2006 to an estimated US$970 in 2009, only slightly below the
lower middle-income threshold of US $995.
2 Excluding Defence Forces 3 Estimate based on the 2005 and 2008 Labour Force Surveys 4 Using the Atlas method

Sixth National Development Plan 2011 – 2015
6
There has been progress made with regard to social developments in the country as indicated by
improvements in the attainment of the Millennium Development Goals (MDGs). The country is
most likely to achieve all the goalsexcept the one relating to environmental sustainability. The
MDGs targets on hunger, universal primary education, gender equality, Human Immune-
Deficiency Virus (HIV) and Acquired Immune-Deficiency Syndrome (AIDS) are likely to be
achieved, while potential exists for achievement of the goal on Global Partnerships for
Development. There is also potential to meet the targets on maternal mortality, water and
sanitation, child mortality, extreme poverty and malaria and other major diseases.
The challenge for the country is to improve the quality of life for the majority of the population
which has remained low especially in rural areas. The SNDP therefore, will focus on
development strategies that address poverty, by ensuring that minimum requirements including
provisionof health, education, water and sanitation and access roads are in place.
Population and Development
The population of Zambia stood at 9.9 million in 2000, estimated at 13.3 million in 2010 and is
projected to increase to 15.5 million by 20155 based on the annual growth rate of 2.4 percent. At
this growth rate, the population is expected to double by 2030.
Zambia has a young and dependant population, with 46.0 percent of the population being under
the age of 15. The overall age dependency ratio was 96.2 per100 in the year 2000.6The child
dependency ratio was 91 dependants who are children to be cared for by 100 persons in the
productive age group. A highly dependent population poses a great socio-economic burden on
the family and the entire nation.
The population if fully utilised, can contribute to economic growth for sustainable development.
During the SNDP period the size of the labour force is expected to increase substantially as the
new entrants into the labour force are children who have already been born. Therefore, the
emphasis of the SNDP will be on deliberate interventions that will promote the creation for
decent jobs and skills development particularly for young people. In light of the above, the
SNDP aspires to attain inclusive economic growth that is three times higher than the population
growth rate.
Growth and Poverty
The economic growth experienced during the last decade has not translated into significant
reductions in poverty and improved general living conditions of the majority of the Zambians.
Job creation was not commensurate with the gains registered from economic growth. Among the
factors that attributed to this phenomenon were low labour productivity, low absorption capacity
of the labour market for new entrants, particularly the youth and the concentration of growth in
highly capital-intensive and urban-based sectors like mining, construction and services.
Economic growth and poverty reduction during the FNDP period was further constrained by
several factors, among which were the following:
5Based on 2000 population and housing census 6 implying that there 96 dependents who are children and the aged to be cared for by 100 persons in the productive age group, (15-64 years)

Sixth National Development Plan 2011 – 2015
7
(i) Poor Infrastructure
Inadequate growth-enhancing infrastructure emerged as the major constraint. For
instance, critical infrastructure for electricity, transportation and water and sanitation
remained poor and limited, especially in the rural areas. Poor transport infrastructure
together with high cost and inadequate Information and Communications Technology
(ICT) services, adversely affected the productivity and competitiveness of the economy;
(ii) Low Quality of Human Capital
Despite human development playing an important catalytic role in poverty reduction and
economic development, the quality of human capital continued to be low. This was
evidenced by increased scarcity of skilled manpower and limited access to higher and
tertiary education. Additionally, without appropriate and effective linkages in place, the
existing supply of skills did not adequately meet the demand in the labour market. The
poor state of health of the population, as evidenced by health indicators which though
improving are still poor as well as limited access to water and sanitation, adversely
affected productivity across most sectors, especially in agriculture which in turn
adversely impacted on growth and social development;
(iii)High Cost of Financial Services
The high cost of finance posed serious limitations on the ability of entrepreneurs to start
and/or to expand their operations, with small-scale farmers and other small and medium
enterprises being the most affected;
(iv) Inefficiencies in Public Expenditure Management
Although public expenditure management generally improved, some weaknesses
continued to be a challenge. Among the areas of concern were weak accountability and
monitoring and evaluation systems of public expenditure, deficiencies in and low rate of
implementation of public sector projects. These were compounded by poor enforcement
of standards which led to sub-optimal use of public resources and delays in project
completion; and
(v) Limited Access to Land
Although some strides were made as regards to land issues during the FNDP period, land
administration and management continued to be a challenge. The land administration and
management challenges have been compounded by unreliable land information
management systems, lack of a decentralised land registration system and inadequate
collaboration among different stakeholders.

Sixth National Development Plan 2011 – 2015
8
2.4 SNDP Objectives and Strategies
In an effort to build on the successes and address the challenges identified during the FNDP
period, the SNDP will seek to attain the following overarching objectives:
(i) To accelerate infrastructure development, economic growth and diversification;
(ii) To promote rural investment and accelerate poverty reduction; and
(iii) To enhance human development.
Pursuant to the above objectives, the Plan focuses on policies, strategies, and programmes that
will contribute significantly to addressing the challenges of realising broad based pro-poor
growth, employment creation and human development as outlined in the Vision 2030. Further, to
achieve the MDG target of halving extreme poverty level of 59 percent (1991) and to rapidly
create gainful and decent employment, economic growth has to exceed 6 percent per annum and
must be more pro-poor in structure.
The strategic focus of the SNDP is, therefore, to address the constraints of infrastructure and
human development. The SNDP will also entrench cross-cutting issues of Governance, HIV and
AIDS, Gender, Disability, Nutrition, Environment and Disaster Risk Management.
Infrastructure Development
Poor and inadequate infrastructure remains the major constraint to economic development and
poverty reduction. A sustained commitment to infrastructure development will be the main focus
in the SNDP. While Government will continue to invest in infrastructure in health, education and
skills development, the focus will be in the following areas:
(i) Transport to cover roads, bridges, air, water, rail and border infrastructure;
(ii) ICT to cover backbone infrastructure, digitalization, next generation networks,
centres of excellence;
(iii) Energy to cover power generation, transmission, distribution and alternative
technology; and
(iv) Water supply and sanitation to cover reticulation systems, dams, pipelines and
boreholes.
In light of the importance of trade and regional integration in economic growth, rehabilitation of
road links under various regional corridors, such as the North-South and Nacala Corridorswill be
implemented with the support of Cooperating Partners and in collaboration with neighbouring
countries. This will be supplemented by major improvements of border posts, including those at
Nakonde, Kasumbalesa and Kazungula.
Government will also enhance Public Private Partnerships (PPPs) to augment its efforts in
economic and social development in areas such as construction, rehabilitation and maintenance
of infrastructure and effective delivery of social services.

Sixth National Development Plan 2011 – 2015
9
Rural Development
In order to reduce the high poverty levels in the rural areas and promote rural development, focus
will be on stimulating agriculture productivity and promotion of agro-businesses, improving the
provision of basic services such as water and sanitation, health, education and skills
development. In addition, investments in key economic infrastructure such as feeder roads, water
canals, tourist access roads and electricity access will be undertaken. In this regard, the major
programme will be the continued implementation of the Rural Finance Programme and rapid
roll-out of ICT services in rural areas to support the expansion and increased use of financial
services. Further, rural industrialisation will be pursued in an effort to increase employment
opportunities in rural areas.
Human Development
In view of the low quality of human capital, the focus of the SNDP in this area will be on skills
development, improving labour productivity, increasing access to health and higher and tertiary
education, and facilitate the distribution of skilled labour within and across sectors throughout
the country.
2.5 Growth Areas in the SNDP
Zambia is endowed with natural resources which could provide an impetus to the development of
agriculture, tourism, manufacturing, mining and energy sectors. While mining still remains
important and will continue to be promoted, there is need to aggressively diversify the economy
to other sectors, in order to cushion against the negative effects of external shocks. Accelerating
growth in these sectors coupled with quality human developmentand efficient public service
delivery are critical for accelerated development, wealthy creation, poverty reduction and
improved livelihoods of the vast majority of Zambians. In all these areas, Government will
promote private sector investment and Public Private Partnerships (PPPs).
In line with the objectives and strategic focus of the SNDP, the growth areas will be agriculture,
tourism, manufacturing, mining and energy. The development in these areas will be augmented
by human development particularly in health, education and skills development, and water and
sanitation.
Agriculture, Livestock and Fisheries
High poverty levels are most prevalent in rural areas where the majority of households are
dependent on agricultural activities. Investments particularly in agriculture infrastructure and
rural finance offer effective means to make a significant impact on poverty levels. These should
embrace efforts to promote quality livestock and fisheries production and crop diversification
while improving marketing systems, harnessing the value chain in agriculture production and
increasing productivity in farming to ensure national food security, employment creation and
increased income from exports.

Sixth National Development Plan 2011 – 2015
10
Mining
The mining industry has experienced exceptional growth averaging 9 percent per annum in the
last decade and prospects for further development are enormous. The sector will, therefore,
continue to be a major driver of growth, while also providing impetus for value addition through
the creation and expansion of the manufacturing industry. In addition, this is expected to create
spill over effects through development of necessary infrastructure, especially those related to
roads, railways, border facilities and reliable electricity supply. This will be complimented by
redesigning of policies so as to encourage and attract private investment in exploration, re-
investment and development of new mines through a stable and attractive fiscal and regulatory
regime.
Tourism
The focus on tourism in the SNDP will be to make the sector viable and competitive through
improved infrastructure particularly in the Greater Livingstone area, Kafue National Park and the
Northern Circuit. This will be complimented by infrastructure development initiatives such as
increasing access to electricity and ICT services. Government will also focus on improving the
regulatory framework and the development of human capacity to enhance service delivery in the
sector.
Manufacturing
The focus in the SNDP will be to attract quality investment to the manufacturing sector by
providing good regulatory framework and business environment that aims at linking Foreign
Direct Investment (FDI) to the needs of the domestic economy. In addition, Government will
continue to facilitate development of manufacturing infrastructure including Multi-Facility
Economic Zones (MFEZs) and Industrial Parks, which will also contribute to employment
creation especially in the urban areas.
Energy
Government will continue to encourage and promote private sector led investments in addition to
fostering PPPs. In this regard, Government will continue to implement the policy of moving
towards economic electricity tariffs before the end of this Plan period. Other reforms will be the
implementation of a grid code intended to facilitate private sector participation in the electricity
sector through the smooth sharing of electricity transmission infrastructure. Petroleum is another
source of energy whose rising prices and procurement problems cause economic hardships in the
country. The focus will be to improve the procurement procedures and to complete the
rehabilitation of the Indeni Oil Refinery and the TAZAMA pipeline. Efforts will also be made to
step up oil exploration and increase the use of alternative sources of energy. This will be
complimented by the development of legislative, institutional and operational frameworks.
Human Development
To augment the development in the economic sectors, improvements in education and skills
development, health, housing and water and sanitation will also be given emphasis. In each of
these sectors, focus will be on infrastructure and human development interventions. In
agriculture, human development will focus on improving productivity in the sector through
training, research and extension services.
Sixth National Development Plan 2011 – 2015
11
In Tourism the focus will be skills development for operators, higher level training in tourism-as
well as re-skilling and up-skilling labour within this sector and enhancing service delivery in
order to increase competitiveness. With regard to manufacturing, human development will take
the form of entrepreneurship training at all levels of education, business development and on-
farm agro-processing training. Human resource development in mining will focus on mining
occupational safety and health as well as environmental impact mitigation.
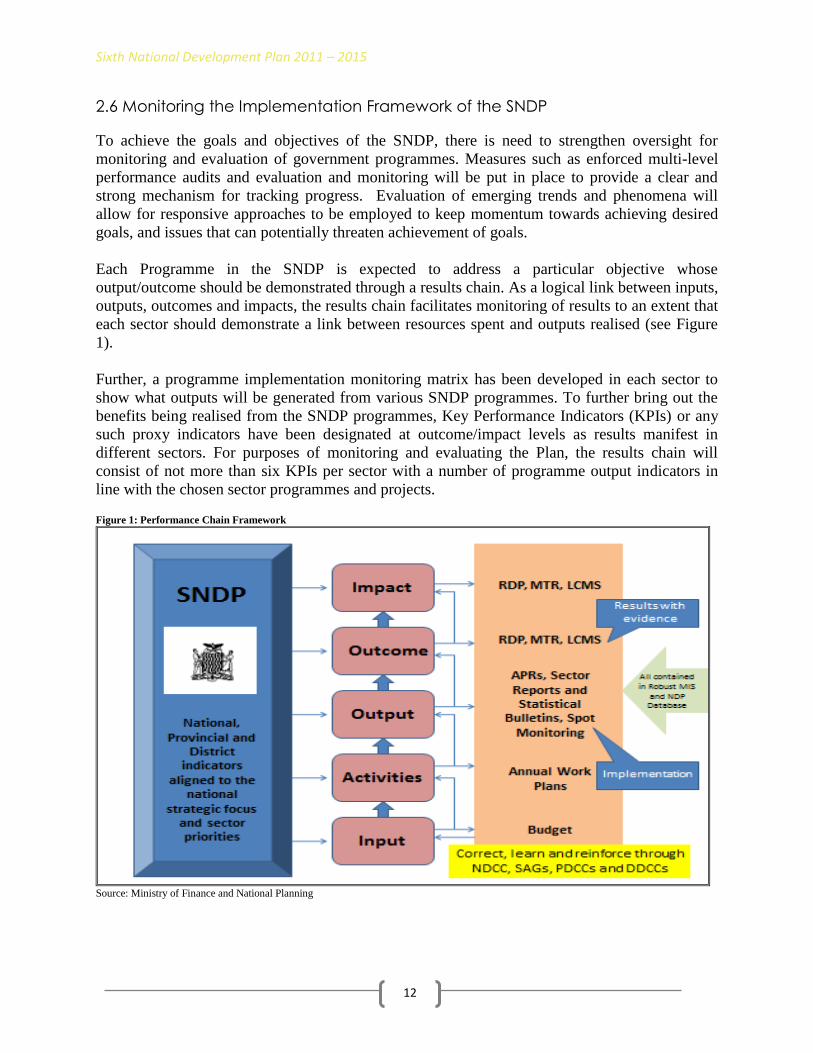
Sixth National Development Plan 2011 – 2015
12
2.6 Monitoring the Implementation Framework of the SNDP
To achieve the goals and objectives of the SNDP, there is need to strengthen oversight for
monitoring and evaluation of government programmes. Measures such as enforced multi-level
performance audits and evaluation and monitoring will be put in place to provide a clear and
strong mechanism for tracking progress. Evaluation of emerging trends and phenomena will
allow for responsive approaches to be employed to keep momentum towards achieving desired
goals, and issues that can potentially threaten achievement of goals.
Each Programme in the SNDP is expected to address a particular objective whose
output/outcome should be demonstrated through a results chain. As a logical link between inputs,
outputs, outcomes and impacts, the results chain facilitates monitoring of results to an extent that
each sector should demonstrate a link between resources spent and outputs realised (see Figure
1).
Further, a programme implementation monitoring matrix has been developed in each sector to
show what outputs will be generated from various SNDP programmes. To further bring out the
benefits being realised from the SNDP programmes, Key Performance Indicators (KPIs) or any
such proxy indicators have been designated at outcome/impact levels as results manifest in
different sectors. For purposes of monitoring and evaluating the Plan, the results chain will
consist of not more than six KPIs per sector with a number of programme output indicators in
line with the chosen sector programmes and projects. Figure 1: Performance Chain Framework
Source: Ministry of Finance and National Planning

Sixth National Development Plan 2011 – 2015
13
National Key Performance Indicators
The overall performance of the Plan will be measured through a set of National Key
Performance Indicators as outlined in Table 3 below. These indicators relate to infrastructure and
human capital development.
Table 3: National Key Performance Indicators
National Key Performance
Indicators
Baseline 2011 2012 2013 2014 2015
Percentage of SNDP annual Budget
allocation released
- 100% 100% 100% 100% 100%
Percentage of Key Performance
Indicators reported on annually
- - Increase Continue
d
increase
Continued
increase
90
Gini Coefficient (Zambia/Rural/Urban) Z = 52.6 Z = 50.0 - Z = 45.0 - Z = 38
R = 43.5 R = 42.0 - R = 41.0 - R = 40
U = 46.8
(2006)
U = 44.0 - U = 43.0 - U = 42
Rate of Growth in :
a) Agriculture 7.2 1.0 1.5 2.0 2.0 2.0
b) Energy 6.8 2.5 2.0 6.9 6.4 2.0
c) Construction 9.5 15.0 16.0 16.0 16.0 16.0
d) Tourism -13.4 13.0 10.0 12.0 14.0 16.0
Total national electricity generation
(MW)
1,918 1,998 2,358 2,478 2,892 2,912
Percentage of Households with access
to electricity (Zambia/Rural/)
Z = 22 Z = 32.2 Z = 34.7 Z = 37.2 Z = 39.5 Z = 41.7
R = 3.5 R = 5.0 R = 7.5 R = 10 R = 12.5 R = 15
Hectares of land under irrigation 170,000 173,000 176,000 179,500 183,500 187,500
Percentage of rural households within
2 Km of all season passable road
- Continued
increase
Increase Continue
d increase
Continued
increase
80
Forest Plantation Expansion (Ha) 60,000 65,000 70,000 75,000 80,000 85,000
(Proportion of Households living
between 0-5 km of a basic school)
Z = 83.5 84.8 86.1 87.4 88.7 Z = 90
R = 79.6 80.7 81.8 82.8 83.9 R = 85
U = 91.4
(2006)
92.1 92.8 93.6 94.3 U = 95
Literacy Rates (of population aged
15+), male: female
- 42 - 45 - 50
Proportion of the population (male;
female) with access to safe water
supply (%)
(a) Rural
53 61 65 69 73 75
(b) Urban 74 75 76 77 79 80
Proportion of Urban population (male:
female) with access to adequate
sanitation (%)
(a) Rural
33 43 48 53 58 60
(b) Urban 37 44 48 52 56 60
(Proportion of Households living
between 0-5 km of a health facility)
Z = 68.1 68.5 68.9 69.2 69.6 Z = 70
R = 54.5 55.6 56.7 57.8 58.9 R = 60
U =
93.0(2006)
93.8 94.6 95.4 96.2 U = 97
Life Expectancy at birth
Male
Female
48
52
50
54
53
55
55
58
Immunization Rates 55.0(2007) - 56 - 58 60
Infant Mortality Rate (per 1000) 70 (2007) 69 68 67 66 65
Child Mortality Rate (per 1000) 52 (2007) 50.2 49 47 45.4 45
Maternal Mortality Ratio (per 100,000) 591 (2007) 375 321 267 213 159
Stunting Prevalence amongst Children
Under Five disaggregated by gender
45 (2007) 42 39 36 33 30
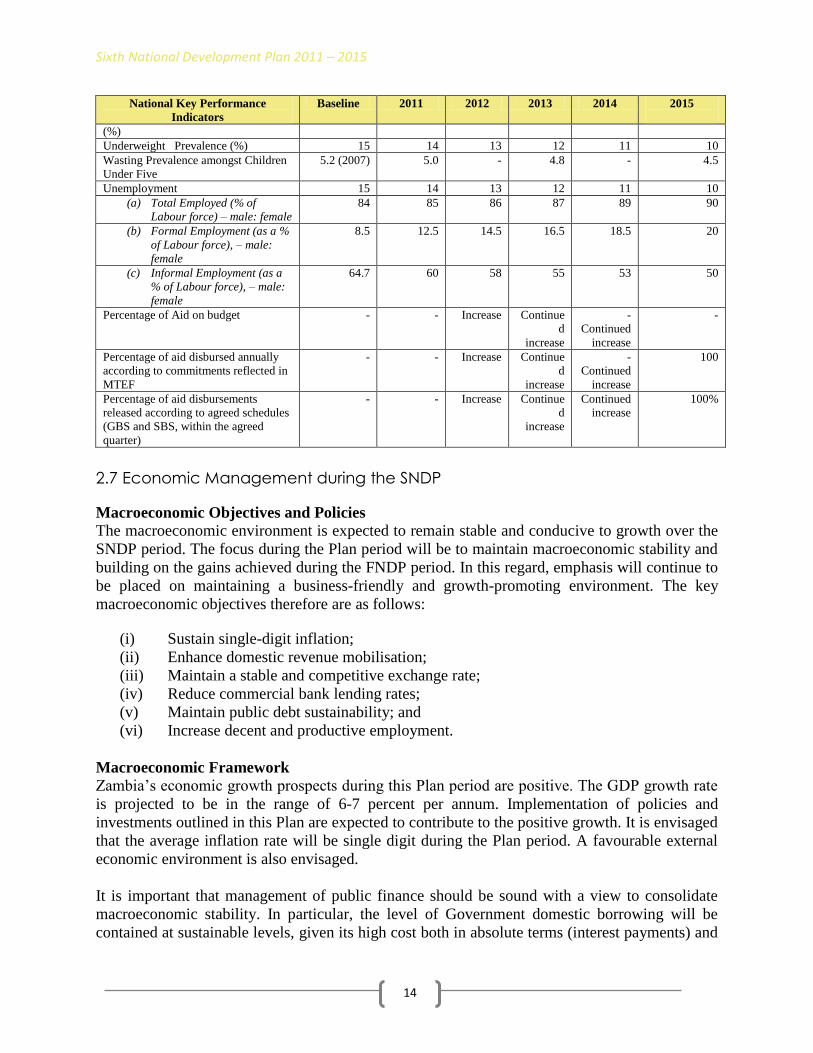
Sixth National Development Plan 2011 – 2015
14
National Key Performance
Indicators
Baseline 2011 2012 2013 2014 2015
(%)
Underweight Prevalence (%) 15 14 13 12 11 10
Wasting Prevalence amongst Children
Under Five
5.2 (2007) 5.0 - 4.8 - 4.5
Unemployment 15 14 13 12 11 10
(a) Total Employed (% of
Labour force) – male: female
84 85 86 87 89 90
(b) Formal Employment (as a %
of Labour force), – male:
female
8.5 12.5 14.5 16.5 18.5 20
(c) Informal Employment (as a
% of Labour force), – male:
female
64.7 60 58 55 53 50
Percentage of Aid on budget - - Increase Continue
d
increase
-
Continued
increase
-
Percentage of aid disbursed annually
according to commitments reflected in
MTEF
- - Increase Continue
d
increase
-
Continued
increase
100
Percentage of aid disbursements
released according to agreed schedules
(GBS and SBS, within the agreed
quarter)
- - Increase Continue
d
increase
Continued
increase
100%
2.7 Economic Management during the SNDP
Macroeconomic Objectives and Policies
The macroeconomic environment is expected to remain stable and conducive to growth over the
SNDP period. The focus during the Plan period will be to maintain macroeconomic stability and
building on the gains achieved during the FNDP period. In this regard, emphasis will continue to
be placed on maintaining a business-friendly and growth-promoting environment. The key
macroeconomic objectives therefore are as follows:
(i) Sustain single-digit inflation;
(ii) Enhance domestic revenue mobilisation;
(iii) Maintain a stable and competitive exchange rate;
(iv) Reduce commercial bank lending rates;
(v) Maintain public debt sustainability; and
(vi) Increase decent and productive employment.
Macroeconomic Framework
Zambia‟s economic growth prospects during this Plan period are positive. The GDP growth rate
is projected to be in the range of 6-7 percent per annum. Implementation of policies and
investments outlined in this Plan are expected to contribute to the positive growth. It is envisaged
that the average inflation rate will be single digit during the Plan period. A favourable external
economic environment is also envisaged.
It is important that management of public finance should be sound with a view to consolidate
macroeconomic stability. In particular, the level of Government domestic borrowing will be
contained at sustainable levels, given its high cost both in absolute terms (interest payments) and

Sixth National Development Plan 2011 – 2015
15
the potential crowding-out effect that it has on the private sector. In this regard, Government will
target to reduce domestic borrowing to an annual average rate of 1.5 percent of GDP and to reach
less than 0.75 percent by 2015. The overall fiscal deficit, however, is expected to increase to 5
percent of GDP, and will be financed by increased external borrowing. External borrowing will
be targeted towards infrastructure development.
External Outlook
It is assumed that during this Plan period, the external economic environment will generally
improve and remain stable. The country‟s external macroeconomic environment is, therefore,
expected to follow the broad path of the economy during the Plan period, while reducing the
country‟s vulnerability to external shocks such as commodity price fluctuations. Gross
International Reserves are expected to increase to 5 months of import cover during the Plan
period. This is premised on foreign direct and portfolio investment levels reaching above the
FNDP trend levels, leading to higher foreign exchange inflows.
Monetary Policy
During the Plan period, the Central Bank will pursue a growth-enabling monetary policy stance.
This policy will not only focus on inflation, but also ensure adequate levels of liquidity to cater
for a growing economy. Monetary policy tools will be reviewed with the aim of shifting towards
the usage of interest rates as the main monetary policy instrument to anchor inflationary
expectations.
The Central Bank will continue with its policy of maintaining a fully convertible Kwacha, and
rely on market fundamentals to determine the value of the local currency against international
currencies. This policy prevents possible currency crisis whilst also allowing for the necessary
adjustment to take place. Government recognises that excessive exchange rate volatility can
have an adverse impact on output, inflation and external competitiveness of the economy. In
such situations, the Central Bank may periodically participate in the market to smoothen
fluctuations of the exchange rate.
Fiscal Policy
Prudent fiscal policy will remain critical during the plan period in order to augment economic
gains made over the FNDP period to support overall economic growth. In this regard, fiscal
policy will continue to be expansionary so as to ensure that projects in the SNDP are undertaken
in a timely and most cost effective manner. Government will undertake a comprehensive reform
of the present tax system aimed at broadening the tax base and increasing revenue yield, while at
the same time improving efficiency and equity. These reforms will be aimed at developing a tax
system that will among other things:
(i) Be based on the principle of equity;
(ii) Address distortions in the application of the VAT and broaden the tax base;
(iii) Promote economic growth and job creation in an open economy;
(iv) Make tax administration effective to facilitate compliance by taxpayers; and
(v) Increasing tax yield from 15.7 percent of GDP in 2009 to 18 percent by the end of the
plan period.

Sixth National Development Plan 2011 – 2015
16
In addition, Government will explore other sources of financing such as PPPs, concessional and
non-concessional loans to augment available resources for the SNDP.
On the expenditure side, Government will place a premium on securing maximum benefit out of
spending by re-aligning expenditures in order to create room for development and investment
spending by:
(i) Avoiding spreading development resources too thinly across numerous programmes;
(ii) Freeing up additional resources through aggressive cost-cutting measures, reduction
of wastage, efficiencies in public service delivery, reductions in administrative
expenditures and enhanced financial prudence;
(iii) Strengthening the procurement process to ensure value for money; and
(iv) Developing benchmarking and value for money mechanisms and a price database to
ensure that Government is not over charged.
Investment Policy
The policy of Government is to accelerate private sector investment so as to achieve increased
and diversified growth. Government will, therefore, continue with the strategy of attracting
investment through facilitation by Zambia Development Agency and improving the overall
business and investment climate. Deliberate efforts will be made to linking FDI to the domestic
economy in order to broker linkages with SMEs with the view of increasing their productivity,
capacity and ability to penetrate into larger markets. The overall effect intended is the creation of
decent employment in the various areas of investment.
International Relations
During the SNDP, Government will consolidate economic diplomacy and enhance its
complementarity with political diplomacy in order to address emerging economic and political
issues, taking into account programmes as expounded by the SNDP. The focus will be on
facilitating cooperation and investment in infrastructure and human development through
improved foreign relations. Government will, therefore, have a deliberate strategy to ensure that
bilateral, regional and multilateral cooperation arrangements have a leaning towards
infrastructure and human development.
Government will also take advantage of the good foreign relations that Zambia enjoys to
invigorate the country‟s drive to boost trade and attract foreign investment to strategic areas. In
order to maximize the benefits that accrue from international relations, a key strategy will be to
maintain presence in strategic locations and where absolutely necessary, establish new Missions.
The sector will also implement the establishment of a Career Diplomatic Service. The
establishment of a Career Diplomatic Service will particularly be cardinal in ensuring that the
Foreign Service is manned by a cadre of officers capable of articulating Government‟s policies
and programs, thereby safeguarding Zambia‟s interests abroad.
Aid Policy and Management
Development assistance will continue to constitute a vital financing source, especially in light of
the development challenges facing Zambia. This strategy will not only be used to manage and
harmonize arrangements with Cooperating Partners, but also guide and monitor mutual
Sixth National Development Plan 2011 – 2015
17
performance. The Government will manage the Division of Labour (DoL) amongst the
Cooperating Partners in the various sectors to provide a basis for the formulation of a new Joint
Assistant Strategy for Zambia (JASZ) within the framework of the Paris Declaration to succeed
the one developed for the FNDP. The Government and the Cooperating Partners will accordingly
update their existing Memorandum of Understanding, “Coordination and Harmonization of
GRZ/Donor Practices for Aid Effectiveness in Zambia (2004).” This will set out inter alia the
standard of aid delivery to be adhered to by Cooperating Partners, mutual commitments around
delivery of aid and results and re-affirmation of the institutions for Co-ordination and dialogue
between Government and its Cooperating Partners.
Zambia‟s preferred mode of aid delivery will continue to be Budget Support, followed by Sector
Support and Sector Wide Approach Programmes (SWAPs). At the same time, the Government
will continue to place strong emphasis on strengthening transparency and accountability in aid
management. With regard to project support, Government will develop a database of pre-
screened projects ranked in order of socio-economic return and spatial preferences.
Debt Management Strategy
During the Plan period, both external and domestic debt borrowing will remain relatively
conservative in order to maintain debt sustainability. In external debt management, Government
will continue contracting a mix of concessional and non-concessional debt to finance projects
with high economic return especially in infrastructure such as roads and electricity generation
and transmission, so as to ensure future debt sustainability. The domestic debt has a greater
impact on the Government liquidity management system. Government will, therefore, endeavour
to reduce the stock of domestic debt through the gradual reduction of issuances as well as
refinancing maturing government securities. Furthermore, the cost of issuance of government
securities for monetary policy will be reviewed so as to reduce the cost to the Treasury.
Government will also endeavour to reduce the stock of outstanding bills by instituting more
stringent financial measures.
Structural Reforms
In order to raise and broaden economic growth and employment beyond that achieved in the
FNDP period, the growth and investment strategy will be accompanied by continued
implementation of reforms. The key ones will be Public Service Reform Programme (PSRP),
Public Financial Management (PFM), Private Sector Development Reform Programme (PSDRP)
and a range of sector specific measures that aim at increasing economic growth through
investment expansion and fostering competitiveness and productivity and thereby addressing
growth constraints.
(a) Public Service Reform Programme
During the Plan period, structural reforms under the PSRP will be largely focused on the
creation of more fiscal space, the improvement of public expenditure and financial
management, improvement of tax administration and the expansion of the tax base.
Other reforms will focus on improvements in debt management capacity, economic statistics
capacity and accessibility, as well as strengthening of monetary policy implementation.

Sixth National Development Plan 2011 – 2015
18
(i) Public Financial Management
Government will continue to improve the quality of public financial management
emphasising on efficiency, effectiveness, transparency and accountability of public funds.
During the SNDP period, focus will be on the following areas:
a) Development of a new comprehensive Public Financial Management Reform
strategy;
b) Rolling-out of the Integrated Financial Management Information System (IFMIS);
c) Improvements in the preparation and execution of the national budget;
d) Enactment of a Planning and Budget Act and its regulations;
e) Strengthening expenditure control, accounting, audit functions and reporting;
f) Improving cash management through a Treasury Single Account (TSA) system; and
g) Strengthening system of non-tax revenue collection.
(ii) Public Service Management
Government will continue enhancing the institutional and human capacity of Public
Service with special focus on strengthening and implementing human resource
management. This will be achieved through re-skilling and continued training of public
service workers, development of policies and systems that promote human capital
development and undertaking institutional appraisal. Government will also continue to
reduce the impact of HIV and AIDS on the Public Service by implementing the HIV and
AIDS Strategy for the Public Service.
(iii) Decentralisation and Strengthening of Local Government
In line with the goal to decentralise service delivery functions to the councils, focus will
be on the implementation of the Decentralisation Implementation Plan (DIP). In the
medium-term the Government will focus on building the necessary capacity of the
councils to prepare them to carry out the devolved functions. Devolution will
commence with selected sectors that include education, health, roads, agriculture,
tourism, community development and lands. Government will rationalise expenditure
and revenue assignments between central and local governments. Further, Government
will enhance the use of the consultative process in decision-making so as to ensure
efficient and effective service delivery.
(b) Private Sector Development Reform Programme
During the Plan period, Government will continue to reform the business environment in
Zambia through the implementation of the PSDRP II, a successor to the PSDRP I. The
PSDRP II is a 5 year programme which runs from 2009 - 2014, and will fast track and
accelerate private sector reforms in a number of key sectors which are expected to lead to an
improved and competitive business environment.PSDRP II will aim at building and
enhancing a sustainable legislative and regulatory environment and human capacity for
enterprise development and growth in Zambia in the following areas: business licensing and

Sixth National Development Plan 2011 – 2015
19
regulatory framework; MSME development; labour market reforms and labour
productivity; PPP development and trade expansion.
(c) Labour Market Reforms
A key objective during this Plan period is to increase formal sector employment and
improve the quality of the workforce through implementation of key policies such as the
National Employment and Labour Market Policy as well as the Decent Work Country
Programme. Reforms aimed at enhancing the flexible functioning of labour markets will
facilitate employment creation through approaches that combine promotion of employment
and up-holding of workers‟ rights. Emphasis will be placed on working towards eliminating
gross human rights violations, such as worst forms of child labour and trafficking in human
beings. Efforts will also be made to enhance social protection and occupational safety and
health.
The key legislation to be reviewed will include Employment Act Cap 268, Minimum Wages
Act Cap 272 and the Industrial Relations Act Cap 269. Further, efforts to improve skills and
productivity of labour will be pursued. The Labour Market Reforms to be effected are aimed
at contributing to more effective job creation and development of sustainable enterprises,
particularly micro, small and medium-sized enterprises.
(d) Financial Sector Development
The high cost of finance and limited access to financial services is a constraint to capital
formation and growth. The objective of Government during the Plan period is to continue
making improvements in the macroeconomic environment so as to support activities across
all spheres of business and enterprises. This is meant to support the expected reduction in
lending rates by the commercial banks. The Financial Sector Development Programme
(FSDP) is the broad reform programme for the financial sector and will continue to be
implemented under Phase II in the SNDP. The reform measures will be focused at
addressing weaknesses in the financial sector so as to:-
(i) Improve market infrastructure;
(ii) Increase competition; and
(iii) Increase access to finance.
Within the framework of the Rural Finance Programme, financial sector policies will also
aim to increase access to financial services in rural areas. In this regard, the expansion in
rural banking services will be promoted through various financial institutions including the
National Savings and Credit Bank.
(e) Other Key Structural Reforms
To increase investments in the key infrastructure and growth sectors, particular attention
will be placed on addressing the institutional, legal and policy constraints in key
infrastructure and growth sectors of ICT, and energy. Following the enactment of the
Information and Communications Technology Act of 2009 and the privatisation of
ZAMTEL in 2010, reforms and policies will focus on promoting competition so as to reduce
costs.

Sixth National Development Plan 2011 – 2015
20
In the energy sector, the reforms under the electricity sub-sector will continue to emphasise
on raising tariffs to reflect real costs. Under the petroleum sub-sector, a review and reform
will be undertaken to determine the optimal measures required to achieve efficiency and
cost effectiveness in the petroleum supply chain. This is essential to attract and sustain
private investment.
The table below shows the objectives, strategies and programmes for the macro-economic
policies during the SNDP period. Table 4: Objectives, Strategies and Programmes
No. Objectives Strategies Programmes
1 To enhance and consolidate
Macroeconomic Stability
a) Maintain sustainable levels of government debt;
b) Maintain adequate buffers of international reserves;
c) Maintain public wage bill within sustainable levels;
and
d) Improve economic and labour statistics and
accessibility.
Economic Management
2 To increase domestic
revenue
a) Undertake tax policy and administrative reforms;
b) Limit tax exemptions and incentives;
c) Undertake a comprehensive audit and strengthening
of all revenue points and revenue sources so as to
enhance collections and yield;
d) Explore alternative sources of financing such as
Public Private Partnerships (PPPs), concessional and
non-concessional loans for projects that have high
economic returns; and
e) Explore other sources of revenue such as the
informal sector and MSMEs.
Revenue Mobilisation
3 To accelerate economic
diversification and
productive employment
a) Effectively monitorthe implementation of key
structural reforms such as PSDP Phase II, FSDP,
PEMFA, among others;
b) Review Employment Act Cap 268, Minimum Wage
Act 269, Industrial Relations Act Cap 270;
c) Develop and implement skills and labour
productivity programmes; and
d) Promote PPPs.
Economic Diversification
4 To improve public
expenditure and financial
management
a) Develop a new comprehensive Public Financial
Management Reform Strategy;
b) Strengthen the audit control system;
c) Roll out IFMIS to all central spending agencies and
provinces;
d) Strengthen the Commitment Control System;
e) Implement new treasury management system;
f) Develop and implement a debt management strategy
and debt database;
g) Finalise and implement procurement reforms; and
h) Undertake value for money and performance audits.
Public Finance Management
5 To improve budget
implementation
a) Implement Annual budgets in line with the MTEF
and NDP objectives
b) Enact the Planning and Budget Act
c) Produce and disseminate budget execution report
d) Minimize additional expenditures outside approved
budget by Parliament
Budget Execution
6 To promote Rural
Development
a) Accelerate implementation of rural development
programmes;
b) Rural electrification;
c) Rehabilitation and maintenance of primary feeder
and Tourism roads;
Rural Development

Sixth National Development Plan 2011 – 2015
21
No. Objectives Strategies Programmes
d) Rural water supply and sanitation;
e) Telecommunication expansion through universal
Access;
f) Promote high value Agriculture;
g) Rural finance programmes; and
h) Education and health care services, including rural
incentives and retention schemes.
2.8 Implementation, Monitoring and Evaluation
To effectively monitor and evaluate the implementation of programmes, the following output
matrix and key performance indicator tables will be used: Table 5: Sector Output Matrix
Programmes Output Indicators Indicator Definition Baseline
2009
Annual Targets
2011 2012 2013 2014 2015 2011-
2015
Economic
Management
Domestic borrowing as
% of GDP
Government
borrowing on the
domestic market
2.2 1.4 1.2 1.1 1.1 0.8 1.1
Public debt as % of
GDP
Public Debt is
defined as sum of
total external and
domestic debt
25.2 - - - - <27 <27
Domestic revenue as %
of GDP
Domestic revenues
comprises of taxes
(Income taxes, Value
added taxes, duties)
and non-taxes
revenues. The ratio
measures the ability
of the country to
generate its own
revenues from
domestic resources
14.8 >17.5 >18 >18 >19 >20 >20
a) Tax revenue as a
% GDP
- >17 >18 >18 >19 >20 >20
b) Non-tax revenue
as a % of GDP
- >0.5 >0.5 >0.5 >0.5 >0.5 >0.5
Formal sector
employment as a % of
Labour force
Defined as a ratio of
formal employment
as percent of total
labour force. Total
labour force is
defined as total
population that is
available to be
engaged in any kind
of labour activity.
10
(2008)
- - - - - >15
Labour Productivity (GDP per person
employed)
Public wages bill as %
GDP
The ratio measures
Government
expenditure on wages
and salaries of the
civil service as
proportion of GDP
8 <8 <8 <8 <8 <8 <8
Budget
Execution
Budgetary releases as
% of Budget allocation
Budget releases
refers to the actual
resources made
available for budget
implementation.
92 100 100 100 100 100 100
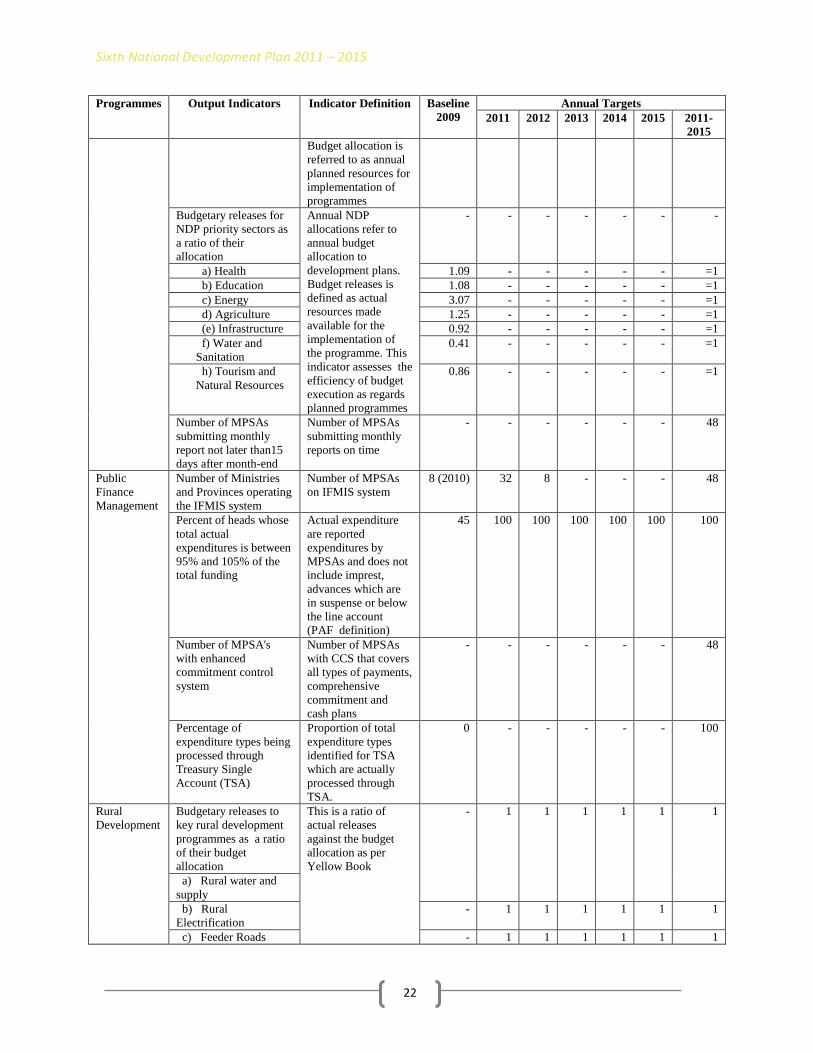
Sixth National Development Plan 2011 – 2015
22
Programmes Output Indicators Indicator Definition Baseline
2009
Annual Targets
2011 2012 2013 2014 2015 2011-
2015
Budget allocation is
referred to as annual
planned resources for
implementation of
programmes
Budgetary releases for
NDP priority sectors as
a ratio of their
allocation
Annual NDP
allocations refer to
annual budget
allocation to
development plans.
Budget releases is
defined as actual
resources made
available for the
implementation of
the programme. This
indicator assesses the
efficiency of budget
execution as regards
planned programmes
- - - - - - -
a) Health 1.09 - - - - - =1
b) Education 1.08 - - - - - =1
c) Energy 3.07 - - - - - =1
d) Agriculture 1.25 - - - - - =1
(e) Infrastructure 0.92 - - - - - =1
f) Water and
Sanitation
0.41 - - - - - =1
h) Tourism and
Natural Resources
0.86 - - - - - =1
Number of MPSAs
submitting monthly
report not later than15
days after month-end
Number of MPSAs
submitting monthly
reports on time
- - - - - - 48
Public
Finance
Management
Number of Ministries
and Provinces operating
the IFMIS system
Number of MPSAs
on IFMIS system
8 (2010) 32 8 - - - 48
Percent of heads whose
total actual
expenditures is between
95% and 105% of the
total funding
Actual expenditure
are reported
expenditures by
MPSAs and does not
include imprest,
advances which are
in suspense or below
the line account
(PAF definition)
45 100 100 100 100 100 100
Number of MPSA's
with enhanced
commitment control
system
Number of MPSAs
with CCS that covers
all types of payments,
comprehensive
commitment and
cash plans
- - - - - - 48
Percentage of
expenditure types being
processed through
Treasury Single
Account (TSA)
Proportion of total
expenditure types
identified for TSA
which are actually
processed through
TSA.
0 - - - - - 100
Rural
Development
Budgetary releases to
key rural development
programmes as a ratio
of their budget
allocation
This is a ratio of
actual releases
against the budget
allocation as per
Yellow Book
- 1 1 1 1 1 1
a) Rural water and
supply
b) Rural
Electrification
- 1 1 1 1 1 1
c) Feeder Roads - 1 1 1 1 1 1

Sixth National Development Plan 2011 – 2015
23
Programmes Output Indicators Indicator Definition Baseline
2009
Annual Targets
2011 2012 2013 2014 2015 2011-
2015
Number of districts
accessing telecom
services
The number of
districts connected to
fibre optic cable and
accessing telecom
services through the
fibre optic network
- - - - - - -
Number of Financial
Service Institutions
operational in rural
areas
This is the number of
institutions providing
financial services to
communities
- - - - - - -
Table 6: Key Performance Indicators
Key Performance Indicators Baseline Annual Targets
2011 2012 2013 2014 2015 2011-
2015
Average
Macroeconomics
Gross Domestic Product Growth Rate % 2009: (6.4) 6> 6> 6> 7> 7> 7>
Average Annual Inflation % 2009: (9.9) 7 7 6 5 5 5
Domestic Revenue as % of GDP 2009:(14.8) 17> 18> 18> 20> 20> 20>
Average Weighted Lending Rates 2009: (24 ) - - - - - <15
Poverty
Headcount Poverty 2006: (59.6) - - - - - 2015: <38
Extreme Poverty 2006: (37) - - - - - 2015:
<29*
Rural Poverty 2006: (77) - - - - - 2015: <50 * Based on the MDGs target of halving extreme poverty by 2015 based on the 1991 poverty figures

Sixth National Development Plan 2011 – 2015
24
3. CROSS-CUTTING ISSUES
3.1 Introduction
Governance, HIV and AIDS, Gender, Nutrition, Disability, Environment and Disaster Risk
Management are essential cross-cutting issues to the achievements of Zambia‟s desired socio-
economic development. Cross-cutting issues to be mainstreamed in the Plan are outlined below:-
3.2 Governance
Good governance remains the cornerstone for prudent managementof public affairs and ensuring
that development outcomes benefit the people of Zambia. In order to ensure “total adherence to
good governance by 2030”, Government will continue to promote good governance during the
Sixth National Development Plan (SNDP) period in the following areas; (1) enhancing integrity,
accountability and transparency in public and private bodies; (2) improving access to justice by
all especially for the vulnerable; (3) promoting of human rights; and (4) enhancing
democratization.
During the Fifth National Development Plan (FNDP) period, the major achievements of the
sector were the establishment of constituency offices for Members of Parliament; drafting of the
new Republican Constitution, the launch of the National Anti-Corruption Policy (NACP); and
construction of Victim Support Unit Offices in Mansa, Mongu and Lusaka. The sector also
facilitated the signing of a Memorandum of Understanding on the African Peer Review
Mechanism (APRM). In the area of Human Rights and Access to justice, a Parole System for
release of eligible prisoners was introduced. However, the main challenge faced was the slow
pace of implementation of governance reforms in the Judiciary and constitution-making process.
The focus during the SNDP will be on human and infrastructure development for governance
institutions to enhance their delivery capacities. In addition, governance institutions will be
decentralised to provincial levels as well as streamlining good governance practices in both
public and private sectors, facilitate the domestication of provisions of the international human
rights instruments into law and ensure the implementation of the new Republican Constitution.
Other areas of focus will be the implementation of Parliamentary reforms, Access to Justice
Programme, the National Anti-Corruption Policy and the APRM National Plan of Action.
3.2.1 Objectives, Strategies and Programmes
The matrix below shows the objectives, strategies and programmes for the Governance Sector
during the SNDP period.

Sixth National Development Plan 2011 – 2015
25
Table 7: Objectives, Strategies and Programmes
No. Objectives Strategies Programmes
1 To enhance governance and increase
access to civil and criminal justice
a) Develop additional infrastructure for
justice institutions;
b) Increase human capacity in governance
institutions;
c) Accelerate the decentralization of
governance institutions to Provincial
and/or district levels;
d) Develop and implement Case Flow
Management (CFM) system; and
e) Improve access to justice for the
vulnerable, especially women and
children.
Administration of justice
2 To facilitate the promotion of human
rights
Construct Offices for Human Rights
Institutions.
Human Rights
3 To promote broad-based participation in
public affairs
Invest in technology for continuous
voter‟s registration.
Democratization
4 To put in place effective mechanisms that
prevent corruption
a) Construction and rehabilitation of
transparency and accountability
institutions;
b) Streamline good governance practices in
sectors; and
c) Enhance coordination amongst the
governance institutions.
Accountability and
Transparency
3.2.2 Implementation, Monitoring and Evaluation
To effectively monitor and evaluate the implementation of sector programmes, the following
output matrix and key performance indicator tables will be used:
Table 8: Sector Output Matrix
Programmes Projects to be implemented Annual Targets Total
Expected
Output
2011 2012 2013 2014 2015
Administration
of Justice
Develop
additional
Infrastructure
for Justice
institutions
Local Courts 45 45 30 20 20 160
Subordinate
Courts
4 4 4 4 4 20
High Courts 2 2 2 1 1 8
VSU Offices 1 1 1 1 1 5
MoJ Office
block
1 0 0 0 0 1
Justice
Houses
1 1 1 1 1 5
Rehabilitation Supreme
Court
1 0 0 0 0 1
Human Rights Construct Offices for human
rights institutions
1 1 1 0 0 3
Democratization Invest in technology for
continuous voters‟ registration
2,500,000
registered
voters
223,290
registered
voters
226,983
registered
voters
230,738
registered
voters
234,553
registered
voters
3,415, 564
Accountability
and
Transparency
Construction of Offices for
transparency and
accountability institutions
(PPCA, ZLDC)
2 2 2 0 0 6
Construction of constituency
offices
9 9 9 9 9 45
Construction of the new 0 1 0 0 0 1

Sixth National Development Plan 2011 – 2015
26
Programmes Projects to be implemented Annual Targets Total
Expected
Output
chamber
Rehabilitation of the old
Chamber
1 0 0 0 0 1
Table 9: Key Performance Indicators
Key Performance
Indicators
Baseline
2010
Annual Targets Overall
Target 2011 2012 2013 2014 2015
Public Satisfaction in the
delivery of public
services
49% 65% 75% 85% 85%
85%
85%
Average Number of
verifiable interactions
between MPs and their
Constituents
30% 50% 60% 70% 80% 90% 90%
Proportion of cases
reported and
investigated
HRC 97% 100% 100% 100% 100% 100% 100%
ACC 72% 100% 100% 100% 100% 100% 100%
CFI 18% 100% 100% 100% 100% 100% 100%
PPCA 72% 100% 100% 100% 100% 100% 100%
JCA 80% 100% 100% 100% 100% 100% 100%
Backlog of cases Small Claims Court 30% 25% 20% 15% 10% 10%
Local Courts 30% 25% 20% 15% 10% 10%
Subordinate Courts 30% 25% 20% 15% 10% 10%
High Court (62%) 30% 25% 20% 15% 10% 10%
Supreme Court (27%) 30% 25% 20% 15% 10% 10%
Remand/Convict Ratio,
1: 5
30% 25% 20% 20% 20% 20% 20%

Sixth National Development Plan 2011 – 2015
3.2.3 Sector Budget and Financing
The matrix below shows the Sector Budget and Financing during the SNDP period. Table 10: Sector Budget and Financing (K’ Billion) - Governance
Programmes
2011 2012 2013 2014 2015
Cost in K Billions Cost in K Billions Cost in K Billions Cost in K Billions Cost in K Billions
GRZ Foreign
Financing
Total GRZ Foreign
Financing
Total GRZ Foreign
Financing
Total GRZ Foreign
Financing
Total GRZ Foreign
Financing
Total
Administration
of Justice
45.0
17.2
62.2
43.0
16.3
59.3
42.5
12.3
54.8
40.0
12.8
52.8
38.0
10.7
48.7
Human Rights
-
0.7
0.7
-
2.2
2.2
-
5.7
5.7
-
6.5
6.5
-
0.7
0.7
Democratisation
5.6
6.0
11.6
5.9
6.2
12.1
4.7
5.5
10.2
4.7
5.5
10.2
4.7
14.0
18.7
Accountability
& Transparency
-
3.5
3.5
-
4.0
4.0
-
3.0
3.0
-
2.5
2.5
-
2.0
2.0
Total
50.6
27.4
78.0
48.9
28.7
77.6
47.2
26.5
73.7
44.7
27.2
71.9
42.7
27.4
70.1
Sixth National Development Plan 2011 – 2015
28
3.3 HIV and AIDS
The HIV epidemic presents major challenges to the achievement of desired infrastructure and
human development aspirations of the SNDP. HIV and AIDS has the capacity to negate efforts
to promote human development and progress towards achieving the Millennium Development
Goals (MDGs). Although the epidemic is likely to affect overall long-term economic growth, the
short-term effects are evident at household, community and institutional levels.
During the FNDP period, the prevalence rate of HIV and AIDS slightly reduced and the
treatment coverage of Anti-Retroviral Therapy(ART) increased significantly. The prevalence
rate of HIV and AIDS reduced from 16.9 percent to 14.3 percent. Females were more likely to be
HIV positive (16.1 percent) than males (12.3 percent). Urban areas had higher prevalence (20
percent) than rural areas (10 percent)7. An estimated 10 percent of HIV transmission from parent
to child occurs during pregnancy, birth or breastfeeding, yet with effective treatment and follow-
up, paediatric HIV could be virtually eliminated.
The treatment coverage of ART increased significantly with 283,863 people in 2009 receiving
treatment that allows them to live longer and healthier lives. Significant progress has therefore
been made in access to treatment, blood safety and injection safety.
Challenges include slow progress in behavioural change, weak resource tracking, and poor
impact mitigation especially for Orphans and Vulnerable Children (OVC). In this regard, the
strategic focus during the SNDP period will be scaling up the comprehensive workplace and
community prevention, treatment, and impact mitigation response to HIV and AIDS by various
sectors and strengthening of mechanisms for a coordinated decentralized response.
Due to the impact HIV and AIDS has on the labour force particularly on the loss of productivity,
the pandemic is increasingly being addressed at the workplace level. The ongoing labour law
reform process proposes to make HIV and AIDS workplace policies and programmes mandatory
for companies.
During the SNDP period, concerted effort will be targeted at the six key drivers of new
infections which are 1) high rates of multiple concurrent sexual partners, 2) low and inconsistent
condom use, 3) low rates of male circumcision, 4) mobility, 5) vulnerable groups with high risk
behaviours, and 6) Mother To Child Transmission (MTCT).
7Central Statistical Office Zambia Demographic and Health Survey, 2007

Sixth National Development Plan 2011 – 2015
29
3.3.1 Objectives, Strategies and Programmes
The table below shows the objectives, strategies and programmes for the HIV and AIDS Sector
during the SNDP period. Table 11: Objectives, Strategies and Programmes
No. Objectives Strategies Programmes
1 To reduce the rate of new
infections every year (HIV
incidence)
a) Intensifying and accelerating prevention of sexual
transmission Promoting prevention of
Transmission of HIV in family settings including
MTCT;
b) Integrating prevention in all aspects of care at all
health care settings; and
c) Expanding and scaling-up access to and use of
VCT services.
Prevention Response
2 To expand access to appropriate
care, support and Treatment for
people living with HIV and
AIDS, their caregivers and their
families, including services for
TB, STIs and other
opportunistic infections
a) Promoting Universal access to quality ART and
Confidential Counseling and testing;
b) Scaling up of treatment for TB/STIs/OI including
cancers; and
c) Strengthening Home and Community Based Care
and provide access to palliative care.
Treatment, Care and
Support
3 To provide improved social
support services for orphans,
and vulnerable children, people
living with HIV and their
caregivers and families
a) Scaling up support services for Orphans and
vulnerable children Promoting Programmes of
food ; and
b) Security and income/livelihood generation for
PLHA and their caregivers and families.
Mitigation
4 To strengthen the capacity for a
well-coordinated and
sustainably managed HIV and
AIDS multi-sectoral response
a) Promoting practices which reduce stigma and
discrimination through structural and community
measures;
b) Strengthen mainstreaming, decentralisation and
community HIV and AIDS response;
c) Enhance resourcing and tracking of a sustained
national response;
d) Strengthen monitoring, evaluation and Research;
and
e) Streamline and align the HIV and AIDS
Institutional Arrangements in line with the
Decentralisation Policy and other legal
instruments.
Coordination and
Management
3.3.2 Implementation, Monitoring and Evaluation
To effectively monitor and evaluate the implementation of sector programmes, the following
output matrix and key performance indicator tables will be used: Table 12: Key Performance Indicators
Key
Performance
Indicators
Baseline
2010
Annual Targets
2011 2012 2013 2014 2015
CT# of adults
tested for HIV
and receiving
their test
results
1,910,253/
6,822,332(28%)
2,275,417/
7,001,282(33%)
2,643,413/
7,167,607(37%)
3,023,728/
7,330,249(41%)
3,414,029/
7,481,984(46%)
3,816,765/
7,633,530(50%)
PMTCT # of
HIV + women
receiving
47,175 /79,498
(2009) 61%
60,002/
81,504(73%)
66,415/
83,598(79%)
72,828/
85,708(85%)
79,242/
87,883(90%)
85,655/
90,163(95% )

Sixth National Development Plan 2011 – 2015
30
Key
Performance
Indicators
Baseline
2010
Annual Targets
2011 2012 2013 2014 2015
complete
course of ARV
ART # of
people with
HIV and AIDS
who receive
ARV
283,863/434,168
(2009)68%
361,919/
452,399(80%)
398,692/
469,050 (85%)
420,415/
483,236(87%)
443,643/
498,476 (89%)
462,443/
513,826 (90%)
ART # of
children who
have HIV and
Aids receiving
ARVs
21,050/36,215
(2009) 62%
26,080/
38,379 (68%)
28,595/
39,429 (72%)
31,110/
39,469 (79%)
33,625/
38,785 (87%)
36,140/
38,042 (95%)
Mainstreaming
# of
organizations
with
comprehensive
workplace and
community
response
strategies to
HIV and AIDS
(CS, Public
and private
sector,
informal
sector)
500
organizations
520 540 560 580 600
3.3.3 Sector Budget and Financing
Financing of the HIV and AIDS interventions are within the provisions of the Health Sector
Budget and Financing. In addition, It is expected that the efforts of combating HIV and AIDS
will be complimented by external financing.
3.4 Gender
Government will continue to advance the mainstreaming of gender in the development process
and the empowerment of women. In this regard, major interventions shall be gender
mainstreaming into policies and legislation; and support to the socio-economic empowerment of
women. Further, government will undertake to comprehensively integrate, into national policies
and programmes, important international and regional conventions and treaties on gender to
which Zambia is party.
In order to ascertain the empowerment of women, attention will be paid to interventions in
agriculture, land, energy, commerce, trade and industry, access to finance, education and
training, governance, social protection sectors and HIV and AIDS.
3.4.1 Objectives, Strategies and Programmes
The matrix below shows the objectives, strategies and programmes for the Gender Sector during
the SNDP period.

Sixth National Development Plan 2011 – 2015
31
Table 13: Objectives, Strategies and Programmes
No. Objectives Strategies Programmes
1 To develop gender responsive
policies and legal framework.
a) Domesticate appropriate and relevant
provisions contained in the Convention
on the Elimination of all forms of
Discrimination Against Women
(CEDAW);
b) Facilitate the enactment of the Gender
Based Violence (GBV)Bill;
c) Facilitate awareness raising on gender
and development issues;
d) Promote the review and harmonization of
customary and statutory land ownership
laws, procedures and administrative
practices; and
e) Facilitate the review of all pertinent
legislation to enhance women and girls
rights.
Gender Responsive Policies
and Legislation
2 To enhance capacity of women to
participate in national development
a) Devise appropriate poverty reduction
programmes and projects for women;
b) Facilitate capacity building in
entrepreneurship, survival and life skills
among women;
c) Promote girls‟ participation in science
and technology;
d) Enhance women and girls training in
leadership skills; and
e) Reduce the vulnerability of women to
Gender Based Violence and HIV
infection.
Empowerment of Women
3 To strengthen institutional capacities
for effective Gender mainstreaming
a) Facilitate monitoring of Gender and
development programmes and activities;
and
b) Promote and build capacity of systems
for collecting Gender disaggregated data.
Coordination for Gender
Mainstreaming
3.4.2 Implementation, Monitoring and Evaluation
To effectively monitor and evaluate the implementation of sector programmes, the following
output matrix and key performance indicator tables will be used: Table 14: Sector Output Matrix
Programmes Projects/Activities
to be
implemented
Annual targets Total Output
Expected end of
SNDP
Responsible
Institutions(s) Key
Stakeholders 2011 2012 2013 2014 2015
Gender
Mainstreaming
Capacity building 5 5 5 5 2 22 institutions
trained in Gender
mainstreaming
GIDD, ZAMIM,
ESAMI
Gender Audit 2 2 2 2 2 10 gender audits GIDD, ESAMI, Line
Ministries
Gender Surveys 1 1 1 3 p-surveys carried
out.
GIDD, Line Ministries
Legislative &
policy review
3 2 2 2 1 5 policies and 5
pieces of legislation
dev. & reviewed
GIDD,
MOJ,PAC,ZLDC, Line
Ministries
Empowerment
of Women
Training 15 15 15 15 15 75 women clubs
trained in
entrepreneurship
GIDD, ZDA,
ZACSMBA

Sixth National Development Plan 2011 – 2015
32
Programmes Projects/Activities
to be
implemented
Annual targets Total Output
Expected end of
SNDP
Responsible
Institutions(s) Key
Stakeholders 50 50 50 50 50 250 women in
politics trained in
leadership skills
GIDD,NGOCC ZWL,
CEEC
50 50 50 50 50 250 girls mentored
in leadership skills
GIDD,NGOCC ZWL
40 40 40 40 40 200 women trained
in corporate
management and
communication
GIDD, ZAFWIB, IoD,
MISA
Awareness
creation
2 2 2 2 1 9 provinces
sensitized on the
contents of Gender
Based Violence Bill
GIDD, MOJ, WILSA,
ZLDC
50 50 50 50 50 200 Women
attending
appropriate
technology demos.
GIDD, NISIR,TDAU,
Establish one stop
Centre for GBV
Survivors in 9
provinces
1 2 2 2 2 9 one stop Centres
for GBV Survivors
established
GIDD, MoH, MoHA,
MoJ, MCDSS
NGOCC, VSU
Table 15: Key Performance Indicators
Key Performance Indicators Baseline
2010
Annual Targets Overall
target
Name Definition 2011 2012 2013 2014 2015
Reduction in the
number of GBV cases
at national level
Percentage of women
experiencing GBV
47(ZDHS,2007) 45 40 35 30 25 25
Percentage of women
in Decision making
positions
Percentage of women in
decision making
positions in the public
sector
16 18 20 25 27 30 30
Percentage of women‟s
projects financed by
CEEC
Percentage of successful
projects promoted by
women under CEEC
22.7 24 26 28 29 30 30
Percentage of women
in formal sector
employment
Total number of
women/total formal
sector employment X
100
21% (2008) 24 26 28 29 30 30

Sixth National Development Plan 2011 – 2015
3.4.3 Sector Budget and Financing
The matrix below shows the Sector Budget and Financing during the SNDP period. Table 16: Sector Budget and Financing (K’ Billion) - Gender
Programme
2011 2012 2013 2014 2015
Cost in K’ Billions Cost in K’ Billions Cost in K’ Billions Cost in K’ Billions Cost in K’ Billions
GRZ Foreign
Financing
Total GRZ Foreign
Financing
Total GRZ Foreign
Financing
Total GRZ Foreign
Financing
Total GRZ Foreign
Financing
Total
Empowerment of
Women
11.0
-
11.0
7.6
-
7.6
7.6
-
7.6
8.1
-
8.1
8.5
-
8.5
Coordination for
Gender
Mainstreaming
0.5
-
0.5
0.7
-
0.7
0.6
-
0.6
0.6
-
0.6
0.7
-
0.7
Total
11.5
-
11.5
8.4
-
8.4
8.2
-
8.2
8.7
-
8.7
9.2
-
9.2

Sixth National Development Plan 2011 – 2015
34
3.5 Nutrition
Good nutrition underpins progress and will contribute towards achieving most of the MDGs and
the Vision 2030. Good nutrition also leads to enhanced education and health outcomes that
consequently contribute to improved productivity and overall national socio-economic
development.
During the SNDP period, the Nutrition sector will focus on guiding and expanding the scope of
implementation of, and monitoring the nutrition related interventions under various sectors as per
the National Food and Nutrition Policy. The key sectors of interest will be Agriculture,
Livestock and Fisheries Development, Health, Education and Skills Development and
Commerce, Trade and Industry.
Under Health, the focus will be to advocate for increased access to and coverage of high impact
community-based nutrition interventions. In Agriculture, the focus will be to advocate for the
promotion of nutritious diet through crop diversification, adequate food processing, storage and
utilization. Under Education the sector will support the expansion of school nutrition services.
The sector will also centre its efforts on ensuring adequate quality and safety of locally produced
and imported food and food products in collaboration with Commerce, Trade and Industry. The
selected strategies within the key sectors will contribute towards improvement in the nutrition
status of the population, thus adding value to the human capital required for social and economic
development.
Furthermore, to enhance and streamline the interventions, the sector will facilitate the
amendment of the National Food and Nutrition Commission Act No. 41 of 1967, to empower the
National Food and Nutrition Commission (NFNC) to effectively coordinate the nutrition sector
in view of the current emerging food and nutrition and related challenges.
3.5.1 Objectives, Strategies and Programmes
The table below shows the objectives, strategies and programmes for the Nutrition Sector during
the SNDP period. Table 17: Objectives, Strategies and Programmes
No. Objectives Strategies Programmes
1 To improve the nutritional
status of the Zambian
population through the
provision of quality
nutrition services and
increased availability,
access and utilization of
quality and safe foods
a) Amend the National Food and Nutrition Commission
Act No. 41 of 1967;
b) Expand proven high impact and cost effective food
and nutrition interventions focusing on under-served
areas and vulnerable population groups;
c) Advocate for the promotion of nutritious diet
through crop diversification, adequate food
processing, storage and utilization;
d) Ensure adequate quality and safety of local and
imported food and food products;
e) Enhance effective utilization of food by advocating
for control, prevention and treatment of diseases
having an impact on nutrition and specifically
community-based interventions; and
f) Support expansion of the school feeding programme
and other school nutrition services.
Food and Nutrition
Coordination and
Management

Sixth National Development Plan 2011 – 2015
35
3.5.2 Implementation, Monitoring and Evaluation
To effectively monitor and evaluate the implementation of sector programmes, the following
output matrix and key performance indicator tables will be used: Table 18: Key Performance Indictors
Key
Performance
Indicators
Indicator Definition Baseline
2009
Annual Targets
2011 2012 2013 2014 2015
Prevalence of
underweight
Percentage of under five children
with weight-for-age below -2SD
(WHO reference)
15%* 14% 13% 12% 11% 10%
Prevalence of
stunting
Percentage of under five children
with height-for-age below -2SD
(WHO reference)
45%* 42% 39% 36% 33% 30%
Coverage of
use of
adequately
iodized salt
Percentage of households using
salt iodized with 20-40 ppm
- > 70% > 80% > 80% > 90% > 90%
3.6 Disability and Development
In the Plan, the focus will be to accelerate mainstreaming of disability issues in national
development in order to improve the lives of persons with disabilities. This will be done through
the development and implementation of legislation, policies and programmes in line with the UN
Convention of Rights for Persons with Disability (UNCRPD).
Government will ensure that user friendly infrastructure is in place to enhance accessibility to
services by persons with disabilities. The creation of productive and decent employment for
Persons WithDisabilities (PWDs) will also be taken into prime consideration. Other interventions
will include provision of free medical and health services, assistive technology, promotion of
community rehabilitation centres, providing education opportunities and skills development to
vulnerable persons with disabilities, and employment promotion for persons with disabilities.
3.6.1 Objectives, Strategies and Programmes
The table below shows the objectives, strategies and programmes for Disability and
Development during the SNDP period.

Sixth National Development Plan 2011 – 2015
36
Table 19: Objectives, Strategies and Programmes
No. Objectives Strategies Programmes
1 To enable persons with disabilities
participate fully in all aspects of life
a) Identify and eliminate obstacles and
barriers to accessibility in the physical
environment, transportation and
information communication technology;
and
b) Provide training to Disabled Persons
Organisations (DPOs) Inspectors on
issues of accessibility by Persons with
Disabilities.
Accessibility
2 To ensure that health services are
accessible to persons with disabilities
a) Provide free medical &health servicesto
vulnerable persons with disabilities.
Medical Care
3 To ensure persons with disabilities
have access to quality rehabilitation
services to attain their full functional
capacity
a) Provide assistive technology to the
disabled;
b) Rehabilitate existing rehabilitation
centres; and
c) Establish, promote and support
community based rehabilitation for
persons with disabilities.
Rehabilitation and
Independent living
4 To provide inclusive education and
skills training at all levels
a) Strengthen and implement training
programmes for teachers in special
needs education;
b) Provide education opportunities and
skills development to vulnerable persons
with disabilities;
c) Provide adequate educational facilities,
services, equipment and materials to
persons with disabilities in learning
institutions; and
d) Promote the employability of PWDs.
Education and Skills
Development
5 To create equal employment
opportunities for Persons with
Disabilities in decent employment
a) Provide incentives to organizations and
individuals to enhance employment
opportunities for persons with
disabilities;
b) Provide micro-credit to persons with
disabilities to enable them undertake
entrepreneurial activities; and
c) Develop a mechanism for PWDs to
access funds from financial Institutions.
Employment promotion for
PWDs

Sixth National Development Plan 2011 – 2015
3.6.2 Sector Budget and Financing
The matrix below shows the Sector Budget and Financing during the SNDP period.
Table 20: Sector Budget and Financing – Disability and Development
Programme
2011 2012 2013 2014 2015
Cost in K Billions Cost in K Billions Cost in K Billions Cost in K Billions Cost in K Billions
GRZ Foreign
Financing
Total GRZ Foreign
Financing
Total GRZ Foreign
Financing
Total GRZ Foreign
Financing
Total GRZ Foreign
Financing
Total
Accessibility
1.0
-
1.0
1.5
-
1.5
1.6
-
1.6
1.8
-
1.8
1.9
-
1.9
Medical Care
2.0
-
2.0
1.0
-
1.0
1.5
-
1.5
1.6
-
1.6
1.8
-
1.8
Rehabilitation
and Independent
Living
3.0
-
3.0
3.5
-
3.5
3.5
-
3.5
4.0
-
4.0
4.0
-
4.0
Education and
Skills
Development
2.4
-
2.4
3.0
-
3.0
3.0
-
3.0
3.0
-
3.0
3.5
-
3.5
Employment
Promotion for
PWDS
1.2
-
1.2
1.7
-
1.7
1.8
-
1.8
1.9
-
1.9
2.0
-
2.0
Total
9.6
-
9.6
10.7
-
10.7
11.4
-
11.4
12.3
-
12.3
13.1
-
13.1

Sixth National Development Plan 2011 – 2015
38
3.7 Environment
During the FNDP period, the legal and policy framework was strengthened through the adoption
of the National Policy on Environment. Other achievements were the review and amendment of
the Environmental Protection and Pollution Control Act of 1990, initiation of the Environmental
and Natural Resources Management, and Mainstreaming Programme (ENRMMP) and
Reclassification of Effective Management of National Protected Areas System.
The sector‟s main challenges were inadequate human and technical capacity and weak
coordination for environmental policy implementation and law enforcement.
During the SNDP period, the National Policy on Environment (NPE) and Environmental
Protection and Pollution Control Act (EPPCA) will be reviewed to address emerging issues on
climate change and Strategic Environmental Assessment (SEA). The sector will also undertake
legal reforms to domesticate some international environmental conventions and protocols. The
sector will also collaborate with relevant stakeholders to speed up the implementation of the
National Decentralization Policy in order to facilitate improved service delivery. In addition,
other sector policies that have a bearing on the environment will be strengthened to promote
environmental sustainability. These include policies in agriculture, forestry, wildlife, water,
energy, mining, land, health, construction as well as science and technology.
3.7.1 Objectives, Strategies and Programmes
The matrix below shows the objectives, strategies and programmes for the Environment during
the SNDP period.
Table 21: Objectives, Strategies and Programmes
No. Objectives Strategies Programmes
1. To strengthen policy
and legal framework
for effective
environmental
management
a) Harmonize sector policies and legislation to ensure adequate
coverage of environmental and natural resources concerns in
selected sectors (Agriculture, Health, Education, Energy,
Water, Land, Infrastructure, Mining, Local government and
MoFNP);
b) Review existing policy and legal framework for
environmental management;
c) Strengthen enforcement of environmental regulations;
d) Domesticate Multilateral Environmental Agreements;
e) Develop long term environment and climate change;
mainstreaming and response strategies respectively for
implementation at national, sector and sub national levels;
and
f) Strengthen institutional capacity at national, provincial,
district and community levels to effectively implement the
policy and legal framework.
Environmental
Protection and Pollution
Control
To strengthen
environmental
protection and
management
a) Improve data and information management systems and
equipment and human capacity for environmental accounting
and pollution mitigation and control;
b) Promote sustainable land management and facilitate
rehabilitation of degraded lands in open areas;
c) Improve management of waste, chemicals and effluent;
d) Information management systems and equipment for air
quality monitoring installed across the country;
e) Improved environmental emergency response capacity; and
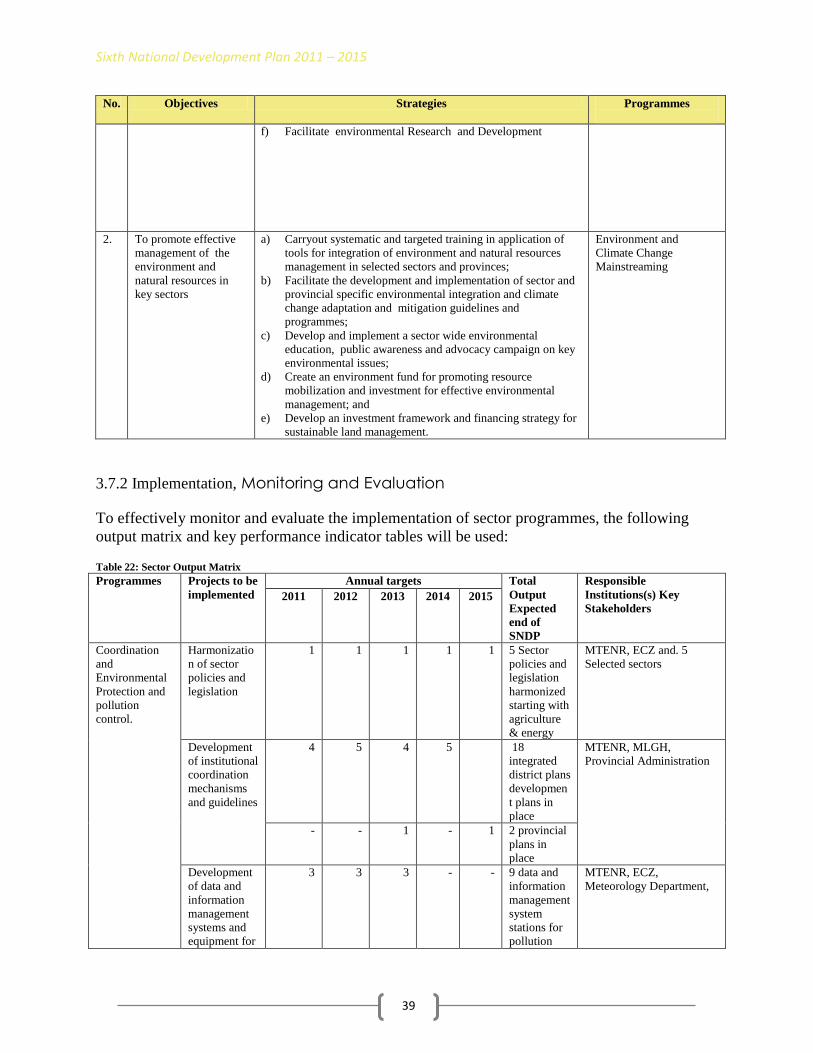
Sixth National Development Plan 2011 – 2015
39
No. Objectives Strategies Programmes
f) Facilitate environmental Research and Development
2. To promote effective
management of the
environment and
natural resources in
key sectors
a) Carryout systematic and targeted training in application of
tools for integration of environment and natural resources
management in selected sectors and provinces;
b) Facilitate the development and implementation of sector and
provincial specific environmental integration and climate
change adaptation and mitigation guidelines and
programmes;
c) Develop and implement a sector wide environmental
education, public awareness and advocacy campaign on key
environmental issues;
d) Create an environment fund for promoting resource
mobilization and investment for effective environmental
management; and
e) Develop an investment framework and financing strategy for
sustainable land management.
Environment and
Climate Change
Mainstreaming
3.7.2 Implementation, Monitoring and Evaluation
To effectively monitor and evaluate the implementation of sector programmes, the following
output matrix and key performance indicator tables will be used: Table 22: Sector Output Matrix
Programmes Projects to be
implemented
Annual targets Total
Output
Expected
end of
SNDP
Responsible
Institutions(s) Key
Stakeholders 2011 2012 2013 2014 2015
Coordination
and
Environmental
Protection and
pollution
control.
Harmonizatio
n of sector
policies and
legislation
1 1 1 1 1 5 Sector
policies and
legislation
harmonized
starting with
agriculture
& energy
MTENR, ECZ and. 5
Selected sectors
Development
of institutional
coordination
mechanisms
and guidelines
4 5 4 5 18
integrated
district plans
developmen
t plans in
place
MTENR, MLGH,
Provincial Administration
- - 1 - 1 2 provincial
plans in
place
Development
of data and
information
management
systems and
equipment for
3 3 3 - - 9 data and
information
management
system
stations for
pollution
MTENR, ECZ,
Meteorology Department,
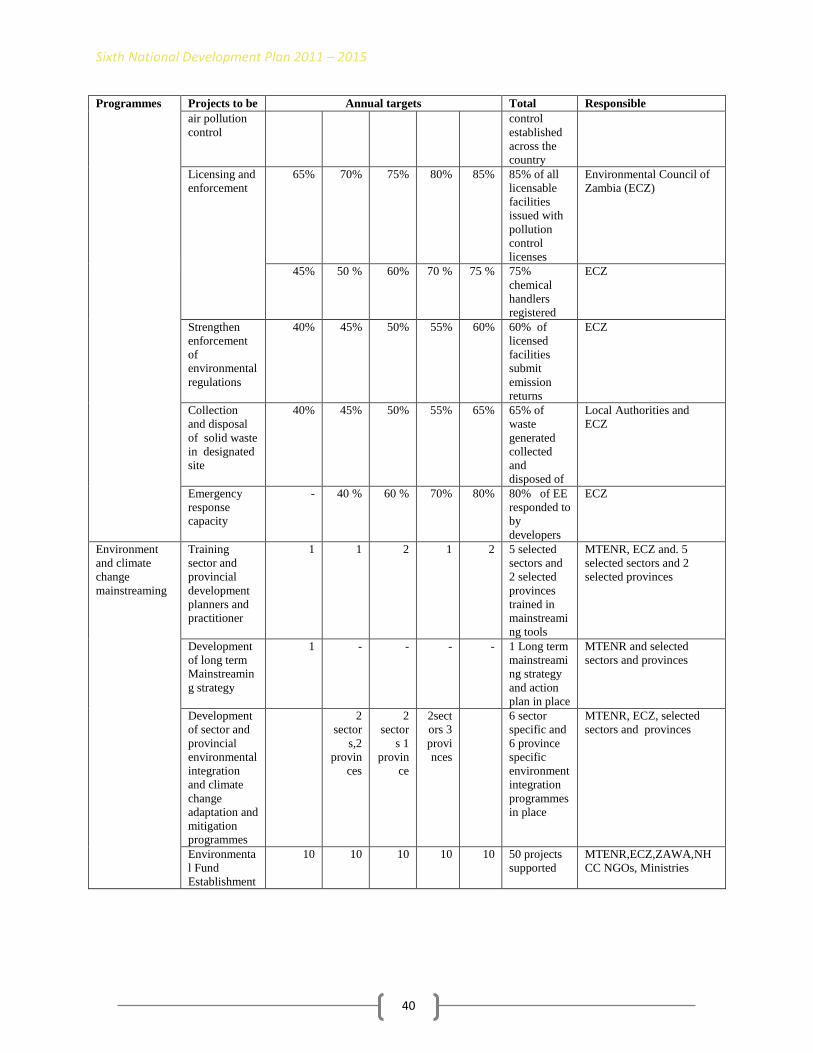
Sixth National Development Plan 2011 – 2015
40
Programmes Projects to be
implemented
Annual targets Total
Output
Expected
end of
SNDP
Responsible
Institutions(s) Key
Stakeholders air pollution
control
control
established
across the
country
Licensing and
enforcement
65% 70% 75% 80% 85%
85% of all
licensable
facilities
issued with
pollution
control
licenses
Environmental Council of
Zambia (ECZ)
45% 50 % 60% 70 % 75 % 75%
chemical
handlers
registered
ECZ
Strengthen
enforcement
of
environmental
regulations
40% 45%
50% 55% 60% 60% of
licensed
facilities
submit
emission
returns
ECZ
Collection
and disposal
of solid waste
in designated
site
40% 45% 50% 55% 65% 65% of
waste
generated
collected
and
disposed of
Local Authorities and
ECZ
Emergency
response
capacity
- 40 % 60 % 70% 80% 80% of EE
responded to
by
developers
ECZ
Environment
and climate
change
mainstreaming
Training
sector and
provincial
development
planners and
practitioner
1 1 2 1 2 5 selected
sectors and
2 selected
provinces
trained in
mainstreami
ng tools
MTENR, ECZ and. 5
selected sectors and 2
selected provinces
Development
of long term
Mainstreamin
g strategy
1 - - - - 1 Long term
mainstreami
ng strategy
and action
plan in place
MTENR and selected
sectors and provinces
Development
of sector and
provincial
environmental
integration
and climate
change
adaptation and
mitigation
programmes
2
sector
s,2
provin
ces
2
sector
s 1
provin
ce
2sect
ors 3
provi
nces
6 sector
specific and
6 province
specific
environment
integration
programmes
in place
MTENR, ECZ, selected
sectors and provinces
Environmenta
l Fund
Establishment
10 10 10 10 10 50 projects
supported
MTENR,ECZ,ZAWA,NH
CC NGOs, Ministries
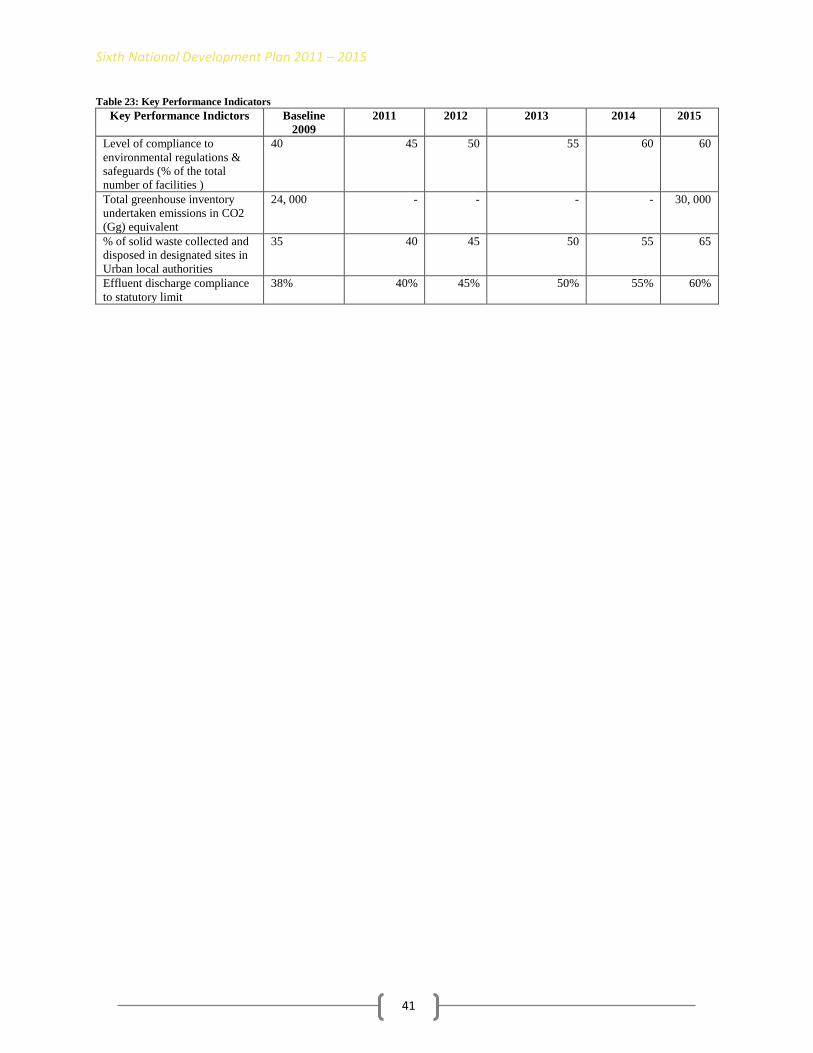
Sixth National Development Plan 2011 – 2015
41
Table 23: Key Performance Indicators
Key Performance Indictors Baseline
2009
2011 2012 2013 2014 2015
Level of compliance to
environmental regulations &
safeguards (% of the total
number of facilities )
40 45 50 55 60 60
Total greenhouse inventory
undertaken emissions in CO2
(Gg) equivalent
24, 000 - - - - 30, 000
% of solid waste collected and
disposed in designated sites in
Urban local authorities
35 40 45 50 55 65
Effluent discharge compliance
to statutory limit
38% 40% 45% 50% 55% 60%
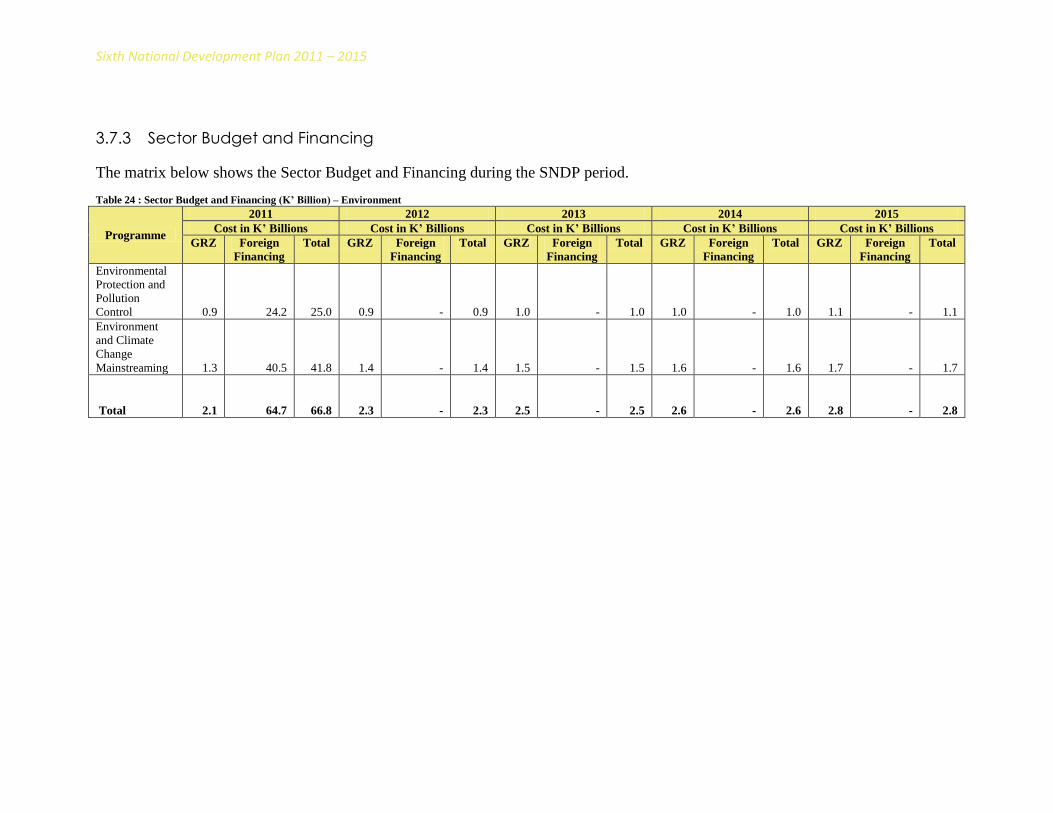
Sixth National Development Plan 2011 – 2015
3.7.3 Sector Budget and Financing
The matrix below shows the Sector Budget and Financing during the SNDP period.
Table 24 : Sector Budget and Financing (K’ Billion) – Environment
Programme
2011 2012 2013 2014 2015
Cost in K’ Billions Cost in K’ Billions Cost in K’ Billions Cost in K’ Billions Cost in K’ Billions
GRZ Foreign
Financing
Total GRZ Foreign
Financing
Total GRZ Foreign
Financing
Total GRZ Foreign
Financing
Total GRZ Foreign
Financing
Total
Environmental
Protection and
Pollution
Control
0.9
24.2
25.0
0.9
-
0.9
1.0
-
1.0
1.0
-
1.0
1.1
-
1.1
Environment
and Climate
Change
Mainstreaming
1.3
40.5
41.8
1.4
-
1.4
1.5
-
1.5
1.6
-
1.6
1.7
-
1.7
Total
2.1
64.7
66.8
2.3
-
2.3
2.5
-
2.5
2.6
-
2.6
2.8
-
2.8
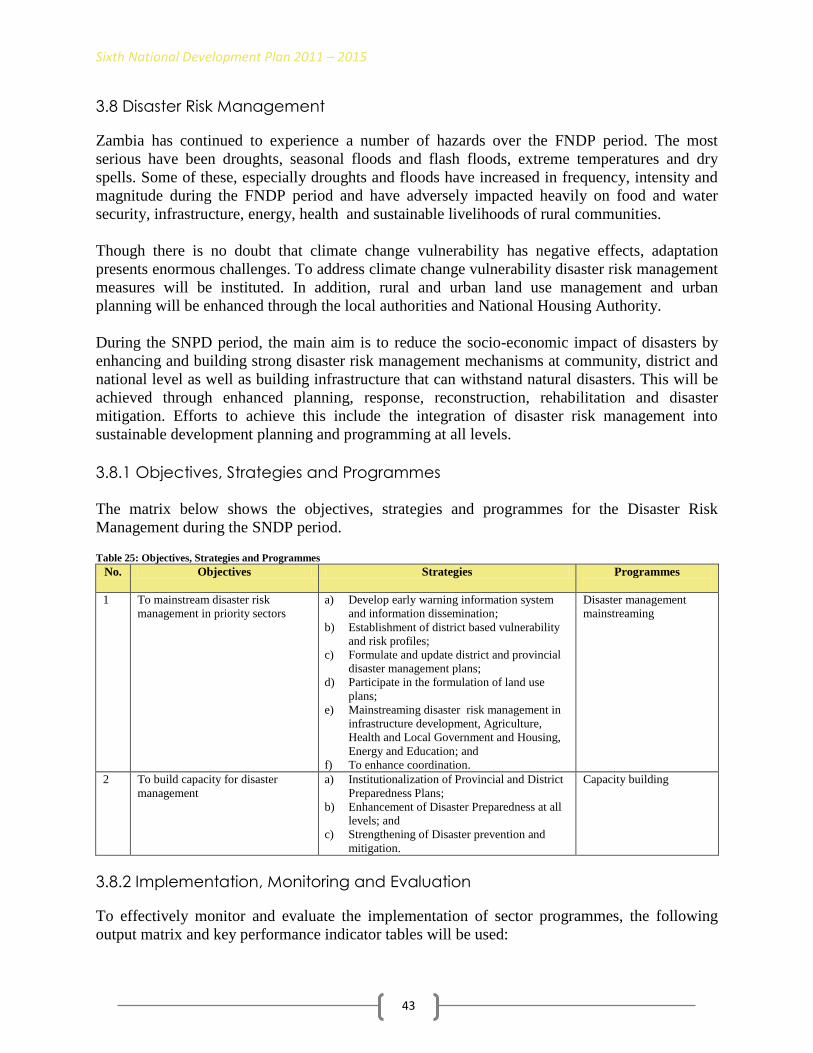
Sixth National Development Plan 2011 – 2015
43
3.8 Disaster Risk Management
Zambia has continued to experience a number of hazards over the FNDP period. The most
serious have been droughts, seasonal floods and flash floods, extreme temperatures and dry
spells. Some of these, especially droughts and floods have increased in frequency, intensity and
magnitude during the FNDP period and have adversely impacted heavily on food and water
security, infrastructure, energy, health and sustainable livelihoods of rural communities.
Though there is no doubt that climate change vulnerability has negative effects, adaptation
presents enormous challenges. To address climate change vulnerability disaster risk management
measures will be instituted. In addition, rural and urban land use management and urban
planning will be enhanced through the local authorities and National Housing Authority.
During the SNPD period, the main aim is to reduce the socio-economic impact of disasters by
enhancing and building strong disaster risk management mechanisms at community, district and
national level as well as building infrastructure that can withstand natural disasters. This will be
achieved through enhanced planning, response, reconstruction, rehabilitation and disaster
mitigation. Efforts to achieve this include the integration of disaster risk management into
sustainable development planning and programming at all levels.
3.8.1 Objectives, Strategies and Programmes
The matrix below shows the objectives, strategies and programmes for the Disaster Risk
Management during the SNDP period. Table 25: Objectives, Strategies and Programmes
No. Objectives Strategies Programmes
1 To mainstream disaster risk
management in priority sectors
a) Develop early warning information system
and information dissemination;
b) Establishment of district based vulnerability
and risk profiles;
c) Formulate and update district and provincial
disaster management plans;
d) Participate in the formulation of land use
plans;
e) Mainstreaming disaster risk management in
infrastructure development, Agriculture,
Health and Local Government and Housing,
Energy and Education; and
f) To enhance coordination.
Disaster management
mainstreaming
2 To build capacity for disaster
management
a) Institutionalization of Provincial and District
Preparedness Plans;
b) Enhancement of Disaster Preparedness at all
levels; and
c) Strengthening of Disaster prevention and
mitigation.
Capacity building
3.8.2 Implementation, Monitoring and Evaluation
To effectively monitor and evaluate the implementation of sector programmes, the following
output matrix and key performance indicator tables will be used:

Sixth National Development Plan 2011 – 2015
44
Table 26: Sector Output Matrix
Programmes Projects/activities
to be
implemented
Annual targets Total Output
Expected end of
SNDP
Responsible
Institution(s)
and Key
Stakeholders
2011 2012 2013 2014 2015
Disaster
management
mainstreaming
Vulnerability and
Risk Profiling
41 32 - - - 73 District
Profiles in Place.
DMMU,
CSO
Institutionalization of Disaster Risk
Management
Plans
20 27 26 - - 73 Disaster Management
Plans in Place
DMMU
Disaster Risk Management
Stakeholder
Capacity Building
9 - - - - 9 Sectors sensitized and
oriented in
Disaster risk management and
mitigation
DMMU
Disaster Risk
Management
Framework
Formulation
- 1 - - - A Disaster Risk
Management
Framework in
Place.
DMMU
Early Warning 1 1 2 2 1 1 Early Warning Systems in Place
at DMMU
Headquarters and 5 other sector
systems developed (in
Mines, Education,
Local Government,
Commerce and
Industry and Community
development)
DMMU, MMMD,
MOE,
MLGH, MCTI,
MCDSS
Disaster Risk
Management Capacity
Strengthening
Maintenance of
adequate stocks for disaster
response
(a)
4,500 Mt of
grain
a) 4,500
Mt of grain
a) 4,500
Mt of grain
a) 4,500
Mt of grain
(a) 4,500
Mt of grain
4,500 Mt of grain
DMMU
(b) 4,500
tents
(b) 4,500 tents
(b) 4,500 tents
(b) 4,500 tents
(b) 4,500 tents
4,500 tents
DMMU
(c)
5,000 boxes of
Chlorine
(c) 5,000
boxes of Chlorine
(c) 5,000
boxes of Chlorine
(c) 5,000
boxes of Chlorine
(c) 5,000
boxes of Chlorine
5,000 boxes of
Chlorine
DMMU
(d) 4,500
ITN
(d) ,4500 ITN
(d) 4,500 ITN
(d) 4,500 ITN
(d) 4,500 ITN
4,500 ITN
DMMU
(e) 300
Cholera Drug
Kits
(e) To be
established
(e) To be
established
(e) To be
established
(e) To be
established
To be established
DMMU

Sixth National Development Plan 2011 – 2015
45
Table 27: Key Performance Indicators
Key Performance
Indicators
Definition Baseline
(2010)
2011 2012 2013 2014 2015
Response Time (Hrs)
(a) National
This is the time
taken between
the time a
disaster strikes
and the time the
affected
communities
receive an
intervention
from the
Disaster
Management
Cadre
72 48 36 24 12 within 12
hours
(b)Provincial 36 24 12 6 4 within 4
hours
(c)Satellite 3 2 1 within an
1 hour
within an
1 hour
within an
1 hour
Early Warning Response
level (%)
This is the
percentage of
people who are
exposed to
hazard risk who
receive early
warning
information and
take action.
23 30 40 50 55 60
Stock Threshold
(a) food stocks
(maize
equivalent -Mt)
This is the
minimum level
of stock
(disaggregated
as; food and
non-food)
available for
disaster
management
and mitigation
at any given
time, measured
in metric tonnes
(Mt).
(a) 4,500 (a) 4,500 (a) 4,500 (a)4,500 (a) 4,500 (a) 4,500
(b) Tents (b) 4,500 (b) 4,500 (b) 4,500 (b) 4,500 (b) 4,500 (b) 4,500
(c) Chlorine (c) 5000
boxes of
Chlorine
(c) To be
established
(c) To be
established
(c) To be
established
(c) To be
established
(c) To be
established
(d) Insecticide
Treated Nets
(d) 4,500 (d) 4,500 (d) 4,500 (d) 4,500 (d) 4,500 (d) 4,500
(h) Drug Kits (e) 300
Cholera
Drug Kits
(e) To be
established
(e) To be
established
(e) To be
established
(e) To be
established
(e) To be
established

Sixth National Development Plan 2011 – 2015
3.8.3 Sector Budget and Financing
The matrix below shows the Sector Budget and Financing during the SNDP period. Table 28: Sector Budget and Financing (K’ Billion) – Disaster Risk Management
Programmes
2011 2012 2013 2014 2015
Cost in K’ Billions Cost in K’ Billions Cost in K’ Billions Cost in K’ Billions Cost in K’ Billions
GRZ Foreign
Financing Total GRZ
Foreign
Financing Total GRZ
Foreign
Financing Total GRZ
Foreign
Financing Total GRZ
Foreign
Financing Total
Coordination of
Disaster
Management
Programmes
0.5 - 0.5 0.5 - 0.5 0.6 - 0.6 0.6 - 0.6 0.5 - 0.5
Provision of
Management
Services
1.3 - 1.3 1.2 - 1.2 1.2 - 1.2 1.1 - 1.1 1.5 - 1.5
Disaster
Response
42.6 - 42.6 27.8 - 27.8 28.0 - 28.0 23.5 - 23.2 18.5 - 18.5
Stock Piling
3.0 - 3.0 3.2 - 3.2 3.0 - 3.0 3.2 - 3.2 2.9 - 2.9
Development
and
Maintenance of
Information
and
Communication
Systems
0.6 - 0.6 0.7 - 0.7 0.7 - 0.7 0.5 - 0.5 0.6 - 0.6
Project
formulation 0.2 - 0.2 0.1 - 0.1 0.1 - 0.1 0.2 - 0.2 0.2 - 0.2
Vulnerability
and Needs
Assessment
Profiling
0.2 - 0.2 0.2 - 0.2 0.1 - 0.1 0.1 - 0.1 0.2 - 0.2
Disaster
Preparedness 0.5 - 0.5 0.2 - 0.2 0.2 - 0.2 0.2 - 0.2 0.2 - 0.2
Total 49.0 - 49.0 34.0 - 34.0 34.0 - 34.0 29.4 - 29.1 24.6 - 24.6

Sixth National Development Plan 2011 – 2015
47
4. FINANCING
4.1 Fiscal Framework
Over the SNDP period, Government projects to increase domestic revenues as a share of GDP to
an average of 18.6 percent from the FNDP target of 17.7 percent. This is premised on improved
economic activities and tax administration as well as an expansionary tax reform programme
which will be undertaken in 2011 and 2012. In view of the envisaged increase in domestic
revenues, grants from Cooperating Partners are expected to reduce from an average of 3.3
percent of GDP in 2010 to an average of 2.1 percent over the SNDP period.
The projected revenues and expenditures as a share of GDP are shown in the Table below.
Table 29: Projected Revenues and Expenditures as a Share of GDP (%)
2011 2012 2013 2014 2015 Average
GDP 100.00% 100.00% 100.00% 100.00% 100.00% 2011 -2015
Total Revenues and Grants 20.11% 20.48% 20.64% 20.92% 21.39% 20.71%
Domestic Revenues 18.27% 17.84% 18.41% 18.94% 19.64% 18.62%
Tax Revenues 17.64% 17.21% 17.77% 18.30% 18.99% 17.98%
Non-Tax Revenues 0.62% 0.63% 0.63% 0.64% 0.65% 0.64%
Grants from Cooperating Partners 1.84% 2.64% 2.23% 1.98% 1.75% 2.09%
Total Expenditure 23.31% 26.44% 24.41% 22.69% 22.31% 23.83%
Expenses & Liabilities 17.24% 15.97% 15.19% 13.79% 14.01% 15.24%
Assets 6.07% 10.46% 9.22% 8.90% 8.30% 8.59%
o/w Domestically Financed 3.44% 4.30% 5.22% 6.90% 6.90% 5.35%
Domestically Financed Roads 1.76% 1.80% 2.20% 2.75% 3.19% 2.34%
Rural Electrification 0.17% 0.15% 0.15% 0.14% 0.17% 0.16%
Water and Sanitation 0.14% 0.15% 0.32% 0.33% 0.33% 0.25%
Financing 3.20% 5.96% 3.77% 1.78% 0.92% 3.12%
Domestic Financing 1.41% 1.20% 1.10% 1.10% 0.75% 1.11%
External Financing 1.79% 4.76% 2.67% 0.68% 0.17% 2.01%
Projected Government expenditures are expected to broadly remain at an average of 23.8 percent
of GDP during the Plan period. Government‟s intention during the SNDP period is to create
more fiscal space to allow for increased spending on core programmes.
In this regard, Government projects expenses and liabilities to decline from 17.2 percent of GDP
in 2011 to 14.0 percent of GDP by 2015. The driving factors in this downward trend are
expected to be the reduction in administrative costs across all Government departments, without
constraining key operations in the critical sectors of health, education and skills development.
Efficient use of resources in the health, education and road sectors will be important.
In line with the SNDP‟s strategic focus of facilitating economic development through increased
investments in infrastructure, Government‟s resource allocation towards capital expenditures is
projected to substantially increase from 6.1 percent of GDP in 2011 to 8.3 percent of GDP by

Sixth National Development Plan 2011 – 2015
48
2015. The bulk of these resources will go towards infrastructure development particularly in
health, education and skills development. In addition, Government will also commit a
significant share of its domestic resources to other core programmes such as roadinfrastructure,
rural electrification and water and sanitation. As such, the Government projects to increase the
domestic allocation to road infrastructure development from 1.8 percent of GDP in 2011 to 3.2
percent of GDP by 2015. The Government will also allocate adequate resources to the Rural
Electrification Programme as projected in the Rural Electrification Master Plan. In addition, the
allocation to water and sanitation will increase from 0.1 percent of GDP in 2011 to 0.3 percent of
GDP by 2015.
4.2 Estimation of Resources for the SNDP
Total resources8 for the SNDP (2011-2015) are projected at K132.2 trillion and expected to
average K26.4 trillion per annum. Of the total resources, non-discretionary expenditures such as
Personal Emoluments, Debt Service and Grants to Institutions will account for K78.7 trillion or
59.5 percent of the total resources. The remaining balance of K53.6 trillion representing 40.5
percent of the total resources will be applied on discretionary expenditures. Of the discretionary
resources, K48.0 trillion or 89.6 percent is earmarked for the strategic focus of the SNDP and
will be applied on roads, health, education and skills development, water and sanitation
programmes and foreign financed capital projects. The balance of K5.6 trillion will be directed to
the rest of the SNDP programmes. Table 30: Estimates of Resources Available for SNDP Programmes
2011
K'Billion
2012
K'Billion
2013
K'Billi
on
2014
K'Billion
2015
K'Billi
on TOTAL Average
Total Resource Envelope 20,537 25,903 26,789 28,123 30,866 132,219 26,444
Domestic Revenues 15,769 17,285 19,997 23,242 26,932 103,224 20,645
Tax Revenues 15,230 16,675 19,308 22,456 26,037 99,707 19,941
Non-Tax Revenues 539 610 688 786 895 3,518 704
Grants from Co-operating Partners 1,588 2,557 2,425 2,426 2,394 11,390 2,278
Total Financing 3,181 6,060 4,367 2,456 1,540 17,604 3,521
Domestic Financing 1,220 1,163 1,195 1,350 1,028 5,956 1,191
Foreign Financing 1,961 4,897 3,172 1,106 512 11,648 2,330
Total Expenditure 20,537 25,903 26,789 28,123 30,866 132,219 26,444
Precommited Expenditures 13,543 14,325 16,757 16,024 18,006 78,656 15,731
Personal Emoluments 7,404 8,122 8,803 9,544 10,292 44,165 8,833
Debt Service 1,665 1,654 1,761 1,938 2,113 9,131 1,826
Awards and Compensation 170 100 100 150 88 608 122
Pension Fund 359 304 339 353 417 1,771 354
Settlement of Domestic Arrears 85 30 50 0 0 165 33
Grants to Institutions 1,216 1,257 1,389 1,471 1,549 6,883 1,377
8 Total resources include domestic revenues (tax and non-tax revenue), grants from Co-operating Partners and financing (domestic and external borrowing).

Sixth National Development Plan 2011 – 2015
49
2011
K'Billion
2012
K'Billion
2013
K'Billi
on
2014
K'Billion
2015
K'Billi
on TOTAL Average
Voter Registration/Election 243 4 4 4 4 259 52
Food Security Pack 15 15 15 15 15 75 15
Operations of MPSAs 1,424 1,340 1,640 1,647 2,410 8,461 1,692
Empowerment Funds 76 76 100 100 100 452 90
Foreign Financed 503 1,271 2,421 666 862 5,722 1,144
Resources Available For SNDP
Programmes 6,995 11,577 10,032 12,099 12,860 53,563 10,713
Earmarked Programmes 6,604 10,773 9,055 10,468 11,104 48,004 9,601
O/w Roads 1,521 1,740 2,395 3,372 4,369 13,397 2,679
O/w Rural Electrification Fund 150 150 160 169 230 859 172
O/w Health, Education and Skills
Development 1,919 2,770 3,114 3,794 4,095 15,694 3,139
O/w Foreign Financed Capital
Projects 2,260 5,363 2,403 2,068 1,265 13,358 2,672
O/w Water and Sanitation 119 150 350 400 450 1,469 294
O/w Farmer Input Support
Programme 485 500 533 564 594 2,677 535
O/w Strategic Food Reserve 150 100 100 100 100 550 110
Other 390 804 977 1,631 1,756 5,559 1,112

Sixth National Development Plan 2011 – 2015
Allocation of Resources by Sector
The resources over the SNDP period have been aligned with the strategic focus. The following is a detailed breakdown of SNDP
resources broken down by sector. Table 31: Allocation of Resources by Sectors (K’ Billion)
2011 2012 2013 2014 2015 TOTAL
GRZ Foreign Financing Total GRZ
Foreign Financing Total GRZ
Foreign Financing Total GRZ
Foreign Financing Total GRZ
Foreign Financing Total GRZ
Foreign Financing Total
SNDP RESOURCES 4,734.49
2,260.12
6,994.61
6,214.89
5,362.55
11,577.45
7,628.92
2,402.70
10,031.62
10,031.62
2,067.53
12,099.15
11,595.07
1,264.66
12,859.73
40,204.99
13,357.56 53,562.56
TOTAL 4,734.49
2,260.12
6,994.61
6,214.89
5,362.55
11,577.45
7,628.92
2,402.70
10,031.62
10,031.62
2,067.53
12,099.15
11,595.07
1,264.66
12,859.73
40,204.99
13,357.56
53,562.56
CROSS CUTTING SECTORS
122.90
92.02
214.92
105.66
28.65
134.31
104.29
26.45
130.74
98.89
27.20
126.09
93.52
27.35
120.87
525.26
201.67
726.93
Governance 50.60
27.35
77.95
48.90
28.65
77.55
47.20
26.45
73.65
44.70
27.20
71.90
42.70
27.35
70.05
234.10
137.00
371.10
Gender 11.52
-
11.52
8.36
-
8.36
8.21
-
8.21
8.69
-
8.69
9.16
-
9.16
45.94
-
45.94
Disability and Development
9.60
-
9.60
12.10
-
12.10
12.40
-
12.40
13.50
-
13.50
14.30
-
14.30
61.90
-
61.90
Environment 2.14
64.67
66.81
2.29
-
2.29
2.45
-
2.45
2.62
-
2.62
2.81
-
2.81
12.30
64.67
76.97
Disaster Risk Management 49.04
-
49.04 34.01
-
34.01 34.03
-
34.03 29.38
-
29.38 24.56
-
24.56
171.02
-
171.02
INFRASTRUCTURE 1,713.92
1,687.53
3,401.45
2,060.56
4,906.34
6,966.91
2,852.28
1,879.29
4,731.57
4,239.66
1,463.17
5,702.83
5,451.23
512.75
5,963.98
16,317.65
10,449.09
26,766.73
Transport Infrastructure
1,555.07
1,523.28
3,078.35
1,846.57
3,066.34
4,912.91
2,635.22
1,879.29
4,514.51
3,933.86
1,463.17
5,397.03
5,085.21
512.75
5,597.96
15,055.93
8,444.84
23,500.77
o/w Roads 1,520.70
1,523.28
3,043.98
1,740.34
3,066.34
4,806.68
2,394.73
1,879.29
4,274.02
3,372.16
1,463.17
4,835.33
4,369.41
512.75
4,882.16
13,397.34
8,444.84
21,842.18
Rail 2.96
-
2.96
54.97
-
54.97
180.70
-
180.70
453.30
-
453.30
578.00
-
578.00
1,269.93
-
1,269.93
Air 29.83
-
29.83
39.06
-
39.06
45.59
-
45.59
82.60
-
82.60
104.90
-
104.90
301.98
-
301.98
Water 1.59
-
1.59
12.20
-
12.20
14.20
-
14.20
25.80
-
25.80
32.90
-
32.90
86.69
-
86.69
Energy 154.82
164.25
319.07
191.13
1,840.00
2,031.13
193.20
-
193.20
280.93
-
280.93
339.74
-
339.74
1,159.82
2,004.25
3,164.07
o/w Rural Electrification
150.00
164.25
314.25
150.00
-
150.00
159.90
-
159.90
169.33
-
169.33
230.00
-
230.00
859.23
164.25
1,023.48
Others 4.82
-
4.82
41.13
1,840.00
1,881.13
33.30
-
33.30
111.60
-
111.60
109.74
-
109.74
300.59
1,840.00
2,140.59
Housing 4.03
-
4.03
22.86
-
22.86
23.86
-
23.86
24.86
-
24.86
26.28
-
26.28
101.89
-
101.89
HUMAN DEVELOPMENT
2,016.87
220.50
2,237.37
2,918.16
161.96
3,080.12
3,472.55
161.96
3,634.51
4,241.41
161.96
4,403.37
4,615.46
161.96
4,777.42
17,264.46
868.34
18,132.79
Health 802.44
-
802.44
1,287.53
-
1,287.53
1,471.70
-
1,471.70
1,754.97
-
1,754.97
1,847.82
-
1,847.82
7,164.47
-
7,164.47

Sixth National Development Plan 2011 – 2015
2011 2012 2013 2014 2015 TOTAL
GRZ Foreign Financing Total GRZ
Foreign Financing Total GRZ
Foreign Financing Total GRZ
Foreign Financing Total GRZ
Foreign Financing Total GRZ
Foreign Financing Total
Education and Skills Development
1,059.14
220.50
1,279.64
1,407.80
161.96
1,569.76
1,568.64
161.96
1,730.60
1,962.14
161.96
2,124.10
2,166.79
161.96
2,328.75
8,164.50
868.34
9,032.84
Water and Sanitation 140.46
-
140.46
192.63
-
192.63
399.73
-
399.73
489.90
-
489.90
564.63
-
564.63
1,787.35
-
1,787.35
o/w Water Development
20.46
-
20.46
42.63
-
42.63
49.73
-
49.73
89.90
-
89.90
114.63
-
114.63
317.35
-
317.35
Water Supply and Sanitation
120.00
-
120.00
150.00
-
150.00
350.00
-
350.00
400.00
-
400.00
450.00
-
450.00
1,470.00
-
1,470.00
Youth and Sports Development
14.83
-
14.83
30.20
-
30.20
32.49
-
32.49
34.40
-
34.40
36.23
-
36.23
148.14
-
148.14
GROWTH SECTORS 725.04
208.98
934.02
853.66
221.10
1,074.76
922.71
288.00
1,210.71
1,142.45
373.00
1,515.45
1,122.87
526.40
1,649.27
4,766.73
1,617.48
6,384.20
Agriculture, Livestock and Fisheries
683.00
183.00
866.00
766.38
220.00
986.38
822.79
288.00
1,110.79
1,037.58
373.00
1,410.58
1,009.77
521.00
1,530.77
4,319.51
1,585.00
5,904.51
Mining 7.20
4.30
11.50
14.30
1.10
15.40
14.60
-
14.60
15.10
-
15.10
15.10
5.40
20.50
66.30
10.80
77.10
Tourism 27.73
14.17
41.90
43.25
-
43.25
49.91
-
49.91
51.11
-
51.11
53.91
-
53.91
225.91
14.17
240.08
o/w Arts and Culture 6.90
-
6.90
9.60
-
9.60
10.30
-
10.30
11.30
-
11.30
14.00
-
14.00
52.10
-
52.10
Manufacturing 4.42
1.10
5.52
19.88
-
19.88
27.43
-
27.43
29.10
-
29.10
33.14
-
33.14
113.96
1.10
115.06
Commerce and Trade
2.69
6.41
9.09
9.85
-
9.85
7.99
-
7.99
9.57
-
9.57
10.95
-
10.95
41.04
6.41
47.45
SUPPORT SECTORS 94.91
51.09
146.00
157.77
44.50
202.27
168.78
47.00
215.78
181.59
42.20
223.79
164.85
36.20
201.05
767.88
220.99
988.87
Science, Technology and Innovation
12.12
-
12.12
20.67
-
20.67
21.50
-
21.50
23.00
-
23.00
24.00
-
24.00
101.29
-
101.29
Information and Communications Technology
2.17
-
2.17
42.60
-
42.60
47.00
-
47.00
57.00
-
57.00
40.00
-
40.00
188.77
-
188.77
Natural Resources 4.73
5.99
10.72
10.46
-
10.46
11.44
-
11.44
12.75
-
12.75
12.71
-
12.71
52.09
5.99
58.08
Local Government and Decentralisation
14.49
1.10
15.59
14.44
-
14.44
13.44
-
13.44
9.44
-
9.44
6.44
-
6.44
58.23
1.10
59.33
Social Protection 61.40
44.00
105.40
69.60
44.50
114.10
75.40
47.00
122.40
79.40
42.20
121.60
81.70
36.20
117.90
367.50
213.90
581.40
REGIONAL DEVELOPMENT
60.84
-
60.84
119.09
-
119.09
108.32
-
108.32
127.63
-
127.63
147.14
-
147.14
563.02
-
563.02
Regional Development 60.84
-
60.84
119.09
-
119.09
108.32
-
108.32
127.63
-
127.63
147.14
-
147.14
563.02
-
563.02
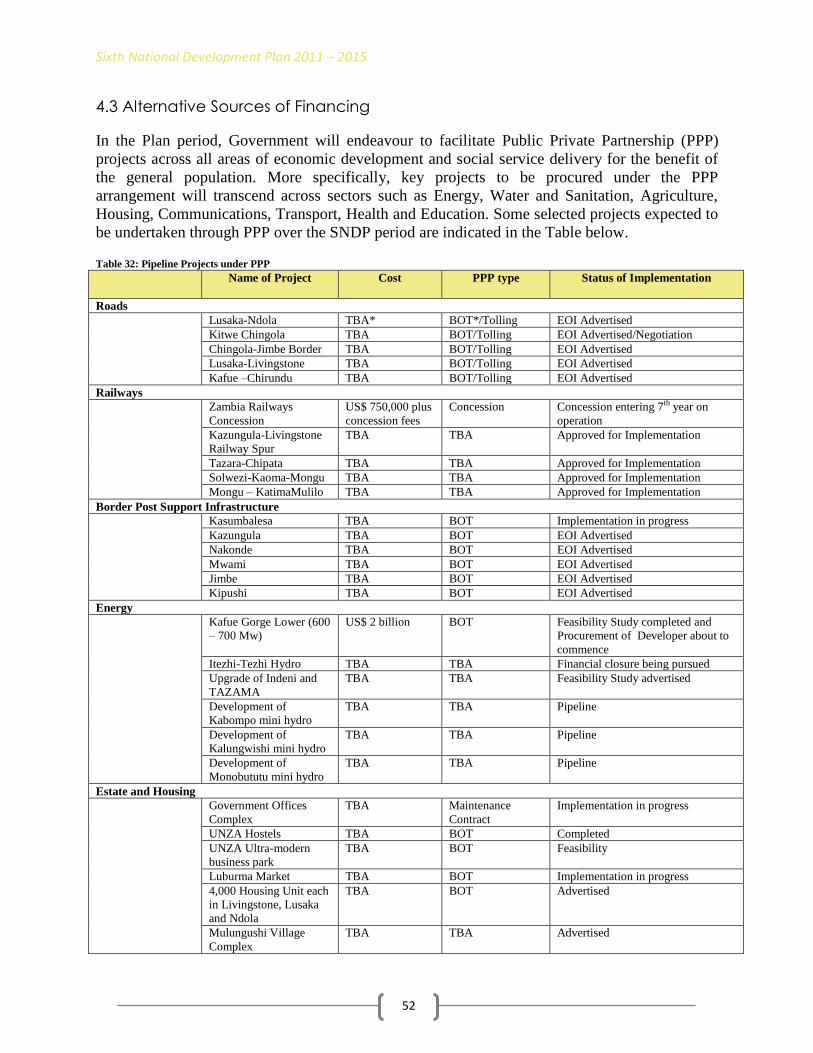
Sixth National Development Plan 2011 – 2015
52
4.3 Alternative Sources of Financing
In the Plan period, Government will endeavour to facilitate Public Private Partnership (PPP)
projects across all areas of economic development and social service delivery for the benefit of
the general population. More specifically, key projects to be procured under the PPP
arrangement will transcend across sectors such as Energy, Water and Sanitation, Agriculture,
Housing, Communications, Transport, Health and Education. Some selected projects expected to
be undertaken through PPP over the SNDP period are indicated in the Table below. Table 32: Pipeline Projects under PPP
Name of Project Cost PPP type Status of Implementation
Roads
Lusaka-Ndola TBA* BOT*/Tolling EOI Advertised
Kitwe Chingola TBA BOT/Tolling EOI Advertised/Negotiation
Chingola-Jimbe Border TBA BOT/Tolling EOI Advertised
Lusaka-Livingstone TBA BOT/Tolling EOI Advertised
Kafue –Chirundu TBA BOT/Tolling EOI Advertised
Railways
Zambia Railways
Concession
US$ 750,000 plus
concession fees
Concession Concession entering 7th year on
operation
Kazungula-Livingstone
Railway Spur
TBA TBA Approved for Implementation
Tazara-Chipata TBA TBA Approved for Implementation
Solwezi-Kaoma-Mongu TBA TBA Approved for Implementation
Mongu – KatimaMulilo TBA TBA Approved for Implementation
Border Post Support Infrastructure
Kasumbalesa TBA BOT Implementation in progress
Kazungula TBA BOT EOI Advertised
Nakonde TBA BOT EOI Advertised
Mwami TBA BOT EOI Advertised
Jimbe TBA BOT EOI Advertised
Kipushi TBA BOT EOI Advertised
Energy
Kafue Gorge Lower (600
– 700 Mw)
US$ 2 billion BOT Feasibility Study completed and
Procurement of Developer about to
commence
Itezhi-Tezhi Hydro TBA TBA Financial closure being pursued
Upgrade of Indeni and
TAZAMA
TBA TBA Feasibility Study advertised
Development of
Kabompo mini hydro
TBA TBA Pipeline
Development of
Kalungwishi mini hydro
TBA TBA Pipeline
Development of
Monobututu mini hydro
TBA TBA Pipeline
Estate and Housing
Government Offices
Complex
TBA Maintenance
Contract
Implementation in progress
UNZA Hostels TBA BOT Completed
UNZA Ultra-modern
business park
TBA BOT Feasibility
Luburma Market TBA BOT Implementation in progress
4,000 Housing Unit each
in Livingstone, Lusaka
and Ndola
TBA BOT Advertised
Mulungushi Village
Complex
TBA TBA Advertised

Sixth National Development Plan 2011 – 2015
53
Name of Project Cost PPP type Status of Implementation
Agriculture
NansangaFarm Block TBA BOT Advertised
Irrigation Development
Project
TBA TBA Feasibility Study in progress
Grain Marketing TBA TBA Consultation and Feasibility in
progress
Health
Lusaka Ultra- Modern
Centre of Excellency
Hospital
TBA TBA Pipeline
Development of 3
diagnostic Health
facilities in Lusaka,
Livingstone and the
Copperbelt
TBA
TBA Pipeline
Airports
Lusaka TBA BOT Pipeline
Livingstone TBA BOT Pipeline
Ndola TBA BOT Pipeline
Solwezi TBA BOT Pipeline
Mfuwe TBA BOT Pipeline * ToBe Advised
*Built Operate Transfer

Sixth National Development Plan 2011 – 2015
54
Part II
Infrastructure

Sixth National Development Plan 2011 – 2015
55
5. TRANSPORT
5.1 Introduction
Transport infrastructure serves as a central delivery mechanism in the generation of quality
socio-economic development. In the Sixth National Development Plan (SNDP), Transport
infrastructure covers: roads and bridges, railways, airports and aerodromes and maritime and
inland waterways.
The contribution of the sector to the GDP measured by construction industry‟s share averaged
14.7 percent over the period 2006 to 2009. The positive contributions were attributed to
increased investment in the education, health and transport (road) sectors.The state of transport
infrastructure, however, remained inadequate to sustain and match the desired levels of growth
due to weak structural and management capacity resulting in over commitments, high cost of
construction and low investment.
In the SNDP period, the Government will seek to strongly address the challenges in transport
infrastructure as these remain the major constraint to growth, economic diversification and
human development. The key focus will be on construction, rehabilitation and maintenance of
physical infrastructure.
5.2 Review of Past Performance
Over the Fifth National Development Plan (FNDP) period, the focus of the sector included road,
airport, rail, water transport and public infrastructure development and rehabilitation. General
performance of the infrastructure sector is as highlighted below.
Transport Infrastructure Sub-sector
(i) Roads and Bridges
Zambia has a total road network of 67,671 km of which 40,265 km forms the core road network9.
About 9,403 km of the core road network is paved and the rest is unpaved. During the FNDP
period rehabilitation works on paved roads was targeted at 1,007 km out of which 940 km was
completed by 2009 representing 94 percent. With regard to unpaved roads, 8,355 km was
rehabilitated against a target of 5,971 km.
A total of 3,012 km of paved roads underwent periodic and routine maintenance from total paved
network of 9,403 km. With regard to unpaved roads, only 17,571 km underwent periodic and
routine maintenance from a total of 30,862 km representing 57 percent. Out of the completed
works of unpaved roads 8,761 km represent roads that were under periodic maintenance while
the rest was under routine maintenance. A total of 459 km of gravel roads was targeted for
upgrading to paved out of which a total of 242 km was completed, while works on the remaining
217 km were on-going. A total of 710 km of urban roads was targeted for rehabilitation out of
9 Core road network is the bare minimum road network that Zambia requires to be maintained continuously and on sustainable basis so as to unleash the potential in the country and its people to promote self-development as the approach to poverty alleviation and economic growth.
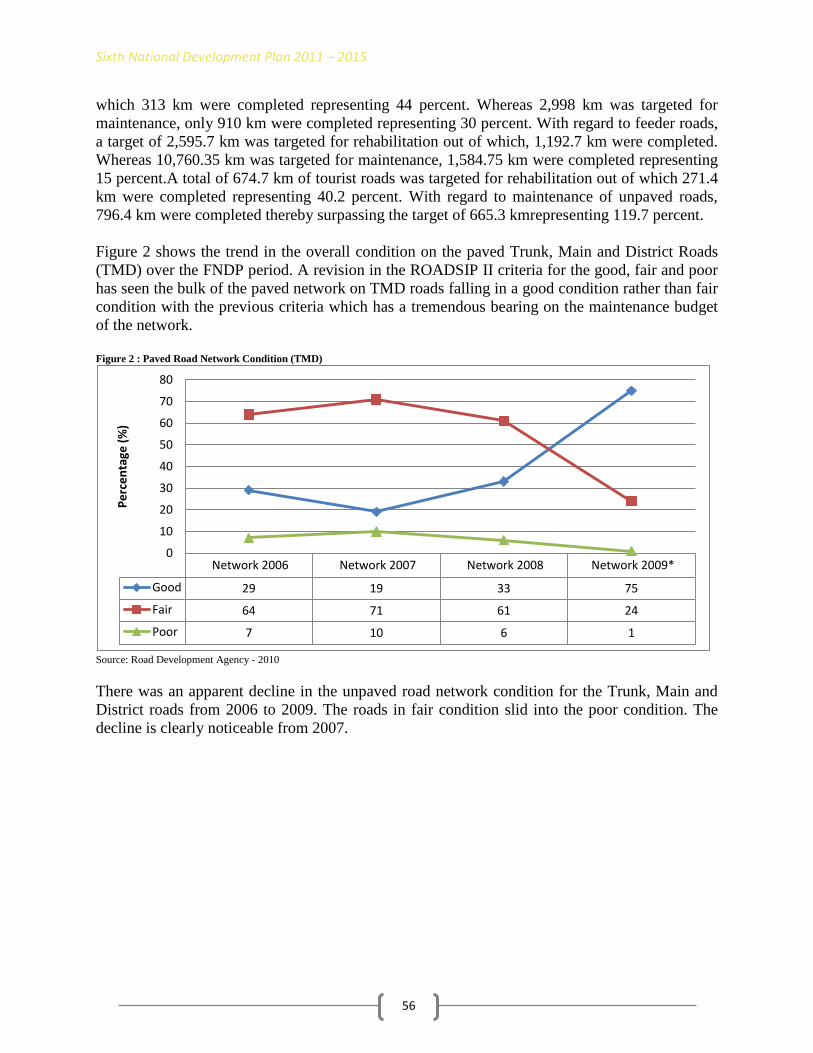
Sixth National Development Plan 2011 – 2015
56
which 313 km were completed representing 44 percent. Whereas 2,998 km was targeted for
maintenance, only 910 km were completed representing 30 percent. With regard to feeder roads,
a target of 2,595.7 km was targeted for rehabilitation out of which, 1,192.7 km were completed.
Whereas 10,760.35 km was targeted for maintenance, 1,584.75 km were completed representing
15 percent.A total of 674.7 km of tourist roads was targeted for rehabilitation out of which 271.4
km were completed representing 40.2 percent. With regard to maintenance of unpaved roads,
796.4 km were completed thereby surpassing the target of 665.3 kmrepresenting 119.7 percent.
Figure 2 shows the trend in the overall condition on the paved Trunk, Main and District Roads
(TMD) over the FNDP period. A revision in the ROADSIP II criteria for the good, fair and poor
has seen the bulk of the paved network on TMD roads falling in a good condition rather than fair
condition with the previous criteria which has a tremendous bearing on the maintenance budget
of the network.
Figure 2 : Paved Road Network Condition (TMD)
Source: Road Development Agency - 2010
There was an apparent decline in the unpaved road network condition for the Trunk, Main and
District roads from 2006 to 2009. The roads in fair condition slid into the poor condition. The
decline is clearly noticeable from 2007.
Network 2006 Network 2007 Network 2008 Network 2009*
Good 29 19 33 75
Fair 64 71 61 24
Poor 7 10 6 1
0
10
20
30
40
50
60
70
80
Pe
rce
nta
ge (
%)

Sixth National Development Plan 2011 – 2015
57
Figure 3: Unpaved TMD Road Network Condition
Source: Road Development Agency - 2010
A total of 117 bridges were successfully completed during the review period.
Three weighbridges were rehabilitated at Mpika, Livingstone and Solwezi while two were
constructed at Kazungula and Kapiri-Mposhi. This resulted in a reduction in the rate of
overloading to 3.1 percent from 30 percent for axle load and 8 percent from 55 percent for gross
vehicle mass.
(ii) Airports and Aerodromes
During the period under review, Lusaka, Livingstone, Ndola, Mfuwe and Kasaba Bay airports
were rehabilitated. While works were undertaken on the following airports and aerodromes:
a) Mansa Control Tower and terminal building;
b) Kasama terminal building;
c) Chipata terminal building;
d) Kasaba Bay runway;
e) Siavonga runway;
f) Southdown runway; and
g) Aerodromes were maintained in Nyangwe in Mbala, Zambezi, Senanga and Serenje
areas.
(iii) Railways
During the FNDP period, the state of railway infrastructure continued to be poor with the only
major progress being the completion of the Chipata-Mchinji Railway line. As a result of low
investment, the railway line network continued to deteriorate to the extent that the average
locomotive speed reduced from 60km/h to 15km/h. Consequently, the targeted volume of cargo
2004 2006 2007 2008 2009
Good 1 22 36 8 10
Fair 44 30 24 9 11
Poor 54 48 40 83 79
0
10
20
30
40
50
60
Percentage 70
80
90

Sixth National Development Plan 2011 – 2015
58
and passengers transported could not be met and this put more pressure on the road network. The
linking of Chipata/Mchinji Rail line to TAZARA will therefore, improve connectivity to the
railway network to the Port of Nacala in Mozambique.
The feasibility studies for Nseluka-Mpulungu and Chingola-Solwezi-Lumwana-Benguela
railway lines were undertaken to ascertain the plausibility of opening up convenient trade routes
with the Great Lakes region via Lake Tanganyika, and Lobito Bay in Angola.
(iv) Maritime and Inland Waterways
During the FNDP period, out of an approximated 1,700 km of canals and inland waterways,
approximately 700 km underwent routine maintenance and rehabilitation, while one dredging
equipment was rehabilitated and two were procured.
5.3 Vision, Goal and Strategic Focus
Vision
“A well developed and maintained socio-economic infrastructure by 2030”.
Goal
To enhance economic development of the prioritised economic sectors through provision of
improved quality of transport infrastructure.
Strategic Focus
In the SNDP, emphasis will be on road and railway transport maintenance and rehabilitation.
With regard to roads, focus will be on maintenance of feeder roads, tourist access and urban
roads within the core road network. As regards to railway, the focus will be to maintain and
upgrade the existing network to facilitate for efficient national and international commerce and
trade. However, efforts will be made to invest in other transport infrastructure components
namely air and water transport.
5.4 Policies and Key Reforms
During the SNDP period, the sector will develop the National Transport Infrastructure Master
Plan (NTIMP). The NTIMP will be developed with a cogent consideration of existing
infrastructure sector developmental plans and programmes such as Road Sector Investment
Plans, Lusaka Development Master Plan, Tourism Master Plan, Rural Electrification
Programmes, National Farming Blocks development, the MFEZ, amongst others. The sector will
further harmonise a number of policies to support its infrastructure development programmes,
such as the National Construction Industry, Transport, Decentralisation, Public Private
Partnership and Land Policies.
5.5 Objectives, Strategies and Programmes
The table below shows the objectives, strategies and programmes for the Transport Infrastructure
Sector during the SNDP period.

Sixth National Development Plan 2011 – 2015
59
Table 33: Objectives, Strategies and Programmes-Roads, Bridges and Railways
No. Objectives Strategies Programmes
1 To coordinate and
strengthen transport
infrastructure development
a) Develop and implement a National Transport and
Communications Master Plan;
b) Human and Institutional capacity development; and
c) Enhance the capacity of DRM in the sector.
Public Road Transport
Infrastructure Development
and Management
2 To maintain and rehabilitate
road transport infrastructure
a) Strengthen human capacity development for local
contractors;
b) Promote Public Private Partnerships;
c) Enforce standards; and
d) Replace pontoons with bridges.
Development of design
standards and codes of
practice for infrastructure
adapted to climate change
resilience
3 To maintain rehabilitate and
upgrade rail transport
infrastructure
a) Enhance investment in rail infrastructure;
b) Re-capitalize TAZARA ;
c) Develop a strategy on Railway Systems of Zambia
(RSZ) Expand railway network; and
d) Promote Public Private Partnerships.
Railway Transport
Infrastructure Development
and Rehabilitation
Table 34: Objectives, Strategies and Programmes - Maritime and Inland Waterways
No. Objectives Strategies Programmes
1 To bring the core canal
network to navigable
condition in order to
Improved water transport
facilities
a) Develop a rehabilitation and maintenance plan for
Canals;
b) Secure financial resources for labour based methods;
and
c) Procure dredging Equipment.
Canals and Waterways
Rehabilitation and
Maintenance in all provinces
2 To build capacity in the
sector and produce
qualified and skilled
personnel.
a) Develop a Training school master plan;
b) Secure financial resources;
c) Encourage PPP in Maritime Training;
d) Collaborate with other countries offering Maritime
training courses e.g. (Malawi, Tanzania); and
e) Secure Technical Assistance from the World
Maritime Organization (WMO).
Establish Marine Training
Schools
3 To enhance safety of
navigation in order to save
lives and property on
waterways
a) Secure financial resources and procure equipment;
b) Undertake capacity building for end-users of
equipment; and
c) Construct Light Houses and Navigation aids.
Navigation aids/radio
communications
4 To facilitate efficient and
effective clearing of goods
at major ports in order to
decongest the border posts
a) Secure land; and
b) Encourage PPP in the development and management
of the facility.
Establish Inland Dry ports,
Sea Port, Dry Port and
terminal Port Facilities
5 To facilitate the efficient
and effective means of
construction of Canals and
Waterways
a) Secure financial resources; and
b) Build Capacity of end users Dredging Equipment.
Procurement of Dredging
Equipment
Suction dredgers
Bucket Dredgers
Multi-purpose Dredgers
Earth Moving Equipment
Service Boats
6 To provide transport to
communities for social
economic sustenance
a) Secure financial resources; and
b) Encourage Private participation in water transport
service provision.
Procurement of Vessels
a) Lake Tanganyika
b) Lake Kariba
c) Lake Mweru
d) Lake Bangweulu

Sixth National Development Plan 2011 – 2015
60
Table 35: Objectives, Strategies and Programmes -Air Transport
5.6 Implementation, Monitoring and Evaluation
To effectively monitor and evaluate the implementation of sector programmes, the following
output matrix and key performance indicator tables will be used: Table 36: Sector Output Matrix
Programmes Projects to be
Implemented
Annual Targets Total
Output
Expecte
d end of
SNDP
[km]
Responsible
Institution(s)
Key
Institutions
2011 2012 2013 2014 2015
[km] [km] [km] [km] [km]
Public Road
infrastructure
Development
and
Management
Trunk Main and District Roads - Up-grading to Paved Standard
Trunk Main and
District Roads - Up-
grading to Paved
Standard
656.00 577.00 501.00 525.00 501.00 2,760.00
Trunk Main and
District Roads -
Rehabilitation Paved
164.00 391.33 391.33 268.33 0.00 1,215.00
Trunk Main and
District Roads -
Public Private
Partnerships
- 160.0 257.4 308.9 - 726.32
Trunk Main and
District Roads -
Rehabilitation
Unpaved
282.97 409.33 2,271.21 1,975.65 231.70 5,170.86
Trunk Main and
District Roads -
Maintenance Paved
628.11 844.38 375.84 541.07 447.96 2,837.36
Trunk Main and
District Roads -
Routine Maintenance
17,824.00 17,262.7
5
15,154.5
5
16,258.3
7
17,699.1
7
84,198.8
4
Primary Feeder Roads
- Rehabilitation
Unpaved
1,439.61 1,439.61 1,439.61 1,439.61 1,439.61 7,198.04
Feeder Roads -
Maintenance
Unpaved
2,303.37 3,742.98 5,182.59 6,622.20 8,061.81 25,912.9
5
Urban Roads -
Rehabilitation and
493.00 850.00 429.00 261.00 538.00 2,571.00
No. Objectives Strategies Programme
1 To improve air transport
infrastructure
a) Improve the landing and take-off of Aircraft and
shelter to passengers;
b) Increase the capacity airport to handle additional
traffic;
c) Construct Fire Station at Airports and aerodromes in
order to increase safety;
d) Improve the safety of navigation and fire prevention
and management;
e) Install Radar Equipment at International Airports in
order to increase navigation;
f) Install Doppler VORs at Kasama, Solwezi and
Livingstone; and
g) Install linked computer systems at all Provincial
Airports in order to improve communication.
Airport and aerodrome
infrastructure improvement

Sixth National Development Plan 2011 – 2015
61
Programmes Projects to be
Implemented
Annual Targets Total
Output
Expecte
d end of
SNDP
[km]
Responsible
Institution(s)
Key
Institutions
2011 2012 2013 2014 2015
[km] [km] [km] [km] [km]
Construction (Paved)
Various Roads -
Maintenance (Paved
and Unpaved)
500.00 508.00 516.00 516.00 516.00 516.00
Tourist Roads -
Rehabilitation/Mainte
nance
1,560.00 1,754.00 1,372.00 1,617.00 1,497.00 7,800.00
RAMP -
Rehabilitation/Mainte
nance
4,828.00 4,828.00 4,828.00 4,828.00 4,828.00 24,140.0
0
Bridges and
Pontoon
Infrastructure
Upgrading to
Bridges
Bridge Infrastructure [No.]/% [No.]/% [No.]/% [No.]/% [No.]/%
Bridge Infrastructure
Construction
Bridge Across
Zambezi River at
Sioma
50 % 100 % - - - Bridge MWS
RDA
MoFNP
MLGH Mufuchani Bridge - 50 % 100 % - - Bridge
Matumbo Bridge in
Chama
- 10 % 60 % 100 % - Bridge
Lufubu Bridge 20 % 40 % 100 % - - Bridge
Other Bridges and
Culverts
25 25 25 25 25 125
Bridges
Kazungula - 10 % 50 % 100 % - Bridge
Chiawa 10 % 70 % 100 % 100 % - Bridge
Zambezi - 10 % 60 % 100 % 100 % Bridge
Mbesuma - 50 % 100 % - - Bridge
Safwa - 10 % 60 % 100 % - Bridge
Railway
Infrastructure
Rehabilitation
Mulobezi Railway
line
30 km 30 km 30 km 30 km 30 km 150 km MCT, ZRL,
RSZ
TAZARA Track
rehabilitation
200 km 200 km 200 km 175 km 175 km 950 km MCT,
TAZARA
RSZ- Main and Inter-
mine
240 km 240 km 240 km 240 km 124 km 1,084
km
RSZ, ZRL,
MCT
Development
of Railway
Infrastructure
Chingola-Solwezi 40 km 40 km 40 km 30 km 20 km 170 km MCT,
ZRL,RSZ,
MoFNP
Njanji Commuter,
Lusaka
4 km 4 km 4 km 4 km 4 km 20 km MCT, ZRL
Construction of
Nseluka - Mpulungu
Railway Line: PPP
- - - - - 200 km MCT, ZRL
Proposed
Railway Line
Feasibility
Studies
Chipata-Petauke to
TAZARA
- - - - - - MCT,ZRL
Kafue to Lion‟s Den 150 km - - - - 330 km MCT, ZRL
Solwezi-Benguela - 431.2
km
- - - 431.2
km
MCT, ZRL
Mulobezi –Caprivi 150 km - - - - 150 km MCT, ZRL
Airport
infrastructure
Airports Upgrading 1
Livingsto
ne
1
Lusaka
1
Mfuwe
1
Ndola
- 4
Airports
Upgrade
d
MCT
MWS
MoFNP
NACL
Airports
Rehabilitation
7 - - - - 7
Airports
rehabilit
ated
MCT, NWS,
MoFNP and
NACL

Sixth National Development Plan 2011 – 2015
62
Source: Ministry of Communications and Transport, 2010
Table 37: Key Performance Indicators - Air Transport
Key Performance Indictors Annual Targets
Baseline
(2009) 2011 2012 2013 2014 2015
Name Definition
Number of
Passengers moved
on Air flights
Total number of
passengers moved on
both local and
international flights in
912,830 920,000 970,000 1,100,000 1,300,000 1,710,000
Volume of cargo
transported on
flights
Total weight of cargo
transported on flights
in tonnes
- 5,000,000 5,500,000 6,000,000 6,500,000 7,000,000
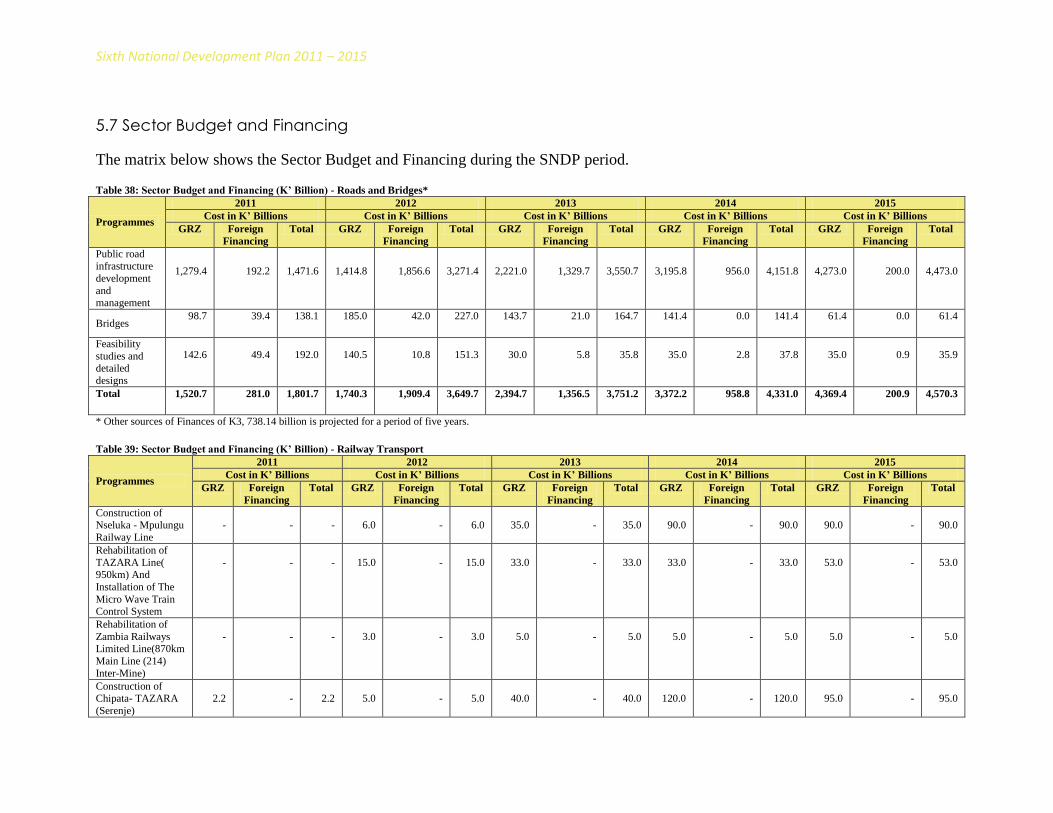
Sixth National Development Plan 2011 – 2015
5.7 Sector Budget and Financing
The matrix below shows the Sector Budget and Financing during the SNDP period. Table 38: Sector Budget and Financing (K’ Billion) - Roads and Bridges*
Programmes
2011 2012 2013 2014 2015
Cost in K’ Billions Cost in K’ Billions Cost in K’ Billions Cost in K’ Billions Cost in K’ Billions
GRZ Foreign
Financing
Total GRZ Foreign
Financing
Total GRZ Foreign
Financing
Total GRZ Foreign
Financing
Total GRZ Foreign
Financing
Total
Public road
infrastructure
development
and management
1,279.4 192.2 1,471.6 1,414.8 1,856.6 3,271.4 2,221.0 1,329.7 3,550.7 3,195.8 956.0 4,151.8 4,273.0 200.0 4,473.0
Bridges 98.7 39.4 138.1 185.0 42.0 227.0 143.7 21.0 164.7 141.4 0.0 141.4 61.4 0.0 61.4
Feasibility
studies and detailed
designs
142.6 49.4 192.0 140.5 10.8 151.3 30.0 5.8 35.8 35.0 2.8 37.8 35.0 0.9 35.9
Total 1,520.7 281.0 1,801.7 1,740.3 1,909.4 3,649.7 2,394.7 1,356.5 3,751.2 3,372.2 958.8 4,331.0 4,369.4 200.9 4,570.3
* Other sources of Finances of K3, 738.14 billion is projected for a period of five years.
Table 39: Sector Budget and Financing (K’ Billion) - Railway Transport
Programmes
2011 2012 2013 2014 2015
Cost in K’ Billions Cost in K’ Billions Cost in K’ Billions Cost in K’ Billions Cost in K’ Billions
GRZ Foreign
Financing
Total GRZ Foreign
Financing
Total GRZ Foreign
Financing
Total GRZ Foreign
Financing
Total GRZ Foreign
Financing
Total
Construction of Nseluka - Mpulungu
Railway Line
-
-
-
6.0
-
6.0
35.0
-
35.0
90.0
-
90.0
90.0
-
90.0
Rehabilitation of
TAZARA Line( 950km) And
Installation of The
Micro Wave Train Control System
-
-
-
15.0
-
15.0
33.0
-
33.0
33.0
-
33.0
53.0
-
53.0
Rehabilitation of
Zambia Railways Limited Line(870km
Main Line (214)
Inter-Mine)
-
-
-
3.0
-
3.0
5.0
-
5.0
5.0
-
5.0
5.0
-
5.0
Construction of Chipata- TAZARA
(Serenje)
2.2
-
2.2
5.0
-
5.0
40.0
-
40.0
120.0
-
120.0
95.0
-
95.0

Sixth National Development Plan 2011 – 2015
Programmes
2011 2012 2013 2014 2015
Cost in K’ Billions Cost in K’ Billions Cost in K’ Billions Cost in K’ Billions Cost in K’ Billions
GRZ Foreign
Financing
Total GRZ Foreign
Financing
Total GRZ Foreign
Financing
Total GRZ Foreign
Financing
Total GRZ Foreign
Financing
Total
Rehabilitation of
Mulobezi Commuter
(150km )
0.8
-
0.8
10.0
-
10.0
13.7
-
13.7
30.0
-
30.0
40.0
-
40.0
Construction of
Chingola-Solwezi
Line (170km)
-
-
-
5.0
-
5.0
34.0
-
34.0
58.0
-
58.0
60.0
-
60.0
Rehabilitation of Njanji Commuter
(20km)
-
-
-
3.0
-
3.0
5.0
-
5.0
30.0
-
30.0
45.0
-
45.0
Feasibility Study /Design
/Construction
Solwezi And Benguela Railway
(431.2 KM)
-
-
-
-
-
-
5.0
-
5.0
5.0
-
5.0
60.0
-
60.0
Feasibility Study
/Design Construction
Livingstone to
Kazungula(140km)
-
-
-
5.0
-
5.0
5.0
-
5.0
47.3
-
47.3
65.0
-
65.0
Feasibility Study
/Design
Construction of New
Railway line
between Kafue and
Lions Den in Zimbabwe (150km)
-
-
-
3.0
-
3.0
5.0
-
5.0
35.0
-
35.0
65.0
-
65.0
Total
3.0
-
3.0
55.0
-
55.0
180.7
-
180.7
453.3
-
453.3
578.0
-
578.0
Table 40: Sector Budget and Financing (K’ Billion) - Air Transport
Programmes
2011 2012 2013 2014 2015
Cost in K’ Billions Cost in K’ Billions Cost in K’ Billions Cost in K’ Billions Cost in K’ Billions
GRZ Foreign
Financing
Total GRZ Foreign
Financing
Total GRZ Foreign
Financing
Total GRZ Foreign
Financing
Total GRZ Foreign
Financing
Total
Aerodrome
Infrastructure
-
-
-
33.6
-
33.6
40.0
-
40.0
61.4
-
61.4
78.6
-
78.6
Aerodrome
Rehabilitation
3.9
-
3.9
4.3
-
4.3
4.4
-
4.4
20.0
-
20.0
20.2
-
20.2
Capital &
Aviation
Management
2.2
-
2.2
1.2
-
1.2
1.2
-
1.2
1.2
-
1.2
6.2
-
6.2

Sixth National Development Plan 2011 – 2015
Programmes
2011 2012 2013 2014 2015
Cost in K’ Billions Cost in K’ Billions Cost in K’ Billions Cost in K’ Billions Cost in K’ Billions
GRZ Foreign
Financing
Total GRZ Foreign
Financing
Total GRZ Foreign
Financing
Total GRZ Foreign
Financing
Total GRZ Foreign
Financing
Total
Airport
Infrastructure
Development
23.7
-
23.7
-
-
-
-
-
-
-
-
-
-
-
-
i) Kasaba Airport
18.6
-
18.6
-
-
-
-
-
-
-
-
-
-
-
-
ii) Kasama
Airport
2.8
-
2.8
-
-
-
-
-
-
-
-
-
-
-
-
iii) Mansa Airport
1.1
-
1.1
-
-
-
-
-
-
-
-
-
-
-
-
iv) Mongu Airport
1.2
-
1.2
-
-
-
-
-
-
-
-
-
-
-
-
Total
29.8
-
29.8
39.1
-
39.1
45.6
-
45.6
82.6
-
82.6
104.9
-
104.9
Table 41: Sector Budget and Financing (K’ Billion)–Maritime and Inland Water Transport
Programmes
2011 2012 2013 2014 2015
Cost in K’ Billions Cost in K’ Billions Cost in K’ Billions Cost in K’ Billions Cost in K’ Billions
GRZ Foreign
Financing
Total GRZ Foreign
Financing
Total GRZ Foreign
Financing
Total GRZ Foreign
Financing
Total GRZ Foreign
Financing
Total
Canals and
Waterways
Rehabilitation
and
Maintenance
0.8
-
0.8
4.0
-
4.0
4.0
-
4.0
5.0
-
5.0
6.5
-
6.5
Harbour and
Ports
Development
and
Rehabilitation
-
-
-
2.1
-
2.1
6.0
-
6.0
4.0
-
4.0
4.5
-
4.5
Marine Training
Schools
-
-
-
0.2
-
0.2
0.5
-
0.5
0.5
-
0.5
1.3
-
1.3
Navigation
Aids/radio
Communications
0.1
-
0.1
0.8
-
0.8
2.0
-
2.0
4.3
-
4.3
5.0
-
5.0
Inland Dry
ports
Development
-
-
-
0.4
-
0.4
0.4
-
0.4
5.0
-
5.0
5.6
-
5.6

Sixth National Development Plan 2011 – 2015
Programmes
2011 2012 2013 2014 2015
Cost in K’ Billions Cost in K’ Billions Cost in K’ Billions Cost in K’ Billions Cost in K’ Billions
GRZ Foreign
Financing
Total GRZ Foreign
Financing
Total GRZ Foreign
Financing
Total GRZ Foreign
Financing
Total GRZ Foreign
Financing
Total
Sea Port, Dry
Port and
Terminal Port
Facilities
Development
-
-
-
0.7
-
0.7
1.3
-
1.3
4.0
-
4.0
6.0
-
6.0
Procurement of
Dredging
Equipment
-
-
-
3.0
-
3.0
-
-
-
2.5
-
2.5
3.0
-
3.0
Procurement of
Vessels
0.8
-
0.8
1.0
-
1.0
-
-
-
0.5
-
0.5
1.0
-
1.0
Total
1.6
-
1.6
12.2
-
12.2
14.2
-
14.2
25.8
-
25.8
32.9
-
32.9

Sixth National Development Plan 2011 – 2015
67
6. ENERGY
6.1 Introduction
Energy is a critical input into all sectors of the economy. A viable energy sector is, therefore, key
to achieving sustainable economic development in the country. During the Fifth National
Development Plan (FNDP) period, the sector goal was to ensure availability of reliable,
affordable and environmentally sound energy for sustained social and economic development.
The main thrust of the energy sector during the Sixth National Development Plan (SNDP) period
will be to expand electricity generation and transmission capacities and enhance cost-
effectiveness in fuel supply. This entails that the sector will focus on exploiting the most cost-
effective hydro energy resources, putting in place an efficient and effective fuel supply system
while mitigating the effects of climate change. In addition, the sector will continue exploring
alternative sources of energy for sustainable development.
6.2 Review of Past Performance
One of the key developments in the sector during the FNDP period was the adoption of the
revised National Energy Policy which ensures that the sector‟s potential to drive economic
growth and reduce poverty is harnessed. Another key strategy during the FNDP period was to
undertake a comprehensive assessment of the renewable energy potential in selected parts of the
country in order to develop a resource map and bankable project proposals. Although there was
no significant progress recorded in this area, the National Energy Policy and the Energy
Regulations Act were reviewed to promote the production, use and regulation of bio-fuels.
During the period under review, the energy sector registered an average growth rate of 5
percent. The main challenge for the electricity sub-sector was disruptions in power supply due to
constrained generation capacity, which is a consequence of lack of investment in the face of
increasing demand. With regard to the petroleum sub-sector, the main challenge was fluctuating
petroleum prices due to volatility in oil prices on the international market.
The developments in the various energy sub-sectors are highlighted below.
Electricity Sub-Sector
Total generation capacity increased by 180 Mw from 1,738 Mw to 1,918 Mw as a result of the
rehabilitation and up-rating programme. The improvement contributed to the reduction of load
shedding by 630 Mw at peak times during the latter part of the FNDP period. Furthermore,
electricity imports declined from 183,218 Mwh in 2006 to 90,489 Mwh in 2009. However, due
to increased domestic demands, exports also fell from 264,710 Mwh to 74,510 Mwh during the
same period.
Other achievements included the commissioning of a 220 Kv transmission line interconnection
between Livingstone in Zambia and Katima-Mulilo in Namibia commissioned in 2008. Further a
33 Kv transmission line interconnection between Zambia (Chama) and Malawi (Mzuzu) was
commissioned. In addition, a privately owned mini-hydro power station with a capacity of 0.75
Sixth National Development Plan 2011 – 2015
68
Mw at Zengamene in Mwinilunga in North-Western Province and the installation of a 10 Mw
generator at Lunsemfwa Hydro Power Station, were completed.
During the same period feasibility studies for Kafue Gorge Lower (600 Mw) were completed,
works on Kariba North Bank extension (360 Mw) were commenced and a Special Purpose
Vehicle for Itezhi-Tezhi Power Company (ITPC) was formed to spearhead development of the
120 Mw Itezhi-Tezhi Hydro-Power Plant.
In terms of overall access to electricity, this continued to be low and only increased by 2
percentage points from 20 percent in 2005 to 22 percent in 2009. In terms of spatial distributions
between rural and urban areas, access in rural areas was only 3.5 percent compared to 48 percent
in urban areas. This was mainly on account of the slow pace in the implementation of the Rural
Electrification Programme.
The major challenge in the electricity sub-sector was the huge capital requirement for the
development of hydro-power projects such as Kafue Gorge Lower, Itezhi-tezhi and Kalungwishi
which required US $1.8 billion, US $350 million and US $741 million respectively.
Petroleum Sub-Sector
Generally, during the FNDP period, reliability in supply of petroleum products improved. This
was on account of strengthened procurement arrangements and increased storage capacity at
Bwana Mkubwa in Ndola following the completion of the 40 million litre storage tank.
Furthermore, the undertaking of rehabilitation works at the INDENI Oil Refinery also improved
efficiencies in the processing of petroleum feedstock.
Under the petroleum exploration programme, the major milestone was the issuance of
exploration licences to six successful bidders for blocks in Eastern, North-Western and Western
Provinces.
The petroleum sub-sector faced a number of challenges including inadequate resources to
purchase petroleum, strategic stocks,rehabilitationand building adequate storage, procurement
encumbrances and high international oil prices.
6.3 Vision, Goal and Strategic Focus
Vision
“Universal access to clean, reliable and affordable energy at the lowest total economic, financial,
social and environmental cost consistent with national development goals by 2030”.
Goal
To ensure that the following are attained to guarantee availability and accessibility to adequate
and reliable supply of energy at the lowest economic, social and environmental cost:
(i) An increase of at least 1,000 Mw (50 percent) to the 2010 electricity generation capacity
of 1,900 Mw;
(ii) An increase of rural access to electricity from 3.5 percent to at least 15 percent and
national access from 22 percent to 40 percent; and

Sixth National Development Plan 2011 – 2015
69
(iii)An increase of over 100 per cent in the existing petroleum bulk storage facilities in order
to achieve 30 days petroleum strategic stock.
Strategic Focus
In achieving the SNDP objective of accelerating and diversifying growth, and enhancing rural
development, it is essential that reliability of supply of energy is fully achieved. An expansion in
the mining, agriculture, tourism and manufacturing sectors combined with other socio-economic
actions will require a secure supply of electricity and a reliable and cost effective fuel delivery
system.
In this regard, the strategic focus of the energy sector in the SNDP will be to ensure that
adequate and reliable supply of energy is made available through development of appropriate
infrastructure to improve the electricity generation capacity and also assure efficiency and cost
effectiveness in the supply of fuel. This will guarantee availability of sufficient quantities of
energy to support the development processes in the growth sectors of the economy, especially
agriculture and manufacturing.
6.4 Policies and Key Reforms
The Government will continue recognizing the energy sector as a key driver of socio-economic
development during the SNDP period. In line with the main objective of accelerating and
diversifying growth and achieving rural development during the Plan period, the sector will
focus on ensuring availability of adequate and reliable supplies of energy at the lowest cost with
due regard to environmental concerns. In order to ensure energy efficiency, Government will
continue to encourage energy substitution and conservation practices at household, institutional
and industrial levels. To support the policy reforms undertaken, the sector will put in place
legislative reforms aimed at addressing the following measures:
(i) In the electricity sub-sector, the reforms will entail the need to implement an open access
regime for transmission and continue with the attainment of cost reflective tariffs as a
means of assuring the financial viability of existing companies and for attracting new
investment in the sector. These new investments will add an additional 1,000 Mw to the
current capacity at the end of the SNDP. Furthermore, the Rural Electrification Master
Plan will continue to be implemented and will utilize other technologies such as isolated
mini-grids;
(ii) In the petroleum sub-sector, the focus will be on facilitating construction and
rehabilitation of storage facilities countrywide for Strategic Petroleum Reserves. Focus
will also be on streamlining the fuel supply chain to make it more efficient and cost
effective; and
(iii)For the renewable and alternative energy sources, the Government will continue putting
in place appropriate measures to promote the role of these energy sources in the national
energy mix.
Considering that 99 percent of Zambia‟s electricity generation is based on hydro-power and
biomass energy accounts for 80 percent of the total energy use, the energy sector is vulnerable to
climate change with associated hazards and risks which have the potential to negatively affect

Sixth National Development Plan 2011 – 2015
70
current and future outputs of Zambia‟s traditional energy sources. The hazards include droughts,
excess rainfall, changes in wind regimes and cloud cover. Therefore, vulnerability assessment of
the impact of the potential hazards as well as formulation of mitigation measures will be
cardinalin ensuring the energy security of the country. During the SNDP period, climate change
adaption and mitigation will, therefore, entail up-scaling energy management, the use of
renewable energy and promotion of a wider energy mix.
6.5 Objectives, Strategies and Programmes
The table below shows the objectives, strategies and programmes for the Energy Sector during
the SNDP period.
Table 42: Objectives, Strategies and Programmes
No. Objectives Strategies Programmes
Electricity
1 To increase electricity
generation capacity by at least
1,000 Mw and build
appropriate transmission lines.
a) Expand and Improve infrastructure for
electricity generation, transmission and
distribution;
b) Establish an open and non-discriminatory
transmission access regime in the electricity
industry;
c) Implement a Cost-Reflective Electricity
Tariff Regime; and
d) Adopt the Electricity Grid Code.
Electricity Generation and
Transmission Line
Development
2 To increase electrification
levels in the Rural Areas of
Zambia to 15.0 percent
Implement the Rural Electrification Master Plan
(REMP).
Rural Electrification
Petroleum
3 To ensure security of supply of
petroleum products in the
country by increasing storage
capacity by more than 100
percent to achieve 30 days
strategic stock
a) Develop requisite legislation for development
of an institutional and operational framework
for management of strategic petroleum
reserves;
b) Develop storage infrastructure for the
reserves; and
c) Put in place an efficient mechanism for
procuring petroleum strategic stocks.
Strategic Petroleum Reserves
4 To create an enabling
environment for stable,
efficient and cost effective
supply of petroleum products
a) Promote efficiency and effectiveness in the
existing fuel delivery systems;
b) Develop mechanism for promoting the setting
up of petroleum. businesses in rural areas;
c) Introduce Uniform Petroleum Prices; and
d) Promote Public- Private Partnerships projects
in the exploration and development of Energy
Resources.
Petroleum Supply and
Management
Renewable Energy, Alternative Energy and Biomass
5 To expand the use of
renewable and alternative
energy in the country‟s energy
mix.
a) Promote the development and use of solar
technology systems;
b) Introduce an appropriate cost-effective
renewable energy feed-in tariff;
c) Promote the production of electricity from
geothermal energy;
d) Promote the use of biogas for cooking,
lighting and electricity generation; and
e) Promote the use of radioactive energy
minerals for long term energy production.
Renewable and Alternative
Energy Development

Sixth National Development Plan 2011 – 2015
71
No. Objectives Strategies Programmes
6 To increase the use of bio fuels
as a substitute to mineral fuel
by 10% and 5%, for Bio-
ethanol and Biodiesel
respectively.
a) Promote the use of bio fuel switches for all
stationary engines;
b) Establish bio-fuels blending ratios;
c) Develop innovative financing mechanisms;
and
d) Promote the manufacturing of oil extraction
technology.
Bio fuels Development
7 To develop a rational and
implementable approach to
improve sustainability of bio
mass energy supply and raise
end-user efficiencies
a) Develop a Bio mass Energy Strategy; and
b) Promote biomass gasification electricity
generation and co-generation.
Bio mass Management
Energy Efficiency and Management
8 To ensure that major industrial
sectors, public institutions and
households bring their energy
intensities in line with
internationally acceptable
standards and best practices
Develop and Implement an Energy
Efficiency Strategy.
Energy Efficiency and
Conservation
9 To improve standards in all
fields of engineering
Develop engineering capacity relevant for all
fields of engineering.
Human Resource
Development
Cross-Cutting Issues
10 To reduce greenhouse gas
emissions from the energy
sector and strengthen
adaptation and resilience to
climate change related stresses
a) Develop Incentive Framework for investing
in environmentally friendly technologies for
electricity, lighting, heating and agriculture;
and
b) Develop Energy Sector Vulnerability
Assessments and Risk Management Plan and
Mitigation Action Plan.
Climate Change Adaptation
and Mitigation
6.6 Implementation, Monitoring and Evaluation
To effectively monitor and evaluate the implementation of sector programmes, the following
output matrix and key performance indicators Table will be used:
Table 43: Sector Output Matrix
Programmes Projects to be
Implemented
Annual Targets Total Output
Expected end of
SNDP
Responsible
Institution(s) Key
Institutions 2011 2012 2013 2014 2015
Electricity
Generation and
Transmission
Line
Development
Construct heavy
fuel Oil Power
Plant
1 - - - - 1X 50 Mw heavy fuel
Oil Power Plant
constructed
MEWD, MoFNP,
MCTI, ZESCO
Limited,
Lunsemfwa Hydro-
power Company
and CEC
Up-rate
Electricity
Generator
1 - - - - 1 Generator up-rated
by 30 Mw at Kariba
North Bank
Construct
Extension Hydro-
Power Project
- 1 - - - Extension Hydro-
Power Project
completed and
generating 360 Mw
Construct Hydro-
Power Project
- - 1 - - Hydro- Power Project
completed and
generating 120 Mw
Construct Hydro-
power Project
- - - 1 - 1X34 Mw Kabompo
Hydro-power Project
completed
Up-rate the - - - - 1 Lunzua Hydro-power

Sixth National Development Plan 2011 – 2015
72
Programmes Projects to be
Implemented
Annual Targets Total Output
Expected end of
SNDP
Responsible
Institution(s) Key
Institutions 2011 2012 2013 2014 2015
Lunzua Hydro-
power Project in
Mbala to 15 Mw
Project up-rating to 15
Mw completed
Lusiwasi Hydro-
power Project
Extended to 62
Mw
- - - - 1 Lusiwasi Hydro-
power Project
Extension to 62 Mw
completed
Construction of a
400 Mw Coal
Fired Power
Plant
- - - - 1 1X400 Mw Coal Fire
Power Plant
completed at Maamba
Rural
Electrification
Project
Implementation
Packages
Electrification
Project Packages
21
11
12
10
8 62 Electrification
Project Packages
completed
MEWD, MoFNP,
REA, ZESCO
Limited and Private
Sector.
Strategic
Petroleum
Reserves
Construction of
78.6 million litres
capacity Storage
Infrastructure for
Strategic
Petroleum
Reserves
13.1 13.1 13.1 13.1 26.2 78.6 million Litre
Storage Capacity for
Strategic Reserves
constructed
MEWD, MoFNP,
INDENI Petroleum
Refinery and
TAZAMA Pipeline
Limited
Renewable and
Alternative
Energy
Development
Construction of a
1 Mw
Shiwang‟andu
Mini-hydro-
power Project
1 - - - - 1X1 Mw mini-hydro-
power Project
constructed
MEWD, MoFNP,
REA, ZESCO
Limited and Private
Sector.
Construction of a
1 Mw Bio mass
Gasification
Electricity
Generation
Project in
Kaputa.
- 1 - - - 1X 1 Mw Bio mass
Gasification
Electricity Generation
Project constructed in
Kaputa
MEWD, MoFNP,
REA, ZESCO
Limited and Private
Sector.
Construction of
Chavuma (4Mw)
and Chanda
(1Mw) Mini-
hydro-power
Projects
- - 2 - - 2 Mini-hydro-power
projects with total
capacity of 5 Mw
constructed
MEWD, MoFNP,
REA and Private
Sector.
Construction of a
3 Mw
Mombututa Mini-
hydro-power
Project
- - - - 1 1X3 Mw Mombututa
Mini-hydro-power
Project constructed
MEWD, MoFNP,
REA and Private
Sector.
Construction of a
2.5 Mw Chilinga
Mini-hydro-
power Project
- - - - 1 1X 2.5 Mw Chilinga
Mini-hydro-power
Project constructed
MEWD, MoFNP,
REA and Private
Sector.
Climate
Resilience and
Mitigation
a) Development
of Energy
Sector
Vulnerability
Assessments
and Risk
Management
Plan.
- 1 - - - Sector
Vulnerability
Assessments and
Risk Management
Plan
MEWD, MoFNP,
REA and Private
Sector.

Sixth National Development Plan 2011 – 2015
73
Programmes Projects to be
Implemented
Annual Targets Total Output
Expected end of
SNDP
Responsible
Institution(s) Key
Institutions 2011 2012 2013 2014 2015
b) Development
of Mitigation
Action Plan
- 1 - - - a) Mitigation Action
Plan developed
b) Number of Sub-
sectors climate
proofed and
mitigation projects
developed
MEWD, MoFNP,
REA and Private
Sector.
Table 44: Key Performance Indicators
Key Performance Indictors Annual Targets
Baseline
(2009)
2011 2012 2013 2014 2015
Name Definition
Additional
Electricity
Generation
Capacity
1,000 Mw of
additional electricity
generation capacity
added to the existing
system
1,918 1,998 2,358 2,478 2,892 2,918
Additional
Petroleum Storage
Capacity
150 million litres of
Storage infrastructure
to be built.
71.4 84.5 97.6 110.7 123.8 150
Strategic
Petroleum
Reserves
Maintained
Amount of strategic
stock procured in
number of stock days
0 5 10 15 20 30
Contribution of
Renewable Energy
to the National
Electricity
Generation Mix
Amount of electricity
generated from
Renewable Energy
Sources in Mw
1 23 5 10 15 20
Bio fuels
Consumption
Quantity of Bio
ethanol consumed
(% of national fuel
mix)
0 2 5 7 10 10
Quantity of Bio
diesel consumed
(% of national fuel
mix)
0 1 2 3 4 5
Percentage of
Population with
Access to
Electricity
Households with
access to electricity
(%)
22 32.2 34.7 37.2 39.5 41.7
Rural Population
Access to Electricity
(%)
3.5 5.0 7.5 10.0 12.5 15.0
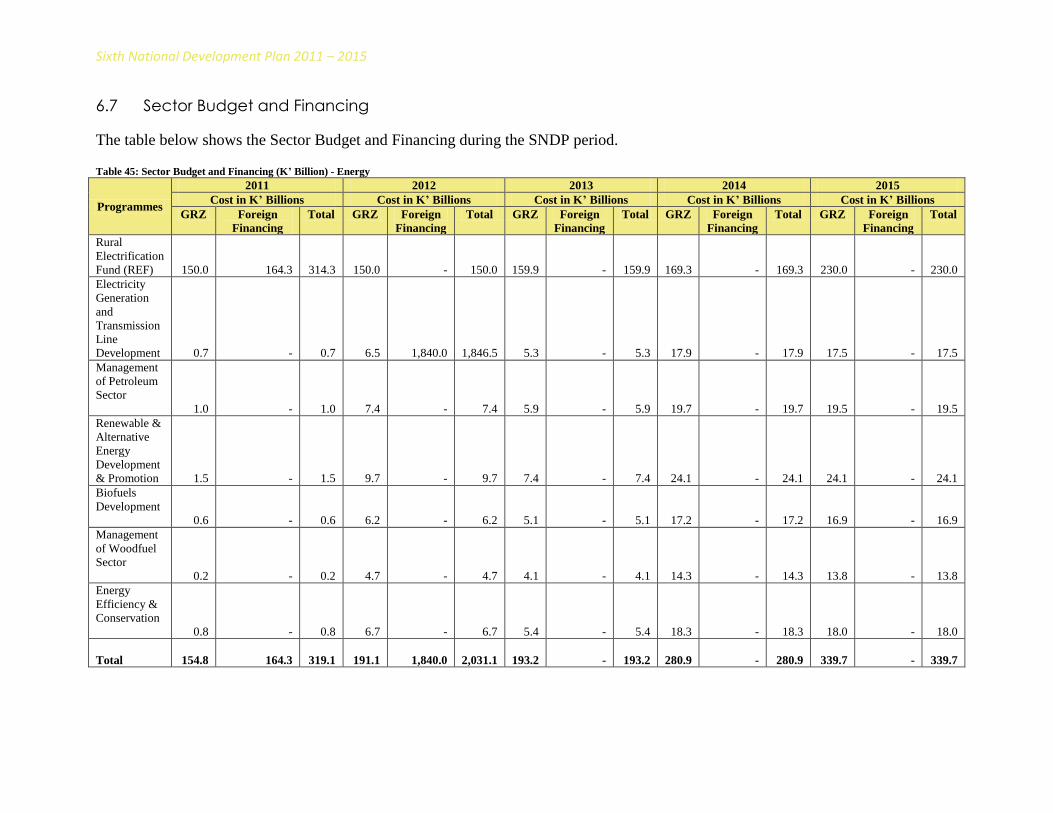
Sixth National Development Plan 2011 – 2015
6.7 Sector Budget and Financing
The table below shows the Sector Budget and Financing during the SNDP period. Table 45: Sector Budget and Financing (K’ Billion) - Energy
Programmes
2011 2012 2013 2014 2015
Cost in K’ Billions Cost in K’ Billions Cost in K’ Billions Cost in K’ Billions Cost in K’ Billions
GRZ Foreign
Financing
Total GRZ Foreign
Financing
Total GRZ Foreign
Financing
Total GRZ Foreign
Financing
Total GRZ Foreign
Financing
Total
Rural
Electrification
Fund (REF)
150.0
164.3
314.3
150.0
-
150.0
159.9
-
159.9
169.3
-
169.3
230.0
-
230.0
Electricity
Generation
and
Transmission
Line
Development
0.7
-
0.7
6.5
1,840.0
1,846.5
5.3
-
5.3
17.9
-
17.9
17.5
-
17.5
Management
of Petroleum
Sector
1.0
-
1.0
7.4
-
7.4
5.9
-
5.9
19.7
-
19.7
19.5
-
19.5
Renewable &
Alternative
Energy
Development
& Promotion
1.5
-
1.5
9.7
-
9.7
7.4
-
7.4
24.1
-
24.1
24.1
-
24.1
Biofuels
Development
0.6
-
0.6
6.2
-
6.2
5.1
-
5.1
17.2
-
17.2
16.9
-
16.9
Management
of Woodfuel
Sector
0.2
-
0.2
4.7
-
4.7
4.1
-
4.1
14.3
-
14.3
13.8
-
13.8
Energy
Efficiency &
Conservation
0.8
-
0.8
6.7
-
6.7
5.4
-
5.4
18.3
-
18.3
18.0
-
18.0
Total
154.8
164.3
319.1
191.1
1,840.0
2,031.1
193.2
-
193.2
280.9
-
280.9
339.7
-
339.7

Sixth National Development Plan 2011 – 2015
75
7. HOUSING
7.1 Introduction
Housing is a basic human need which improves the welfare of society and contributes to social
and economic development. Zambia has been facing a very critical shortage of housing since
independence. The lopsided pattern of development between rural and urban areas has resulted in
very high rural-urban migration without a corresponding effort to provide appropriate housing in
the expanding urban regions. The inadequate availability of affordable and decent housing leads
to poor living conditions and high disease burden.
The housing sector in Zambia is largely driven by individual and private sector initiatives, and
has to a large extent influenced growth in the economy. However, the rapid growth of the sector
in the last five years posed a challenge in maintaining and accounting for the pace of this growth
due to among other challenges inadequate provision of support services, ineffective coordination
of the various stakeholders, poor management information systems and weakenforcement of
standards.
In order to address the current housing deficit, Government will create an enabling environment
to provide affordable, quality and adequate housingto the majority of Zambians.Government will
also encourage Public-Private Partnerships (PPPs) in the housing development and construction
of ancillary facilities.
The Sector will strive to improve data capture and coordination among the stakeholders to
effectively account for the sector‟s contribution to overall growth.
7.2 Review of Past Performance
The housing sector implemented a number of programmes aimed at increasing the housing stock
and providing decent accommodation for front-line staff especially in the rural areas. Under
various government programmes, a total of 2,898 housing units were constructed. Government
further implemented a programme to facilitate the provision of municipal services in newly
created planned settlements in Ndola, Mansa and Mongu districts. During the FNDP period, the
private sector and individuals also made tremendous efforts in expanding the housing stock.
7.3 Vision, Goal and Strategic Focus
Vision
“Planned settlements with adequate, affordable and quality housing by 2030.”
Goal
To facilitate the construction of adequate and affordable housing, increase the existing housing
stock and enhance quality.
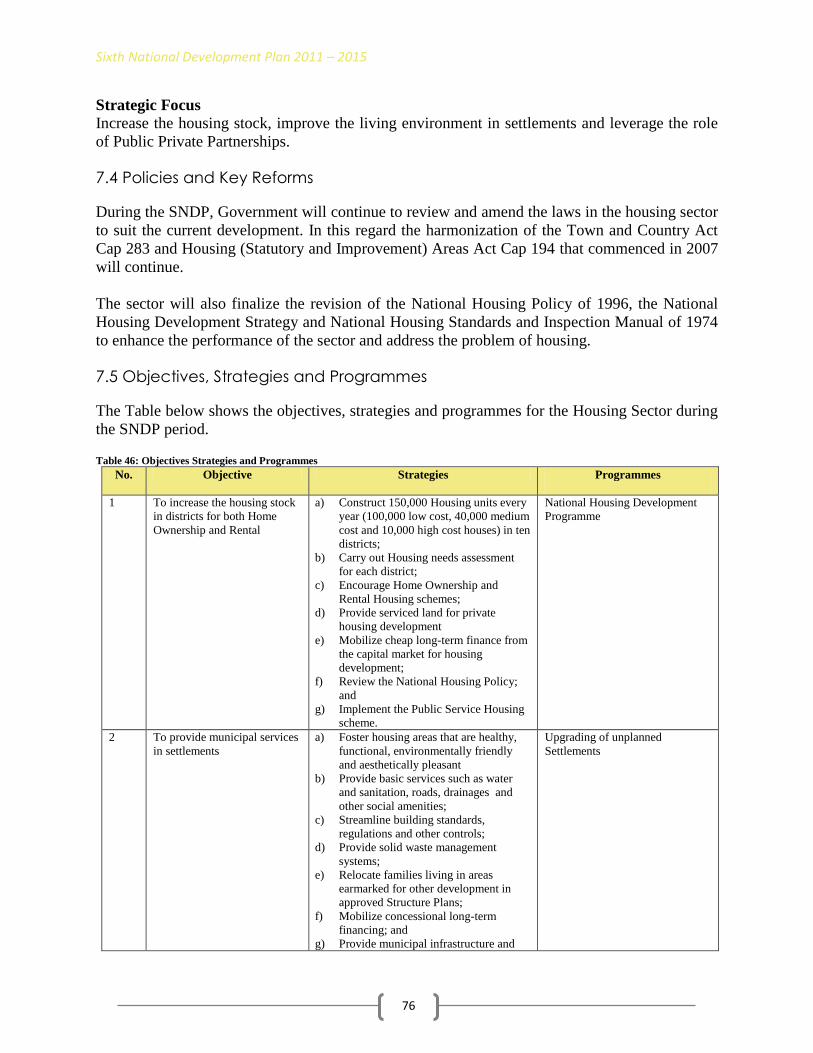
Sixth National Development Plan 2011 – 2015
76
Strategic Focus
Increase the housing stock, improve the living environment in settlements and leverage the role
of Public Private Partnerships.
7.4 Policies and Key Reforms
During the SNDP, Government will continue to review and amend the laws in the housing sector
to suit the current development. In this regard the harmonization of the Town and Country Act
Cap 283 and Housing (Statutory and Improvement) Areas Act Cap 194 that commenced in 2007
will continue.
The sector will also finalize the revision of the National Housing Policy of 1996, the National
Housing Development Strategy and National Housing Standards and Inspection Manual of 1974
to enhance the performance of the sector and address the problem of housing.
7.5 Objectives, Strategies and Programmes
The Table below shows the objectives, strategies and programmes for the Housing Sector during
the SNDP period. Table 46: Objectives Strategies and Programmes
No. Objective Strategies Programmes
1 To increase the housing stock
in districts for both Home
Ownership and Rental
a) Construct 150,000 Housing units every
year (100,000 low cost, 40,000 medium
cost and 10,000 high cost houses) in ten
districts;
b) Carry out Housing needs assessment
for each district;
c) Encourage Home Ownership and
Rental Housing schemes;
d) Provide serviced land for private
housing development
e) Mobilize cheap long-term finance from
the capital market for housing
development;
f) Review the National Housing Policy;
and
g) Implement the Public Service Housing
scheme.
National Housing Development
Programme
2 To provide municipal services
in settlements
a) Foster housing areas that are healthy,
functional, environmentally friendly
and aesthetically pleasant
b) Provide basic services such as water
and sanitation, roads, drainages and
other social amenities;
c) Streamline building standards,
regulations and other controls;
d) Provide solid waste management
systems;
e) Relocate families living in areas
earmarked for other development in
approved Structure Plans;
f) Mobilize concessional long-term
financing; and
g) Provide municipal infrastructure and
Upgrading of unplanned
Settlements

Sixth National Development Plan 2011 – 2015
77
No. Objective Strategies Programmes
support services in harmony with other
sectors.
3 To promote use of local
building materials and
technology development
a) Research in improving the quality of
local material to extend the life span;
b) Encourage private sector
manufacturing of affordable building
materials;
c) Develop training programmes for use
of local materials; and
d) Disseminate and demonstrate
programmes to popularize the use of
local building materials.
Research and Development
4 To renew urban settlements a) Rehabilitate municipal infrastructure
and housing; and
b) Enhance spatial planning
National Urban Renewal
5 To capture new and existing
housing statistics in order to
measure the share of growth
of the sector
a) Develop a strategy for data collection
and surveys;
b) Develop housing management
information system and coordination
mechanisms in the sector;
c) Conduct inventory of existing
stakeholders in the sector; and
d) Conduct inventory of existing housing
units and type.
Development of Housing
Management Information System
6 To create serviced plots for
individuals and private sector
to build
a) Demarcate and allocate plots for site
and services.
Site and Services programme
7.6 Implementation, Monitoring and Evaluation
To effectively monitor and evaluate the implementation of sector programmes, the following
output matrix and key performance indicators Table will be used: Table 47: Sector Output Matrix
Programmes Projects to be
Implemented
Annual Targets Total Output
Expected end of
SNDP
Responsible
Institution(s)
Key
Stakeholders
2011 2012 2013 2014 2015
National
Housing
Development
Construction of
housing units
150,000
150,000 150,000 150,000 150,000 750,000
Housing
Units
constructed
under
various PPP
initiatives
a) 500,000 low
cost,
b) 200,000
medium cost
c) 50,000 high
cost
MLGH ,
Local
Authorities,
National
Housing
Authority,
Private
Sector
National
Urban
Servicing of
settlements
18 28 36 36 54 172 Plots
serviced (in 3
MLGH,
Local

Sixth National Development Plan 2011 – 2015
78
Programmes Projects to be
Implemented
Annual Targets Total Output
Expected end of
SNDP
Responsible
Institution(s)
Key
Stakeholders
2011 2012 2013 2014 2015
Renewal districts by 9
areas in each
province).
Authorities
Upgrading of
unplanned
settlements
Provision of
Municipal
services
(drainage, water,
sewerage and
solid waste
management
roads) in
unplanned
Settlements
12 20 28 36 50 146
Unplanned
Settlements
serviced (3
districts by 9
areas in each
Province)
MLGH,
Local
Authorities,
NHA,
Private
Sector
Development
of Housing
Management
Information
System
Housing
Management
Information
System
- 1 - - - A functional
updated
Management
Information
System
developed for
housing
MLGH,
Local
Authorities,
NHA,
NAPSA,
Private
Sector
Development
of Housing
Management
Information
System
Housing Sector
Coordination
4 4 4 4 4 Quarterly reports
submitted by the
Private Sector,
Local Authorities
and national
Government
Departments on
housing Statistics
MLGH,
Local
Authorities,
NHA,
NAPSA,
Private
Sector
Table 48: Key Performance Indicators
Key Performance Indictors Annual Targets
Name Definition Baseline
2009
2011 2012 2013 2014 2015 Total
Percentage of the
Local Authorities
Budget allocated to
provision of
municipal services:-
(a) Cities
(b) Municipalit
ies
(c) District
Councils
Budget line for
provision of
water, roads,
drainages
sewerage and
solid waste
disposal
- At least
30
percent
At least
30
percent
At least
30
percent
At least
30
percent
At least
30
percent
At least
30
percent
Ratio of Deficit:
Housing Stock
(a) Low
(b) Medium
(c) High
Percentage
increase in
stock of
housing
disaggregated
by the
following
categories;
Low
Medium and
High cost;
To be
establish
ed from
2010
Census
data.
To be
establish
ed from
2010
Census
data.
To be
establish
ed from
2010
Census
data.
To be
establish
ed from
2010
Census
data.
To be
establish
ed from
2010
Census
data.
To be
establish
ed from
2010
Census
data.
To be
establish
ed from
2010
Census
data.

Sixth National Development Plan 2011 – 2015
7.7 Sector Budget and Financing
The Table below shows the Sector Budget and Financing during the SNDP period. Table 49: Sector Budget and Financing (K’ Billion) - Housing
Programme
2011 2012 2013 2014 2015
Cost in K’ Billions Cost in K’ Billions Cost in K’ Billions Cost in K’ Billions Cost in K’ Billions
GRZ Foreign
Financing
Total GRZ Foreign
Financing
Total GRZ Foreign
Financing
Total GRZ Foreign
Financing
Total GRZ Foreign
Financing
Total
National
Housing
Development
3.0
-
3.0
20.0
-
20.0
21.0
-
21.0
22.0
-
22.0
23.0
-
23.0
Provision of
Municipal
services in
Unplanned
Settlements
(Upgrading
of unplanned
settlements)
1.3
-
1.3
2.9
-
2.9
2.9
-
2.9
2.9
-
2.9
3.3
-
3.3
Total
4.3
-
4.3
22.9
-
22.9
23.9
-
23.9
24.9
-
24.9
26.3
-
26.3

Sixth National Development Plan 2011 – 2015
80
Part III
Human Development

Sixth National Development Plan 2011 – 2015
81
8. HEALTH
8.1 Introduction
Government recognizes health as one of the priority sectors that contribute to the wellbeing of
the nation and therefore remains committed to providing quality health services to all of its
citizens. Recognizing that a healthy population is critical to improved production and
productivity, Government will continue investing in the health sector in order to bring health
care as close to the people as possible and also to ensure sustainability of the nation‟s human
capital base required for sustainable economic growth.
During the Fifth National Development Plan (FNDP) period, the sector made some progress
towards meeting some of the performance targets such as the health centre utilization rate,
immunization coverage, malaria case fatality rate and disbursement of funds to districts. Despite
these achievements, the sector continued to face challenges which include high disease burden,
inadequate medical staff and weak logistics management in the supply of drugs and medical
supplies. During the Sixth National Development Plan (SNDP) period, the sector will focus on
overcoming these challenges in order to effectively provide promotive, preventive, curative and
rehabilitative health services.
8.2 Review of Past Performance
During the FNDP period, the sector‟s performance generally improved though the disease
burden still remained high. The results of the 2007 Zambia Demographic and Health Survey
(ZDHS) provided evidence that the years of investment in primary health care programmes had
begun to yield positive results. Notably, infant, under-five, neonatal and maternal mortality rates
dropped between 2002 and 2007. For every 1,000 live births, the Infant Mortality rate decreased
from 95 to 70 deaths, Under-five Mortality rate decreased from 168 to 119 deaths and Neonatal
Mortality Rate (NMR),which reflected the least decrease among the child mortalities, decreased
from 37 to 34 deaths.The NMR as a proportion of the Under Five Mortality Rate in the 2007
ZDHS was 29 percent. Maternal Mortality Ratio reduced from 729 to 591 deaths per 100,000
live births during the same period. These mortality rates were, however, still high.
Maternal,New-bornand Child Health
Despite the reduction in Maternal and Child Mortality rates, these are still generally high. This is
on account of incomprehensive antenatal coverage, inadequate functional emergency facilities,
low institutional deliveries and untrained staff. Adolescent pregnancies continue to contribute
significantly to the high Maternal Mortality Rate and neonatal deaths. For instance, out of 73
districts only 12 had functioning Basic Emergency Obstetric Neonatal Care facilities. Further, it
is estimated that more than 50 percent of pregnant women deliver at home.
During the period under review, the most prevalent diseases that affected child health were
malaria, respiratory infection (non-pneumonia) and diarrhoea. With regard to the national
immunization programme, coverage was generally high, averaging 85 percent between 2006 and
2008. However, in the 20 least performing districts, coverage averaged 67 percent between 2006

Sixth National Development Plan 2011 – 2015
82
and 2008. On the other hand, the country maintained a polio free status which was achieved in
2005 and Maternal Neonatal Tetanus Elimination (MNTE) in 2007.
Malaria
The annual incidence of malaria significantly dropped from 412 cases per 1,000 population in
2006 to 252 cases per 1,000 population in 2008. Malaria deaths reported from health facilities
also declined by 66 percent, implying that Zambia reached the 2010 Roll-Back Malaria target of
reducing malaria mortality by 50 percent. The improvements in the prevention and control of
malaria is as a result of increased use of long and lasting insecticide-treated nets, indoor residual
spraying, improved treatment therapy, prevention of malaria in pregnancy, improvements in
diagnosis using microscopy and Rapid Diagnostic Tests and home management of malaria.
Despite the gains, malaria remained the number one cause of morbidity and mortality in Zambia
during the FNDP period, and poses a severe social and economic burden on communities living
in endemic areas.
HIV and AIDS
According to the 2007 ZDHS, HIV prevalence was estimated at 14.3 percent for adults aged
between 15-49 years as compared to 16 percent in 2002 for the same age group. The six key
drivers are: high rates of multiple concurrent sexual partners, low and inconsistent use of
condoms, low rates of male circumcision, mobility, vulnerable groups with high risk behaviours
and Mother-To-Child-Transmission.
In an effort to address the HIV and AIDS pandemic, the sector scaled-up the implementation of
prevention and treatment strategies. The number of Voluntary Counselling and Testing (VCT)
centres increased from about 450 in 2005 to 1,563 in 2008. Prevention of Mother-To-Child
Transmission (PMTCT) services were also rolled-out to all the districts with the exception of the
newly created district, namely Ikelenge, (with 936 health facilities offering the service by end of
2008) from 67 sites in 2005. Despite these interventions, however, surveys conducted between
2008 and 2009 show that the number of new infections is still high.
Regarding treatment, the scaling-up of PMTCT services resulted in an increase in the percentage
of HIV positive pregnant women who completed prophylaxis from 29 percent in 2006 to 53
percent in 2008. Furthermore, the percentage of HIV positive eligible clients accessing Anti-
Retro Virals (ARVs) increased from 33 percent in 2006 to 79 percent in 2009 translating to
283,863 clients on Anti-Retroviral Therapy (ART). Out of this number, more than 21,000 (7
percent) were children aged below fifteen years. Overall, it is currently estimated that 1,063,309
people are living with HIV in Zambia.
Tuberculosis
The high prevalence of HIV and AIDS in the country has contributed to the increase in the
number of Tuberculosis
(TB) cases with HIV and TB co-infections estimated at 70 percent during the FNDP period. The
sector, however, recorded a treatment success rate of 85 percent in 2008 and 86 percent in 2010
as compared to 79 percent in 2005. This was mainly because the sector expanded the
implementation of the new Stop TB strategy at all levels.

Sixth National Development Plan 2011 – 2015
83
Non-Communicable Diseases
Non-communicable diseases such as cancers, blood pressure, diabetes, heart diseases, sickle cell
anaemia, stroke, mental illnesses, epilepsy and asthma were on the increase during the FNDP
period. Statistics at the National Cancer Registry for the period April 2007 to March 2008 show
that out of the total number of cancer cases, cervical and breast cancers constituted 34.5 percent
and 12.8 percent respectively, while prostate cancer constituted 6 percent. Other studies that
were conducted in 2008 by the Ministry of Health showed a total of 11,893 cases of High Blood
Pressure out of which 472 cases were admitted with 34 deaths. The survey further revealed that 8
percent of the studied population had raised blood sugars with 3percent of the males being
diabetic as compared to 4 percent of the females. The contributing factors for non-communicable
diseases include, age, alcohol and substance abuse, tobacco-smoking and nutritional problems.
Human Resources
During the period under review, the number of frontline health workers (doctors, medical
licentiates, clinical officers, nurses and midwives) increased to 17,168 as of March 2010 from
12,173 as at end 2005, but was still lower than the required establishment number of 39,360 in
2010. Further, the number of public sector frontline Health Workers was 0.93 per 1,000
population in 2009 against the World Health Organisation (WHO) recommended figure of 2.5
per 1,000 population, with the situation more acute in rural areas. The shortage of frontline
health workers has been compounded by increased demand for health workers due to the
construction of new health facilities.
In order to address the above problem, the Zambia Health Workers Retention Scheme was
scaled-up and by December 2009, the scheme had a total of 860 health workers (comprising
different types of health cadres) compared to 103 in 2006 (comprising doctors only). In addition,
training of health workers was increased, with student enrolments for the 2008/2009 intakes
growing by 75 percent nationwide. Nonetheless, the training output of 1,720 health workers per
year over the FNDP period could not meet the required demand.
Essential Drugs and Other Commodities
During the period under review, the availability of essential drugs averaged 82 percent per year
compared to 71percent in 2005. The above notwithstanding, there were some stock-outs during
some months mainly due to inadequate communication and logistic systems and a growing
demand on services. Laboratory services also faced a number of challenges which included
inadequate maintenance, use of untrained staff to operate the equipment and inadequate supply
of reagents and other non-ART related commodities.
Improvements were recorded in the performance of the blood safety programme during the
FNDP period. The number of blood units collected increased from 62,000 in 2005 to 103,000 in
2009 against the estimated annual requirement of 117,500 blood units per year. The main
challenge was overdependence on external support to run the blood safety programme.
Regarding Medical Imaging, hospitals and some urban health centres received X-ray and ultra
sound machines although there were challenges in providing training on how to use them.

Sixth National Development Plan 2011 – 2015
84
Health Infrastructure – Physical and Mobile
During the FNDP period, the sector commenced the construction of a total of 27 hospitals as
well as 231 health posts. Various health centres were also rehabilitated and expanded
countrywide. Of the 27 hospitals commenced, a total of 8 were scheduled to be completed by end
2010 and these were Kapiri-Mposhi, Chadiza, Mumbwa, Mufumbwe, Kaputa, Lumwana, Kaoma
and Lusaka General Hospital. A total of 19 would remain under construction during the SNDP
period and these include Chama, Samfya, Shangombo, Lufwanyama, Chiengi, Mpulungu and
Nakonde. Others are Serenje, Isoka, Choma, Masaiti, Namwala, Luangwa, Lundazi, Mongu,
Milenge, Mwense, Chavuma and Mkushi.
Besides physical health infrastructure, mobile health services were also provided through the
Zambia Flying Doctors Service, Mobile Eye Clinic Services, Mobile Counselling and Testing
(CT) Services, Mobile ART Services and Routine Outreach Services. Provision of Mobile Health
Services made it possible to reach communities in hard-to-reach areas and where physical health
infrastructure is absent or insufficient.
The sector also recognises the impact of climate change on human health. In this regard, climatic
hazards such as droughts and floods have invariably constrained public health service delivery
and induced outbreaks of diseases, such as cholera, dysentery and plague, as well as increasing
incidences of malaria, diarrhoeal diseases, schistosomiasis, respiratory infections and other
emerging vector-borne diseases. The sector will, therefore, mainstream climate change
adaptation into public health policies and programmes.
Health Care Financing
Since 2005, there has been a steady nominal increase in the annual Government health budget
which increased from 9.7 percent in 2005 to about 11 percent in 2009. In view of the need to
improve health care financing, Government has been exploring ways of introducing alternative
means of financing health care services aimed at raising additional revenue and increasing access
to health care services. As one of the strategies, an actuarial study was conducted in 2008 to
establish the viability of establishing a Social Health Insurance Scheme in Zambia. The results of
the study were positive and showed that such a scheme would complement Government‟s
funding to the health sector, and could in the long run improve accessibility, quantity and quality
of health services.
8.3 Vision, Goal and Strategic Focus
Vision
“Equitable access to quality health care by all by 2030”.
Goal
To improve the health status of people in Zambia in order to contribute to socio-economic
development by 2015.
Strategic Focus
To provide equitable access to quality health services.
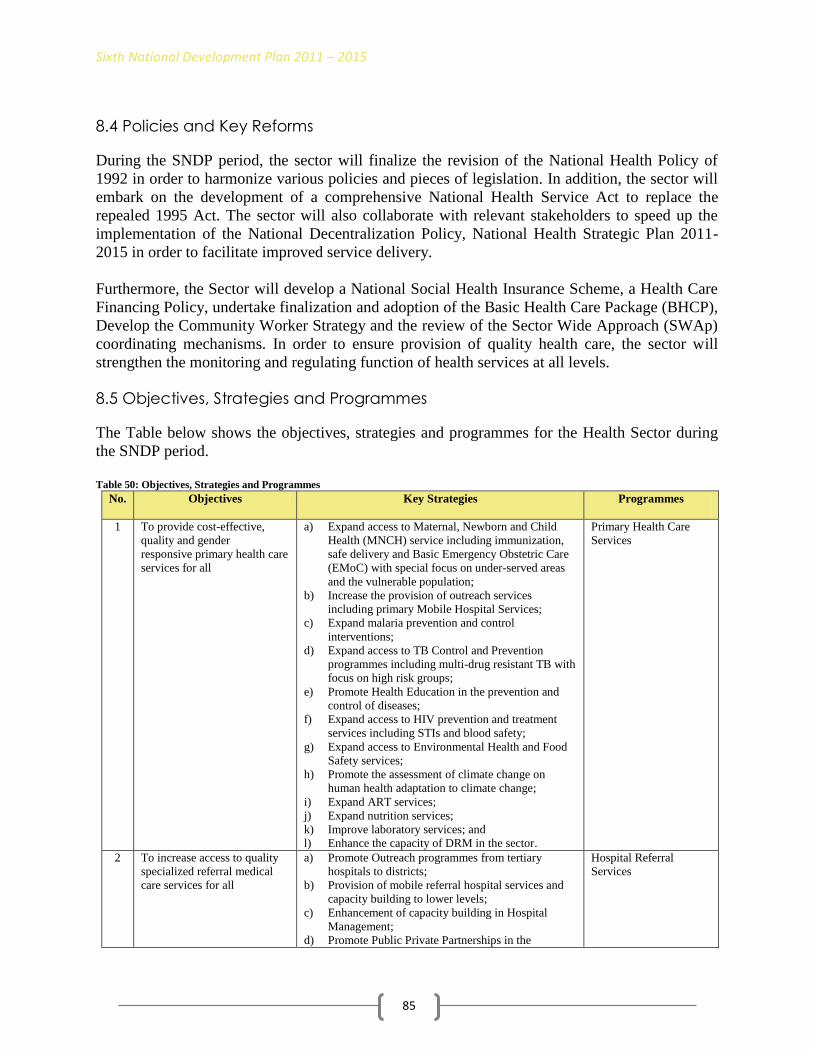
Sixth National Development Plan 2011 – 2015
85
8.4 Policies and Key Reforms
During the SNDP period, the sector will finalize the revision of the National Health Policy of
1992 in order to harmonize various policies and pieces of legislation. In addition, the sector will
embark on the development of a comprehensive National Health Service Act to replace the
repealed 1995 Act. The sector will also collaborate with relevant stakeholders to speed up the
implementation of the National Decentralization Policy, National Health Strategic Plan 2011-
2015 in order to facilitate improved service delivery.
Furthermore, the Sector will develop a National Social Health Insurance Scheme, a Health Care
Financing Policy, undertake finalization and adoption of the Basic Health Care Package (BHCP),
Develop the Community Worker Strategy and the review of the Sector Wide Approach (SWAp)
coordinating mechanisms. In order to ensure provision of quality health care, the sector will
strengthen the monitoring and regulating function of health services at all levels.
8.5 Objectives, Strategies and Programmes
The Table below shows the objectives, strategies and programmes for the Health Sector during
the SNDP period.
Table 50: Objectives, Strategies and Programmes
No. Objectives Key Strategies Programmes
1 To provide cost-effective,
quality and gender
responsive primary health care
services for all
a) Expand access to Maternal, Newborn and Child
Health (MNCH) service including immunization,
safe delivery and Basic Emergency Obstetric Care
(EMoC) with special focus on under-served areas
and the vulnerable population;
b) Increase the provision of outreach services
including primary Mobile Hospital Services;
c) Expand malaria prevention and control
interventions;
d) Expand access to TB Control and Prevention
programmes including multi-drug resistant TB with
focus on high risk groups;
e) Promote Health Education in the prevention and
control of diseases;
f) Expand access to HIV prevention and treatment
services including STIs and blood safety;
g) Expand access to Environmental Health and Food
Safety services;
h) Promote the assessment of climate change on
human health adaptation to climate change;
i) Expand ART services;
j) Expand nutrition services;
k) Improve laboratory services; and
l) Enhance the capacity of DRM in the sector.
Primary Health Care
Services
2 To increase access to quality
specialized referral medical
care services for all
a) Promote Outreach programmes from tertiary
hospitals to districts;
b) Provision of mobile referral hospital services and
capacity building to lower levels;
c) Enhancement of capacity building in Hospital
Management;
d) Promote Public Private Partnerships in the
Hospital Referral
Services

Sixth National Development Plan 2011 – 2015
86
No. Objectives Key Strategies Programmes
provision of specialized health care;
e) Improve existing facilities and develop
communication and transport systems; and
f) Expand and improve services of non-
communicable diseases.
3 To improve the availability
and distribution of qualified
health workers in the country
a) Expand training of health workers;
b) Improve the retention of health workers;
c) Improvement of Human Resource management;
and
d) Provision of appropriate incentives and training to
community health workers.
Human Resource
Development and
Management
4 To ensure availability and
access to essential drugs and
medical supplies
a) Improve drug logistics management at all levels;
b) Develop mechanisms for financing the
procurement of essential drugs and medical
supplies; and
c) Promote rational use of commodities and services.
Drugs and Logistics
Systems
5 To provide infrastructure,
conducive for the delivery of
quality health services
a) Complete the construction of all on-going
infrastructure projects carried over during the
FNDP period;
b) Modernisation and facelift of University Teaching
Hospital and other hospitals
c) Establish at least 400 new health posts country
wide;
d) Expansion of Kasama, Lewanika and Mansa
General Hospitals;
e) Complete hospitals in Chama, Samfya,
Shangombo, Lufwanyama, Chiengi, Mpulungu,
Nakonde, Serenje, Isoka, Choma, Masaiti,
Namwala, Luangwa, Lundazi, Mongu, Milenge,
Mwense, Chavuma and Mkushi;
f) Establish Hospitals in 6 Districts;
g) Improve and expand at least 250 existing health
centres;
h) Establish one training school for clinical officers
i) Establish two nursing schools
j) Establish one Medical and Dental school
k) Construct a National Drug Quality Control
Laboratory, Laboratories and Drug storage
facilities;
l) TDRC infrastructure development;
m) Equip hospitals,healthposts and health centres; and
n) Ensure integrated planning for the construction of
health facilities.
Infrastructure and
Equipment
6 To ensure the availability of
adequate, appropriate and
well-maintained medical
equipment and accessories in
accordance with the Basic
Health Care Package
a) Improve infrastructure database management;
b) Improve management and maintenance of medical
equipment;
c) Strengthen capacity for transport management at all
levels of health care; and
d) Improve ICT capacity.
7 To promote access to quality
health care services through
alternative ways of health care
financing
a) Finalize the development and implementation of
the Health Care Financing Policy; and
b) Develop and enact relevant legal and institutional
framework for the establishment, management and
administration of a National Social Health
Insurance Scheme.
Social Health Insurance

Sixth National Development Plan 2011 – 2015
87
8.6 Implementation, Monitoring and Evaluation
To effectively monitor and evaluate the implementation of sector programmes, the following
output matrix and key performance indicators Tables will be used:
Table 51:Sector Output Matrix
Programmes Projects to be
implemented
Annual Targets Total Output Expected end of
SNDP
Responsible
Institution(s)
and Key
Stakeholders
2011 2012 2013 2014 2015
Primary
Health Care
Services
Maternal
Health
48% 52% 56% 60% 65% Increase in deliveries by skilled
attendants from 45% in 2009 to
65%
MoH, CPs,
Private
Sector,
NGOs, CSOs 32% 37% 41% 46% 50% Increase in facility deliveries
from 28% in 2007 to 50% for
rural areas
81% 83% 86% 88% 90% Increase in facility deliveries
from 79% in 2007 to 90% in
2015 for urban areas
Newborn and
Child Health
80% 80% 80% 80% 80% Fully immunization coverage of
at least 80% in each district
MoH, CPs,
Private
Sector,
NGOs, CSOs
Malaria
Prevention
and Control
177 152 127 102 75 Incidence of malaria for all ages
reduced from 252 cases per
1,000 population in 2008 to 75
cases per 1,000 population
MoH,
MLGH, CPs,
Private
Sector,
NGOs, CSOs
HIV
Prevention
and Treatment
33% 37% 41% 46% 50% Number of people aged 15-49
counseled, tested and received
results increased from 15% in
2007 to 50%
MoH, NAC,
MoE, CPs,
Private
Sector,
NGOs, CSOs 80% 85% 87% 90% 90% 90% of all eligible HIV and
AIDS patients (adults and
children) put on ART
TB Prevention
and Control
70% 70% 70% 70% 70% A case detection of 70% of all
the infectious cases of TB
MoH, NAC,
CPs, Private
Sector,
NGOs, CSOs 85% 85% 85% 85% 85% A cure rate of 85% of all the TB
cases detected
Mobile
Hospital
Services
9 - 9 - - Procurement of 18 mobile
medical units, 2 units per
province
MoH,
MoFNP
Hospital
Referral
Services
Capacity
Building in
Hospital
Management
4 4 4 4 4 Four comprehensive capacity
building courses conducted
annually
MoH, CPs,
Private
Sector,
NGOs,
CSOs
Non-
communicable
diseases
5% 10% 10% 15% 20% Incidence of non-communicable
diseases reduced by 20%
Human
Resource
Development
and
Management
Training of
Health
Workers
20% 35% 50% 65% 70% Training output increased by at
least 70% for Doctors, Nurses,
Clinical Officers and Midwives
MoH, MoE,
MoFNP,
CPs, Private
Sector,
NGOs Human
Resource
management
50% 60% 70% 80% 100% Number of health centres with at
least one qualified Health
Worker increased from 50% to
100%
Drugs and
Logistics
Procurement
and
100% 100% 100% 100% 100% Percentage of months for which
drugs are in stock at health
MoH, CPs,
Private

Sixth National Development Plan 2011 – 2015
88
Programmes Projects to be
implemented
Annual Targets Total Output Expected end of
SNDP
Responsible
Institution(s)
and Key
Stakeholders
2011 2012 2013 2014 2015
Systems distribution of
essential
drugs and
medical
supplies
centres and hospitals maintained
at 100% throughout the SNDP
period
Sector,
NGOs
Drug
Logistics
management
at all levels
1 - - - - Establish a functional
Pharmaceutical Management
Information System
incorporating all levels
Infrastructure
and
Development
Complete on-
going
construction
of hospitals
5 4 6 3 1 19 District Hospitals completed MoH, MWS
Establishment
of new
hospitals
2 2 1 1 - 6 district hospitals established
Construction
of health posts
80 80 80 80 80 At least 400 new health posts
constructed nationwide
Improvement
and expansion
of health
centres
50 50 50 50 50 At least 250 heath centres
improved and expanded
nationwide
Expansion
and upgrading
of General
Hospitals
2 1 1 - - 4General Hospitals upgraded
Modernisation
and facelift of
University
Teaching
Hospital and
other hospitals
1 3 4 3 3 Hospitals modernised and given
a facelift
Expansion of
existing health
centres
50 50 50 50 50 At least 250 existing health
centres expanded nationwide
Establish four
training
schools
2 1 1 - - 1 training school for clinical
officers, 2 nursing schools and 1
medical and dental school
constructed and operational
Construction
of a National
Drug Quality
Control
Laboratory
- 1 - - - A fully fledged and functional
National Drug Quality Control
Laboratory established
Develop a
functional
medical
equipment
maintenance
plan
- 1 - - - A fully fledged and functional
medical equipment maintenance
plan established
Social Health
Insurance
Development
and enactment
of the Health
Care
Financing
Policy
1 - - - - Health Care Financing policy
developed and implemented
MoH,
MoFNP,
Cabinet
Office,
MLSS

Sixth National Development Plan 2011 – 2015
89
Programmes Projects to be
implemented
Annual Targets Total Output Expected end of
SNDP
Responsible
Institution(s)
and Key
Stakeholders
2011 2012 2013 2014 2015
Preparation of
legislature on
Social Health
Insurance
1 - - - - Legislature on Social Health
Insurance enacted
Establishment
of a Social
Health
Insurance
Fund
- 1 - - - A Social Health Insurance Fund
established
Table 52: Key Performance Indicators
Key Health Performance Indicator
Baseline
2009
Annual Targets
2011 2012 2013 2014 2015
Under-five Mortality rate per 1,000 live births 119* 91 84 77 70 63
Maternal Mortality Ratio per 100,000 live births 591* 375 321 267 213 159
Proportion of rural households living within 5km of the
nearest health facility
54^ 58 60 65 68 70
Incidence of malaria per 1,000 population 252 ** 177 152 127 102 75
Malaria Case Fatality Rate among Children below the age
of 5 years
38** 30 28 25 23 20
Percent of Fully Immunised Children under one year of
age
90** 80 80 80 80 80
Percent of deliveries assisted by skilled health personnel 45** 48 52 56 60 65 ^ 2004 data extracted from the 2004 LCMS * 2007 data extracted from the 2007 ZDHS
**2008 data extracted from the 2008 Annual Health Statistics Bulletin

Sixth National Development Plan 2011 – 2015
8.7 Sector Budget and Financing
The Table below shows the Sector Budget and Financing during the SNDP period. Table 53:Sector Budget and Financing (K’ Billion) - Health
Program
me
2011 2012 2013 2014 2015
Cost in K’ Billions Cost in K’ Billions Cost in K’ Billions Cost in K’ Billions Cost in K’ Billions
GRZ Foreign
Financing
Total GRZ Foreign
Financing
Total GRZ Foreign
Financing
Total GRZ Foreign
Financing
Total GRZ Foreign
Financing
Total
Primary
Health Care
171.4
-
171.4
275.0
-
275.0
314.3
-
314.3
374.9
-
374.9
394.7
-
394.7
Hospital
Refferal
Services
91.8
-
91.8
147.3
-
147.3
168.4
-
168.4
200.8
-
200.8
211.4
-
211.4
Central
Support
Services
121.4
-
121.4
174.9
-
174.9
206.9
-
206.9
251.5
-
251.5
266.2
-
266.2
Social Health
Insurance
5.0
-
5.0
28.0
-
28.0
25.0
-
25.0
25.0
-
25.0
25.0
-
25.0
Human Resources
for Health
125.1
-
125.1
200.7
-
200.7
229.4
-
229.4
273.6
-
273.6
288.1
-
288.1
Drugs and
Medical Supplies
136.0
-
136.0
218.2
-
218.2
249.4
-
249.4
297.4
-
297.4
313.2
-
313.2
Medical
Equipment
37.4
-
37.4
60.0
-
60.0
68.6
-
68.6
81.9
-
81.9
86.2
-
86.2
Infrastructure
114.3
-
114.3
183.3
-
183.3
209.6
-
209.6
249.9
-
249.9
263.1
-
263.1
Total
802.4
-
802.4
1,287.5
-
1,287.5
1,471.7
-
1,471.7
1,755.0
-
1,755.0
1,847.8
-
1,847.8

Sixth National Development Plan 2011 – 2015
91
9. EDUCATION AND SKILLS DEVELOPMENT
9.1 Introduction
Education and Skills Development plays a critical role in the socio-economic development. It
provides opportunities for growth, poverty reduction, employment, productivity and human
development.The sector comprises all the providers of education and skills in the public, private
and non-governmental organisations.
During the Fifth National Development Plan (FNDP) period, there was significant increase in
access to education and skills development at all levels. This was mainly as a result of marked
increase in construction and rehabilitation of infrastructure especially at basic school level and
significant recruitment of teachers. Further, the Technical Education, Vocational and
Entrepreneurship Training (TEVET) National Qualification Framework which aims at
standardising qualifications was developed and adopted. However, the sector experienced some
challenges in the quality of education and skills development provided. This resulted in low
levels of learning achievement and mismatch between skills delivered and the requirements of
the labour markets. Other major challenges included the confinement of Early Childhood Care,
Development and Education (ECCDE) to pre-schooling instead of offering a more
comprehensive developmental support and learning experience, and the limited access to tertiary
education due to the overall infrastructure deficit and low staffing levels.
In the SNDP, there will be more focus on quality improvement. Attention will continue to be
placed on teacher supply (recruitment, deployment and retention); provision of teaching and
learning materials and infrastructure development. Additional focus will be placed on school
level processes such as school governance, teacher supervision, quality assurance, teacher
continuous professional development and pedagogical support so as to actively pursue an
improvement in quality of educational delivery. Furthermore, the sector will seek to address the
efficiency and effectiveness of education and skills development delivery through curriculum
development, improved management and governance of institutions, community involvement,
civil society and private sector engagement.
9.2 Review of Past Performance
During the FNDP period, the plan was to construct 7,500 classrooms which should have resulted
into the provision of space for 600,000 pupils(when used for double shift). Nonetheless, 4,627
classrooms were constructed and this translated into the provision of space for 370,160 pupils
(when used for double shift). Pupil school enrolment increased to 3.6 million in 2009 as
compared to 2.9 million in 2005 for basic education. Net Enrolment Ratio (NER) increased from
93 percent in 2005 to 97 percent in 2009, while the Gender Parity Index (GPI) improved from
0.95 in 2005 to 0.99 in 2009. Completion rates at Grade 9 improved from 43 percent in 2005 to
52 percent in 2009.
In order to increase access at high school level, the plan was to construct a total of 100 high
schools. However, only 47 were completed which translated into 564 classrooms thereby

Sixth National Development Plan 2011 – 2015
92
creating learning space for 22,560 pupils. With regard to high school education, pupil school
enrolments rose from 162,019 in 2005 to 257,100 in 2009. Completion rates at Grade 12
improved from 17 percent in 2005 to 19 percent in 2009. Pupil teacher ratio improved from 22:1
to 20:1 in 2005 and 2009 respectively. NER increased from 21 percent in 2005 to 26 percent in
2009, while the GPI increased from 0.81 in 2005 to 0.87 in 2009.
At tertiary level, two double storey lecture rooms comprising 5 rooms and one lecture theatre
each were under construction at Nkrumah, Copperbelt Secondary Teachers College (COSETCO)
and Zambia Institute of Special Education (ZAMISE). Libraries were also under construction at
Mulungushi University, ZAMISE, Nkrumah and COSETCO Colleges of education. At
Mulakupikwa University College in Chinsalia two double storey lecture room comprising 5
rooms and two lecture theatres was constructed. With regard to teacher education, a number of
colleges had their programmes upgraded. In the case of tertiary education, the COSETCO and
Nkrumah College of Education were upgraded to offer degree programmes. A diploma
programme for upper basic teachers was also introduced in 3 colleges, namely Mufulira,
Livingstone and Charles Lwanga colleges of education. This was in an effort to increase the
number of teachers with higher qualifications so as to improve the quality of education
provision. In addition, 3 classroom blocks were also constructed at every college of education in
order to increase student teacher intake. In terms of student teacher enrolments at colleges of
education the total in 2009 was 5,461, of which 2,567 or 47 percent were females.
In order to increase access to tertiary education, Government encouraged the establishment of
private universities. These efforts led to the establishment of 14 private universities and 1
additional public university. Total enrolment in public universities increased from 12,774 in
2005 to 19,086 in 2009.
On skills development, the total annual enrolment in TEVET institutions reached 33,399 in 2009
from 30, 511 in 2005 with 59 percent males and 41 percent females. Efforts made to increase
access to skills training included the establishment of the Lapidary and Gemstone Processing
Training Centre and the construction of permanent facilities at Chipata, Mongu, Solwezi,
Kaoma, Mwinilunga and Petauke Trades Training Institutes. Rehabilitation works were also
done at 15 colleges countrywide.
In order to provide equitable access to education, various interventions and policy decisions were
put in place during the FNDP period, which included expansion of Adult Literacy Education,
Trade Testing and Distance Vocational Education. With regard to Orphans and other Vulnerable
Children (OVC), 126, 284 pupils (66,219 females and 60,065 males) from Grades 1 to12
received bursaries in 2009 compared to 76,776 pupils (39,867 females and 36,909 males) in
2005.
Access to education from Grades 1 to 12 for Learners with Special Education Needs (LSEN)
increased from 89,269 in 2005 to 207,437 in 2009, out of which 46 percent were females. With
regards to skills development, 3 percent of the total enrolments in TEVET institutions were
Learners with Special Education Needs of which 2 percent were physically challenged and 1
percent were hard of hearing and mentally challenged.

Sixth National Development Plan 2011 – 2015
93
9.3 Vision, Goal and Strategic Focus
Vision
“Innovative and productive life-long education and training for all by 2030”.
Goal
Increase equitable access to quality education and skills training to enhance human capacity for
sustainable national development.
Strategic Focus The sector will focus on expanding access to high school and tertiary education. Further, efforts
will be made to improve the quality of education at all levels sothat appropriate skills,
knowledge, attitudes and values required for social and economic development are imparted to
the learners. Special attention will therefore be given to curriculum review, development and
delivery. Particular attention will also be placed on teacher availability especially in the rural
areas.
9.4 Policies and Key Reforms
The key reforms will include the revision of the Education Act of 1966 as well as the repeal the
Universities Act of 1999 and replace it with a more comprehensive Higher Education Act. These
Acts will regulate the establishment, organisation, governance, management and funding of
education institutions. In addition, the Technical Education, Vocational and Entrepreneurship
Training Policy of 1996 and the Technical Education, Vocational and Entrepreneurship Training
Act of 1998 will be revised. Other key legislative changes will include the revision of the
Apprenticeship Act of 1966, the introduction of a Higher Education Authority, a National
Qualifications Authority, and a Teaching Council which will ensure compliance with provisions
for registration and accreditation. In addition, the transformation of some colleges of education
into universities and the review of the National Education Policy of 1996 will continue.
The sector will also collaborate with relevant stakeholders to speed up the implementation of the
National Decentralization Policy in order to facilitate improved service delivery.
During the SNDP period, Government shall also continue implementing the teachers‟ rural
retention scheme which aims at increasing the number of teachers serving in rural and remote
areas through interventions like rural hardship allowances, loan schemes, provision of solar
power and construction of staff houses.
It is also realised that climatic hazards (floods and droughts) have historically imposed immense
socio-economic costs on the education sector by damaging education infrastructure and access
roads displacing communities and causing increased absenteeism due to hunger and deprivation.
The sector will enhance adaptive capacity of the population to changing climate through
integration of issues of climate change into the education systems.

Sixth National Development Plan 2011 – 2015
94
9.5 Objectives, Strategies and Programmes
The Table below shows the objectives, strategies and programmes for the Education and Skills
Development Sector during the SNDP period. Table 54: Objectives, Strategies and Programmes
No. Objectives Strategies Programmes
1 To increase access,
efficiency and equity to
quality ECCDE and Basic
Education
a) Promote an investment framework for private sector
to establish ECCDE and basic schools;
b) Strengthen Continuous Professional Development
(CPD) for teachers;
c) Upgrade teacher qualifications from certificate to
diplomas and degrees;
d) Strengthen teacher support systems;
e) Improve school governance, teacher supervision and
quality assurance systems;
f) Recapitalise Zambia Education Publishing House in
order to increase production of low cost local
teaching/learning materials;
g) Introduce ICT as a teaching and learning tool;
h) Increase support to community schools. to provide
quality education;
i) Recruit and deploy teachers especially in rural
areas;
j) Promote participation and improve facilities for
LSEN;
k) Create gender responsive school environment;
l) Expand school feeding programme;
m) Make schools more accountable to the community
through operationalization of DIP; and
n) Improve school management through capacity
building of school managers.
ECCDE and Basic
Education
2 To increase access,
efficiency and equity to
quality High School
education
a) Introduce and expand alternative modes of
education including ICT;
b) Strengthen Continuous Professional Development
(CPD) for teachers;
c) Upgrade teacher qualifications especially from
diplomas to degrees;
d) Recruit and deploy teachers especially in rural
areas;
e) Provide adequate and timely teaching and learning
materials;
f) Promote participation and improve facilities for
LSEN;
g) Create gender responsive school environment;
h) Make schools more accountable to the community;
and
i) Improve school management through capacity
building of school managers.
High School Education
3 To increase the number of
qualified and competent
teachers in schools
a) Expand alternative modes of teacher education;
b) Improve facilities for LSEN;
c) Increase training opportunities for teachers at all
levels and more especially in various subjects
especially mathematics, science and technology;
d) Finalise the transformation of Nkrumah Teachers‟
College and COSETCO into universities; and
e) Increase bursaries for female student teachers.
Teacher Education
4 To increase access, a) Promote private sector participation at university University Education

Sixth National Development Plan 2011 – 2015
95
No. Objectives Strategies Programmes
participation and equity in
the provision of quality
university education
level;
b) Establish a mechanism for regulating university
education especially in terms of quality assurance;
c) Provide alternative modes of university education
delivery including ICT;
d) Enhance quality of university education and its
relevance to needs of the economy;
e) Establish student loan scheme system; and
f) Increase participation and improve facilities for
LSEN.
5 To increase efficiency and
equitable access to quality
Basic Skills and TEVET
a) Provide alternative modes of basic skills and
TEVET delivery including ICT;
b) Promote the participation of non-public training
providers in the delivery of TEVET;
c) Promote participation of women especially in
technical programmes;
d) Promote participation of LSEN in vocational skills
training;
e) Integrate Entrepreneurship and Medium and Small
Micro Enterprise Development (MSME) into basic
skills and TEVET; and
f) Promote collaboration with private sector as a way
of improving link between training and labour
market requirements.
Basic Skills and TEVET
6 To increase Adult Literacy
levels
a) Establish and increase participation in Adult
Literacy centres;
b) Enhance access and quality assurance;
c) Link adult literacy programmes to higher education
and skills development programmes; and
d) Build capacity of adult literacy providers at all
levels.
Adult Literacy
7 To expand and improve
infrastructure
a) Establish and rehabilitate infrastructure in
educational institutions;
b) Re-introduce the school preventive maintenance
programme;
c) Improve facilities for LSEN;
d) Provide safe learning environment for all learners
by re-introducing boarding facilities including
weekly boarding facilities;
e) Provide school furniture and equipment; and
f) Enhance the capacity of DRM in the sector.
Infrastructure Development
8 To review the curriculum
at all levels to make it
relevant and responsive to
national aspirations and
education needs
a) Review curriculum, teaching and learning materials
in formal and informal curricula.
Curriculum Development
9.6 Implementation, Monitoring and Evaluation
To effectively monitor and evaluate the implementation of sector programmes, the following
output matrix and key performance indicatorsTable will be used:
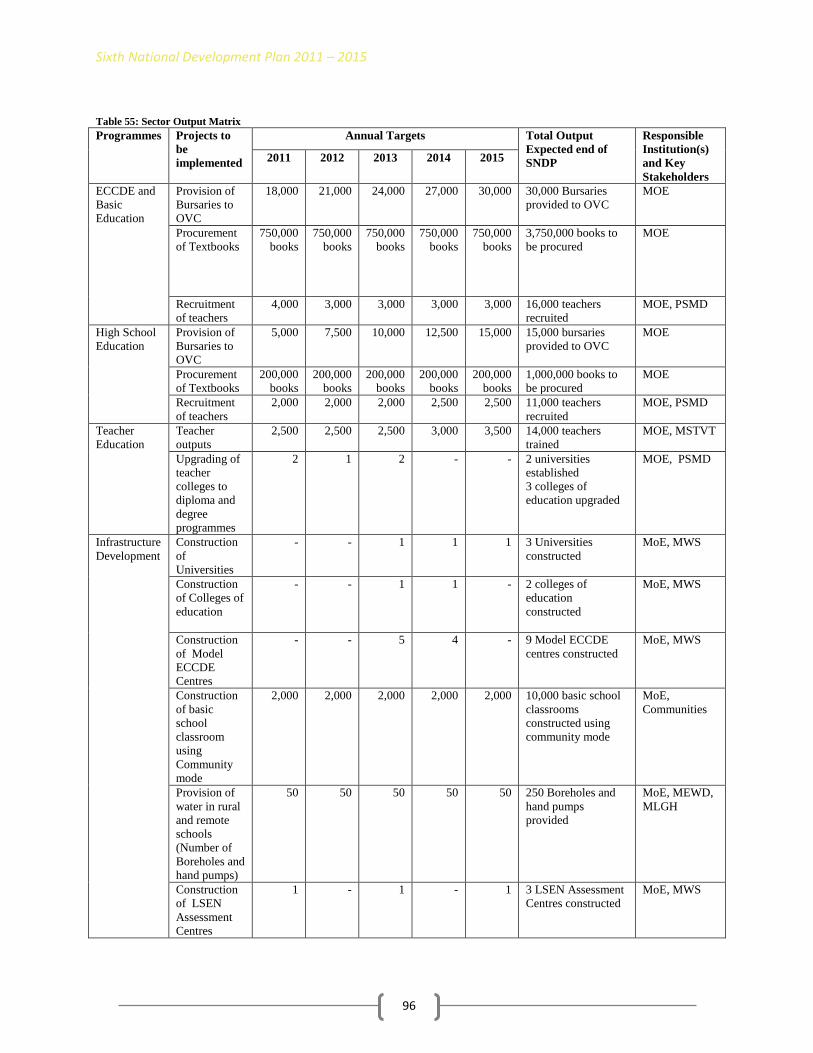
Sixth National Development Plan 2011 – 2015
96
Table 55: Sector Output Matrix
Programmes Projects to
be
implemented
Annual Targets Total Output
Expected end of
SNDP
Responsible
Institution(s)
and Key
Stakeholders
2011 2012 2013 2014 2015
ECCDE and
Basic
Education
Provision of
Bursaries to
OVC
18,000 21,000 24,000 27,000 30,000 30,000 Bursaries
provided to OVC
MOE
Procurement
of Textbooks
750,000
books
750,000
books
750,000
books
750,000
books
750,000
books
3,750,000 books to
be procured
MOE
Recruitment
of teachers
4,000 3,000 3,000 3,000 3,000 16,000 teachers
recruited
MOE, PSMD
High School
Education
Provision of
Bursaries to
OVC
5,000 7,500 10,000 12,500 15,000 15,000 bursaries
provided to OVC
MOE
Procurement
of Textbooks
200,000
books
200,000
books
200,000
books
200,000
books
200,000
books
1,000,000 books to
be procured
MOE
Recruitment
of teachers
2,000 2,000 2,000 2,500 2,500 11,000 teachers
recruited
MOE, PSMD
Teacher
Education
Teacher
outputs
2,500 2,500 2,500 3,000 3,500 14,000 teachers
trained
MOE, MSTVT
Upgrading of
teacher
colleges to
diploma and
degree
programmes
2 1 2 - - 2 universities
established
3 colleges of
education upgraded
MOE, PSMD
Infrastructure
Development
Construction
of
Universities
- - 1 1 1 3 Universities
constructed
MoE, MWS
Construction
of Colleges of
education
- - 1 1 - 2 colleges of
education
constructed
MoE, MWS
Construction
of Model
ECCDE
Centres
- - 5 4 - 9 Model ECCDE
centres constructed
MoE, MWS
Construction
of basic
school
classroom
using
Community
mode
2,000 2,000 2,000 2,000 2,000 10,000 basic school
classrooms
constructed using
community mode
MoE,
Communities
Provision of
water in rural
and remote
schools
(Number of
Boreholes and
hand pumps)
50 50 50 50 50 250 Boreholes and
hand pumps
provided
MoE, MEWD,
MLGH
Construction
of LSEN
Assessment
Centres
1 - 1 - 1 3 LSEN Assessment
Centres constructed
MoE, MWS

Sixth National Development Plan 2011 – 2015
97
Programmes Projects to
be
implemented
Annual Targets Total Output
Expected end of
SNDP
Responsible
Institution(s)
and Key
Stakeholders
2011 2012 2013 2014 2015
Construction
of upper
Basic Schools
(Grades 8-9)
using
contractor
mode
5 5 4 4 2 18 upper Basic
Schools constructed,
2 Upper Basic
Schools constructed
MoE, MWS
Construction
and equipping
of 20 Zonal
Resource
Centres
- 5 5 5 5 20 Zonal Resource
Centres constructed
MoE, MWS
Construction
of high
schools using
contractor
Mode
- - 20 20 20 60 high schools
constructed
MoE, MWS
Construction
of schools for
continuing
education
2 2 2 2 2 10 schools for
continuing education
constructed
MoE, MWS
Completion
of High
Schools
26 20 - - - 46 High Schools
completed
MoE, MWS
Construction
of additional
classrooms in
existing high
schools in
rural areas by
community
mode
168 164 164 - - 496 additional
classrooms
constructed
MOE, MWS
Construction
of TEVET
training
institutions
2 2 2 2 2 10 TEVET training
institutions
constructed
MSTVT
Construction
of TEVET
Centres of
Excellence
- 1 1 1 - 3 TEVET Centres of
Excellence
constructed
MSTVT
Rehabilitation
of 150 High
Schools
5 30 40 40 35 150 High Schools
rehabilitated
MoE, MWS
Rehabilitation
of TEVET
Institutions
- 4 4 4 - 12 TEVET
Institutions
rehabilitated
MSTVT
Rehabilitation
of Schools
for
Continuing
Education
3 3 2 2 - 10 Schools for
Continuing
Education
rehabilitated
MoE
Rehabilitation
of furniture
frames
20,000 30,000 30,000 10,000 10,000 100,000 furniture
frames rehabilitated
MoE
Procurement
of double
100,000 100,000 100,000 100,000 100,000 500,000 double
seater desks
MoE

Sixth National Development Plan 2011 – 2015
98
Programmes Projects to
be
implemented
Annual Targets Total Output
Expected end of
SNDP
Responsible
Institution(s)
and Key
Stakeholders
2011 2012 2013 2014 2015
seater desks procured
Procurement
of single
seater school
desks
40,000 40,000 40,000 40,000 40,000 200,000 single seater
school desks
procured
MoE
Construction
of teaches
houses
200 200 200 200 200 1,000 Teachers‟
Houses constructed
MoE, MWS
Teachers
upgraded to
Diploma level
15 15 15 15 15 75 Teachers
upgraded to Diploma
level,
(At least one
Teacher upgraded in
Carpentry,
Automotive
Mechanic and
bricklaying)
MSTVT
Teachers
upgraded to
degree level
10 10 10 10 10 50 Teachers
upgraded to degree
level
MSTVT
Upgrading of
TEVET
Institution
into a
University
1 - - - - 1 University College
upgraded
MSTVT,
PSMD, MoE
Number of
TEVET
institutions
equipped with
training
equipment
and books
7 7 7 7 7 All 35 public
TEVET institutions
(including the 10 to
be constructed
during the SNDP
period)
MSTVT
Number of
bursaries to
marginalized
groups
(special
bursary)
1,000 1,000 1,000 1,000 1,000 5,000 MSTVT
Table 56: Key Performance Indicators
Key Performance
Indicator
Baseline
2009
Annual Targets
2011 2012 2013 2014 2015
Net Enrolment Rate (NER) %
Grades 1-7 103.610 96 97 98 99 100
Grades 8-9 30.06 34 38 42 43.5 45
Grades 10-12 27 28.5 30 32 34.5 36
Tertiary Enrolment Against the Population
TEVET places 33,000 40,000 42,000 44,000 47,000 50,000
Completion Rate %
Grade 7 91.70 94 96 98 99 100
Grade 9 51.98 55 59 63 65 67
Grade 12 19.47 23 27 31 34 38
Basic Skills and TEVET 91.8 92.3 92.8 93.3 93.8 94.3
10Net Enrolment Rate cannot exceed 100% but due to the mismatch between CSO projections and the actual head counts conducted in schools
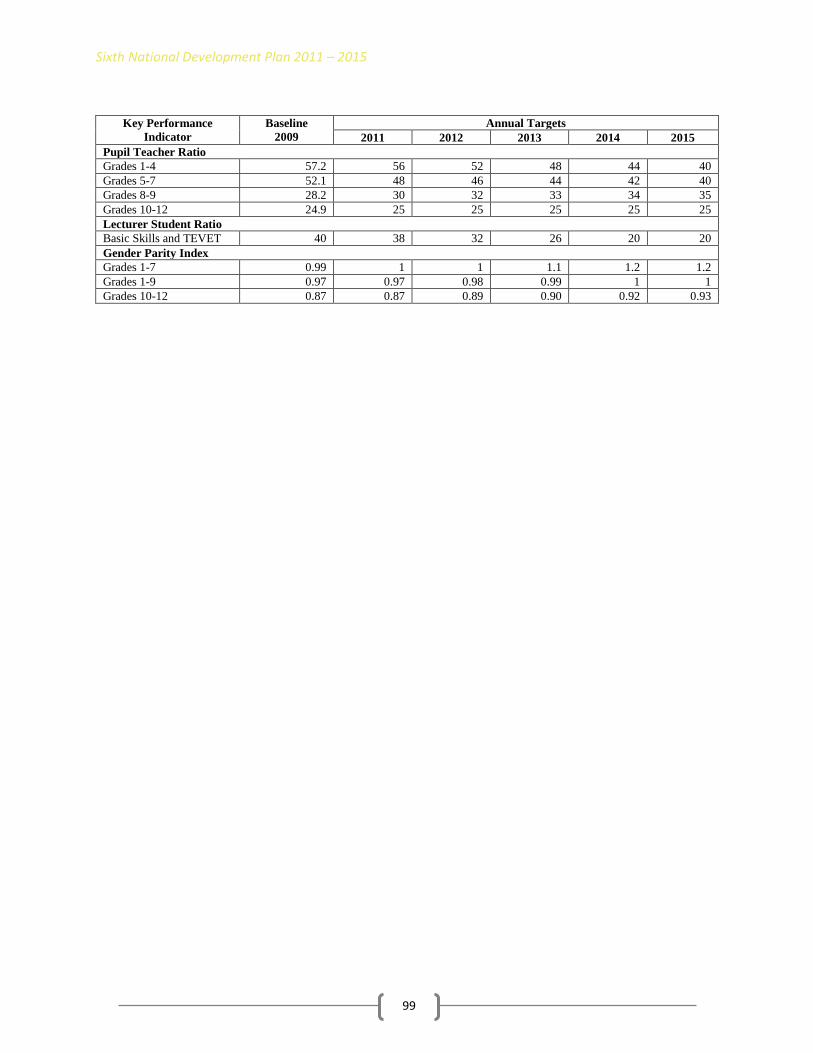
Sixth National Development Plan 2011 – 2015
99
Key Performance
Indicator
Baseline
2009
Annual Targets
2011 2012 2013 2014 2015
Pupil Teacher Ratio
Grades 1-4 57.2 56 52 48 44 40
Grades 5-7 52.1 48 46 44 42 40
Grades 8-9 28.2 30 32 33 34 35
Grades 10-12 24.9 25 25 25 25 25
Lecturer Student Ratio
Basic Skills and TEVET 40 38 32 26 20 20
Gender Parity Index
Grades 1-7 0.99 1 1 1.1 1.2 1.2
Grades 1-9 0.97 0.97 0.98 0.99 1 1
Grades 10-12 0.87 0.87 0.89 0.90 0.92 0.93

Sixth National Development Plan 2011 – 2015
9.7 Sector Budget and Financing
The Table below shows the Sector Budget and Financing during the SNDP period. Table 57: Sector Budget and Financing (K’ Billion) – Education and Skills Development
Programmes 2011 2012 2013 2014 2015
Cost in K’ Billions Cost in K’ Billions Cost in K’ Billions Cost in K’ Billions Cost in K’ Billions
GRZ Foreign
Financing
Total GRZ Foreign
Financing
Total GRZ Foreign
Financing
Total GRZ Foreign
Financing
Total GRZ Foreign
Financing
Total
ECCDE 0.4 0.2 0.5 0.5 0.2 0.6 0.7 0.2 0.9 1.0 0.2 1.1 1.1 0.2 1.2
Basic
Education
178.7
54.4
233.1
203.9
37.2
241.1
225.0
37.2
262.2
305.2
37.2
342.4
339.5
37.2
376.7
High School
Education
114.7
28.1
142.8
121.6
2.6
124.2
136.4
2.6
139.0
183.5
2.6
186.1
203.8
2.6
206.4
Teacher
Education
72.3
7.2
79.4
72.6
0.8
73.4
134.8
0.8
135.6
179.6
0.8
180.4
199.7
0.8
200.5
University
Education
301.2
301.2
337.3
-
337.3
362.8
-
362.8
482.4
-
482.4
536.3
-
536.3
Infrastructure
Development
o/w Basic
Skils and
TEVET
354.1
130.6
484.7
623.2
121.0
744.2
657.5
121.0
778.5
756.7
121.0
877.7
830.7
121.0
951.7
41.6
41.6
62.4
-
62.4
68.6
-
68.6
74.9
-
74.9
80.7
-
80.7
Basic Skills
and TEVET
36.4
36.4
47.3
-
47.3
49.2
-
49.2
50.8
-
50.8
52.3
-
52.3
Adult
Literacy
1.4
0.1
1.5
1.4
0.2
1.6
2.3
0.2
2.4
3.0
0.2
3.2
3.3
0.2
3.5
Total 1,059.1 220.5 1,279.6 1,407.8 162.0 1,569.8 1,568.6 162.0 1,730.6 1,962.1 162.0 2,124.1 2,166.8 162.0 2,328.7

Sixth National Development Plan 2011 – 2015
101
10. WATER AND SANITATION
10.1 Introduction
Water and Sanitation is comprised of two sub-sectors, Water Resources Management and
Development (WRMD) and Water Supply and Sanitation (WSS). All sectors, amongst others,
agriculture, mining, industry, housing and energy require access to adequate water and sanitation
services for their development. Developments in these sectors have an impact on the quality and
quantity of available water resources, thus sectoral activities need to be effectively coordinated
and regulated so as to protect the environment.
During the FNDP period, improvements were recorded in the provision of safe water and
adequate sanitation including the construction of new water supply facilities and rehabilitation of
existing facilities aimed at improving access. In the area of sanitation, improvements under the
urban and peri-urban water supply and sanitation were varied, covering the areas of solid waste
management and maintenance of water supply schemes. These were complemented by the
completion of a situation analysis of rural sanitation and the formulation of national programmes
for rural and urban water supply and sanitation, respectively. Furthermore, achievements in the
water resources management and development sub-sector included the implementation of
projects in the Integrated Water Resources Management and Water Efficiency Plan (IWRM-
WEP), which sets out an integrated approach to managing water resources, and the piloting of
decentralised water resources management structures and rehabilitation and construction of
infrastructure.
Nonetheless, the sector faced some challenges, the major ones being, growing demand for water
and sanitation services and absence of integrated water resources management at river catchment
levels.
To address the challenges, the focus for the next five years will be to increase investment for
water and sanitation infrastructure development and establishment of river catchment
management structures for effective integrated water resources management. This will be the
foundation of the water resources management and infrastructure development programmes to
ensure sustainability in the provision of water and sanitation services in Zambia. This will also
ensure that all sectoral needs (including the environment) are considered together in water
development planning and implementation with active community participation at grass-roots
level. Access to water by various sectors will result in equitable socio-economic development of
the country.
10.2 Review of Past Performance
During the period under review, performance of the sector was generally below target although
there was improvement in the performance of some programmes. In particular progress was
made in the area of construction and rehabilitation of boreholes with 3,800 new boreholes
constructed and 2,790 boreholes rehabilitated.
Sixth National Development Plan 2011 – 2015
102
With regard to Water Resources Management and Development (WRMD), a total of 13 earth
dams were completed out of the targeted 17 while a total of 84 earth dams were rehabilitated
against the planned target of 91. Special attention was given to construction of dams in farming
blocks and resettlement schemes to promote irrigation. On hydro-metric stations, the sector
rehabilitated 126 against a target of 300 stations while groundwater network observation points
were expanded to 71 against the targeted 120.
Furthermore, achievements in policy reforms included the production of the IWRM-WEP of
2008, establishment of the IWRM Training Centre at the University of Zambia, setting up
decentralized water resources management structures in the Kafue and Lunsemfwa Catchments
and the adoption of the revised National Water Policy of 2010. Notwithstanding the progress
outlined above, the sector experienced challenges such as inadequate legal framework, limited
investments in infrastructure and inadequate institutional structures. Importantly too, the lack of
an Early Warning System for hydrological extreme events like natural disasters (floods/droughts)
made response ineffective as they were always reactive and unsustainable.
In the rural areas, 3,800 new water facilities were installed out of the planned 4,000 and 1,800
facilities rehabilitated against a target of 2,800. In most provinces, protected water point
coverage was still low in rural areas. The practice of safe sanitation increased, with a total of
162,000 facilities being constructed.
In the urban and peri-urban areas, FNDP initiatives significantly increased access to safe water
supply. A National Urban Water Supply and Sanitation Programme (NUWSSP) was developed.
In the Water Supply and Sanitation (WSS) sub-sector, there were a number of challenges.
Whereas there was an improvement in access to Water Supply and Sanitation in rural and urban
areas, an overall review of the FNDP showed that financial commitment to the UWSS amounted
to only 2.4 percent of the „core‟ expenditure and 1.5 percent of total national budget. In addition,
there was high, unsustainable reliance on funding from Cooperating Partners for the sub-sector.
In general, water supply and sanitation service coverage was still very low with only 35
sewerage schemes in existence countrywide and most requiring major rehabilitation. The vast
majority of the urban population relied on on-site systems. Current estimates indicate that less
than half of the urban population has access to adequate sanitation.
Further, water demand for domestic and industrial use has been on the increase while supply has
remained stagnant. At the beginning of 2010, demand was 1,330,000 m3 per day against the
production capacity of 946,000 m3 per day. This demand is projected to increase to 2,402,000 m
3
per day by 2015.
Waste generation by all sectors of the economy is currently not well managed, with 10 to 40
percent of the urban areas serviced with solid waste collection. Drainage systems are either
inadequate or non-existent, resulting in unhealthy living conditions in urban areas. The situation
is exacerbated by weak institutional capacity, ineffective cost recovery mechanisms and poor
community attitudes towards waste disposal.
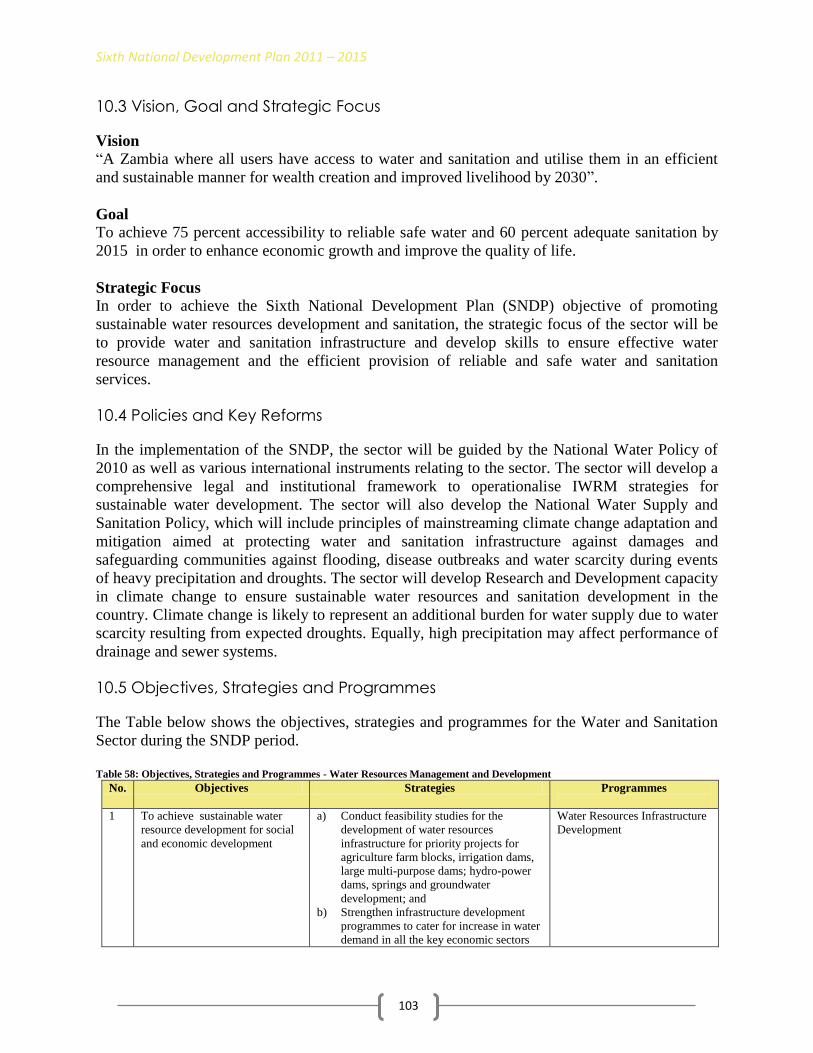
Sixth National Development Plan 2011 – 2015
103
10.3 Vision, Goal and Strategic Focus
Vision
“A Zambia where all users have access to water and sanitation and utilise them in an efficient
and sustainable manner for wealth creation and improved livelihood by 2030”.
Goal
To achieve 75 percent accessibility to reliable safe water and 60 percent adequate sanitation by
2015 in order to enhance economic growth and improve the quality of life.
Strategic Focus
In order to achieve the Sixth National Development Plan (SNDP) objective of promoting
sustainable water resources development and sanitation, the strategic focus of the sector will be
to provide water and sanitation infrastructure and develop skills to ensure effective water
resource management and the efficient provision of reliable and safe water and sanitation
services.
10.4 Policies and Key Reforms
In the implementation of the SNDP, the sector will be guided by the National Water Policy of
2010 as well as various international instruments relating to the sector. The sector will develop a
comprehensive legal and institutional framework to operationalise IWRM strategies for
sustainable water development. The sector will also develop the National Water Supply and
Sanitation Policy, which will include principles of mainstreaming climate change adaptation and
mitigation aimed at protecting water and sanitation infrastructure against damages and
safeguarding communities against flooding, disease outbreaks and water scarcity during events
of heavy precipitation and droughts. The sector will develop Research and Development capacity
in climate change to ensure sustainable water resources and sanitation development in the
country. Climate change is likely to represent an additional burden for water supply due to water
scarcity resulting from expected droughts. Equally, high precipitation may affect performance of
drainage and sewer systems.
10.5 Objectives, Strategies and Programmes
The Table below shows the objectives, strategies and programmes for the Water and Sanitation
Sector during the SNDP period.
Table 58: Objectives, Strategies and Programmes - Water Resources Management and Development
No. Objectives Strategies Programmes
1 To achieve sustainable water
resource development for social
and economic development
a) Conduct feasibility studies for the
development of water resources
infrastructure for priority projects for
agriculture farm blocks, irrigation dams,
large multi-purpose dams; hydro-power
dams, springs and groundwater
development; and
b) Strengthen infrastructure development
programmes to cater for increase in water
demand in all the key economic sectors
Water Resources Infrastructure
Development

Sixth National Development Plan 2011 – 2015
104
No. Objectives Strategies Programmes
(agriculture, water for strategic
institutions and disaster mitigation,
hydro-power etc.)
2 To strengthen capacity for
disaster risk management,
mitigation and adaptation to
effects of climate change.
a) Develop pilot projects for improvement
of water conservation infrastructure
against climatic variability including
reduction of flooding;
b) Implement climate change adaptation
projects countrywide; and
c) Enhance the capacity of DRM in the
sector
Climate Change Adaptation and
Mitigation
3 To develop innovative
approaches and appropriate
technologies for the effective
management of the nation‟s
water resources
a) Conduct applied research in water
management and development to enhance
socio-economic advancement;
b) Conduct demand driven surveys;
c) Strengthen the national hydrological
network for water resource survey and
institutional capacity for hydro-
meteorological and groundwater
monitoring; and
d) Conduct applied research in water
resources management and development
to climate change adaptation and the
enhancement of socio-economic
development.
Research and Development
4 To ensure effective water
resources management at
catchment, regional and national
levels
a) Provide and implement an appropriate
policy, legal and institutional framework
for integrated water resources
management; and
b) Develop skills at river catchment, basin,
regional and national levels.
Integrated Water Resources
Management
Table 59: Objectives, Strategies and Programmes - Water Supply and Sanitation
No. Objectives Key Strategies Programmes
1 To provide adequate, safe and
cost effective water supply and
sanitation services with due
regard to environmental issues
a) Enhance the implementation of the Water
Sector master plans;
b) Infrastructure development for
sustainable RWSS11service delivery and
protection of the environment;
c) Enhance capacity in effective planning,
implementation and monitoring of
programmes for RWSS service delivery;
d) Develop and provide sustainable water
supply services in urban and peri-urban
areas;
e) Strengthen human, technical and financial
capacity of institutions for improved
water supply and sanitation service
delivery in the urban and peri-urban
areas;
f) Enhance Solid Waste Management and
institutional management systems-
National Rural Water Supply
and Sanitation Programme
(NRWSSP)
National Urban Water Supply
and Sanitation Programme
(NUWSSP)
11 Rural Water Supply and Sanitation

Sixth National Development Plan 2011 – 2015
105
No. Objectives Key Strategies Programmes
Opportunity to reduce GHG emissions
and benefit from carbon trading; and
g) Enhance institutional capacity of
Councils in the implementation of Storm
Water Drainage Infrastructure
Development.
10.6 Implementation, Monitoring and Evaluation
To effectively monitor and evaluate the implementation of sector programmes, the following
output matrix and key performance indicators table will be used:
Table 60: Sector Output Matrix - Water Resources Management and Development
Programmes Projects to be
Implemented
Annual Targets Total
Output
Expected
for
SNDP
Responsible
Institutions and
Key
Stakeholders
2011 2012 2013 2014 2015
Water
Resources
Management
and
Development
Provision of office
accommodation in
Lusaka and Ndola
1 1 - - - 2 offices
constructed
in Lusaka
and Ndola
MEWD
DWA
MWS
Technical and
professional staff
Capacity Building
51 11 10 10 10 92 officers
trained
MEWD, Training
Institutions
Operationalization
of Water Resources
Management
Programme:-
- - - - 1
WRM
Authority
established MEWD,
a) WRM
Authority
b) Catchment
council
- 1 1 - 1 3 catchment
councils
established
Stakeholders
c) Water users
associations
1 1 1 1 4 water users
associations
formed
MEWD,
Dam construction
based on climate
resilient design
considerations
4
3 3 3 3 16 dams
constructed
MEWD
DWA
MACO
MLFD
LAs
MoFNP
CPs
Rehabilitation of
dams based on
climate resilient
design
considerations
20 20 20 20 20 100 dams
rehabilitated
Construction of
rainwater harvesters
to include
institutional
buildings
4 4 4 4 4 20 rain
harvesters
constructed
Spring development 2 2 2 2 2 10 springs
developed
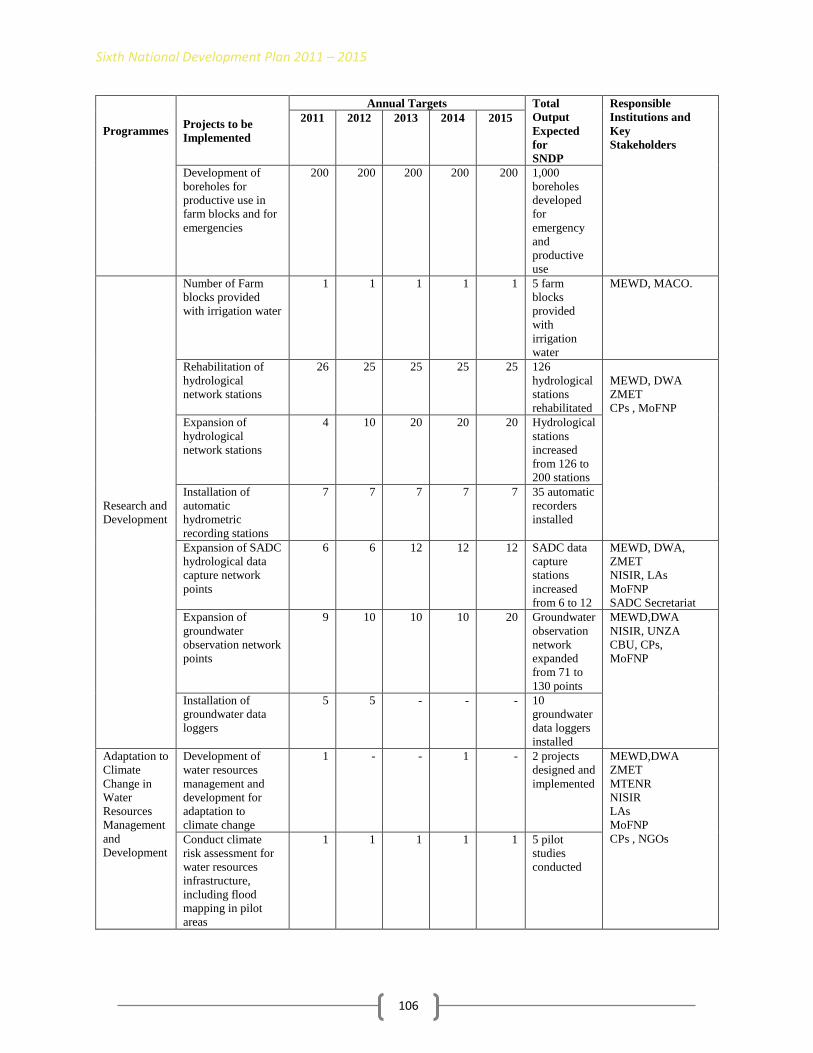
Sixth National Development Plan 2011 – 2015
106
Programmes Projects to be
Implemented
Annual Targets Total
Output
Expected
for
SNDP
Responsible
Institutions and
Key
Stakeholders
2011 2012 2013 2014 2015
Development of
boreholes for
productive use in
farm blocks and for
emergencies
200 200 200 200 200 1,000
boreholes
developed
for
emergency
and
productive
use
Research and
Development
Number of Farm
blocks provided
with irrigation water
1 1 1 1 1 5 farm
blocks
provided
with
irrigation
water
MEWD, MACO.
Rehabilitation of
hydrological
network stations
26 25 25 25 25 126
hydrological
stations
rehabilitated
MEWD, DWA
ZMET
CPs , MoFNP
Expansion of
hydrological
network stations
4 10 20 20 20 Hydrological
stations
increased
from 126 to
200 stations
Installation of
automatic
hydrometric
recording stations
7 7 7 7 7 35 automatic
recorders
installed
Expansion of SADC
hydrological data
capture network
points
6 6 12 12 12 SADC data
capture
stations
increased
from 6 to 12
MEWD, DWA,
ZMET
NISIR, LAs
MoFNP
SADC Secretariat
Expansion of
groundwater
observation network
points
9 10 10 10 20 Groundwater
observation
network
expanded
from 71 to
130 points
MEWD,DWA
NISIR, UNZA
CBU, CPs,
MoFNP
Installation of
groundwater data
loggers
5 5 - - - 10
groundwater
data loggers
installed
Adaptation to
Climate
Change in
Water
Resources
Management
and
Development
Development of
water resources
management and
development for
adaptation to
climate change
1 - - 1 - 2 projects
designed and
implemented
MEWD,DWA
ZMET
MTENR
NISIR
LAs
MoFNP
CPs , NGOs Conduct climate
risk assessment for
water resources
infrastructure,
including flood
mapping in pilot
areas
1 1 1 1 1 5 pilot
studies
conducted

Sixth National Development Plan 2011 – 2015
107
Programmes Projects to be
Implemented
Annual Targets Total
Output
Expected
for
SNDP
Responsible
Institutions and
Key
Stakeholders
2011 2012 2013 2014 2015
Construct climate
change proof water
infrastructure to
increase resilience
5 5 5 5 5 25 water
systems
constructed
(dams,
underground
water
harvesters
and
protected
springs)
Table 61: Sector Output Matrix - Water Supply and Sanitation
Programmes Projects to be
Implemented
Annual Targets Total Output
Expected for SNDP
Responsible
Institutions
Key
Stakeholders
2011 2012 2013 2014 2015
Rural Water Supply and
Sanitation
National
Rural Water
Supply and
Sanitation
Programme
(NRWSSP)
based on
climate
change design
considerations
Construction of
boreholes
1,200 1,200 1,200 1,200 1,200 6,000 boreholes
constructed
MLGH, LAs
CPs, NGOs
Rehabilitation
of boreholes
and wells
689 689 689 689 689 3,445 water points
rehabilitated
MLGH, LAs,
CPs, NGOs
Construction of
sanitary
facilities
57,510 59,241 61,013 62,827 64,683 305,274 latrines
constructed
MLGH, LAs,
CPs, NGOs
Urban and Peri-urban Water Supply and
Sanitation
National
Urban Water
Supply and
Sanitation
Programme
(NUWSSP)
Development
of urban water
supply
infrastructure
3 3 2 2 - 10 new urban water
systems built
MLGH, LAs,
CPs, NGOs
Rehabilitation
of urban water
supply
infrastructure
3 3 3 1 - 10 urban water
systems rehabilitated
MLGH, LAs,
CPs, NGOs
Development
of urban
sanitation
infrastructure
in newly
created districts
3 3 3 3 3 15 urban sanitation
infrastructure units
established
MLGH, LAs,
CPs, NGOs
Rehabilitate
urban
sanitation
infrastructure
1 2 2 3 3 11 urban sanitation
units rehabilitated
MLGH, LAs,
CPs, NGOs
Solid waste
management
infrastructure
investment
2 2 3 3 3 13 solid waste
management units
established
MLGH, LAs,
CPs, NGOs
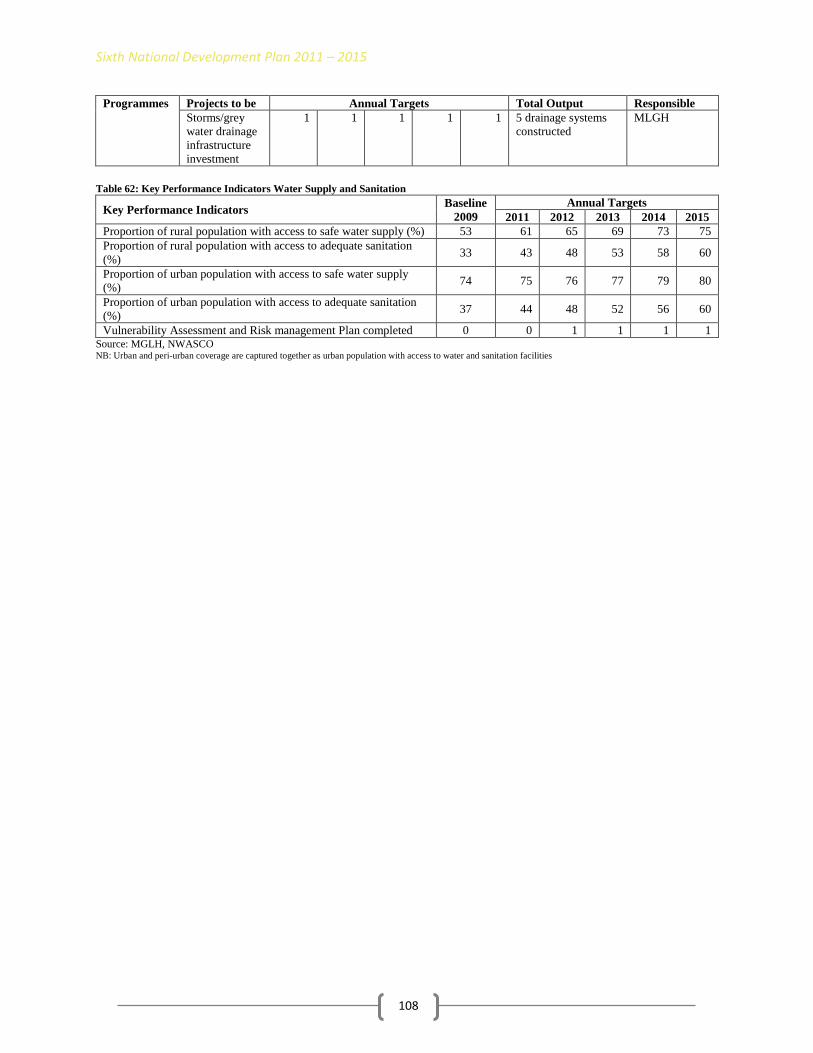
Sixth National Development Plan 2011 – 2015
108
Programmes Projects to be
Implemented
Annual Targets Total Output
Expected for SNDP
Responsible
Institutions
Key
Stakeholders
Storms/grey
water drainage
infrastructure
investment
1 1 1 1 1 5 drainage systems
constructed
MLGH
Table 62: Key Performance Indicators Water Supply and Sanitation
Key Performance Indicators Baseline
2009
Annual Targets
2011 2012 2013 2014 2015
Proportion of rural population with access to safe water supply (%) 53 61 65 69 73 75
Proportion of rural population with access to adequate sanitation
(%) 33 43 48 53 58 60
Proportion of urban population with access to safe water supply
(%) 74 75 76 77 79 80
Proportion of urban population with access to adequate sanitation
(%) 37 44 48 52 56 60
Vulnerability Assessment and Risk management Plan completed 0 0 1 1 1 1 Source: MGLH, NWASCO NB: Urban and peri-urban coverage are captured together as urban population with access to water and sanitation facilities

Sixth National Development Plan 2011 – 2015
10.7 Sector Budget and Financing
The Table below shows the Sector Budget and Financing during the SNDP period. Table 63: Sector Budget and Financing (K’ Billion) – Water Development
Programmes
2011 2012 2013 2014 2015
Cost in K’ Billions Cost in K’ Billions Cost in K’ Billions Cost in K’ Billions Cost in K’ Billions
GRZ Foreign
Financing
Total GRZ Foreign
Financing
Total GRZ Foreign
Financing
Total GRZ Foreign
Financing
Total GRZ Foreign
Financing
Total
Water
Resources
Infrastructure
Development
15.2
-
15.2
31.3
-
31.3
25.0
-
25.0
71.1
-
71.1
96.6
-
96.6
Research and
Development
4.0
-
4.0
5.8
-
5.8
17.7
-
17.7
13.9
-
13.9
11.9
-
11.9
Adaptation to
Climate
Change in
WRM and
Development
1.3
-
1.3
5.4
-
5.4
7.0
-
7.0
4.9
-
4.9
6.1
-
6.1
Total
20.5
-
20.5
42.6
-
42.6
49.7
-
49.7
89.9
-
89.9
114.6
-
114.6
Table 64: Sector Budget and Financing (K’ Billion) – Water and Sanitation
Programmes
2011 2012 2013 2014 2015
Cost in K’ Billions Cost in K’ Billions Cost in K’ Billions Cost in K’ Billions Cost in K’ Billions
GRZ Foreign
Financing
Total GRZ Foreign
Financing
Total GRZ Foreign
Financing
Total GRZ Foreign
Financing
Total GRZ Foreign
Financing
Total
National
Rural Water
Supply 47.9 0.0 48.0 60.0 0.0 60.0 139.9 0.0 139.9 160.0 0.0 160.0 179.9 0.0 179.9
National
Urban and
Peri-urban
Water
Supply and
Sanitation 72.1 0.0 72.1 90.0 0.0 90.0 210.1 0.0 210.1 240.0 0.0 240.0 270.1 0.0 270.1
Total 140.5 0.0 140.5 192.5 0.0 192.5 399.7 0.0 399.7 425.9 0.0 425.9 564.6 0.0 564.6

Sixth National Development Plan 2011 – 2015
110
11. CHILD, YOUTH AND SPORTS DEVELOPMENT
11.1 Introduction
The Child, Youth and Sports Development sector has great potential to contribute effectively to
poverty reduction and economic growth through skills development and promotion of sport.
During the period under review the sector performed well exceeding the targets set in skills
development, training in leadership skills and the training of youth and child workers as well as
sports administrators, coaches and community facilitators. This was despite the sector facing
many challenges such as the HIV and AIDS pandemic, unemployment, limited access to
financial resources, limited tertiary education facilities and inadequate and poor sports and
recreation infrastructure.
11.2 Review of Past Performance
During the period under review, the sector implemented the following major programmes, skills
development, leadership training, rehabilitation of street and vulnerable children and the training
of sports administrators, coaches and community facilitators.
A total of 15,566 youths were trained in various skills against a target of 6,000 while 79,043
youths were trained in leadership skills against a target of 5,000. Furthermore, success was
recorded in the sports sub-sector with a total of 5,626 Sports administrators, coaches, referees,
and the community facilitators trained. Also, the number of vulnerable and street children that
were rehabilitated and trained were 648 children against the target of 1,050, of whom 82 were
female and 566 were male. In order to facilitate skills development, a number of Youth Resource
Centres were constructed and rehabilitated. Those constructed were Chama, Kwilimuna,
Mwinilunga, Ngungu, Muoyo and Kazungula while Luwingu, Chiyota, Chinsali, Mbabala, and
Chisangwe were rehabilitated. The construction and rehabilitation works at these Youth
Resource Centres are planned to be completed during the SNDP period.
During the FNDP period, the sector reviewed and launched the National Sports Policy in 2009.
Further, the sector amended the National Sports Council Act No. 15 of 1997, the Professional
Boxing and Wrestling Control Act No.13 of 1994, and the National Youth Development Council
Act No. 7 of 1986.
11.3 Vision, Goal and Strategic Focus
Vision
“Enhanced youth and child survival, development and protection through a well-coordinated and
multi-sectoral approach by 2030”.

Sixth National Development Plan 2011 – 2015
111
Goal
To achieve increased empowerment and participation of children and youth in all areas affecting
their well-being and livelihood and enhance observance and protection of their rights in order to
build a sound human resource base.
Strategic Focus
In the SNDP, the focus will be on the development of Child,Youth and Sports Infrastructure for
skills training in order to enhance human development.
11.4 Policies and Key Reforms
In the SNDP period, the sector will continue to review legislation in sport, youth and child
affairs. Further, the sector will ensure the harmonization and effective coordination of the
various pieces of legislation in conjunction with other stakeholders.
11.5 Objectives, Strategies and Programmes
The table below shows the objectives, strategies and programmes for the Child, Youth and Sport
Sector during the SNDP period.
Table 65: Objectives, Strategies and Programmes
11.6 Implementation, Monitoring and Evaluation
To effectively monitor and evaluate the implementation of sector programmes, the following
output matrix and key performance indicators table will be used:
No. Objectives Strategies Programmes
1 To build and rehabilitate
youth and sports
infrastructure
a) Encourage Private sector and community
participation in the construction and
rehabilitation of infrastructure;
b) Transform Zambia National Service and
Refugee camps into skills development and
recreation centres; and
c) Mobilise resources for public infrastructure
development.
Infrastructure Development
2 To provide appropriate
empowerment and training
in skills development
a) Facilitate access to credit, business
development skills training, mentorship
opportunities and information on market
opportunities;
b) Establish youth business incubators in
Lusaka and Chambishi;
c) Facilitate the mainstreaming of
entrepreneurship training in the school
curricula; and
d) Enhance entrepreneurship training in
vocational and life skills curricula.
Skills Development and
Empowerment

Sixth National Development Plan 2011 – 2015
112
Table 66: Sector Output Matrix
Programmes Projects to be
implemented
Annual Targets Total
Output
Expected
end of
SNDP
Responsible
Institution(s)
Key
Stakeholders
2011 2012 2013 2014 2015
Infrastructure
Development
1. Constructions of: Ministry of
Sport Youth
and Child
Development.
Ministry of
Works and
Supply.
a) New stadia in Lusaka
and Livingstone
-
-
1
-
1
2 stadia
constructed
in Lusaka
and
Livingstone
b) Youth Resource
Centres
8 8 8 8 8 40 Youth
Research
Centres
constructed
c) Sports Complex 2 2 2 2 1 9 Sports
Complexes
constructed
d) Child Guide Centres 6 6 6 6 6 30 Child
Guide
Centres
constructed
e) Multi-purpose sports
facility
2 2 2 2 1 9 Multi-
purposes
Sports
facilities
constducted
f) Boarding Houses 6 6 6 6 6 30 Boarding
Houses
constructed
2. Rehabilitations: Ministry of
Sport Youth
and Child
Development.
Ministry of
Works and
Supply
a) Provincial Stadia 2 2 2 2 1 9 Province
Stadia
rehabilitated
b) NASDEC 1 - - - - 1
c) Conversion of
Refugee Camps Into
Training skills centre
1 1 1 1 1 5 Refugee
Camps
converted
into skills
training
Centres
d) Rehabilitation of
Luanshya Sports
Complex
- 1 - - - 1 Sports
Complex
rehabilitated
in Luanshya
e) Zambia National
Service Camps
2 2 2 2 1 9 Camps
rehabilitated
3. Awareness promotion
on child and youth
rights
24 24 24 24 24 120
Awareness
campaigns
conducted
5. Training in various
skills
24 24 24 24 24 120 Skills
training
conducted

Sixth National Development Plan 2011 – 2015
113
Table 67: Key Performance Indicators
Key Performance Indicators Baseline
2009
Annual Targets Overall Target
2011 2012 2013 2014 2015 By 2015
Number of people participating in sports - 2850 3000 3850 3600 4850 4850
Number of awareness campaigns
conducted on child and youth Rights
- 24 24 24 24 24 120
Number of youth trained in various life
and vocational skills
- 2850 3000 4200 4400 5800 5800
Number of youth business incubators
establishment
- - 1 - 1 - 2

Sixth National Development Plan 2011 – 2015
11.7 Sector Budget and Financing
The matrix below shows the Sector Budget and Financing during the SNDP period.
Table 68: Sector Budget and Financing (K’ Billion) – Child, Youth and Sports Development
Programmes
2011 2012 2013 2014 2015
Cost in K’ Billions Cost in K’ Billions Cost in K’ Billions Cost in K’ Billions Cost in K’ Billions
GRZ Foreign
Financing Total GRZ
Foreign
Financing Total GRZ
Foreign
Financing Total GRZ
Foreign
Financing Total GRZ
Foreign
Financing Total
Infrastructure
Development
4.8
-
4.8
20.1
-
20.1
22.3
-
22.3
24.1
-
24.1
25.8
-
25.8
Youth and Child
Empowerment
10.0
-
10.0
10.1
-
10.1
10.2
-
10.2
10.3
-
10.3
10.4
-
10.4
Total
14.8
-
14.8
30.2
-
30.2
32.5
-
32.5
34.4
-
34.4
36.2
-
36.2

Sixth National Development Plan 2011 – 2015
107
Part IV
Growth Sectors

Sixth National Development Plan 2011 – 2015
108
12. AGRICULTURE, LIVESTOCK AND FISHERIES
12.1 Introduction
Agriculture remains the priority sector in achieving sustainable economic growth and reducing
poverty in Zambia. This is because the country has immense natural resources such as land,
water and fertile soils to support agricultural activities. In addition, over 80 percent of the rural
population depends on agriculture-related activities for their livelihood. The growth of this sector
is, therefore, important for the attainment of the long-term vision for Zambia which is to become
“a prosperous middle income nation by 2030”.
Low investment in the sector and low production and productivity especially among small-holder
farmers12
are some of the serious challenges currently affecting the agricultural sector. Climate
Change is exacerbating this challenge due to its threats which include droughts, water logging,
seasonal floods, increased temperatures, shortening of the rain season (crop growing period) and
long dry spells coupled with poor rainfall distribution.
The constraints to growth of the sector include among others: inadequate extension services, high
cost of financing, inadequate infrastructure, livestock diseases, over fishing and poor functioning
agricultural markets. In addition the competitiveness of the sector has been adversely affected by
poor road network, inadequate storage and limited access to electricity.
During the SNDP period, the agricultural sector will continue to be a strategic area of focus in
promoting economic growth, reducing poverty and creating employment. In order to achieve
this, the focus will be on enhancing investment for sustainable agricultural production and
productivity of crops, livestock and fisheries as was the case during the FNDP period.
Appropriate adaptation measures will also be developed and implemented to minimize the
adverse impacts of climate change. Special attention will be given to women as this group is
more vulnerable to Climate change due to its poor resource base and being the majority of the
rural agricultural households.
Efforts will be made to promote regional trade in agricultural products taking into account the
country‟s comparative advantage.
12.2 Review of Past Performance The agriculture sector over the FNDP period achieved a number of successes in the provinces.
Under Livestock, the livestock disease incidence reduced from 43.1 percent in 2007 to 2.8
percent in 2009. Cattle population also increased from 2,799,965 in 2006 to an estimated
3,038,000 herds in 2009. During the period under review, fish production under capture fisheries
increased from 65,927 Mt in 2005 to 84,716 Mt in 2009. An increase by 50.8 percent in fish
production under aquaculture was also recorded to 8,127 Mt in 2009. Other successes were
12 65 % are women according to the 2006 LCMS
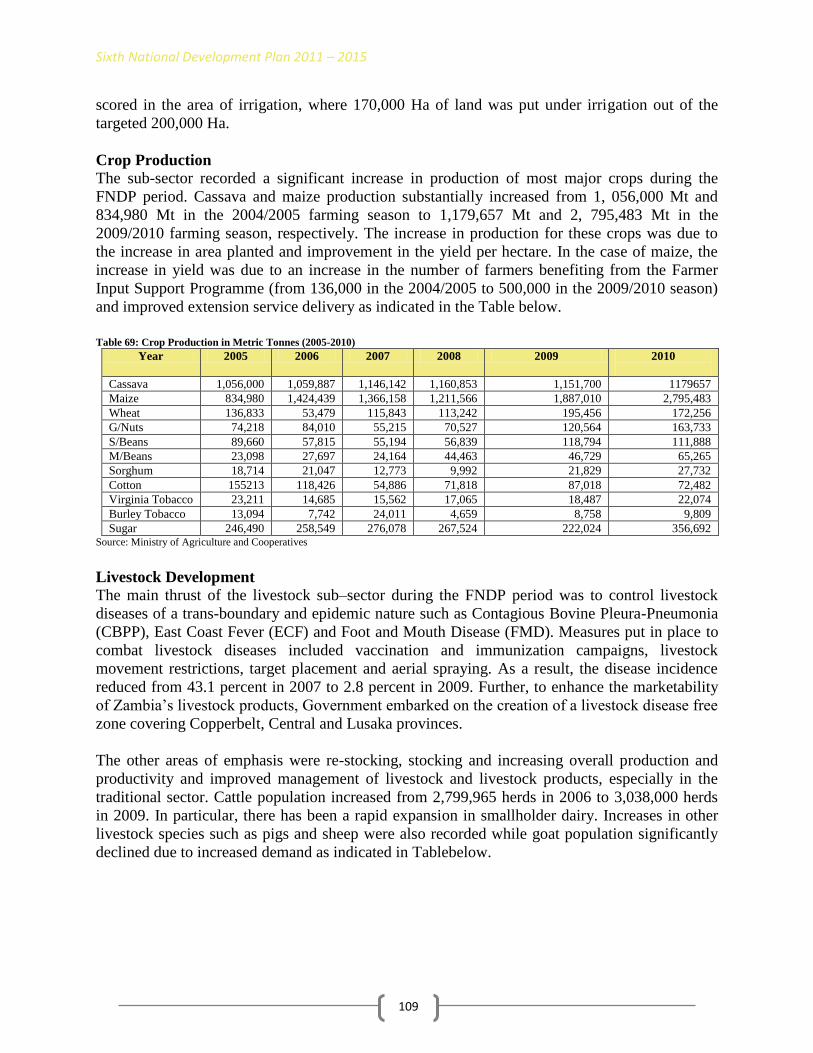
Sixth National Development Plan 2011 – 2015
109
scored in the area of irrigation, where 170,000 Ha of land was put under irrigation out of the
targeted 200,000 Ha.
Crop Production
The sub-sector recorded a significant increase in production of most major crops during the
FNDP period. Cassava and maize production substantially increased from 1, 056,000 Mt and
834,980 Mt in the 2004/2005 farming season to 1,179,657 Mt and 2, 795,483 Mt in the
2009/2010 farming season, respectively. The increase in production for these crops was due to
the increase in area planted and improvement in the yield per hectare. In the case of maize, the
increase in yield was due to an increase in the number of farmers benefiting from the Farmer
Input Support Programme (from 136,000 in the 2004/2005 to 500,000 in the 2009/2010 season)
and improved extension service delivery as indicated in the Table below.
Table 69: Crop Production in Metric Tonnes (2005-2010)
Year 2005 2006 2007 2008 2009 2010
Cassava 1,056,000 1,059,887 1,146,142 1,160,853 1,151,700 1179657
Maize 834,980 1,424,439 1,366,158 1,211,566 1,887,010 2,795,483
Wheat 136,833 53,479 115,843 113,242 195,456 172,256
G/Nuts 74,218 84,010 55,215 70,527 120,564 163,733
S/Beans 89,660 57,815 55,194 56,839 118,794 111,888
M/Beans 23,098 27,697 24,164 44,463 46,729 65,265
Sorghum 18,714 21,047 12,773 9,992 21,829 27,732
Cotton 155213 118,426 54,886 71,818 87,018 72,482
Virginia Tobacco 23,211 14,685 15,562 17,065 18,487 22,074
Burley Tobacco 13,094 7,742 24,011 4,659 8,758 9,809
Sugar 246,490 258,549 276,078 267,524 222,024 356,692 Source: Ministry of Agriculture and Cooperatives
Livestock Development
The main thrust of the livestock sub–sector during the FNDP period was to control livestock
diseases of a trans-boundary and epidemic nature such as Contagious Bovine Pleura-Pneumonia
(CBPP), East Coast Fever (ECF) and Foot and Mouth Disease (FMD). Measures put in place to
combat livestock diseases included vaccination and immunization campaigns, livestock
movement restrictions, target placement and aerial spraying. As a result, the disease incidence
reduced from 43.1 percent in 2007 to 2.8 percent in 2009. Further, to enhance the marketability
of Zambia‟s livestock products, Government embarked on the creation of a livestock disease free
zone covering Copperbelt, Central and Lusaka provinces.
The other areas of emphasis were re-stocking, stocking and increasing overall production and
productivity and improved management of livestock and livestock products, especially in the
traditional sector. Cattle population increased from 2,799,965 herds in 2006 to 3,038,000 herds
in 2009. In particular, there has been a rapid expansion in smallholder dairy. Increases in other
livestock species such as pigs and sheep were also recorded while goat population significantly
declined due to increased demand as indicated in Tablebelow.

Sixth National Development Plan 2011 – 2015
110
Table 70: Livestock Production (2006-2009)
Year 2006 2007 2008 2009
Cattle 2,799,965 2,457,563 2,315,327 3,038,000
Sheep 117,930 101,191 485,033 466,506
Goats 1,762,461 956,304 746,143 758,501
Pigs 398,637 538,393 704,832 711,707 Source: Ministry of Agriculture and Cooperatives
Fisheries Development
The sub-sector showed remarkable growth during the FNDP period. Fish production under
capture fisheries increased from 65,927 Mt in 2005 to 84,716 Mt in 2009. Kapenta production
increased by 25.7 percent over the same period from 6,251 Mt in 2005 to 8,554 Mt in 2009. An
increase in fish production under aquaculture was also recorded from 5,125 Mt in 2005 to 8,127
Mt in 2009. Currently, the fisheries sub-sector‟s contribution to the GDP is only about 3.2
percent due to the grossly under-developed aquaculture component as indicated in the Table
below.
Table 71: Fish Production in Metric Tonnes (2005-2009)
Year 2005 2006 2007 2008 2009
Capture Fisheries 65,927 60,236 73,542 79,403 84,716
Kapenta 6,251 7,659 9,476 7,860 8,554
Aquaculture 5,125 5,210 5,876 5,640 8,127
Total 77,303 73,105 88,894 92,903 101,397 Source: Ministry of Agriculture and Cooperatives
12.3 Vision, Goal and Strategic Focus
Vision
“An efficient, competitive, sustainable and export led agriculture sector that assures food security
and increased income by 2030”.
Goal
To increase and diversify agriculture production and productivity so as to raise the share of its
contribution to 20 percent of GDP.
Strategic Focus
The strategic focus under crop production sub-sector will be to develop irrigation and farm
blocks, enhance research and extension services and promote utilization of improved seed
varieties. Under livestock sub-sector, the focus will be to increase livestock numbers through the
creation of a Disease Free Zone (DFZ), infrastructure development and rehabilitation, enhance
livestock disease control, surveillance and research, developing livestock standards and grades,
and processing of livestock and livestock products. For fisheries sub-sector, the strategic focus
will be aquaculture development and improvement of infrastructure for fisheries research and
marketing. In addition, emphasis will be on promoting of post-harvest technologies, agro-
processing and access to domestic, regional and international markets for agro-products.

Sixth National Development Plan 2011 – 2015
111
12.4 Policies and Key Reforms
The thrust of the reforms in the sector will continue to be the creation of a conducive
environment to promote private sector led agricultural development. Given the fact that poverty
is most prevalent in rural areas and that majority of the rural households are involved in
agricultural-based activities, investments particularly in agriculture infrastructure and agro-
related industries will offer an effective means to make a significant impact on the country‟s
rural development and overall poverty levels. Efforts will be made to improve productivity in the
sector focusing on the development of human capacity through training, research and extension
services.
Key policy developments will include the review and revision of the National Agriculture Policy
to align it to changes in the sector and the development of the livestock and fisheries policies.
The following policy statements which are within the overall policy framework will guide the
development of the agricultural sector during the SNDP period:
(i) Government will develop and implement policies and programmes that support crop
diversification, livestock and fisheries production, increased productivity in crops and
livestock, sustainable land and water management, including forestry, agro-forestry,
climate change adaptation and mitigation and other environmentally friendly agricultural
systems;
(ii) Government will facilitate equitable access to land for agricultural purposes;
(iii)Government and the private sector will implement and adhere to predictable, rule-based
market and trade policies and strengthen public-private coordination and dialogue;
(iv) Government in consultation with stakeholders will identify investment priorities in
infrastructure development that support the sector;
(v) The sector will also collaborate with relevant stakeholders to speed up the
implementation of the National Decentralization Policy in order to facilitate improved
service delivery;
(vi) Government will facilitate private sector to scale-up investments in production, input and
output markets, processing and value addition in crops, livestock and fisheries;
(vii) Government in conjunction with private sector will promote diversified extension
messages for all categories of farmers (crops, livestock and fisheries) with emphasis on
the small-scale farmers;
(viii) Government in collaboration with private sector and Cooperating Partners will
mobilize resources in order to develop cost effective, demand-driven research and
extension linkages focusing on Public Private Partnerships; and
(ix) Government in collaboration with private sector and Cooperating Partners will promote
and strengthen cooperatives and other farmer organizations as a vehicle for agricultural
development.
In addition, Government will develop an Agricultural Marketing Act that will regulate market
players in agricultural marketing. The Agricultural Credit Act will be revised to provide for use
of warehousing receipt system as collateral in obtaining loans.

Sixth National Development Plan 2011 – 2015
112
In order to guide and regulate the livestock sub-sector, Government will review a number of
existing legislations in the livestock industry so as to align them to the current social and
economic environment. The Acts which will be developed will cover: Animal Health, Livestock
Development, Dairy Development, Animal Identification and Traceability and Veterinary and
Para-veterinary Professional. These legislations will guide the sector on the control and
prevention of livestock diseases as well as regulate dairy and livestock production.
The reforms under the Farmer Input Support Programme will continue during the SNDP period.
The sector will formulate detailed bankable investment plans for programmes in the SNDP and
in line with Zambia Comprehensive Africa Agriculture Development Programme framework.
The sector will also ensure that all policies, programmes, projects and activities are engendered
during the SNDP period.
12.5 Objectives, Strategies and Programmes
The table below show the objectives, strategies and programmes for the Agriculture, Livestock
and Fisheries Sector during the SNDP period.
Crops Sub-Sector
During the SNDP period, overall crop production increase will come from expansion of areas
under cultivation and irrigation as well as increased productivity through the use of improved
seed varieties and linkages between research and extension services. In addition, with regard to
climate change adaptation and mitigation, Government will continue to promote increased use of
sustainable farming practices that include conservation farming, agro-forestry and control of crop
diseases.
In order to realize the crop sub-sector goal, the programmes in Table below will guide the sub-
sector during the SNDP period. Table 72: Objectives, Strategies and Programmes - Crops
No. Objectives Strategies Programmes
1 To diversify and attain
national and household
food security
a) Promote high yielding seed materials;
b) Promote soil improvement practices;
c) Improve farm management practices;
d) Enhance control of crop pests and diseases;
e) Promote and strengthen community participation
in improving productivity through cooperatives
and farmer organizations;
f) Promote agricultural mechanization (through
appropriate technology);
g) Support the generation and dissemination of early
warning data and agricultural statistics;
h) Promote crop diversification;
i) Support farm block development;
j) Promote and strengthen equal participation of
male and female farmers in improving production
throughout-grower schemes;
k) Promote equitable and reliable access to
agricultural land;
l) Establish mechanisms for regular stakeholder
consultations in research and extension;
m) Promote PPPs in research, infrastructure
Crop Production and Productivity
Improvement Programme:
Extension Services
Enhancement Sub-
programme
Farm Block Development
Sub-programme
Seed Development Sub-
programme
Research Development Sub-
programme
Gender welfare sub-
programme

Sixth National Development Plan 2011 – 2015
113
No. Objectives Strategies Programmes
development and programmes;
n) Promote participation of farming communities in
the uptake of proven agricultural practices such as
conservation farming through enhanced extension
services; and
o) Enhance the capacity of DRM in the sector.
2 To promote soil
management for
sustainable agricultural
production and growth
a) Mainstream climate change adaptation and
develop mitigation action plan and measures
including vulnerability assessment and risk
management;
b) Promote appropriate conservation farming
methods;
c) Promote and strengthen participatory land use
planning and management;
d) Promote sustainable utilization of wetlands and
dambos;
e) Promote efficient water utilization for sustainable
agricultural growth;
f) Promote water harvesting technologies such as
dams and weirs; and
g) Upgrade skills of technical and professional staff
in research and extension services training.
Sustainable Land and Water
Management Programme:
Irrigation Development Sub-
programme
Conservation Agriculture
and Agro-forestry promotion
Sub-programme
Agriculture Land
Information System Sub-
programme
3 To promote the
development of
competitive, efficient and
transparent public and
private sector driven
marketing system for
agricultural commodities
and inputs
a) Strengthen the collection, analysis, dissemination
and use of agricultural marketing information
systems;
b) Promote private sector participation in agriculture
marketing;
c) Promote structured markets and transparency in
the pricing system;
d) Facilitate the development of market
infrastructure such as feeder roads, storage and
market facilities;
e) Promote improved agricultural commodity
processing, marketing, distribution and storage;
f) Promote PPPs in agricultural marketing
infrastructure development; and
g) Facilitate access to credit particularly for small
and medium-scale farmers.
Agricultural Marketing
Development and Investment
Promotion
Livestock and Fisheries Sub-Sectors
During the SNDP period, the main thrust of the livestock sub–sector will be to increase livestock
production through prevention and control of livestock diseases, improving production and
productivity of the various livestock species and promotion of the Public Private Partnerships in
value addition and processing of livestock products as well as in the provision of effective
service delivery and marketing of livestock products. In the fisheries sub-sector, emphasis will

Sixth National Development Plan 2011 – 2015
114
be on capture fisheries, aquaculture development, fisheries marketing development and
investment promotion as well as research.
The programmes to be implemented in the livestock and fisheries sub-sectors during the SNDP
period are indicated in the Table below. Table 73: Objectives, Strategies and Programmes - Livestock and Fisheries
No. Objectives Strategies Programmes
1 To increase
quality
livestock
numbers
a) Enhance supply of breeding stock to farmers for
increased small ruminants, pigs, poultry and cattle;
b) Promote transfer of technology in artificial
insemination and embryo transfer;
c) Develop and rehabilitate livestock infrastructure; and
d) Conduct national livestock census.
Livestock production and productivity
improvement Programme:
Livestock Production Sub-
programme
a) Promote animal primary health care;
b) Enhance the emergency disease control fund; and
c) Control Trans-boundary Animal Diseases (TADs) such
as CBPP and FMD.
Livestock Disease Control
and Surveillance Sub-
programme
a) Facilitate vector control in collaboration with the
private sector
b) Establish livestock genetic research centre for various
livestock species
c) Develop efficient and sustainable diagnostic techniques
in livestock disease
d) Develop effective and efficient disease control
strategies
e) Develop capacity for local vaccine production and
quality control
f) Conserve and develop livestock breeds.
Livestock Research Sub-
programme
a) Mainstream climate change adaptation and mitigation
measures;
b) Promote smallholder pasture irrigation schemes;
c) Promote appropriate grazing practices;
d) Promote in-situ rain water harvesting;
e) Promote sustainable utilization of land and water
resources for Livestock; and
f) Develop mitigation action, vulnerability assessment
and risk management plans.
Pasture Improvement and
Grazing management sub-
programme
2 To expand
both domestic
and
international
market access
a) Establish Disease Free Zones (DFZ);
b) Facilitate development of market Infrastructure;
c) Develop livestock identity and traceability system;
d) Develop commodity standards; and
e) Promote PPPs in livestock marketing.
Livestock standards and Marketing
Development Programme
3 To promote
fish trade and
marketing
a) Promote improved fish processing, marketing,
distribution and storage; and
b) Promote value addition to fish and fisheries products.
Fisheries Marketing Development and
Investment Promotion Programme
4 To promote
sustainable
exploitation of
fisheries
resources and
increased fish
production
a) Support to community-based fingerling production
centres.
b) Support to sustainable aquaculture development in high
potential zones;
c) Facilitate improved extension services and networking;
d) Facilitate improved knowledge and skills in aqua-
businesses;
e) Facilitate the implementation of the Aquaculture
Development Plan;
f) Enhance management of aquaculture statistics; and
g) Develop a Vulnerability Assessment and Risk
Management Plan.
Fisheries Development Programme:
Aquaculture Development
Sub- programme
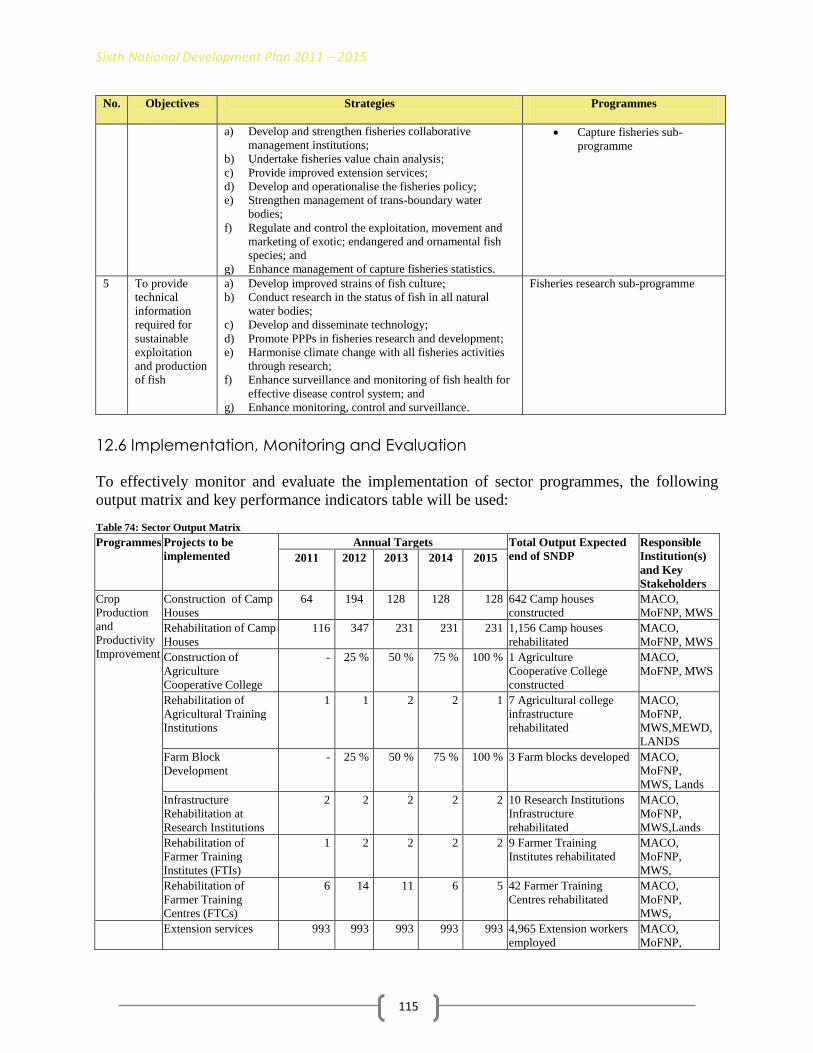
Sixth National Development Plan 2011 – 2015
115
No. Objectives Strategies Programmes
a) Develop and strengthen fisheries collaborative
management institutions;
b) Undertake fisheries value chain analysis;
c) Provide improved extension services;
d) Develop and operationalise the fisheries policy;
e) Strengthen management of trans-boundary water
bodies;
f) Regulate and control the exploitation, movement and
marketing of exotic; endangered and ornamental fish
species; and
g) Enhance management of capture fisheries statistics.
Capture fisheries sub-
programme
5 To provide
technical
information
required for
sustainable
exploitation
and production
of fish
a) Develop improved strains of fish culture;
b) Conduct research in the status of fish in all natural
water bodies;
c) Develop and disseminate technology;
d) Promote PPPs in fisheries research and development;
e) Harmonise climate change with all fisheries activities
through research;
f) Enhance surveillance and monitoring of fish health for
effective disease control system; and
g) Enhance monitoring, control and surveillance.
Fisheries research sub-programme
12.6 Implementation, Monitoring and Evaluation
To effectively monitor and evaluate the implementation of sector programmes, the following
output matrix and key performance indicators table will be used: Table 74: Sector Output Matrix
Programmes
Projects to be
implemented
Annual Targets Total Output Expected
end of SNDP
Responsible
Institution(s)
and Key
Stakeholders
2011 2012 2013 2014 2015
Crop
Production
and
Productivity
Improvement
Construction of Camp
Houses
64 194 128 128 128 642 Camp houses
constructed
MACO,
MoFNP, MWS
Rehabilitation of Camp
Houses
116 347 231 231 231 1,156 Camp houses
rehabilitated
MACO,
MoFNP, MWS
Construction of
Agriculture
Cooperative College
- 25 % 50 % 75 % 100 % 1 Agriculture
Cooperative College
constructed
MACO,
MoFNP, MWS
Rehabilitation of
Agricultural Training
Institutions
1 1 2 2 1 7 Agricultural college
infrastructure
rehabilitated
MACO,
MoFNP,
MWS,MEWD,
LANDS
Farm Block
Development
- 25 % 50 % 75 % 100 % 3 Farm blocks developed MACO,
MoFNP,
MWS, Lands
Infrastructure
Rehabilitation at
Research Institutions
2 2 2 2 2 10 Research Institutions
Infrastructure
rehabilitated
MACO,
MoFNP,
MWS,Lands
Rehabilitation of
Farmer Training
Institutes (FTIs)
1 2 2 2 2 9 Farmer Training
Institutes rehabilitated
MACO,
MoFNP,
MWS,
Rehabilitation of
Farmer Training
Centres (FTCs)
6 14 11 6 5 42 Farmer Training
Centres rehabilitated
MACO,
MoFNP,
MWS,
Extension services 993 993 993 993 993 4,965 Extension workers
employed
MACO,
MoFNP,

Sixth National Development Plan 2011 – 2015
116
Programmes
Projects to be
implemented
Annual Targets Total Output Expected
end of SNDP
Responsible
Institution(s)
and Key
Stakeholders
2011 2012 2013 2014 2015
PSMD
Mobility 75 90 100 150 200 615 Motor Cycles
purchased
MACO,
MoFNP, MWS
Sustainable
Land and
Water
Management
(Adaptation
to Climate
Change)
Vulnerability
Assessment and
Mitigation Plans
completed
9 18 27 18 0 72 Vulnerability
Assessment and
Mitigation Plans
MACO,
MLFD,
MoFNP‟
MTENR,
DMMU
Capacity for climate
resilience for
agriculture decision
making
10 10 10 10 10 50 Awareness creation
and training workshops
on climate resilience for
agriculture decision
makers conducted
MACO,
MoFNP,
MTENR,
ZMD,
DMMU
Enhancement of
women adaptive
capacity through
livelihood
diversification and
credit facilities
50,000 75,000 175,000 100,000 100,000 500,000 Women capacity
built in livelihood
diversification and
accessing credit facilities
MACO,
MoFNP,
MTENR,
ZMD,
DMMU
Involvement of women
in REDD+ activities.
10,000 50,000 50000 50,000 40,000 200,000 Women
participating in REDD+
activities
MACO,
MoFNP,
MTENR,
MCDSS
Weather related
insurance
20,000 25,000 75,000 100,000 125,000 345,000 HHs supported
in weather related
insurance
MACO,
MoFNP,
MTENR
Construction of Dams Feasibility
Studies
8 9 9 4 30 Dams constructed
MACO,
MoFNP
Construction of Weirs Feasibility
Studies
10 10 10 0 30 Weirs constructed
MACO,
MoFNP
Construction Irrigation
Schemes
Feasibility
Studies
10 10 10 - 30 Irrigation Schemes
constructed
MACO,
MoFNP
Construction of Bulk
Water Transfer
Schemes
Feasibility
Studies
25 % 50 % 75 % 100 % 3 Bulk Water Transfer
Schemes constructed
MACO,
MoFNP,
MEWD
Agricultural Lands
Information Centres
Feasibility
Studies
3 3 3 - 9 Agricultural Lands
Information Centres built
MACO,
MoFNP,
MWS,LANDS,
Food and
Nutrition
Security
Storage sheds
Construction
4 10 10 10 10 44 Storage Sheds of total
capacity 136,750 Mt
constructed
MACO,
MoFNP,
MWS,
Silos Construction
Feasibility
Studies
3 - 4 - 7 Silos of 50,000 Mt
constructed
MACO,
MoFNP, MWS
Silo Rehabilitation 2 3 - - - 5 Silos of 97,500 Mt
capacity rehabilitated
MACO,
MoFNP,
MWS,
Weigh Bridge
Construction
3 10 10 - - 23 Weigh bridges
constructed
MACO,
MoFNP, MWS
Cottage Stock Feed
Processing Plants
1 2 2 2 2 9 Cottage Stock feed
plants constructed, one in
each province
MACO,
MoFNP,
MWS, MCTI
Multi-agro Processing
Plants
1 2 1 1 1 6 Multi-purpose
Processing Plants built
MACO,
MoFNP,
MWS, MCTI

Sixth National Development Plan 2011 – 2015
117
Programmes
Projects to be
implemented
Annual Targets Total Output Expected
end of SNDP
Responsible
Institution(s)
and Key
Stakeholders
2011 2012 2013 2014 2015
Construction of
Livestock Breeding
Centres
4 4 4 - - 12 Livestock breeding
centres established
MLFD,
MoFNP,
MWS,LANDS
Livestock
Production
and
Productivity
Improvement
Livestock Disease Free
Zone
30 % 60 % 75 % 100 % - 1 Livestock disease free
zone established
MLFD,
MoFNP,
MWS,LANDS
Construction of a
Livestock Gene Bank
- 50 % 100 % - - 1 Livestock gene bank
constructed
MLFD,
MoFNP,
MWS,LANDS
Construction of
Livestock Service
Centres
100 150 150 1,000 - 1,400 Livestock Service
Centres constructed (1,023
level one, 304 level two
and 73 level three)
MLFD,
MoFNP,
MWS,LANDS
Construction of Camp
and Block Houses
500 500 230 220 - 1,450 Camp and block
houses constructed
MLFD,
MoFNP,
MWS,LANDS
Construction of Office
Block
50 % 100 % - - - 1 Office block constructed MLFD,
MoFNP,
MWS,LANDS
Construction of
Regional Livestock
Laboratories
2 2 2 - - 6 Regional Laboratory
constructed
MLFD,
MoFNP,
MWS,LANDS
Construction of a
Vector Control Centre
20 % 70 % 100 % - - 1 Vector control centre MLFD,
MoFNP,
MWS,LANDS
Construction of
Livestock Quarantine
Centres
1 2 - - - 3 Livestock quarantine
centres constructed
MLFD,
MoFNP,
MWS,LANDS
Rehabilitation of a
Livestock Quarantine
Centre
1 - - - - 1 Livestock Quarantine
Centre rehabilitated
MLFD,
MoFNP,
MWS,LANDS
Construction of
Livestock Check Points
7 5 5 5 - 22 livestock check points
constructed
MLFD,
MoFNP,
MWS,LANDS
Construction of a
Livestock Vaccine
Development Centre
20 % 50 % 100 % - - 1 Livestock vaccine
development centre
constructed
MLFD,
MoFNP,
MWS,LANDS
Rehabilitation of
Livestock Research
Centres
2 4 4 - - 10 Livestock research
centres rehabilitated
MLFD,
MoFNP,
MWS,LANDS
Rehabilitation of Camp
Houses
300 300 200 200 - 1,000 Camp houses for
extension workers
rehabilitated in Livestock
active district
MLFD,
MoFNP,
MWS,LANDS
Construction of the
National Artificial
Insemination Centre
HQ.
- 50 % 75 % 100 % - 1 National Artificial
Insemination centre
constructed
MLFD,
MoFNP,
MWS,LANDS
Rehabilitation of
Infrastructure at
Training Institutions
1 2 - - - 3 Training institutions
rehabilitated
MLFD, MoFNP
Extension Services 1,400 300 311 300 300 2,611 Extension workers
recruited
MLFD,
MoFNP, PSMD
Mobility 1,300 150 150 200 200 2,000 Motor bikes
purchased
MLFD,
MoFNP, MWS

Sixth National Development Plan 2011 – 2015
118
Programmes
Projects to be
implemented
Annual Targets Total Output Expected
end of SNDP
Responsible
Institution(s)
and Key
Stakeholders
2011 2012 2013 2014 2015
Construction of fish
seed production centres
2 2 2 2 1 9 fish seed production
centres constructed
MLFD,
MoFNP,
MWS,LANDS
Fisheries
Development
Construction of landing
sites with storage
facilities
3 6 6 - - 15 landing sites
constructed
MLFD,
MoFNP,
MWS,LANDS
Construction of
Fisheries Training
Centres
- 3 4 - - 7 Fisheries Training
centres constructed in
fishery areas
MLFD,
MoFNP,
MWS,LANDS
Construction of Fish
Farm
25 % 25 % 50 % - - 1 Fish farm constructed MLFD,
MoFNP,
MWS,LANDS
Rehabilitation of Fish
Farms
4 3 - - - 7 Fish Farms rehabilitated MLFD,
MoFNP,
Extension of Training
Centre
20 % 50 % 100 % - - Sinazongwe Fisheries
Training Centre Extended
MLFD,
MoFNP, MWS,
Construction of Fish
Disease Laboratories
25 % 25 % 50 % 100 % - 4 Fish Disease
Laboratories constructed
MLFD,
MoFNP,
MWS,LANDS
Rehabilitation of
Extension Structures In
Fishery Areas
20 15 15 3 - 53 Fisheries extension
structures rehabilitated
MLFD,
MoFNP,
MWS,LANDS
Construction of
Extension Structures In
Fishery Areas
4 4 - - - 8 Fisheries extension
structures constructed
MLFD,
MoFNP,
MWS,LANDS,
UNZA
Table 75: Key Performance Indicators
KPI Baseline
(2009)
Annual Targets
2011 2012 2013 2014 2015
Land brought under irrigation 170,000
(Ha)
3,000 3,000 3,500 4,000 4,000
Percentage change in livestock
population for cattle, pigs, goats and
sheep.
Cattle 3,038,000 12% 15% 18% 20% 20%
Pigs 466,506 8% 10% 15% 10% 12%
Goats 758,501 8% 10% 10% 15% 15%
Sheep 711,707 3% 5% 4% 5% 4%
Change in fish production under Aquaculture 8,127 Mt 6 % 20 % 10 % 10 % 10 %
Agriculture Exports as a percentage of non-traditional
exports
41% 44% 46% 48% 52% 55%
Decrease in incidence of Major livestock Disease
Outbreaks, FMD, CBPP, ECF
2.7 % 2 % 1.5 % 1 % 1 % 1 %
Source: Ministry of Agriculture and Cooperatives
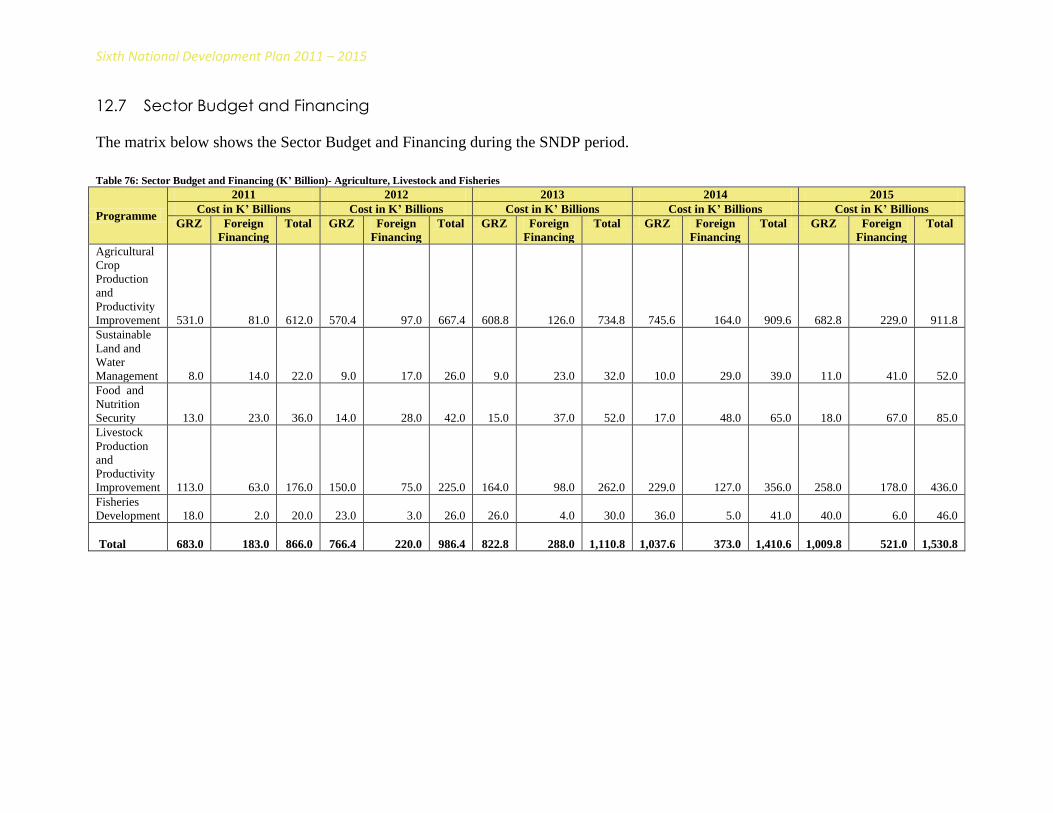
Sixth National Development Plan 2011 – 2015
12.7 Sector Budget and Financing
The matrix below shows the Sector Budget and Financing during the SNDP period.
Table 76: Sector Budget and Financing (K’ Billion)- Agriculture, Livestock and Fisheries
Programme
2011 2012 2013 2014 2015
Cost in K’ Billions Cost in K’ Billions Cost in K’ Billions Cost in K’ Billions Cost in K’ Billions
GRZ Foreign
Financing
Total GRZ Foreign
Financing
Total GRZ Foreign
Financing
Total GRZ Foreign
Financing
Total GRZ Foreign
Financing
Total
Agricultural
Crop
Production
and
Productivity
Improvement
531.0
81.0
612.0
570.4
97.0
667.4
608.8
126.0
734.8
745.6
164.0
909.6
682.8
229.0
911.8
Sustainable
Land and
Water
Management
8.0
14.0
22.0
9.0
17.0
26.0
9.0
23.0
32.0
10.0
29.0
39.0
11.0
41.0
52.0
Food and
Nutrition
Security
13.0
23.0
36.0
14.0
28.0
42.0
15.0
37.0
52.0
17.0
48.0
65.0
18.0
67.0
85.0
Livestock
Production
and
Productivity
Improvement
113.0
63.0
176.0
150.0
75.0
225.0
164.0
98.0
262.0
229.0
127.0
356.0
258.0
178.0
436.0
Fisheries
Development
18.0
2.0
20.0
23.0
3.0
26.0
26.0
4.0
30.0
36.0
5.0
41.0
40.0
6.0
46.0
Total
683.0
183.0
866.0
766.4
220.0
986.4
822.8
288.0
1,110.8
1,037.6
373.0
1,410.6
1,009.8
521.0
1,530.8

Sixth National Development Plan 2011 – 2015
120
13. MINING
13.1 Introduction
The mining sector remains the major contributor to Zambia‟s economic growth with its average
share being 9.1 percent between 2006 and 2009. Further, the sector‟s contribution to foreign
exchange earnings and the country‟s formal employment levels is at 70.3 percent and 8.5 percent
respectively. There is, therefore, high potential for the sector to contribute to poverty reduction
and wealth creation in the country.
To enhance the contribution of the sector to GDP, Government will continue facilitating the
opening of new mines, promote small-scale mining and value addition industry development.
The sector will also focus on developing energy minerals in order to contribute towards the
diversification of power generation sources and provide the much needed energy.
13.2 Review of Past Performance
During the FNDP period, the Mines and Minerals Act of 1995 and the Petroleum (Exploration
and Production) Act of 1985 were repealed and replaced by the Mines and Minerals
Development Act of 2008 and the Petroleum (Exploration and Production) Act of 2008
respectively. Accordingly, the Mines and Minerals Development (Prospecting, Mining, Milling,
Transportation and Storage of Uranium Ores and other Radioactive Minerals) Regulations and
the Mines and Minerals Development (General) Regulations were issued.
The mining sector performed well on account of increased investment. Major investments in the
sector included the commencement of commercial production at Lumwana Mining Limited and
Munali Nickel Mine. In addition, two modern smelters were constructed and commissioned at
Chambeshi by Chambeshi Copper Smelter Limited and at Nchanga by Konkola Copper Mines
Plc. The sector grew at an average rate of 7.3 percent per annum against the target of 10.6
percent per annum.
Copper production increased from 515,010 tonnes in 2006 to 667,173 tonnes in 2009. The
increase in copper production was mainly attributed to the recovery of metal prices on the
international market and the commencement of production at Lumwana Mine. While cobalt
production declined from 4,648 tonnes to 1,411 tonnes during the same period. The reduction in
cobalt production was mainly due to the suspension of production at Luanshya Copper Mines. In
case of gemstones, there was a remarkable increase in emerald production following the
recapitalization of large-scale gemstone mines.
A number of exploration activities were carried out by the private sector and Government and
are likely to develop into mining projects during the SNDP period as indicated in the Table
below.

Sixth National Development Plan 2011 – 2015
121
Table 77: Exploration Projects 2006-2010
Project District/Province Company Mineral Ore Reserve Status
Konkola
North Copper
Project
Chililabombwe Teal (Z) Ltd. Copper 220 Mt @ 2.64%
copper contained
Feasibility Study
and EIA completed
in 2009. Mining
operations expected
to start in 2011
Mkushi
Copper
Project
Mkushi First Quantum
Mining and
Operations
Copper 309 Mt @1.04% copper
contained
Pre-feasibility and
EIA completed in
2009
Mkushi Joint
Venture
Copper
Mkushi Seringa Mining
Ltd.
Copper 10 million tonnes Pre-feasibility and
EIA completed in
2009
Kalumbila
Copper
Mwinilunga Chirundu Joint
Ventures Ltd.
Copper/Uranium Poly-metallic ore
resource of 1.45 billion
tonnes of ore at 0.76%
copper, 0.03% nickel,
0.04% cobalt and some
uranium
Detailed exploration
in progress
Oil and Gas Eastern, Luapula,
Northern, North-
Western,
Southern and
Western
Government Oil and Gas To be determined 23 blocks
demarcated and 11
offered to successful
bidders by 2009
Kariba
Uranium
Siavonga Denison Mine
Ltd.
Uranium 11 million pounds Pre-feasibility and
EIA completed in
2009. Mining
expected to
commence in 2012
Chirundu
Uranium
Siavonga Chirundu Joint
Ventures
Uranium 9.5 million pounds The company was
conducting
Bankable Feasibility
Study and the EIA
completed by 2009 Source: Ministry of Mines and Minerals Development, 2010.
The growth of the sector and its contribution to economic development was constrained by a
number of factors such as: inadequate mineral exploration and resource surveys, weak regulatory
framework, lack of access to affordable finance for small-scale miners coupled with inadequate
technical and managerial skills, poor infrastructure and weak marketing system.
13.3 Vision, Goal and Strategic Focus
Vision
“Well organized private sector led mineral resource exploration and exploitation that contributes
to sustainable social economic development by 2030”
Goal
The Goal is to raise the sector‟s contribution to GDP to at least 20 percent by end-2015.
Strategic Focus
The mining sector will focus on increasing exploration projects, sustainable production and
management of mineral resources and increase productivity so as to maximize economic benefits
from the sector. Furthermore, the sector will focus on increasing value addition, expanding

Sixth National Development Plan 2011 – 2015
122
formal employment levels and its overall contribution to GDP. In addition the sector will focus
on human development to increase efficiency and safety of mining operations.
13.4 Policies and Key Reforms
In order to maximize the socio-economic benefits of the mining sector, the focus of the SNDP
will be to enhance value addition, safety, health and safe-guard the environment through the
review of the Mines and Minerals Resources Development Policy. Further, the sector will
formulate a Petroleum Exploration and Production Policy which will provide guidelines for the
development of upstream petroleum sub-sector.
Climate change is a serious consideration in the mining sector because its impact could lead to
increased costs. The sector is heavily water dependant so increased water scarcity presents a
significant challenge especially in processing operations. Extreme precipitation and flooding, on
the other hand, may expose sink holes, induce and exacerbate acid rock drainage, saturation of
tailing impoundments, overtopping and erosion, with potential negative impacts on water
resources. Therefore, during the SNDP period the sector will promote climate resilience and
mitigation initiatives.
13.5 Objectives, Strategies and Programmes
The Table below shows the objectives, strategies and programmes for the Mining Sector during
the SNDP period. Table 78: Objectives, Strategies and Programmes
No. Objective Strategies Programmes
1 To increase production
and productivity in the
mines
a) Ensure a stable regulatory framework;
b) Facilitate access to capital and equipment;
c) Increase extension services to small-scale miners;
d) Provide incentives to small-scale miners particularly
gemstone miners;
e) Enhance skills training of miners in production, value
addition and marketing;
f) Improve availability of geological and mining
information;
g) Mitigate environmental impact of mining;
h) Develop mining safety and environmental impact
mitigation training; and
i) Enhance the capacity of DRM in the sector.
Development of Mines
2 To promote
sustainable
exploitation and
management of energy
minerals
a) Establish the Hydrocarbon Unit;
b) Formulate relevant policies and legislation for energy
minerals; and
c) Mitigate environmental impact of mining.
Exploitation of Energy
Minerals
3 To include water
variability
considerations
a) Include possible water scarcity considerations in the
designing of mining projects and tailing systems; and
b) Include possible flooding conditions during design of
tailing and effluent discharge systems.
Adaptation to Climate
Change
4 To promote value
addition
a) Facilitate access to capital and equipment;
b) Promote the establishment of value addition industries;
c) Enhance skills training in value addition and marketing;
and
d) Promote the use of finished products from local
minerals.
Value addition

Sixth National Development Plan 2011 – 2015
123
13.6 Implementation, Monitoring and Evaluation
To effectively monitor and evaluate the implementation of sector programmes, the following
output matrix and key performance indicators table will be used: Table 79: Sector Output Matrix
Programm
es
Projects to
be
implemented
Annual targets Total Output
Expected
end of SNDP
Responsible
Institutions(
s) Key
Stakeholder
s
2011 2012 2013 2014 2015
Developme
nt of Mines
Establishment
of a mineral resource
endowment
database
Mineral
database established:
Metallurgic
al laboratory
upgraded to
Internation
al standards
Gemmologic
al laboratory upgraded to
international
standards
Laboratory at
Mines Safety Department
upgraded to
international
standards
Constructio
n and furnishing
of sample
core shade
completed
Mineral
resource database
established
and
evaluation
facilities
upgraded to international
standards
MMMD
MWS
Construction
of sample
core shade commenced:
Geological mapping,
exploration
and mineral resource
surveys
Geological mapping of
4 quarter
degree sheet areas in
Northern and
Luapula Provinces
Geological mapping of
4 quarter
degree sheet areas
in Luapula
and Northern
Provinces
Geological mapping of
4 quarter
degree sheet areas in
Luapula and
Northern Provinces
Geological mapping of 4
quarter degree
sheet areas in Luapula and
Northern
Provinces
Geological mapping of
4 quarter
degree sheet areas
in Luapula
and Northern
Provinces:
Increase mapping
coverage by 6
percent: Industrial
minerals for
use in industries
identified
MMMD
Development
of a national baseline
environmenta
l database for the mining
sector
Baseline
study conducted in
Copperbelt
mining area
Baseline
study conducted
in Luapula
Province
Baseline
study conducted in
North-
Western Province
Baseline study
conducted in Southern
Province
Baseline
study conducted
in Eastern
Province
Environmenta
l baseline database
developed
MMMD
MTENR
Idle
gemstone licensed area
on the
Copperbelt evaluated
Resource
surveys for industrial
minerals
- - - - MMMD
Energy
Minerals Exploitatio
n
Diversificatio
n to energy minerals
Energy
Minerals Policy
formulated
Area with
potential for coal
and coal-
bed methane in
Southern
Province identified
and
demarcated into blocks
Blocks
advertised and
exploration
companies licensed
Area with
potential for coal and coal-
bed methane
in Eastern Province
identified and
demarcated into blocks
Blocks
advertised and
exploration
companies licensed
Increase in
exploration for coal and
coal-bed
methane.
MMMD
Hydrocarbon
Unit established
Strategic
Environmental
Assessment
for petroleum
conducted
Environmental
Regulations
for Petroleum
developed

Sixth National Development Plan 2011 – 2015
124
Programm
es
Projects to
be
implemented
Annual targets Total Output
Expected
end of SNDP
Responsible
Institutions(
s) Key
Stakeholder
s
Climate
resilience
designs instituted
Development
of climate
change resilient mine
designs
Feasibility
study on the
quantity of water used
in the
mining industry
compared to
the amount collected
from
underground and other
sources
conducted
Future
water
requirements and
sources
based on end of life
mine plans
projected.
Water
recycling
designs implemented
and
monitored.
Water
recycling
designs implemented
and
monitored.
Water
recycling
designs implement
ed and
monitored.
Climate
related water
variation resilience and
mitigation
strategies included in
mine.
MMMD,
ECZ,
MOFNP
Water
recycling
designs implemente
d and
monitored.
Value Addition
Establishment of
Gemmologica
l Institute
- 1 - - - 1 Gemological
Institute
established in Lusaka
MMMD MSTVT
UNZA
CPs
Establishment
of metallurgical
processing
facilities for copper and
ferromangane
se
Prospecting
and ore reserve
definition of
copper conducted in
Mumbwa
District
Prospecting
and ore reserve
definition
conducted in Luapula
Province
Feasibility
study completed
Ferromangane
se and copper processing
plants
construction commenced
Constructio
n of processing
plants
completed
Processing
plants for copper and
ferromangane
se Established
for small-
scale miners in Mumbwa
and Mansa
MMMD
CPs
Table 80: Key Performance Indicators
Key Performance Indicators Baseline
2009
Annual Targets
Name Definition 2011 2012 2013 2014 2015
Employment
generated
Total number of persons
employed in the sector in
each year
46,706 50,656 52,300 60,890 62,500 70,000
Proportion of mining
companies complying
with statutory safety,
health and
environmental
regulations (%)
Percentage of mining
companies complying with
environmental regulations
65 72 80 85 90 90
Levels of copper
production
Volume of output from
copper mining
661,178 758,735 806,025 863,838 940,403 994,463
Mines in production:-
a) Small-scale
Number of mining license
holders in production (Small-
scale, Large-scale )
100
100
120
120
130
150
b) Large-scale 11 11 12 14 16 16
Number of mineral
processing facilities
Number of facilities to
process mineral ores (e.g.
refineries, smelters)
22 22 22 23 24 25

Sixth National Development Plan 2011 – 2015
13.7 Sector Budget and Financing
The matrix below shows the Sector Budget and Financing during the SNDP period. Table 81: Sector Budget and Financing (K’ Billion) - Mining
Programmes
2011 2012 2013 2014 2015
Cost in K’ Billions Cost in K’ Billions Cost in K’ Billions Cost in K’ Billions Cost in K’ Billions
GRZ Foreign
Financing
Total GRZ Foreign
Financing
Total GRZ Foreign
Financing
Total GRZ Foreign
Financing
Total GRZ Foreign
Financing
Total
Development of
Mines
5.8
2.1
7.9
8.3
1.1
9.4
6.6
-
6.6
9.1
-
9.1
9.1
5.4
14.5
Development of
Energy Minerals
0.7
-
0.7
4.0
-
4.0
5.0
-
5.0
3.0
-
3.0
3.0
-
3.0
Value Addition
0.7
2.2
2.9
2.0
-
2.0
3.0
-
3.0
3.0
-
3.0
3.0
-
3.0
Total
7.2
4.3
11.5
14.3
1.1
15.4
14.6
-
14.6
15.1
-
15.1
15.1
5.4
20.5

Sixth National Development Plan 2011 – 2015
126
14. TOURISM
14.1 Introduction
Tourism including Arts and Culture is one of the priority sectors for development in Zambia and
has the potential to be a major contributor to socio-economic development of the country.
Notable improvements were recorded during the FNDP period in terms of tourism development
as seen in an increasing trend in tourist arrivals and private investment in the sector. However,
the performance still remained far below potential because of the challenges of poor and
inadequate infrastructure, limited investment, fragmented operations, policy and legal
framework, inadequate marketing and limited skilled manpower.
During the SNDP, the sector will focus on infrastructure development in three priority areas
namely Greater Livingstone area, Kafue National Park and Northern circuit. The other focus
areas will be tourism promotion and marketing, product development, and human skills
development. Further, Arts and Culture will focus on the provision of requisite infrastructure and
skills for the promotion of creative industries for socio-economic development and preservation
of Zambia‟s cultural heritage.
14.2 Review of Past Performance
During the FNDP period, the performance of the tourism sector was generally above average.
The contribution to GDP was constant at 3.1 percent over the plan period. There was notable
increase in international tourist arrivals from a target of 736,450 to an average of 793,999 over
the period. There was also notable increase in accommodation for the hospitality industry from
500 establishmentsin 2005 to 940 in 2009 and from 10, 900 bed spaces in 2005 to 19, 000 in
2009.
Average direct tourism earnings increased from US$174.0 million in 2005 to US$200.0 million
in 2009 compared to the FNDP target value of US$304.0 million by 2010. In terms of
employment levels, the sector employed 25, 860 in 2009 from 19, 650 in 2005 against the FNDP
target of 30, 404.
With regards to arts and culture, a total of 142 arts and cultural cooperatives and networks were
established against the target of 77, with a number of hotels, lodges and museums in order to
create markets for exhibiting visual arts and cultural products. Further, the sub-sector facilitated
training for 1,500 cultural practitioners in entrepreneurship and facilitated a number of cultural
research projects. Other notable achievements included UNESCO awarding Zambia two
Diplomas in recognition of GuleWaMkulu and the Makishi masquerades practices for the Chewa
and Luvale peoples, respectively.
Despite these improvements, the sector still continued facing challenges of poor physical
infrastructure particularly roads, railways, airports and airstrips, telecommunications and
accommodation facilities. Other challenges include inadequate quality training facilities and
skilled manpower.

Sixth National Development Plan 2011 – 2015
127
14.3 Vision, Goal and Strategic Focus
Vision
“Zambia as a major tourism destination of choice with unique features, and a thriving national
cultural heritage and creative industries which contribute to sustainable economic growth and
poverty reduction by 2030”.
Goal
To increase tourism direct earnings from US$200 million in 2009 to US$ 449 million and to
provide an enabling environment for safeguarding and promoting Zambia‟s cultural heritage and
to ensure the development of economically viable creative industries.
Strategic focus: The focus of the sector during the SNDP period will be infrastructure and skills development,
tourism and creative industries promotion and marketing.
Emphasis will be in the following areas:
Greater Livingstone Development
The ultimate goal is to develop the area into a world class tourism resort through accelerated
public and private sector investment so that it has all the necessary amenities such as tourist
accommodation, casinos, housing units, shopping facilities, roads, airports and airport
infrastructure, water, Information and Communication Technology (ICT) and electricity.
Kafue National Park
Government will continue to provide resources for the infrastructural development of Kafue
National Park and package it as a business centre in order to attract private sector investment into
the area.
Northern Circuit
In the coming years, Government will continue to accelerate public and private sector investment
through necessary public infrastructure development, construction, rehabilitation and upgrading
of access roads, water systems, airports and airstrips, electricity and ICT.
14.4 Policies and Key Reforms
During the SNDP period, the sector will continue to review the policies and legal frameworks in
order to align them to new developments and, therefore, continue to provide an enabling
environment for accelerated private sector investment and development. In addition, efforts will
be made to encourage ethno-tourism and private sector participation in eco-tourism in rural areas
so as to promote employment and reduce poverty.
In line with the objectives of accelerating development through private sector investment, the
Government will continue its regulatory reform programme so as to streamline and simplify the
business licensing framework as well as to strengthen enforcement. The amendments to the
Tourism and Hospitality Act of 2007 will be operationalized as will the Zambia Tourism Board
Act of 2007, and the Environmental Protection and Pollution Control Act of 1990. The National

Sixth National Development Plan 2011 – 2015
128
Museums Act of 1966, the Zambia Wildlife Act of 1998 and the National Heritage Conservation
Commission Act of 1989 will be reviewed. In addition, the Tourism and Wildlife and National
Parks Policies will be reviewed, while the National Heritage Policy will be developed.
Further, a comprehensive policy framework on arts and culture will be put in place while the
existing National Cultural Policy of 2002 will be reviewed to bring together various aspects of
arts and culture. These include copyright and intellectual property rights, film and
cinematography, the folk culture and creative industries in order to support a holistic strategy for
the development of the sector.
Climate is a principal resource for tourism, as it co-determines the suitability of locations for a
wide range of tourist activities. As the tourism sector is closely connected to the environment and
climate itself, it is a highly climate-sensitive economic sector. Extreme temperatures and
droughts and floods induce biodiversity loss, habitat degradation and reduce landscape
aesthetics. Since the tourism industry and destinations are evidently sensitive to climate change
and variability, climate change impacts will be important considerations in its development.
14.5 Objectives, Strategies and Programmes
The Table below shows the objectives, strategies and programmes for the Tourism, Arts and
Culture Sector during the SNDP period. Table 82: Objectives, Strategies and programmes
No. Objectives Strategies Programmes
1 To make Zambia a preferred
tourist destination.
a) Develop greater marketing presence in tourist
source market;
b) Enhance the promotion of domestic tourism;
c) Extend market reach through the use of ICTs ;
d) Re-launch the Visit Zambia Campaign; and
e) Encourage private marketing initiatives.
Tourism promotion and
Marketing.
a) Diversify tourism product range beyond being
Wildlife –based to include sport, cultural,
adventure and eco-tourism and Meetings,
Incentives, Conventions and Exhibitions
(MICE);
b) Strengthen regulation and standards for the
tourism industry; and
c) Create tourism market research and statistics
synergies with relevant institutions.
Tourism Product Development and
Research
a) Improve Accessibility to Key Tourist
Destination Areas;
b) Package and promote the establishment of
tourism investment sites in tourism priority
areas;
c) Facilitate public-private partnership in tourism
investment; and
d) Construct and Rehabilitate tourist facilities in
priority areas, HTTI, National Museums and
national heritage sites.
Tourism Infrastructure
Development and Investment.
2 To improve standards in the
tourism sector.
a) Develop institutional and human resource
capacity;
b) Re-skill and up-skill of human resource in
various fields;
Tourism sector capacity building

Sixth National Development Plan 2011 – 2015
129
No. Objectives Strategies Programmes
c) Develop skills for operators and higher level
training in tourism; and
d) Develop and provide adequate learning facilities
at HTTI.
3 To provide infrastructure for
preservation of cultural
heritage and promotion of
creative industries
a) Complete the construction of 7 provincial multi-
purpose cultural villages;
b) Construct a national cultural centre ;
c) Construct, renovate and upgrade theatres,
museums, heritage sites and handicraft centres;
and
d) Promote PPPs in the development of arts and
culture infrastructure.
Arts and Culture Infrastructure
Development
4 To promote creative industries a) Facilitate access to training, and business
development resources and services; and
b) Strengthen quality control mechanisms.
Creative industries
5 To preserve and promote
Zambia‟s cultural heritage
practices and expressions for
posterity
a) Provide support to cultural institutions,
individuals and associations;
b) Recognize and support traditional ceremonies
and other positive cultural practices; and
c) Promote indigenous knowledge systems.
Tangible and Intangible Heritage
6 To integrate climate change
concerns in the development
of the tourism industry
a) Develop response plans for water supply and
flood management in tourist destinations;
b) Sinking of bores and damming of watercourses
to increase volume of available water to animals;
and
c) Construct/improve tracks to act as firebreaks in
parks.
Adaptation to climate change
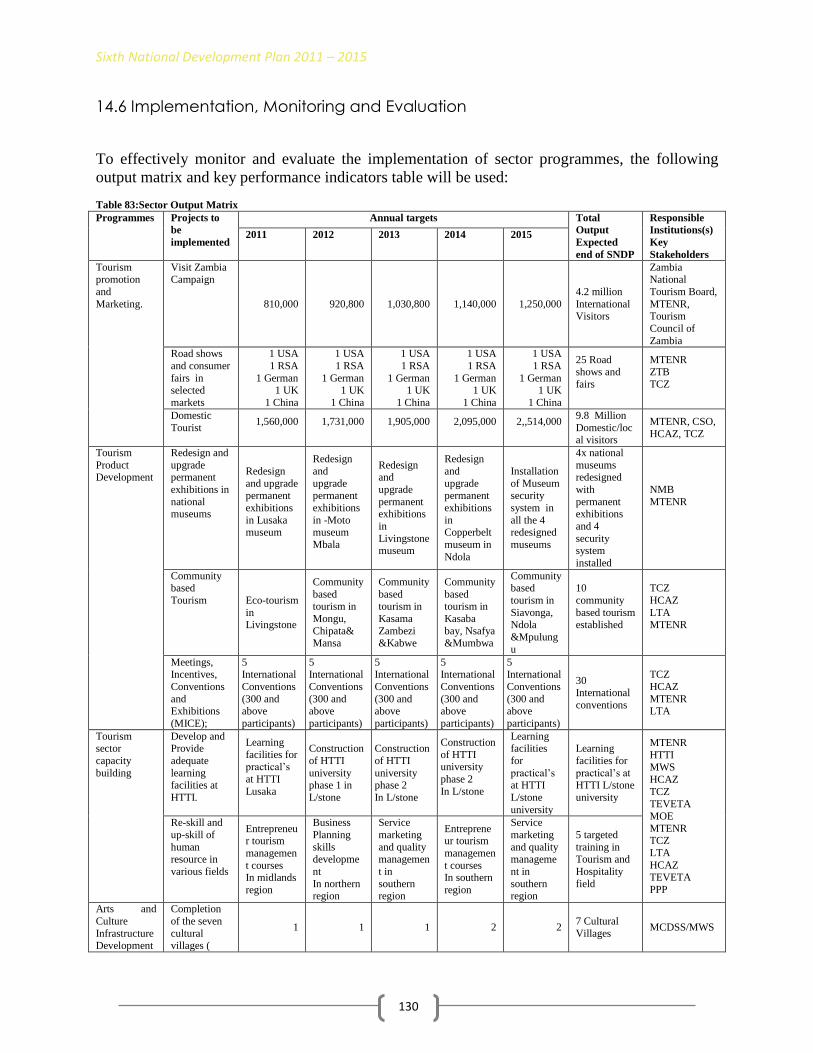
Sixth National Development Plan 2011 – 2015
130
14.6 Implementation, Monitoring and Evaluation
To effectively monitor and evaluate the implementation of sector programmes, the following
output matrix and key performance indicators table will be used: Table 83:Sector Output Matrix
Programmes Projects to
be
implemented
Annual targets Total
Output
Expected
end of SNDP
Responsible
Institutions(s)
Key
Stakeholders
2011 2012 2013 2014 2015
Tourism promotion
and
Marketing.
Visit Zambia Campaign
810,000 920,800 1,030,800 1,140,000 1,250,000
4.2 million
International Visitors
Zambia National
Tourism Board,
MTENR, Tourism
Council of
Zambia
Road shows
and consumer
fairs in selected
markets
1 USA
1 RSA
1 German 1 UK
1 China
1 USA
1 RSA
1 German 1 UK
1 China
1 USA
1 RSA
1 German 1 UK
1 China
1 USA
1 RSA
1 German 1 UK
1 China
1 USA
1 RSA
1 German 1 UK
1 China
25 Road shows and
fairs
MTENR ZTB
TCZ
Domestic
Tourist 1,560,000
1,731,000
1,905,000
2,095,000
2,,514,000
9.8 Million
Domestic/local visitors
MTENR, CSO,
HCAZ, TCZ
Tourism
Product Development
Redesign and
upgrade permanent
exhibitions in
national museums
Redesign
and upgrade permanent
exhibitions
in Lusaka museum
Redesign
and
upgrade permanent
exhibitions
in -Moto museum
Mbala
Redesign and
upgrade
permanent exhibitions
in
Livingstone museum
Redesign
and
upgrade permanent
exhibitions
in Copperbelt
museum in
Ndola
Installation
of Museum security
system in
all the 4 redesigned
museums
4x national
museums redesigned
with
permanent exhibitions
and 4
security system
installed
NMB
MTENR
Community based
Tourism Eco-tourism
in Livingstone
Community
based tourism in
Mongu,
Chipata& Mansa
Community
based tourism in
Kasama
Zambezi &Kabwe
Community
based tourism in
Kasaba
bay, Nsafya &Mumbwa
Community based
tourism in
Siavonga, Ndola
&Mpulung
u
10
community
based tourism established
TCZ
HCAZ
LTA MTENR
Meetings, Incentives,
Conventions
and Exhibitions
(MICE);
5 International
Conventions
(300 and above
participants)
5 International
Conventions
(300 and above
participants)
5 International
Conventions
(300 and above
participants)
5 International
Conventions
(300 and above
participants)
5 International
Conventions
(300 and above
participants)
30 International
conventions
TCZ
HCAZ
MTENR LTA
Tourism sector
capacity
building
Develop and Provide
adequate
learning
facilities at
HTTI.
Learning
facilities for practical‟s
at HTTI
Lusaka
Construction
of HTTI
university
phase 1 in
L/stone
Construction
of HTTI
university
phase 2
In L/stone
Construction
of HTTI university
phase 2
In L/stone
Learning facilities
for
practical‟s
at HTTI
L/stone
university
Learning
facilities for
practical‟s at
HTTI L/stone
university
MTENR
HTTI MWS
HCAZ
TCZ TEVETA
MOE
MTENR TCZ
LTA
HCAZ TEVETA
PPP
Re-skill and
up-skill of
human resource in
various fields
Entrepreneur tourism
managemen
t courses In midlands
region
Business
Planning
skills developme
nt
In northern region
Service
marketing
and quality managemen
t in
southern region
Entrepreneur tourism
managemen
t courses In southern
region
Service
marketing
and quality manageme
nt in
southern region
5 targeted
training in Tourism and
Hospitality
field
Arts and
Culture
Infrastructure Development
Completion
of the seven
cultural villages (
1 1 1 2 2 7 Cultural
Villages MCDSS/MWS

Sixth National Development Plan 2011 – 2015
131
Programmes Projects to
be
implemented
Annual targets Total
Output
Expected
end of SNDP
Responsible
Institutions(s)
Key
Stakeholders
2011 2012 2013 2014 2015
Lusaka,
Solwezi, Ndola,
Kasama,
Kabwe, Mongu&
Mansa)
Creative industries
Access to business
development
resources & services
(Nation-wide)
5,000 7,500 10,000 12,500 15,000
50,000 arts
and cultural
practitioners supported
MCDSS/MCTI
/PS
Table 84: Key Performance Indicators
Key Performance
Indicators
Baseline
2009
Annual Targets
2011 2012 2013 2014 2015
Tourist
arrivalsInternational
709,948 810,000 920,800, 1,030,800 1,140,000 1,250,000
Annual direct tourism
earnings
(US $‟M)
200 216 260 312 374 449
Employment levels 27,412 29,000 31,000 36,000 41,000 45,000
Bed space in the
hospitality industry
19,000 20,140 22,150 23,370 24,806 25,500
Occupancy rates % 60 62 65 68 71 75
Length of stay for tourists
(Days)
7 7 10 10 14 14
Number of Arts and
Cultural practitioners
accessing arts and cultural
infrastructure
500 500 750 1000 1250 1500
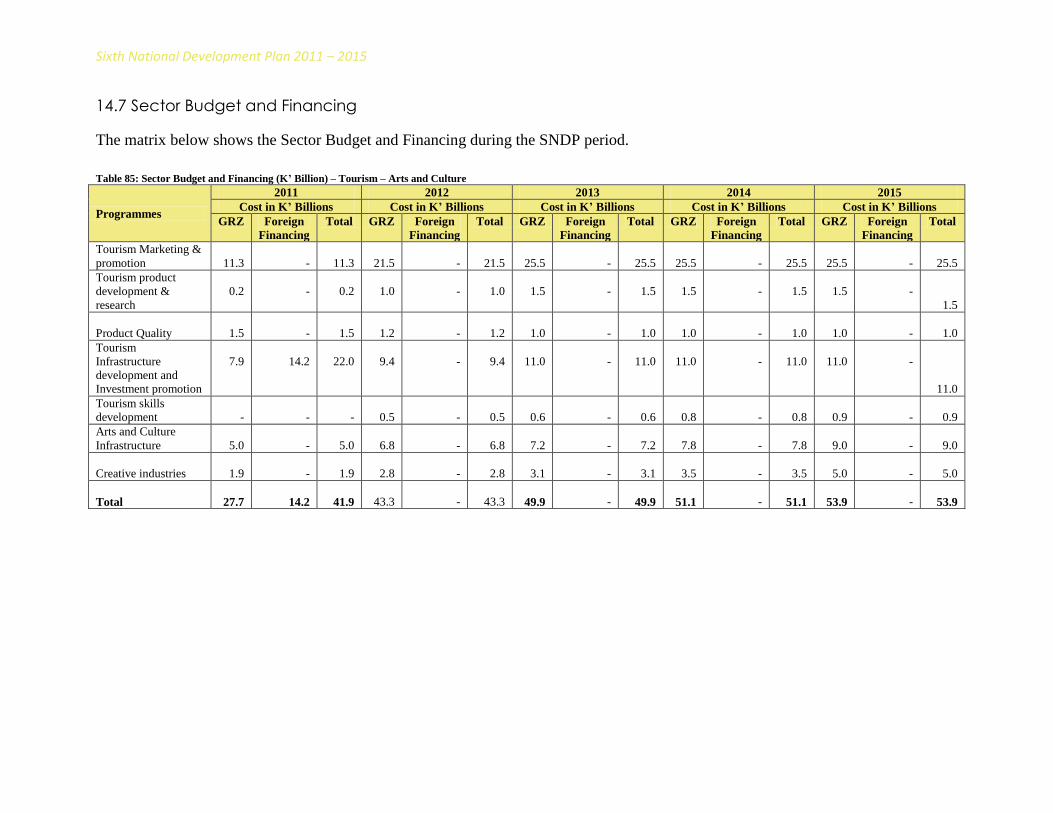
Sixth National Development Plan 2011 – 2015
14.7 Sector Budget and Financing
The matrix below shows the Sector Budget and Financing during the SNDP period.
Table 85: Sector Budget and Financing (K’ Billion) – Tourism – Arts and Culture
Programmes
2011 2012 2013 2014 2015
Cost in K’ Billions Cost in K’ Billions Cost in K’ Billions Cost in K’ Billions Cost in K’ Billions
GRZ Foreign
Financing
Total GRZ Foreign
Financing
Total GRZ Foreign
Financing
Total GRZ Foreign
Financing
Total GRZ Foreign
Financing
Total
Tourism Marketing &
promotion
11.3
-
11.3
21.5
-
21.5
25.5
-
25.5
25.5
-
25.5
25.5
-
25.5
Tourism product
development &
research
0.2
-
0.2
1.0
-
1.0
1.5
-
1.5
1.5
-
1.5
1.5
-
1.5
Product Quality
1.5
-
1.5
1.2
-
1.2
1.0
-
1.0
1.0
-
1.0
1.0
-
1.0
Tourism
Infrastructure
development and
Investment promotion
7.9
14.2
22.0
9.4
-
9.4
11.0
-
11.0
11.0
-
11.0
11.0
-
11.0
Tourism skills
development
-
-
-
0.5
-
0.5
0.6
-
0.6
0.8
-
0.8
0.9
-
0.9
Arts and Culture
Infrastructure
5.0
-
5.0
6.8
-
6.8
7.2
-
7.2
7.8
-
7.8
9.0
-
9.0
Creative industries
1.9
-
1.9
2.8
-
2.8
3.1
-
3.1
3.5
-
3.5
5.0
-
5.0
Total
27.7
14.2
41.9
43.3
-
43.3
49.9
-
49.9
51.1
-
51.1
53.9
-
53.9

Sixth National Development Plan 2011 – 2015
133
15. MANUFACTURING
15.1 Introduction
The manufacturing sector is a pivot of economic development through its backward and forward
linkages to economic growth, exports and employment creation. It provides a market for primary
products and sets the basis for exports with employment generation capacity. Policy, institutional
and legislative reforms undertaken during the FNDP contributed towards a more conducive
investment environment for both foreign and domestic investments, including the Micro, Small
and Medium Enterprises (MSMEs).
The main thrust during the SNDP period will be to facilitate the up-scaling of the manufacturing
sector towards higher value addition and upgrade capacity in the provision of related services.
Emphasis will be placed on transforming industrial businesses and complementary services
particularly MSMEs into strong value-creating entities.
15.2 Review of Past Performance
The manufacturing sector‟s contribution to GDP during the FNDP period averaged 10.2 percent
against the target of 15 percent. In terms of the sector‟s annual growth, an average of 3.3 percent
was achieved against the projected growth of 7.5 percent.
The share of manufacturing to total exports remained constant over the FNDP period at an
average rate of 2.1 percent while its contribution to total employment increased from 1.3 percent
in 2005 to 3.2 percent in 2008 (see Figure 4). Figure 4: Contributions of Manufacturing Sector 2006-2009
Source: CSO, 2010
During the FNDP period, the growth rate of the manufacturing sector declined from 5.8 percent
in 2006 to 2.5 percent in 2009. The overall decline in the manufacturing sector was due to
0
2
4
6
8
10
12
2006 2007 2008 2009
Pe
rce
nt
YearShare to GDP (%)
Share to Total Exports[1]
Share to Total Employment (%)

Sixth National Development Plan 2011 – 2015
134
significant drops in productivity in the textiles and clothing, leather and leather products and
fabricated metals sub-sectors. This drop in productivity was largely due to the high cost of doing
business; reduced demand for locally produced products and the impact of the global economic
crisis (see Figure 5). Figure 5: Percentage Growth of Manufacturing Sector (2005-2009)
Source: CSO, 2010
Figure 6 below depicts the performance of each sub-sector in terms of percentage changes in
their contribution to the manufacturing sector. Figure 6: Percentage Change in Sub-sector Growth to the Contribution of Manufacturing GDP (2005 – 2009)
Source: CSO

Sixth National Development Plan 2011 – 2015
135
The significant drop in the textiles and leather products recorded throughout the FNDP period
was mainly due to reduced domestic demand in favour of cheap imported textile products from
Asian economies. The textiles sub-sector recorded significant reduction of exports to the regional
and international markets due to their failure to compete. In addition, the increased import of
second hand clothes (salaula) into the country contributed to the problems of the textiles sub-
sector. The decline in the fabricated metal products was mainly due to reduced demand from the
mining companies who significantly reduced demand of fabricated metals as a result of the
economic crisis.
The food and beverages sub-sector grew and sustained the sector‟s contribution to the total GDP.
The sub-sector thrived mainly on account of increased investments resulting from companies
expanding their plant and the coming up ofa stream of industries which process edible oils.
Despite improvements in the institutional and legislative frameworks, the sector faced a number
of challenges. These included the high cost of doing business largely on account of poor physical
infrastructure and high production costs, disruptions in power supply, low investments in
Research and Development, obsolete technology, high cost of borrowing, limited
standardisation and quality assurance, and limited human capital and skills required to run the
manufacturing industry on a sustainable basis.
15.3 Vision, Goal and Strategic Focus
Vision
“Technology-based and export-focused manufacturing sector, which is dynamic and competitive
with effective entities that add value to the locally abundant natural resources by 2030”.
Goal
To develop a diversified and competitive export led value adding manufacturing sector which
will contribute 12.5 percent to GDP.
Strategic Focus
The strategic focus will be to strengthen and widen the country‟s manufacturing base with
emphasis on backward and forward linkages given the country‟s wide resource base. This will
require intensifying the development of the resource-based industries, with the aim to optimise
and add value to the country‟s natural resources. In line with the strategic focus of the Plan,
emphasis will be to enhance competitiveness of manufacturing through infrastructure and human
development to support growth of the sector.
15.4 Policies and Key Reforms
During the SNDP period, Government will continue to pursue the implementation of the Private
Sector Development Reform Programme (PSDRP) which is aimed at promoting a conducive
environment for the growth of the private sector. In addition, the Commerce, Trade and
Industrial Policy and the Micro, Small and Medium Enterprise Development Policy will provide
the overall framework for the development of the sector.
Although the Nation has not yet experienced significant climate change effects in the
manufacturing sector, opportunities exist for implementation of resource efficiency and climate

Sixth National Development Plan 2011 – 2015
136
protection in industrial operations. This can be achieved through introduction of profitable
environmental management systems that help minimise Green House Gas (GHG) emissions and
consume less material during production processes, and align implementation of projects with
mitigation and carbon trading under Clean Development Mechanisms (CDM) and voluntary
markets.
15.5 Objectives, Strategies and Programmes
The Table below shows the objectives, strategies and programmes for the Manufacturing Sector
during the SNDP period. Table 86: Objectives, Strategies and Programmes
No. Objectives Strategies Programmes
1 To expand the industrial base
and increase value addition
a) Facilitate the development of Multi-Facility
Economic Zones /Industrial Parks;
b) Promote joint ventures between foreign and local
investors;
c) Promote and facilitate Private Public Partnership
(PPP) projects; and
d) Enhance the capacity of DRM.
Development of Multi-Facility
Economic Zones and
Industrial Parks
2 To facilitate private sector
development
a) Promote investment in infrastructure in order to
stimulate private investment;
b) Develop the National Investment Promotion
Strategy;
c) Undertake investment missions to Capital and
Technology Exporting Nations and within the
domestic economy;
d) Provide incentives to facilitate technological
transfer;
e) Establish a more cohesive policy and supportive
regulatory and institutional framework for
investment;
f) Encourage industries to adopt cleaner and
environment friendly technology and practices;
and
g) Promote private sector driven Research and
Development activities.
Investment Promotion
3 To promote the growth of
MSMEs
a) Increase participation of indigenous Zambians in
the manufacturing sector;
b) Promote entrepreneurship training and
development at all levels of the education system;
c) Encourage innovation and technological skills
development and on-farm agro-processing
training;
d) Facilitate access to market opportunities and
business development services;
e) Facilitate the establishment of business incubation
centres and linking them to industrial parks;
f) Facilitate the establishment of business industrial
clusters;
g) Facilitate business linkages between MSMEs and
multinational corporations;
h) Create the Trade and Investment Fund targeted at
MSMEs;
i) Facilitate the establishment of Small Aggregation
Initiative joint ventures among MSMEs;
j) Strengthen the testing, calibration, inspection,
certification, and accreditation systems and
MSME Development

Sixth National Development Plan 2011 – 2015
137
No. Objectives Strategies Programmes
procedures;
k) Promote and facilitate the participation of women
and youths;
l) Mainstream cross-cutting issues; and
m) Promote use of technology to enhance total factor
productivity and competitiveness through the
establishment of sub-sector technical centres.
5 To develop rural based
industrial enterprises
a) Promote and facilitate the development of
appropriate infrastructure;
b) Develop and implement a rural industrialisation
strategy;
c) Promote the use of alternative and renewable
sources of energy;
d) Encourage on-site agro-processing in agricultural
farm blocks; and
e) Establish linkages between agricultural farming
blocks, industrial estates and out-grower schemes.
Rural Industrialisation
15.6 Implementation, Monitoring and Evaluation
To effectively monitor and evaluate the implementation of sector programmes, the following
output matrix and key performance indicators table will be used: Table 87: Sector Output Matrix
Programmes Projects/activities to be
implemented
Annual targets Total Output
Expected
end of SNDP
Responsible
Institution(s)
and Key
Stakeholders
2011 2012 2013 2014 2015
Development of
Multi- Facility
Economic
Zones and
Industrial Parks
Establishment of Multi-
Facility Economic Zones
(MFEZs)
- 1 1 1 1
4 MFEZs
established
and
operational
MCTI, ZDA,
MoFNP,
MWS
Establishment of
Industrial Parks - 1 - 1 -
2 Industrial
parks
established
MCTI, ZDA,
MoFNP,
MWS
Investment
Promotion Attract Investments
US$2
billion
US$2
billion
US$2
billion
US$2
billion
US$2
billion
US $10
billion in
Investment
Pledges
ZDA, MCTI
MSME
Development
Provide and facilitate
credit to MSMEs 50 50 50 50 50
250 MSMEs
access credit
above K50m
CEEC,
MCTI, ZDA,
MoFNP
Facilitate Business
Linkage to large
corporations
20 20 20 20 20 100 MSMEs
linked ZDA, MCTI
Facilitate establishment
of Industrial Clusters 1 2 2 2 2
9 Industrial
Clusters
established
ZDA, MCTI
Facilitate establishment
of Business incubators 1 1 1 1 1
5 Business
Incubators
established
ZDA, MCTI,
MSTVT
Rural
Industrialisation
Facilitate establishment
of rural based Agro-
processing Industries
- 1 1 1 1
4 Rural based
industrial
companies
established
MCTI, ZDA,
MoFNP,
MACO,
MoLF

Sixth National Development Plan 2011 – 2015
138
Table 88: Key Performance Indicators
Key Performance Indicators Baseline
2009
Annual Targets
2011 2012 2013 2014 2015
Share of Total Exports (%) 2.0 2.0 2.5 3.0 3.5 4.0
Manufacturing Value Added
(ZMK) 1.4 billion. 1.5 billion 1.7 billion 1.8 billion 2.0 billion 2.0 billion
Manufacturing Annual
Growth Rate (%) 2.5 2.8 3.5 4.0 4.5 5.0
Share of Total Employment
(%) 3.22 3.3 3.4 3.5 3.7 4.0
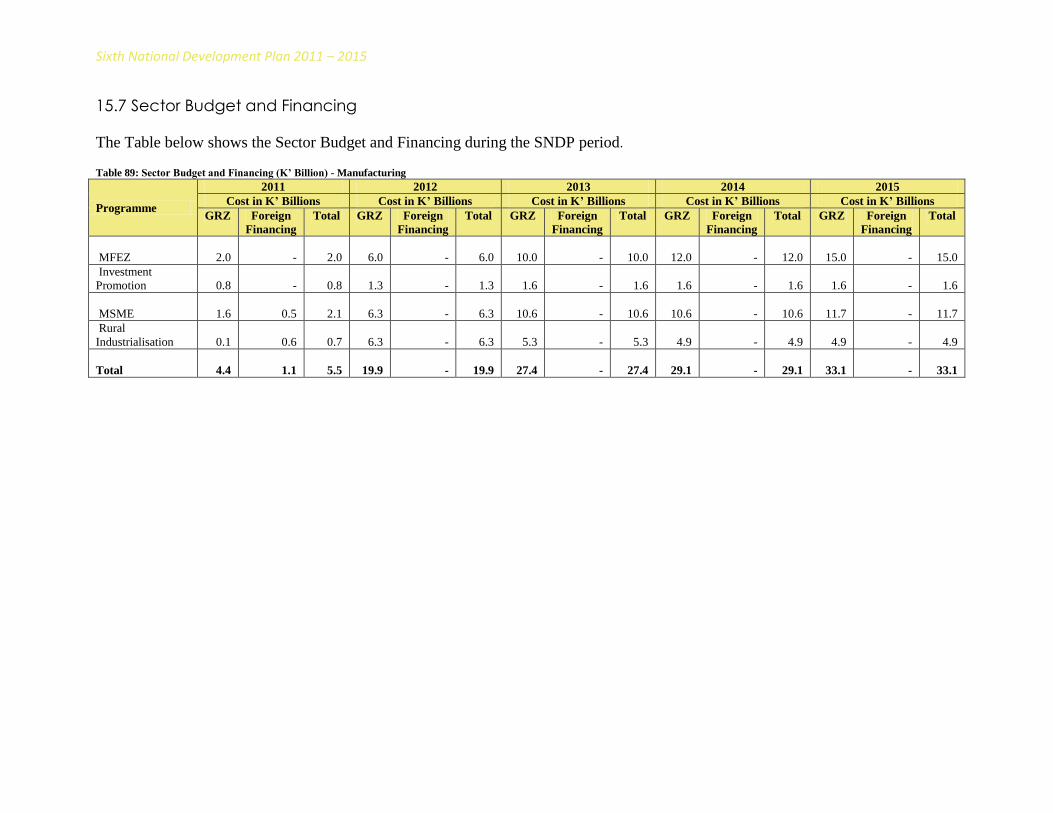
Sixth National Development Plan 2011 – 2015
15.7 Sector Budget and Financing
The Table below shows the Sector Budget and Financing during the SNDP period. Table 89: Sector Budget and Financing (K’ Billion) - Manufacturing
Programme
2011 2012 2013 2014 2015
Cost in K’ Billions Cost in K’ Billions Cost in K’ Billions Cost in K’ Billions Cost in K’ Billions
GRZ Foreign
Financing
Total GRZ Foreign
Financing
Total GRZ Foreign
Financing
Total GRZ Foreign
Financing
Total GRZ Foreign
Financing
Total
MFEZ
2.0
-
2.0
6.0
-
6.0
10.0
-
10.0
12.0
-
12.0
15.0
-
15.0
Investment
Promotion
0.8
-
0.8
1.3
-
1.3
1.6
-
1.6
1.6
-
1.6
1.6
-
1.6
MSME
1.6
0.5
2.1
6.3
-
6.3
10.6
-
10.6
10.6
-
10.6
11.7
-
11.7
Rural
Industrialisation
0.1
0.6
0.7
6.3
-
6.3
5.3
-
5.3
4.9
-
4.9
4.9
-
4.9
Total
4.4
1.1
5.5
19.9
-
19.9
27.4
-
27.4
29.1
-
29.1
33.1
-
33.1

Sixth National Development Plan 2011 – 2015
140
16. COMMERCE AND TRADE
16.1 Introduction
Government has been implementing reforms in the last decade aimed at liberalising trade,
promoting economic diversification and generate export-led growth. In this regard, Government
has continued to pursue a liberal trade policy at both regional and international levels.
During the SNDP period, Government will expand the scope and coverage of its multilateral,
regional and bilateral arrangements such as Free Trade Agreements (FTAs), and Economic
Partnership Agreements (EPAs) to ensure greater access to markets, trade and investment
opportunities. Focus will, therefore, be given to the value addition of locally produced goods for
increased domestic and foreign market earnings, development of both hard and soft
infrastructure such as roads, e-commerce and border facilities, including raising the quality of
human capital, research and development capability as well as management systems.
16.2 Review of Past Performance
During the FNDP period, the sector registered trade surpluses which were attributed to the
favourable price of copper on the global market as well as the growth of Non-Traditional Exports
(NTEs) as indicated in figure 7 below. Figure 7: Trade Flows (2006-2009)
Source: CSO
NTEs as a percentage of total exports increased from 19.9 percent in 2006 to 23 percent in 2009.
The upward trend in NTEs earnings was largely on account of increased earnings from the
export of cement and lime, wheat and museli, burley tobacco, gemstones, fresh fruits and
vegetables.

Sixth National Development Plan 2011 – 2015
141
The increase in NTEs was also attributed to the liberalisation of tariffs under the SADC Protocol
on Trade which culminated into the launch of the SADC Free Trade Area (FTA) in 2008. Figure
8 below shows the share of NTEs to total exports over the period 2006-2009. Figure 8: Share of Non-Traditional Exports to Total Exports 2006-2009
Source: CSO
The major export products during the period under review continued to be copper and copper
related, and articles thereof: ores, slag and ash collectively accounting for about 80 percent of
total export earnings. The major imports were mineral fuels, oils and products of their
distillation, boilers, machinery and mechanical appliances and parts.
In terms of trade facilitation, a One Stop Border Post (OSBP) was established at Chirundu while
the Simplified Trade Regime (STR) was launched at Mwami border post.
Despite the positive developments recorded in the sector, a number of challenges were
experienced during the FNDP period which prevented higher growth. These included the high
cost of doing business, fluctuations in foreign exchange rate, lack of skilled manpower, limited
access to credit due to the high cost of borrowing, poor product quality and inadequate trade
facilitation capacity such as delayed processing at major border posts coupled with poor border
infrastructure. Furthermore, the monitoring and tracking of domestic trade was hampered by
inadequate monitoring mechanisms.
16.3 Vision, Goal and Strategic Focus
Vision
“To become an export driven, competitive and viable Commerce sector by 2030”.
Goal
To increase the contribution of exports to GDP from 35 percent to 40 percent.
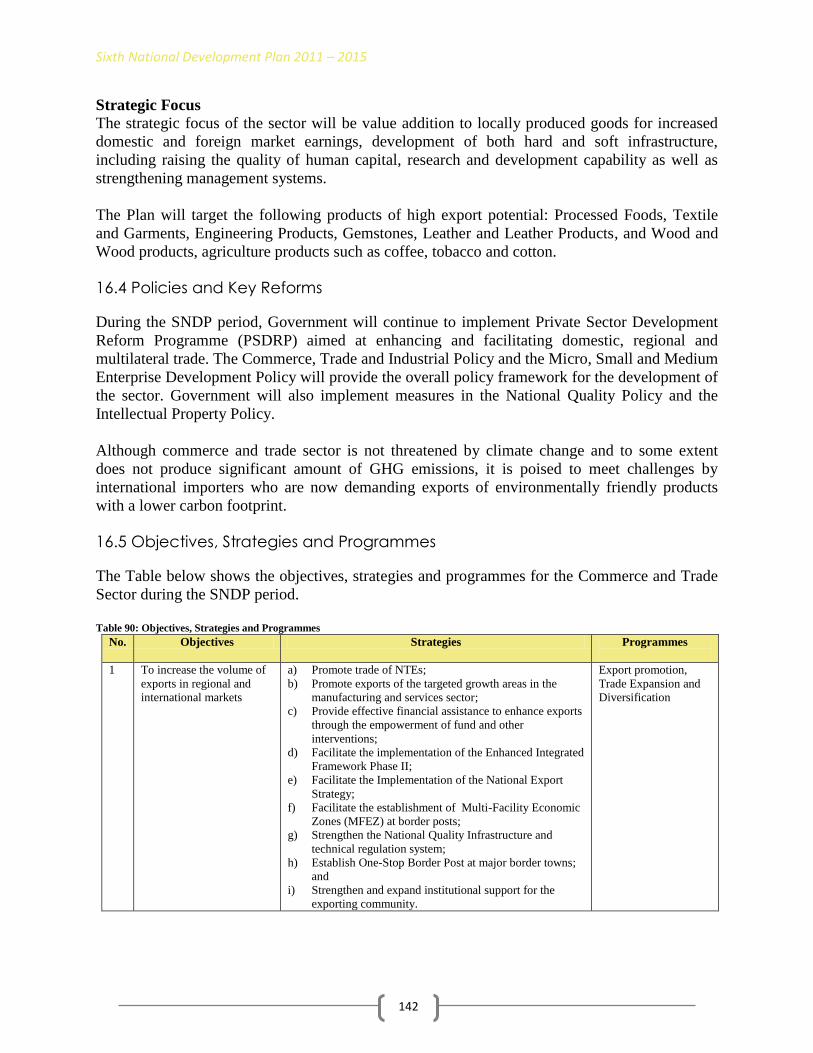
Sixth National Development Plan 2011 – 2015
142
Strategic Focus
The strategic focus of the sector will be value addition to locally produced goods for increased
domestic and foreign market earnings, development of both hard and soft infrastructure,
including raising the quality of human capital, research and development capability as well as
strengthening management systems.
The Plan will target the following products of high export potential: Processed Foods, Textile
and Garments, Engineering Products, Gemstones, Leather and Leather Products, and Wood and
Wood products, agriculture products such as coffee, tobacco and cotton.
16.4 Policies and Key Reforms
During the SNDP period, Government will continue to implement Private Sector Development
Reform Programme (PSDRP) aimed at enhancing and facilitating domestic, regional and
multilateral trade. The Commerce, Trade and Industrial Policy and the Micro, Small and Medium
Enterprise Development Policy will provide the overall policy framework for the development of
the sector. Government will also implement measures in the National Quality Policy and the
Intellectual Property Policy.
Although commerce and trade sector is not threatened by climate change and to some extent
does not produce significant amount of GHG emissions, it is poised to meet challenges by
international importers who are now demanding exports of environmentally friendly products
with a lower carbon footprint.
16.5 Objectives, Strategies and Programmes
The Table below shows the objectives, strategies and programmes for the Commerce and Trade
Sector during the SNDP period.
Table 90: Objectives, Strategies and Programmes
No. Objectives Strategies Programmes
1 To increase the volume of
exports in regional and
international markets
a) Promote trade of NTEs;
b) Promote exports of the targeted growth areas in the
manufacturing and services sector;
c) Provide effective financial assistance to enhance exports
through the empowerment of fund and other
interventions;
d) Facilitate the implementation of the Enhanced Integrated
Framework Phase II;
e) Facilitate the Implementation of the National Export
Strategy;
f) Facilitate the establishment of Multi-Facility Economic
Zones (MFEZ) at border posts;
g) Strengthen the National Quality Infrastructure and
technical regulation system;
h) Establish One-Stop Border Post at major border towns;
and
i) Strengthen and expand institutional support for the
exporting community.
Export promotion,
Trade Expansion and
Diversification

Sixth National Development Plan 2011 – 2015
143
No. Objectives Strategies Programmes
2 To stimulate the growth of
domestic trading sector and
increase trade in services
a) Promote the consumption of quality locally produced
goods and services;
b) Promote formalisation of the domestic trading sector;
c) Implement the business licensing reforms;
d) Implement measures to strengthen and enhance
Competition and Consumer Protection;
e) Develop and implement measures on trade remedies;
f) Strengthen monitoring and evaluation mechanism for
domestic trade;
g) Develop and implement services trade strategies; and
h) Establish one-stop shop for business licensing and
registration in each province.
Domestic Trade
and Competition
3 To secure and facilitate
improved
market access for locally
produced goods and
services
a) Identify and promote the development of new products
for export markets;
b) Facilitate investment in trade related infrastructure;
c) Facilitate capacity building programmes for private
sector on trade related matters; and
d) Strengthen compliance to international standards and
promote adaptation of international best practices in
product/service quality and standardisation.
Market Access for
Zambian products and
services
16.6 Implementation, Monitoring and Evaluation
To effectively monitor and evaluate the implementation of sector programmes, the following
output matrix and key performance indicators table will be used:
Table 91: Sector Output Matrix
Programmes Projects to be
implemented
Annual targets Total Output Expected
end of SNDP
Responsible
Institution(s)
and Key
Stakeholders
2011 2012 2013 2014 2015
Export
promotion,
Trade
Expansion and
Diversification
Establishment of One
Stop Border Posts
(OSBP)
- - 1 1 1 3 OSBPs established MCTI, ZDA,
MoFNP,
ZRA, MHA,
MWS
Establishment of
trading MFEZ at
Border towns
- 1 1 1 2 5 Trading MFEZs
established and
operational
MCTI, ZDA,
MoFNP,
ZRA, MHA,
MWS
Enhancing
Domestic
Trade
and
Competition
Business licensing
reforms
25 25 30 30 - 110 Unnecessary
licences abolished
MCTI, MOJ
Establishment of One
stop Shops for
business licensing
and registration
1 2 3 2 1 9 One Stop Shops
established
MCTI, ZDA,
Establish Database on
Inter-Regional Trade
1 1 3 2 2 9 One Stop Shops
established
MCTI, ZDA,
Provincial
Admin,
District
Admin,
Councils,
MoFNP
Enhancing
Market Access
for Zambian
products and
services
Facilitate Export
Promotion of NTEs
1% 2% 2% 2% 3% 10% Growth in Value of
NTE Exports
ZDA , MCTI,
MoFNP,
MTENR
Development of
products for export to
2 2 2 2 2 10 Products in new
markets
ZDA, MCTI,
MoFNP,
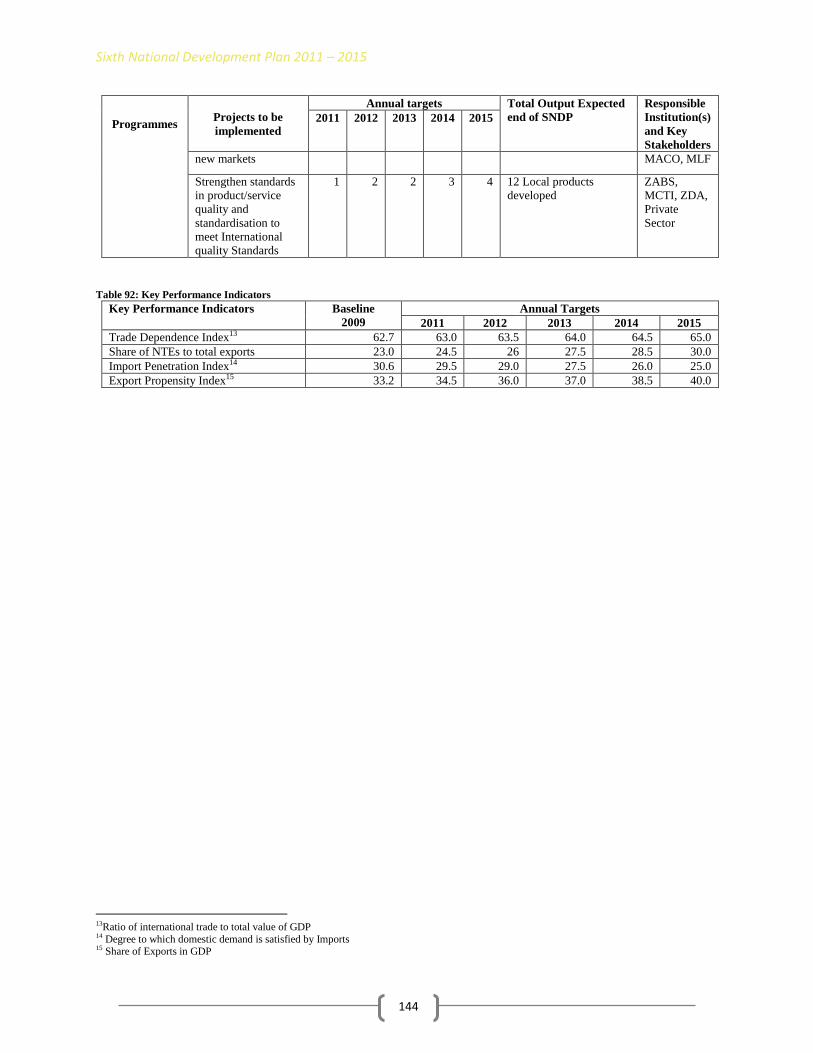
Sixth National Development Plan 2011 – 2015
144
Programmes Projects to be
implemented
Annual targets Total Output Expected
end of SNDP
Responsible
Institution(s)
and Key
Stakeholders
2011 2012 2013 2014 2015
new markets MACO, MLF
Strengthen standards
in product/service
quality and
standardisation to
meet International
quality Standards
1 2 2 3 4 12 Local products
developed
ZABS,
MCTI, ZDA,
Private
Sector
Table 92: Key Performance Indicators
Key Performance Indicators Baseline
2009
Annual Targets
2011 2012 2013 2014 2015
Trade Dependence Index13 62.7 63.0 63.5 64.0 64.5 65.0
Share of NTEs to total exports 23.0 24.5 26 27.5 28.5 30.0
Import Penetration Index14 30.6 29.5 29.0 27.5 26.0 25.0
Export Propensity Index15 33.2 34.5 36.0 37.0 38.5 40.0
13Ratio of international trade to total value of GDP 14 Degree to which domestic demand is satisfied by Imports 15 Share of Exports in GDP

Sixth National Development Plan 2011 – 2015
16.7 Sector Budget and Financing
The Table below shows the Sector Budget and Financing during the SNDP period. Table 93: Sector Budget and Financing (K’ Billion) – Commerce and Trade
Programme
2011 2012 2013 2014 2015
Cost in K’ Billions Cost in K’ Billions Cost in K’ Billions Cost in K’ Billions Cost in K’ Billions
GRZ Foreign
Financing
Total GRZ Foreign
Financing
Total GRZ Foreign
Financing
Total GRZ Foreign
Financing
Total GRZ Foreign
Financing
Total
Export
Promotion
1.0
-
1.0
4.3
-
4.3
4.6
-
4.6
5.5
-
5.5
6.2
-
6.2
Domestic trade
1.0
3.9
4.9
3.6
-
3.6
1.4
-
1.4
1.6
-
1.6
1.8
-
1.8
Market Access
0.7
2.5
3.2
2.0
-
2.0
2.0
-
2.0
2.5
-
2.5
3.0
-
3.0
Total
2.7
6.4
9.1
9.9
-
9.9
8.0
-
8.0
9.6
-
9.6
11.0
-
11.0

Sixth National Development Plan 2011 – 2015
146
Part V
Support Sectors
Sixth National Development Plan 2011 – 2015
147
17. SCIENCE, TECHNOLOGY AND INNOVATION
17.1 Introduction
Science, Technology and Innovation plays an important role in national development. Economic
advancement of any country depends on innovation, science and technological advancement of
its people. Science and Technology should be adaptable for the utilisation of locally available
resources to capture the large majority of citizens in the fight against poverty and deprivation. It
enhances productivity, wealth creation and improved quality of life.
During the SNDP, the sector will focus on investing in research, development and innovation,
and enhancing linkages with industry.
17.2 Review of Past Performance
During the FNDP period, policy and legislative reviews were undertaken to enhance the
contribution of science and technology to nationalproductivity and competitiveness. Among
these were the review of the 1996 National Policy on Science and Technology, and the
formulation of an Intellectual Property Rights Policy. With regard to legal reforms, the sector
facilitated the enactment of the Bio-safety Act of 2007.
Significant progress was made in infrastructure development and rehabilitation. Three
biotechnology laboratories at National Institute for Scientific and Industrial Research (NISIR),
Zambia Agricultural Research Institute (ZARI) and Seed Control and Certification Institute
(SCCI) were established. In addition, various laboratories at NISIR, Tropical Diseases Research
Centre (TDRC), ZARI, University Teaching Hospital (UTH), Cancer Diseases Hospital, Central
Veterinary Research Institute (CVRI), Chest Diseases Laboratory, Zambia Bureau of Standards
and the public universities were rehabilitated and re-equipped. Furthermore, a National Remote
Sensing Centre, a key Science, Technology and Innovation (STI) infrastructure, was established.
In terms of human resource capacity, a postgraduate bursary scheme for female scientists was
introduced and 18 students benefited. With regard to inventions, 20 were developed. Of these 12
were by youths through the Youth Inventors Fund while 8 utilised the Strategic Research Fund.
These funds were established to promote Science, Technology and Innovation.
In the area of agriculture, several technologies to enhance crop productivity and competiveness
(e.g. optimal crop rotation, agro-forestry, inoculum use, limingetc) were developed and
disseminated under Research, Development and Innovation (RDI). In the health sector, an
alternative and simpler malaria diagnostic tool was developed. Advances and investigations were
made in traditional medicines and occupational respiratory diseases. Further, in the energy sector
research activities focused on alternative energy sources such as biofuels (Jatropha, sweet
sorghum and ethanol), wind energy and mini-hydro-power generation.
Despite these achievements, Zambia continued to make slow progress towards the changing
Knowledge and Innovation Economy (K-Economy). This was largely due to several reasons
including low investments, deficiencies in the STI framework and weak linkages with industry.
Sixth National Development Plan 2011 – 2015
148
The general performance of the sector, during the FNDP period, was below average due to
weaknesses in coordination, human resource constraints, inadequate modern equipment and
insufficient infrastructure. For instance, there was no laboratory with basic science equipment for
research. Further, Research and Development institutions operated with staff strength of less than
50 percent. Commercialisation of research and development was hampered by weak linkages
between research institutions and industry and inadequate mechanisms for dissemination of
research findings.
17.3 Vision, Goal and Strategic Focus Vision
“A nation in which Science, Technology and Innovations are the driving forces in national
development and competes globally by 2030”
Goal To establish an effective and efficient National Science, Technology and Innovation System for
increased productivity and competitiveness by end-2015
Strategic Focus
The strategic focus will be to enhance linkage between research and industry, increase human
resource capacity in Research and Development institutionsand improve the infrastructure and
equipment.
17.4 Policies and Key Reforms
During the SNDP period, the legal and institutional framework will be re-aligned to the Science,
Technology and Innovation Policy. Further, legislation to govern indigenous knowledge systems
will be developed.
Currently, Zambia is experiencing climate change and variability. There is need to investigate
how climate change elements such as rising temperatures, change in precipitation and extreme
weather events influence development, infrastructure, environment, economy and population.
There is also need to adapt technologies and innovations to changing climatic scenarios.
17.5 Objectives, Strategies and Programmes
The Table below shows the objectives, strategies and programmes for the Science, Technology
and Innovation Sector during the SNDP period.

Sixth National Development Plan 2011 – 2015
149
Table 94: Objectives, Strategies and Programmes
No. Objectives Strategies Programmes
1 To develop medical, agricultural,
manufacturing, energy and
pharmaceutical technologies
a) Develop medicines, remedies,
vaccines and technologies for
addressing priority diseases and
conditions;
b) Develop processing technologies for
agro produce and wild foods; and
c) Preserve genetic resources for
Indigenous Knowledge System (IKS).
Research, Development and
Innovation
2 To promote the commercialisation
of innovations and R & D results
a) Establish technology demonstration
and piloting facilities.
Infrastructure and Equipment
Improvement
3 To improve and develop
infrastructure capacity for R & D
a) Rehabilitate and develop well
equipped infrastructure for research
and development; and
b) Establish specialised mini-pilot
pharmaceutical plant.
4 To strengthen human resource
capacity
a) Facilitate training programmes for
researchers in identified priority areas
of R & D; and
b) Enhance exchange programmes and
joint research with scientific experts.
Human Development
17.6 Implementation, Monitoring and Evaluation
To effectively monitor and evaluate the implementation of sector programmes, the following
output matrix and key performance indicators table will be used: Table 95: Sector Output Matrix
Programmes Projects to be
implemented
Annual Targets Total Output Expected end
of SNDP
Responsible
Institution(s)
and Key
Stakeholders
2011 2012 2013 2014 2015
Infrastructure
and equipment
improvement
R& D units
rehabilitated and
equipped
- 2 1 1 1 5 R & D units rehabilitated
MSTVT
R& D units
developed and
equipped
- 1 2 2 2 7 R & D units developed
MSTVT
Mini Pilot
Pharmaceutical
Plants established
and equipped.
- - 1 1 -
2 Mini Pilot Pharmaceutical
Plants established and
equipped
MoH
Research,
Development
and Innovation
Target specific R &
D technologies
developed 2 8 10 8 8
36 Value addition
technologies developed
MSTVT,
MACO,
CBU, MLF,
ZARI,
UNZA,
NISIR
Technologies and
Innovations
developed for
MSMEs and
Industry
2 6 5 5 4
22 Innovations and
Technologies developed for
MSMEs
MSTVT,
TDAU
Human
Development
Scientist trained in
PhD programmes:-
10 10 10 10 10
50 scientists trained in
Bioinformatics, Electronics,
Mechatronics, Bio
prospecting and Drug
Discovery
MSTVT,
Stakeholders

Sixth National Development Plan 2011 – 2015
150
Programmes Projects to be
implemented
Annual Targets Total Output Expected end
of SNDP
Responsible
Institution(s)
and Key
Stakeholders
2011 2012 2013 2014 2015
a) PhD in
Bioinformatics
and
Biotechnology
1 2 1 1 2
7 Scientists trained in
Bioinformatics and
Biotechnology
b) PhD in
Electronics
and ICTs
2 2 1 2 1 8 Scientists trained in
Electronics and ICTs
c) PHD in
Mechatronics - 1 2 1 -
4 Scientists trained in
Mechatronics
d) PhD in Bio
prospecting
and IKS
2 2 1 2 2 9 Scientists trained in Bio
prospecting and IKS
e) PhD in Drug
Discovery and
Molecular
Chemistry
1 1 2 - 2
6 Scientists trained in Drug
Discovery and Molecular
Chemistry
f) PhD in
Nuclear
Science and
Alternative
Energy
2 2 1 2 1
8 Scientists trained in
Nuclear Science and
Alternative Energy
g) PhD in
Pharmaceutica
ls
2 - 2 2 2 8 Scientists trained in
Pharmaceuticals
Scientists trained in
MSC programmes:-
30 30 30 30 30
150 scientists trained in
Bioinformatics, Electronics,
Mechatronics,Bio
prospecting and Drug
Discovery
MSTVT,
Stakeholders
a) MSC in
Bioinformatic
s and
Biotechnology
3 6 3 3 3
18 scientists trained in
Bioinformatics and
Biotechnology
b) MSC in
Electronics
and ICTs
6 6 3 6 3 24 scientists trained in
Electronics and ICTs
c) MSC in
Mechatronics - 3 6 3 4
16 scientists trained in
Mechatronics
d) MSC in Bio
prospecting
and IKS
6 6 3 6 6 27 scientists trained in Bio
prospecting and IKS
e) MSC in Drug
Discovery and
Molecular
Chemistry
3 3 6 - 6
18 scientists trained in Drug
Discovery and Molecular
Chemistry
f) MSC in
Nuclear
Science and
Alternative
Energy
6 6 3 6 4
25 scientists trained in
Nuclear Science and
Alternative Energy
g) MSC in
Pharmaceutica
ls
6 - 6 6 4 22 scientists trained in
Pharmaceuticals
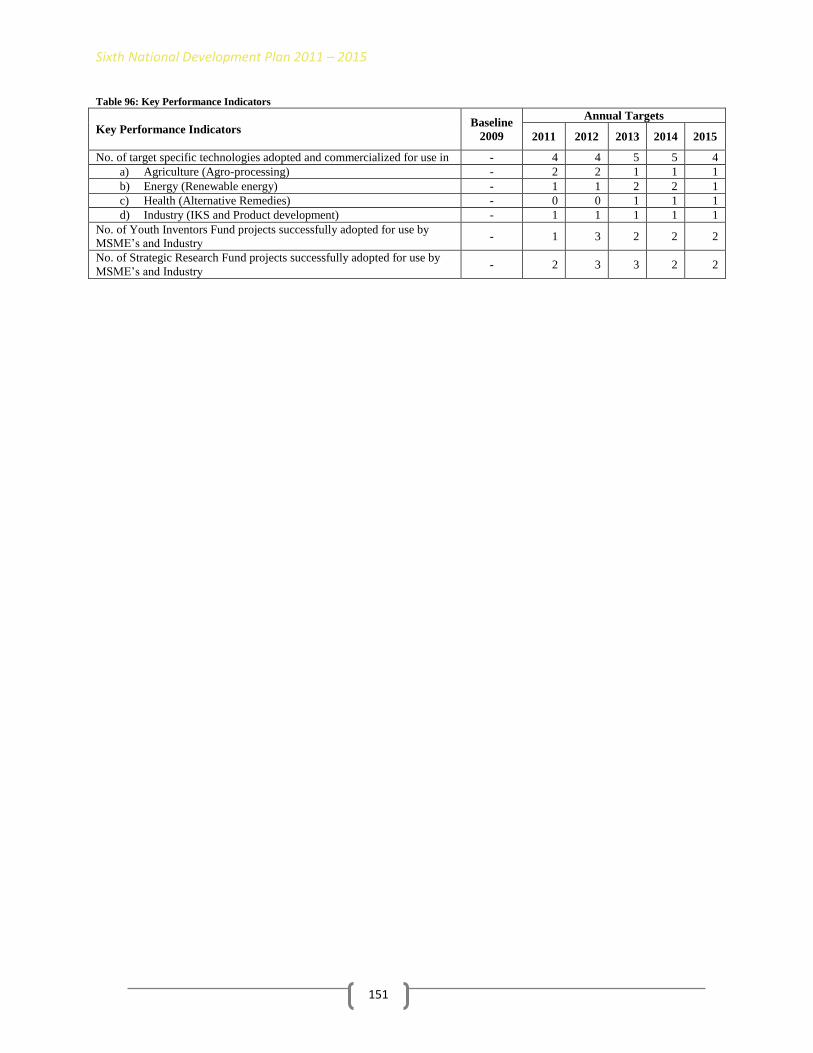
Sixth National Development Plan 2011 – 2015
151
Table 96: Key Performance Indicators
Key Performance Indicators
Baseline
2009
Annual Targets
2011 2012 2013 2014 2015
No. of target specific technologies adopted and commercialized for use in - 4 4 5 5 4
a) Agriculture (Agro-processing) - 2 2 1 1 1
b) Energy (Renewable energy) - 1 1 2 2 1
c) Health (Alternative Remedies) - 0 0 1 1 1
d) Industry (IKS and Product development) - 1 1 1 1 1
No. of Youth Inventors Fund projects successfully adopted for use by
MSME‟s and Industry - 1 3 2 2 2
No. of Strategic Research Fund projects successfully adopted for use by
MSME‟s and Industry - 2 3 3 2 2

Sixth National Development Plan 2011 – 2015
17.7 Sector Budget and Financing
The matrix below shows the Sector Budget and Financing during the SNDP period. Table 97: Sector Budget and Financing (K’ Billion) – Science, Technology and Innovation
Programmes
20’11 2012 2013 2014 2015
Cost in K Billions Cost in K’ Billions Cost in K’ Billions Cost in K’ Billions Cost in K’ Billions
GRZ Foreign
Financing
Total GRZ Foreign
Financing
Total GRZ Foreign
Financing
Total GRZ Foreign
Financing
Total GRZ Foreign
Financing
Total
Infrastructure
and
Equipment
Improvement
9.1
-
9.1
13.7
-
13.7
14.5
-
14.5
13.5
-
13.5
15.5
-
15.5
Research
Development
and
Innovation
improvement
2.0
-
2.0
4.0
-
4.0
5.0
-
5.0
8.0
-
8.0
8.0
-
8.0
Development
of a Critical
- Masters
Level
0.5
-
0.5
1.5
-
1.5
1.0
-
1.0
1.5
-
1.5
0.5
-
0.5
Technology
and
Innovation
Personnel -
PhD Level
0.5
-
0.5
1.5
-
1.5
1.0
-
1.0
-
-
-
-
-
-
Total
12.1
-
12.1
20.7
-
20.7
21.5
-
21.5
23.0
-
23.0
24.0
-
24.0

Sixth National Development Plan 2011 – 2015
153
18. INFORMATION AND COMMUNICATIONS TECHNOLOGY
18.1 Introduction
Information and Communications Technology (ICT) and Meteorology play a vital role in the
socio-economic development of a country. Growth of ICT is a precursor to wealth creation and
attainment of a well informed and knowledgeable society. As part of ICT, the media continues to
play a vital role of information dissemination for socio-economic development. Meteorology
safeguards life and property through provision of vital information on scientifically derived early
warning systems, predictions and information on weather and climatic conditions especially in
hazard-prone areas.Although there was progress in the provision of ICT services, the sector still
faces challenges which include high cost of service provision, limited access to information
especially in rural areas and poor infrastructure.
During the SNDP period, the focus will be on expansion of ICT infrastructure through multiple
delivery channels accessible to all citizens. With regard to meteorology, focus will be on
enhancing the capacity of the sector to provide timely and accurate information for the public to
respond and adapt to climatic events.
18.2 Review of Past Performance
During the FNDP period, progress made in the sub-sector included the following: expansion and
installation of the optic fibre networks, liberalisation of the international gateway and the
expansion of internet and mobile telephone services. As a result, the mobile telephone service
grew by over 300 percent from 949,558 to over 4,000,000 subscribers. This translated into an
increase in mobile subscriber penetration from 14.4 to 32.3 per 100 people. The internet service
grew by over 65 percent from 10,882 to over 18,000 subscribers. This, however, translated into a
marginal increase in internet subscriber penetration from 0.1 to 0.2 per 100 people. Further, the
e-government project was commissioned.
With regard to the electronic media, 42 private radio stations and 3 private television stations
were established. In addition, ZNBC television coverage was expanded to 73 districts although
in most cases there is still signal failure due to either limited electrical power or signal due to
difficult terrain.
However, during the period under review, the public print media did not perform well due to the
continued delay in the distribution of news print and in some cases, the absence of news print
media in rural and peri urban areas. To address this gap, Government embarked on the
decentralisation of the printing presses. The overall target was to have 9 Printing Presses
procured and installed in all the 9 provinces by 2010. Out of this target, only 2 presses, 1 for
Chipata and the other for Kasamawere procured.
With regard to meteorology, two marine meteorological stations were established in Mpulungu
and Samfya while one aviation meteorological station was established at Kalulushi‟sSouthdowns

Sixth National Development Plan 2011 – 2015
154
airport. In addition, metrological site identification for Nansanga Farm Block and Kafulafuta
area were completed.
To further enhance the performance of the ICT and meteorological sector, Government
undertook several legislative reforms. These included the following:
(i) Launch of ICT Policy of 2006 in March 2007
(ii) Enactment of ICT Act of 2009
(iii)Postal Services Act of 2009
(iv) National Meteorology Policy of 2009
(v) Electronics Communication Transaction Act of 2009
(vi) ZNBC Amendment Act
(vii)Broadcasting Amendment Act and
(viii) Copyright Amendment Act
18.3 Vision, Goal and Strategic Focus
Vision
“An information and knowledge based society by 2030.”
Goal
To increase coverage, access and efficiency in the provision of Information and Communications
Technology and meteorological services in order to contribute to sustainable national economic
growth.
Strategic Focus
During the SNDP period, the sector focus will be to enhance access to information for
development, ICT, and meteorological services through infrastructure and human development
to ensure a well-informed citizenry.
18.4 Policies and Key Reforms
The sector will undertake institutional, policy and regulatory reforms aimed at increasing access
to ICT products and enhance competition in order to foster socio-economic development and
generate climate information for decision making. In addition, the sector will develop the TV
Broadcasting Policy.
18.5 Objectives, Strategies and Programmes
The Table below shows the objectives, strategies and programmes for the Information and
Communications Technology Sector during the SNDP period.

Sixth National Development Plan 2011 – 2015
155
Table 98: Objectives, Strategies and Programmes
No. Objectives Strategies Programmes
1 To develop and maintain ICT
and Meteorology infrastructure
a) Develop a national infrastructure development
policy on ICT;
b) Promote PPP in the provision and
maintenance of infrastructure;
c) Expand National fibre optic networks and
Met stations;
d) Establish ICT and climate change research
centres; and
e) Roll-out ICT incubation centres to all MFEZ
areas.
Infrastructure Development
with Climate Change
consideration
2 To establish an integrated e-
governance platform
a) Develop guidelines on e-governance and
implementation process;
b) Develop the integration of government
management information systems; and
c) Promote the creation of multi-purpose
community centres (banks, post offices, tele-
centres, parks and kiosks).
E-Government and ICT
Application
3 To transform terrestrial television
from analogue to digital and
enhance broadcast media in rural
areas
a) Develop a TV broadcasting policy and
standards; and
b) Establish Digital Terrestrial Television
Migration (DTTM) infrastructure
Digital Migration
18.6 Implementation, Monitoring and Evaluation
To effectively monitor and evaluate the implementation of sector programmes, the following
output matrix and key performance indicators table will be used: Table 99: Sector Output Matrix
Programmes Projects to be
implemented
Annual Targets Total output Expected
end of SNDP
Responsible
institution
(Key
Stakeholder)
2011 2012 2013 2014 2015
Infrastructure
Development
Develop a national
infrastructure
development policy
- - - - 1 National infrastructure
policy developed
MCT, MoFNP
Expand National Met
stations
- 1 1 1 1 4 National Met stations
Expanded
MCT, MACO
and MoFNP
Establish ICT
incubation centres and
Industrial Parks
-
2 1
2 1
4 ICT incubation centres
and 2 Industrial parks
established and
operational
MCTI, ZDA,
MoFNP, MCT
Number of districts to
be connected to optic
fibre cables
5 5 5 5 5
25 districts to be
connected to optic fibre
cables
MCT,
ZAMTEL
Number of analogue
transmitters replaced
with digital
transmitters
15 12 12 12 12 63 analogue transmitters
replaced with digital
transmitters
MIBS
E-
Government
Develop Guidelines
on e-government and
implementation
process
- - - - 1 Implementation
guidelines developed
MCT, Cabinet
office, All
Line
Ministries
Develop the
integration of
government
management
information systems
1 - - - - An integrated government
information system
established
MCT,
MoFNP,
Cabinet office,
All line
Ministries
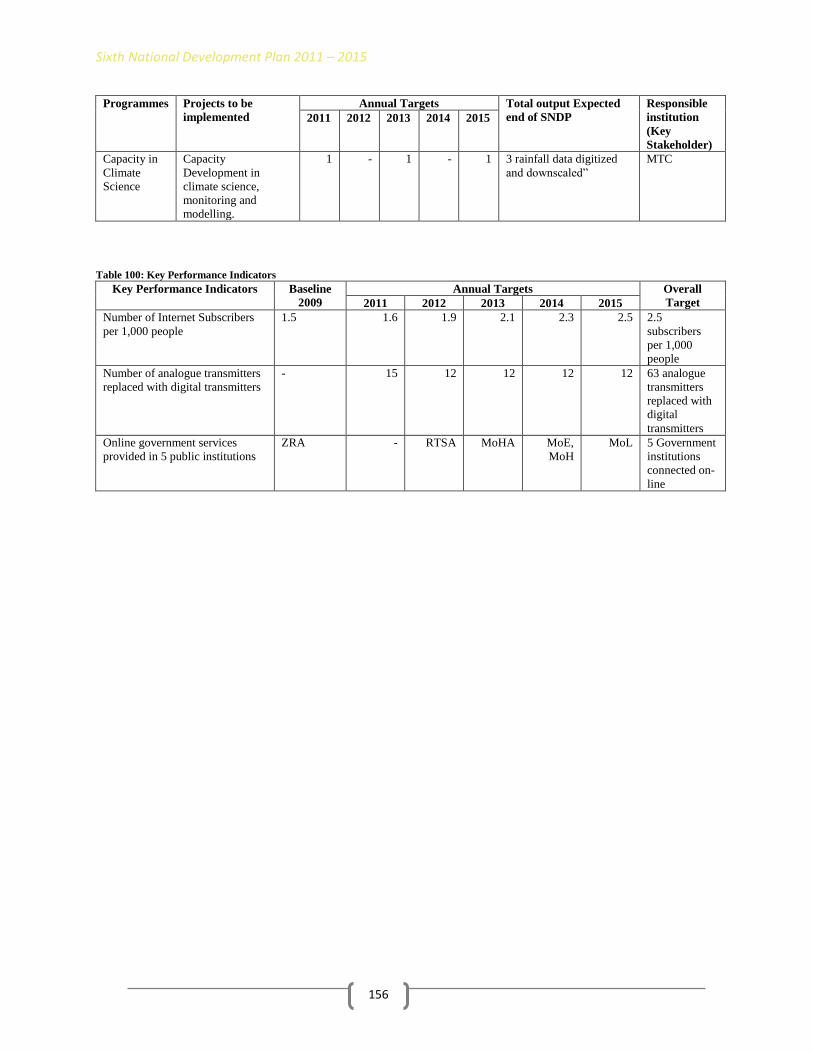
Sixth National Development Plan 2011 – 2015
156
Programmes Projects to be
implemented
Annual Targets Total output Expected
end of SNDP
Responsible
institution
(Key
Stakeholder)
2011 2012 2013 2014 2015
Capacity in
Climate
Science
Capacity
Development in
climate science,
monitoring and
modelling.
1 - 1 - 1 3 rainfall data digitized
and downscaled”
MTC
Table 100: Key Performance Indicators
Key Performance Indicators Baseline
2009
Annual Targets Overall
Target 2011 2012 2013 2014 2015
Number of Internet Subscribers
per 1,000 people
1.5 1.6 1.9 2.1 2.3 2.5 2.5
subscribers
per 1,000
people
Number of analogue transmitters
replaced with digital transmitters
- 15 12 12 12 12
63 analogue
transmitters
replaced with
digital
transmitters
Online government services
provided in 5 public institutions
ZRA - RTSA MoHA MoE,
MoH
MoL 5 Government
institutions
connected on-
line

Sixth National Development Plan 2011 – 2015
18.7 Sector Budget and Financing
The Table below shows the Sector Budget and Financing during the SNDP period. Table 101: Sector Budget and Financing (K’ Billion) – Information and Communications Technology
Programme
2011 2012 2013 2014 2015
Cost in K’ Billions Cost in K’ Billions Cost in K’ Billions Cost in K’ Billions Cost in K’ Billions
GRZ Foreign
Financing
Total GRZ Foreign
Financing
Total GRZ Foreign
Financing
Total GRZ Foreign
Financing
Total GRZ Foreign
Financing
Total
Digital Migration
0.6
-
0.6
25.0
-
25.0
25.0
-
25.0
25.0
-
25.0
5.0
-
5.0
E-Government &
ICT Applications
1.6
-
1.6
15.0
-
15.0
20.0
-
20.0
30.0
-
30.0
30.0
-
30.0
Research and
Development (ICT
& MET R&D
Centres)
-
-
-
2.6
-
2.6
2.0
-
2.0
2.0
-
2.0
5.0
-
5.0
Total
2.2
-
2.2
42.6
-
42.6
47.0
-
47.0
57.0
-
57.0
40.0
-
40.0

Sixth National Development Plan 2011 – 2015
158
19. NATURAL RESOURCES
19.1 Introduction
Zambia is endowed with vast and diverse natural resources that form the basis for economic
activity. These include land, wildlife, forest, minerals, natural heritage and wetlands. Effective
and efficient management of these natural resources can significantly contribute to national
development through foreign exchange earnings and employment creation. In addition, various
natural resource products and ecosystem services are important sources of livelihood and energy.
The focus for SNDP will, therefore, be to reverse deforestation, wildlife depletion, heritage sites
degradation, and land degradation. Further, the sector will enhance collaboration among players
in natural resources management in order to ensure sustainable exploitation of natural resources.
19.2 Review of Past Performance
During the FNDP period, the forestry sub-sector undertook a nation-wide land use assessment to
establish the rate of deforestation which indicated that the annual rate of deforestation ranged
from 250, 000 to 300, 000 hectares. Even though this was below FNDP estimated rate of
deforestation of 900,000 hectares per year, the rate of deforestation still remained high. The
assessment also revealed that out of the total national biomass estimated at 5.6 billion tonnes,
approximately 2.8 billion tonnes of carbon was stored in the forests. In partnership with Ministry
of Education 600,000 trees were planted in 300 schools.
With regards to Wildlife, significant progress was made in resource protection in the Kafue,
Mosi-Oa-Tunya, South Luangwa and Nsumbu National Parks,conserving wildlife, in
particular,in the Liuwa Plain, SiomaNgwezi, North Luangwa and Kasanka National Parks, and
with the establishment, with communities, of the pilot Chikuni Partnership Park in
Bangweulu.Illegal settlers were removed from 3 protected areas namely, Nsumbu and Isangano
National Parks, Sichifulo and NamwalaGame Management Areas (GMAs). A country-wide
animal population census conducted revealed an estimated elephant population of between
27,000 and 30,000. The restocking program continued with the Lusenga Plain National Park
receiving a variety of animals, Mosi-Oa-Tunya National Park receiving 5 white rhinos, the North
Luangwa National Park 20 black rhinos while the Liuwa Plain National Park received 2 lions.
The program of reduction of infestation of invasive alien plant species was scaled up with a total
of 500 hectares of land in Lochinvar National Park cleared of Mimosa Pigra and the removal of
the Lantana Camara around the Victoria Falls in Livingstone.
However, the process of reviewing the Policy for National Parks and Wildlife in Zambia of 1998
and the Zambia Wildlife Act, No. 12 of 1998 had been initiated during the FNDP.
The sector faced a number of challenges among them low investments and poor management of
natural resources. Other challenges included inadequate human capacity and weak enforcement
of the legal framework.

Sixth National Development Plan 2011 – 2015
159
19.3 Vision, Goal and Strategic Focus
Vision
“A productive environment and well-conserved natural resources for sustainable socio-economic
development by 2030”
Goal
To reduce the rate of deforestation, wildlife depletion and degradation of heritage sites, land and
wetlands.
Strategic Focus
To enhance investment in the management of natural resources and the conservation of heritage
sites for socio-economic development.
19.4 Policies and Key Reforms
During the SNDP period, the sector will finalise the revision of the National Forestry Policy of
1998 and the National Parks and Wildlife Policy of 1998 in order to address issues of low
investment and poor management of natural resources. In addition, the sector will develop a
National Heritage Policy and finalise the Wetlands Policy. Further, Government will amend the
Forestry Act of 1999, the Wildlife Act of 1998 and the National Heritage Conservation Act of
1989 in order to strengthen management of natural resources and domesticate relevant
international Agreements and Treaties. The sector will also embark on decentralisation of the
forestry sub-sector in order to facilitate improved service delivery and management of the
resource.
19.5 Objectives, Strategies and Programmes
The Table below shows the objectives, strategies and programmes for the Natural Resources
Sector during the SNDP period. Table 102: Objectives, Strategies and Programmes
No. Objectives Strategies Programmes
1 To reduce the rate of wildlife
depletion through sustainable
management of wildlife and
habitat in protected wildlife and
forest areas
a) Improve policy and legal framework including
regulations;
b) Re-organize ZAWA and strengthen its capacity
in wildlife management and extension services;
c) Upscale leadership and management skills
training at all levels;
d) Strengthen cooperation with natural resources
management to Agriculture, Livestock and
Fisheries, Energy, Water and Mining;
e) Enhance community and private sector
participation in wildlife management in public
wildlife estate as well as on community &
private wildlife estates;
f) Develop Management Plans, including Land
Use Plans, for protected wildlife areas;
g) Enhance research capacity;
h) Promote awareness on wildlife conservation;
and
Protected Wildlife Area
Management
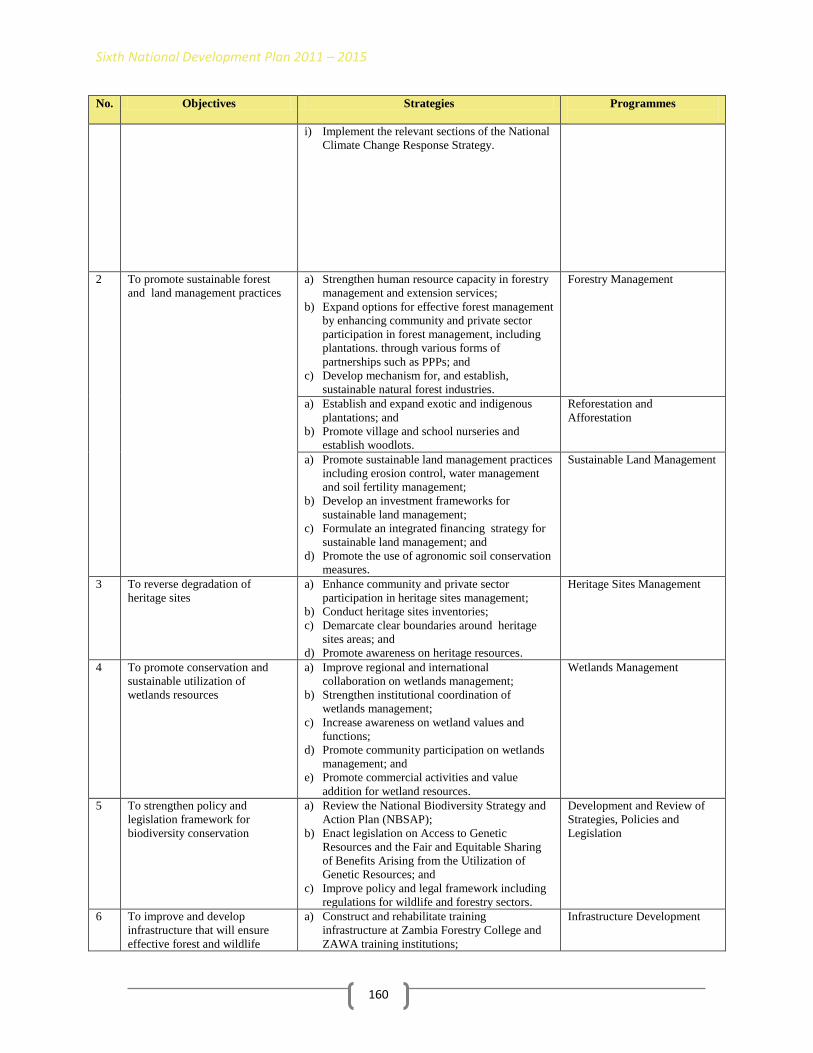
Sixth National Development Plan 2011 – 2015
160
No. Objectives Strategies Programmes
i) Implement the relevant sections of the National
Climate Change Response Strategy.
2 To promote sustainable forest
and land management practices
a) Strengthen human resource capacity in forestry
management and extension services;
b) Expand options for effective forest management
by enhancing community and private sector
participation in forest management, including
plantations. through various forms of
partnerships such as PPPs; and
c) Develop mechanism for, and establish,
sustainable natural forest industries.
Forestry Management
a) Establish and expand exotic and indigenous
plantations; and
b) Promote village and school nurseries and
establish woodlots.
Reforestation and
Afforestation
a) Promote sustainable land management practices
including erosion control, water management
and soil fertility management;
b) Develop an investment frameworks for
sustainable land management;
c) Formulate an integrated financing strategy for
sustainable land management; and
d) Promote the use of agronomic soil conservation
measures.
Sustainable Land Management
3 To reverse degradation of
heritage sites
a) Enhance community and private sector
participation in heritage sites management;
b) Conduct heritage sites inventories;
c) Demarcate clear boundaries around heritage
sites areas; and
d) Promote awareness on heritage resources.
Heritage Sites Management
4 To promote conservation and
sustainable utilization of
wetlands resources
a) Improve regional and international
collaboration on wetlands management;
b) Strengthen institutional coordination of
wetlands management;
c) Increase awareness on wetland values and
functions;
d) Promote community participation on wetlands
management; and
e) Promote commercial activities and value
addition for wetland resources.
Wetlands Management
5 To strengthen policy and
legislation framework for
biodiversity conservation
a) Review the National Biodiversity Strategy and
Action Plan (NBSAP);
b) Enact legislation on Access to Genetic
Resources and the Fair and Equitable Sharing
of Benefits Arising from the Utilization of
Genetic Resources; and
c) Improve policy and legal framework including
regulations for wildlife and forestry sectors.
Development and Review of
Strategies, Policies and
Legislation
6 To improve and develop
infrastructure that will ensure
effective forest and wildlife
a) Construct and rehabilitate training
infrastructure at Zambia Forestry College and
ZAWA training institutions;
Infrastructure Development

Sixth National Development Plan 2011 – 2015
161
No. Objectives Strategies Programmes
management
b) Construct and rehabilitate Provincial and
District Forestry offices, staff houses and
Satellite camps;
c) Improve staff housing, offices, gates, access
and secondary road, water crossings and
airstrips in protected wildlife areas;
d) Rehabilitate beeswax and honey processing
factories; and
e) Rehabilitate forest nurseries.
19.6 Implementation, Monitoring and Evaluation To effectively monitor and evaluate the implementation of sector programmes, the following output matrix and key performance indicators table will be used: Table 103: Sector Output Matrix
Progra
mmes
Projects
to be
implemen
ted
Annual targets Total
Output
Expected
end of
SNDP
Responsible
Institutions(s
) Key
Stakeholders
2011 2012 2013 2014 2015
Protected
Wildlife
Area Manage
ment
ZAWA Restructur
ing
Reorganization plan adopted
20% 40% 60% 100% 100% implement
ation of
ZAWA reorganizat
ion plan
ZAWA
National Parks
Protection
- Lower Zambezi
Mweru-wa-Ntipa
- - 2 National Parks
freed of
human
settlement
4 (Kafue,
Lower
Zambezi, Lusaka &
South
Luangwa National
Parks)
4 (Lusenga
Plains,
Mweru-wa-Ntipa,
SiomaNgwez
i National Parks
&Chete&Sik
ula Wildlife Sanctuaries)
4 (Liuwa
Plains,
Kasanka, Luambe&Lavu
shiManda
National Parks)
4 (West Lunga,
Lukusuzi,
Isangano National Parks
&Chembe Bird
Sanctuary)
4 (Nsumbu,
Mosi-oa-
Tunya National
Parks)
(GMPs reviewed for
North
Luangwa & Blue Lagoon
National
Parks)
20 NPs
with
adopted manageme
nt plans
Lusaka,,
Nsumbu and
Liuwa Plains(Buffalo
) &Mosi-oa-
Tunya
National Parks
- SiomaNgwezi
& West Lunga
Kafue (Rhino
with other
species)
- 7 National
Parks
benefit from
restocking
and
stocking
Kafue (x 3)
&LavushiManda National
Parks
West Lunga
National Parks
Lukusuzi
National Parks
- - 6 new
partnerships
established
GMA
Management
7 (Nkala,
Namwala, Chiawa,
Mulobezi,
Suchifulo, Lukwakwa&C
hibwika-
Ntambo GMAs)
7
(KasonsoBusanga,
Mufunta,
Kafinda, Musalangu,
Lupande,
Mumbwa&Lunga –
7 (Bilili
Springs, Munyamadzii,
West Petauke,
Rufunsa, Kafue flats, West
Zambezi
&Luano GMAs)
7 (Lumimba,
Sandwe,
Kaputa, Tondwa,
Chisomo,
KalasaMukoso&Chizera
GMAs)
6 (Musele-
Matebo,
Luwingu, Chambesi,
Mansa
&MachiyaFungulwe
GMAs)
34 GMAs
with adopted
Manageme
nt Plans
ZAWA with
Community Resource
Board

Sixth National Development Plan 2011 – 2015
162
Progra
mmes
Projects
to be
implemen
ted
Annual targets Total
Output
Expected
end of
SNDP
Responsible
Institutions(s
) Key
Stakeholders
2011 2012 2013 2014 2015
Luswishi GMAs),
1 (Mumbwa
GMA)
2 (Sichifulo&
Mulobezi
GMAs)
1 (Lumimba
GMA)
1 (Lupande
GMA)
1 (Sandwe
GMA)
6 GMAs
with clear
demarcated
boundaries
1 (Sichifulo
GMA)
1 (Namwala
GMA)
1 (Mumbwa
GMA)
1 (Lumimba
GMA)
1 (Bilili
Spring)
5 GMAs with
wildlife
zone freed of human
settlement
Enhance Human
Resource
Development
10% 10% 10% 10% 10%
50% of WPO and
scout
received in house staff
training
ZAWA
Enhance
Research Developm
ent
1 (Ngoma
Area Management
Unit)
1 (Chunga Area
Management
Unit)
1 (Nsumbu
Area Management
Unit)
3
laboratories
rehabilitate
d
ZAWA with
UNZA
-
1 (National
animal population
census)
-
1 (National
animal population
census)
-
2 national animal
population
censuses conducted
ZAWA with UNZA
Communi
ty
Awareness
Promoted
10
10
10
10
10
50 school
visits to
NPs per year
ZAWA with
Wildlife &
Environmental
Conservation Society of
Zambia
Forest
Management
Forest
Management Area
Demarcati
on
2 2 2 2 2
10
protected Areas with
clear
boundaries established
MTENR
2
-
-
-
-
Lamba
headwaters No. P. 17
(Chingola
district),
150,500
Ha and
Serenje National
Forest No.
P. 21 (Serenje
District)
29,680 Ha
MTENR
- 2 - - -
Lundazi National
Forest No.
P. 24 (Chama/L

Sixth National Development Plan 2011 – 2015
163
Progra
mmes
Projects
to be
implemen
ted
Annual targets Total
Output
Expected
end of
SNDP
Responsible
Institutions(s
) Key
Stakeholders
2011 2012 2013 2014 2015
undazi) 289,960
Ha and
Nkolemfumu
National
Forest No. 48
(Kasama),
54,228 Ha
- -
2
-
-
Zambezi
National
Forest No. P.34
(Zambezi
district), 91,700 Ha
and Lusitu
Headwaters No. P.
205
(Mazabuka district),
21,390 Ha
- - - 2
-
Kafue Local
Forest No.
F. 69 (Kafue
district),
1,967 Ha and
Machile
Local Forest N.
P. 2
(Sesheke district),
47,783 Ha
- - - -
2
Mubende
National Forest No.
F. 443
(Kawambwa
district),
90,830 Ha and
Mvuvye National
Forest No.
P.32 (Petauke
district),
80,937 Ha
Training of
Forestry
Human Resource
70 70 70 120 190
520 forestry
graduates
trained
Protected
Forest Areas
Reclassifi
cation
1 2 1 2 1
7 protected
forest areas
reclassifie
d as nature
MTENR, FD
& ZAWA

Sixth National Development Plan 2011 – 2015
164
Progra
mmes
Projects
to be
implemen
ted
Annual targets Total
Output
Expected
end of
SNDP
Responsible
Institutions(s
) Key
Stakeholders
2011 2012 2013 2014 2015
parks (Mvuvye
Nature
Park; Luji Nature
Park;
Lunuka Nature
Park;
Lwitikila Nature
Park;
Mulembo Nature
Park;
Zambezi Source
Nature
Park; and Chama –
Lundazi Nature
Park)
Forestry
Research Laborator
y
Refurbishment
3
1
2
1
-
7
Laboratories
refurbishe
d in Kitwe and
Kalulushi,
Forestry
Department
Plantations
Reforestat
ion 1,500 1,500 2,000 2,000 2,000
9,000 Ha planted
with
Eucalyptus and pine
trees:
Forestry Department/Z
AFFICO
Reforest
ation and Afforest
ation
Afforestat
ion of degraded
Forests 1,000 1,000 1,500 500 500
Reduce
from 2,500,000
Ha to
2,495,500 Ha of
degraded
forests
Forestry
Department
Reforestat
ion of
Natural Forests
1,500 1,500 1,500 1,000 500
6,000 Ha
of
degraded forests
reforested:
Forestry
Department
Establish
Village
Nurseries
5 2 1 3 3 14 Village
nurseries
established
Forestry
Departement
Heritage Sites
Manage
ment
National Heritage
Designati
on to world
class
status
1 1 1 1 1 5 Heritage designated
World
class status
National Heritage
Conservation
Commission(NHCC)
Develop
ment
and Review
Review
the
National Biodiversi
- 1 - - - 1 NBSAP MTENR

Sixth National Development Plan 2011 – 2015
165
Progra
mmes
Projects
to be
implemen
ted
Annual targets Total
Output
Expected
end of
SNDP
Responsible
Institutions(s
) Key
Stakeholders
2011 2012 2013 2014 2015
of Strategi
es,
Policies and
Legislati
on
ty Strategy
and
Action Plan
(NBSAP)
Enact legislation
on Access
& Benefit Sharing
ABS)
- 1 - - - 1 ABS MTENR,
Revise
National
Heritage
Policy and
Act
1 - 1 - -
1 NHCC
Policy & 1
Act
MTENR,
NHCC
Adopt a
wetland
policy
- 1 - - -
1 Wetland
Policy
MTENR,
Improve policy and
legal framewor
k
including regulation
s for
wildlife and
forestry
sectors
1 1 - - -
Forest Act reviewed
Wildlife Act
reviewed
MTENR, Forestry
Department, ZAWA
Infrastructure
Develop
ment
Provincial Office
Accommo
dation Expansion
-
1
Central
Province
1
Southern
Province
1
Western
Province
1
Lusaka
Province
4 office blocks
with 4
offices expanded.
Forestry Department
Mwekera
Forestry College
Expansion
1x4 storey
hostel for
students
1x3
classroom
block
1 Lecture Theatre
1x4 storey hostel
2x3 classroom
Blocks, 10x3
bed roomed Staff houses
1 Lecture
Theatre, 2x4 storey
hostels for
students, 3x3
classroom
Blocks and 10, 3x3
bed
roomed Staff
houses
MTENR
Construct District
Office
Accommodation
1x 7
4 District office blocks
1x 5
6 District office blocks
1x 7 8 District office
blocks
1x 7
7 District office blocks
1x 7
6 District office blocks
34, 1x7 District
Forestry
Office blocks
constructe
d
Forestry Department
Construction of
Office
Block at sub
district
level
2
2
4
4
2
14 Office Blocks
constructe
d.
Forestry Department

Sixth National Development Plan 2011 – 2015
166
Progra
mmes
Projects
to be
implemen
ted
Annual targets Total
Output
Expected
end of
SNDP
Responsible
Institutions(s
) Key
Stakeholders
2011 2012 2013 2014 2015
Construct Staff
houses at
Camp Sites 2 Houses each
at 3 campsites,
2 Houses
each at 2 campsites,
2 Houses each
at 3 campsites
2 Houses each
at 3 campsites
2 Houses
each at 3 campsites
28 2-
bedroomed
staff Houses at
Forestry
Camp Sites
constructe
d.
Forestry Department
Honey
and Bee
wax processin
g plants
Refurbishment
1
Mwekera
1
Kaoma
1
Kabompo
1
Lundazi -
4 Honey
and Bee
wax processing
plants
Refurbished
Forestry
Department
Table 104: Key Performance Indicator Matrix
Key Performance Indicators Baseline
2009
Annual Target
2011 2012 2013 2014 2015
Maintain the current hecterage of
Protected wildlife areas 31% 31% 31% 31% 31% 31%
Annual Rate of Deforestation
(Ha)
250,000 to
300,000 <300,000 <280,000 <260,000 <250,000 <250,000
Timber Contribution to
Manufacturing(M3) 451,000 521,000 591,000 632,000 671,000 711,000
Score of Management
Effectiveness of Protected areas <65%low* <60% low* <50%low* <40% low* <30% low*
<20%
low*
Increase the hectarage of gazetted
forest areas 9.4% 9.4% 9.8% 10% 10% 10.2%
*Based on Management Effectiveness Tracking Tool for Protected Areas in Zambia (METTPAZ)
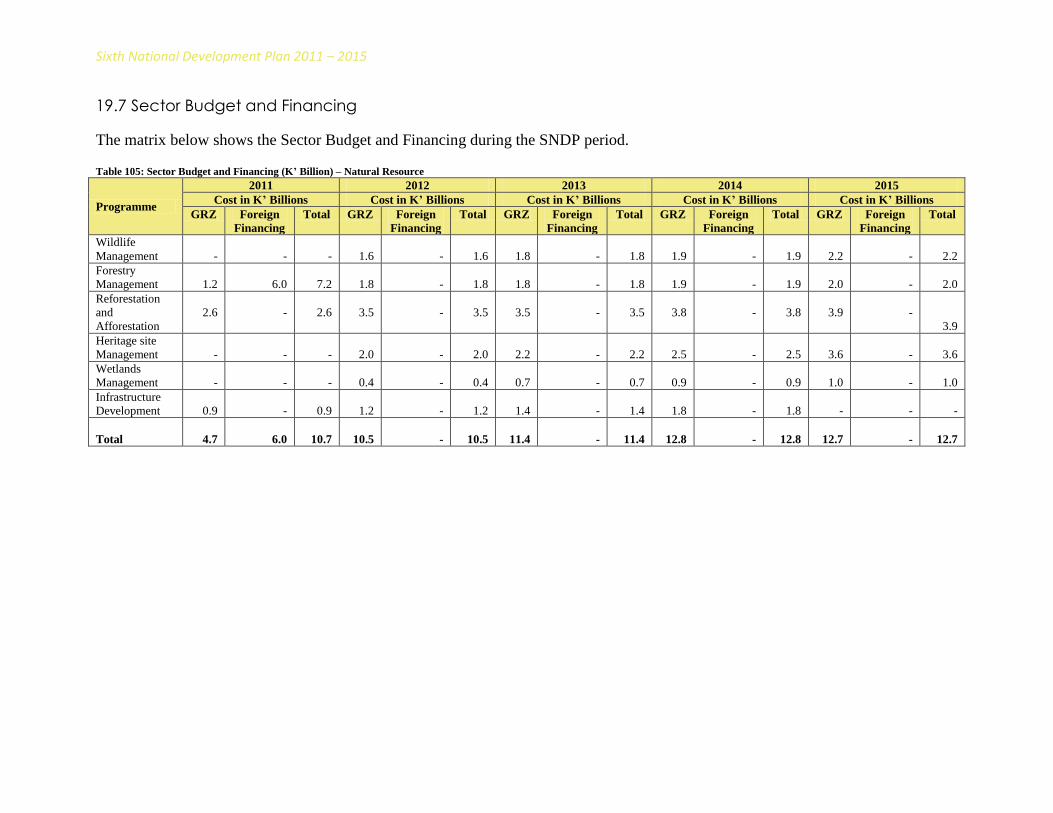
Sixth National Development Plan 2011 – 2015
19.7 Sector Budget and Financing
The matrix below shows the Sector Budget and Financing during the SNDP period. Table 105: Sector Budget and Financing (K’ Billion) – Natural Resource
Programme
2011 2012 2013 2014 2015
Cost in K’ Billions Cost in K’ Billions Cost in K’ Billions Cost in K’ Billions Cost in K’ Billions
GRZ Foreign
Financing
Total GRZ Foreign
Financing
Total GRZ Foreign
Financing
Total GRZ Foreign
Financing
Total GRZ Foreign
Financing
Total
Wildlife
Management
-
-
-
1.6
-
1.6
1.8
-
1.8
1.9
-
1.9
2.2
-
2.2
Forestry
Management
1.2
6.0
7.2
1.8
-
1.8
1.8
-
1.8
1.9
-
1.9
2.0
-
2.0
Reforestation
and
Afforestation
2.6
-
2.6
3.5
-
3.5
3.5
-
3.5
3.8
-
3.8
3.9
-
3.9
Heritage site
Management
-
-
-
2.0
-
2.0
2.2
-
2.2
2.5
-
2.5
3.6
-
3.6
Wetlands
Management
-
-
-
0.4
-
0.4
0.7
-
0.7
0.9
-
0.9
1.0
-
1.0
Infrastructure
Development
0.9
-
0.9
1.2
-
1.2
1.4
-
1.4
1.8
-
1.8
-
-
-
Total
4.7
6.0
10.7
10.5
-
10.5
11.4
-
11.4
12.8
-
12.8
12.7
-
12.7
Sixth National Development Plan 2011 – 2015
168
20. LOCAL GOVERNMENT AND DECENTRALISATION
20.1 Introduction
Effective and efficient delivery of public serviceat the local level is an important aspect of the
Local Government administration system. Therefore, the National Decentralization Policy
(NDP) seeks to improve the functioning of the local government system by increasing
responsibilities of the local authorities through devolution of power with matching resources and
embodying democratic principles.
During the FNDP period, a number of successes were scored and key among them was the
approval of the Decentralisation Implementation Plan (DIP) which was cardinal for defining a
way forward for decentralisation policy implementation.
Consequently, during the SNDP period the sector will focus on full implementation of the DIP to
ensure that the Councils become the focal point of national development and service delivery at
the local level.
20.2 Review of Past Performance
The sector managed to developsector devolution plans for the 14 devolving Ministries as well as
strategic plans and organizational structures for all the three types of Councils namely city,
municipal and district. Furthermore, the sector undertook measures to reduce the indebtedness
and improve the operational capacities of the councils.In addition, service charters were
developed for all councils. Furthermore, the Local Government Service Commission was
established and the DIP was approved.
However, some of the challenges which were encountered during the FNDP period included the
failure to devolve functions to the councils as was planned due to the delays in approving the
DIP and weak financial and human capital capacities of councils. Valuation rolls are meant to
widen the revenue base for councils but only 31 valuation rolls were updated between 2006 and
2009 against the target of 95. Consequently, no direct transfers of resources were made to any
council.
20.3 Vision, Goal and Strategic Focus
Vision
“A country with a fully decentralised and democratically elected system of governance by 2030”.
Goal
To improve service delivery by councils in line with the National Decentralisation Policy.

Sixth National Development Plan 2011 – 2015
169
Strategic Focus
The sector will focus on full implementation of the DIP with special emphasis on devolution of
functions, fiscal decentralization, reforming the local development planning system, institutional
and human capacity development and completion of updating valuation rolls. Further, efforts
will be intensified to enhance collaborations with Traditional Authorities on issues of land for
development.
20.4 Policies and Key Reforms
The Sector will continue implementing the National Decentralisation Policy. To facilitate smooth
implementation of the policy, the sector will harmonise various policies and pieces of legislation.
The sector will review the Registration and Development of Villages Act, the Chiefs Act, the
Local Government Act, the Rating Act and development of the Local Government Finance Act.
Further, the Urban and Regional Planning Bill will be finalized into the new Urban and Regional
Planning Act.
Local government has the mandate to formulate local policies and by-laws that should promote
and guide development activities in the districts and, therefore, constitute the first line of
assistance and action to the community during periods of stress caused by climate-related
disasters. It is, therefore, incumbent upon district councils to integrate climate change adaptation
and mitigation into their district development plans.
20.5 Objectives, Strategies and Programmes The Table below shows the objectives, strategies and programmes for the Local Government and
Decentralisation Sector during the SNDP period. Table 106: Objectives, Strategies and Programmes
No. Objectives Strategies Programmes
1 To increase stakeholders‟ awareness, and
ownership of the decentralization
process.
Conduct nation-wide sensitisation on
National Decentralization Policy and
DIP.
Sensitization and Civic
Education
2 To develop a comprehensive legal and
regulatory framework
Review and align the current legal and
regulatory framework to the National
Decentralization Policy.
Legal and regulatory Reforms.

Sixth National Development Plan 2011 – 2015
170
No. Objectives Strategies Programmes
3 To create and strengthen Human,
Institutional and Technical Capacities in
Councils and key institutions
a) Develop and implement a
comprehensive Capacity Development
Programme for Local Government;
b) Operationalise the Local Government
Service Commission;
c) Implement Institutional Restructuring
Programme for Councils;
d) Undertake Local Development
Planning and Budgetary Reforms;
e) Undertake Financial Management and
Accounting Reforms;
f) Undertake Fiscal Decentralization and
Revenue Mobilization Reforms;
g) Develop a framework for monitoring
the implementation of the National ;
and
h) Decentralization Policy and the
operations of Councils.
Institutional and Human
Resource Capacity
Development
4 To widen the Financial Base for
Councils
a) Update valuation rolls; and
b) Introduce new levies depending on the
area the council is situated.
5 To achieve timely and effective
devolution of designated functions from
sector Ministries to Councils
a) Develop a consolidated Sector
Devolution Plan;
b) Devolve Sector functions to Councils;
and
c) Enhance the capacity of DRM in the
districts.
Sector Devolution
6 To create an environment that is
conducive to investment under
customary land tenure system
a) Develop and implement capacity
building programmes for conflict
resolution at chiefdom level;
b) Develop guidelines on resolution of
succession and boundary disputes;
c) Interpret and reinforce Chiefs‟
boundary maps of 1958; and
d) Finalisation of the Chiefs‟ policy and
Review of the Act.
Traditional Customary matters
7 To ensure climate change, risk
management, mitigation and adaptation
issues are integrated in district plans
a) Assess risks and vulnerability in the
districts; and
b) Develop risk management and
mitigation and adaptation plans.
Climate Change Adaptation
and Mitigation
20.6 Implementation, Monitoring and Evaluation
To effectively monitor and evaluate the implementation of sector programmes, the following
output matrix and key performance indicators table will be used: Table 107: Sector Output Matrix
Programmes Projects/Activities to be
implemented
Annual targets Total Output
Expected end of
SNDP
Responsible
Institutions(s)
Key
Stakeholders 2011 2012 2013 2014 2015
Sensitisation
and Civic
Education
Advocacy and
Sensitisation
programmes on National
Decentralisation Policy
implementation
24 24 25 0 0 73 districts
sensitised DS/MLGH
222 600 600 0 0 1422 ADCs
sensitised Councils

Sixth National Development Plan 2011 – 2015
171
Programmes Projects/Activities to be
implemented
Annual targets Total Output
Expected end of
SNDP
Responsible
Institutions(s)
Key
Stakeholders 2011 2012 2013 2014 2015
Legal and
Regulatory
Reforms
Review of Legislation 3 3 3 3 3
15Pieces of
Legislation
Reviewed
DS/MLGH MOJ,
National
Assembly
Institutional
and Human
Resource
Capacity
Development
Establishment of ADCs 222 600 600 0 0
1,422 ADCs
Established and
functional
DS/MLGH,
Cabinet Office,
Councils
Implementation of the
MTEF/ABB; integrated
charter of accounts;
integrated information
management system
through connecting all
councils to WAN
0 10 20 23 20
73 councils
implementing
financial system
DS/MLGH,
Councils
Sector
Devolution Devolution of functions 0 4 4 3 3
14 Ministries
devolved as per
Devolution Plan
DS/MLGH,
MOJ, Cabinet
Office, Sector
Ministries
Climate
Change and
Disaster
Response
Undertake Vulnerability
Assessments at District
level
41 32 - - -
Number of
districts that have
undertaken
vulnerability
assessment
DS/MLGH,
DMMU,
Councils
Integrate Risk
Management, and
Mitigation Plans at
District level
20 27 26 - -
Number of
districts with
Integrated
Climate Change
response Plans
DS/MLGH,
DMMU,
Councils
Table 108: Key Performance Indicators
Key Performance Indicators Baseline
2010
Annual target Overall
Target 2011 2012 2013 2014 2015 Name Definitions
Number of ADCs
established and
functional
ADCs that will be established
in line with National
Decentralisation Policy
0 222 600 600 0 0 1,422
Number of Acts
reviewed and
enacted
Acts related to devolution
enacted 0 3 3 3 3 3 15
No. of Districts
with IDPs
developed
Development of IDPs involves
a preparation and ministerial
approval of the IDP. The
preparation process involves
consultation, collection,
compilation and analysis of
data. Other processes involve
the development of frameworks
and preparation of the plan,
budgets, approval and
implementation
0 15 20 13 12 13 73
% of local revenue
collected by
Councils against
budget
The proportion of local revenue
collected by councils against
their budgets 43 53 65 80 >80 >90 >95

Sixth National Development Plan 2011 – 2015
172
Key Performance Indicators Baseline
2010
Annual target Overall
Target 2011 2012 2013 2014 2015
Number of
constituencies
reporting on
expenditure of CDF
within a given
financial year
The Constituency Development
Fund is allocation by
government to finance micro-
projects implemented at
constituency level in the
financial year
- - 75 100 150 150 150
No. of ministries
that have devolved
functions to
Councils
Number of Ministries that have
devolved functions to Councils
in line with the National
Decentralisation Policy
0 0 0 4 5 5 14
Contribution of
property tax to total
council revenue per
year
The proportion of council tax in
total council revenue 31 12 25 37 52 64 64
Number of districts
with reduced
vulnerability to
floods and droughts
Districts which attain reduced
risk to disasters such as floods
and droughts 45 40 38 <35 <35 <35 <35

Sixth National Development Plan 2011 – 2015
20.7 Sector Budget and Financing
The Table below shows the Sector Budget and Financing during the SNDP period. Table 109: Sector Budget and Financing (K’ Billion) – Local Government and Decentralisation
Programme
2011 2012 2013 2014 2015
Cost in K’ Billions Cost in K’ Billions Cost in K’ Billions Cost in K’ Billions Cost in K’ Billions
GRZ Foreign
Financing
Total GRZ Foreign
Financing
Total GRZ Foreign
Financing
Total GRZ Foreign
Financing
Total GRZ Foreign
Financing
Total
Sensitisation and Civic
Education
0.5
-
0.5
0.5
-
0.5
0.5
-
0.5
0.5
-
0.5
0.5
-
0.5
Legal and Regulatory
Reforms
10.5
-
10.5
10.5
-
10.5
10.5
-
10.5
7.5
-
7.5
4.5
-
4.5
Institutional and
Human Resource
Capacity Development
0.4
0.6
0.4
0.4
-
0.4
0.4
-
0.4
0.4
-
0.4
0.4
-
0.4
Sector Devolution
3.1
0.5
3.1
3.0
-
3.0
2.0
-
2.0
1.0
-
1.0
1.0
-
1.0
Total
14.5
1.1
14.5
14.4
-
14.4
13.4
-
13.4
9.4
-
9.4
6.4
-
6.4

Sixth National Development Plan 2011 – 2015
174
21. SOCIAL PROTECTION
21.1 Introduction
Social protection policies and programmes seek to promote the livelihoods and welfare of the
poorest and those most vulnerable to risks and shocks. Social protection is a poverty reduction
strategy that promotes human development, social equity and human rights. The high levels of
extreme poverty and vulnerability, coupled with multiple effects of HIV and AIDS and
unemployment provide a strong justification for the need for social protection.
During the FNDP period, the sector pioneered the use of innovative approaches to empowering
low capacity households in cassava production, processing and marketing, and delivering social
assistance through cash transfers and vouchers. National guidelines on children‟s homes and the
National Communication Strategy on Sexual and Gender-Based violence were developed.
Despite these successes the sector faced a number of constraints in the implementation of social
protection programmes major among them were the absence of a social protection policy to
guide programme development, weak administrative capacity, poor monitoring and evaluation
and poor coordination among stakeholders and across sectors.
Under the SNDP, the focus will be to effectively coordinate and provide social protection
through empowering low capacity households, providing social assistance to incapacitated
households and supporting various vulnerable groups.
21.2 Review of Past Performance
Social protection, during the FNDP period, was focused on improving food security among low
capacity households, social cash transfers to the incapacitated, chronically poor and vulnerable,
child protection and enhancement of vulnerable people‟s access to justice. A total of 78,671 low
capacity households received food security packs.
The Social Cash Transfers Scheme supported 7,563 households (2,708 males and 4,855 females)
and 4,343 individuals (1,567 males and 2,776 females). Results under this scheme show that
individuals and households accessing social cash transfers have seen notable improvements in
their lives, including reduced hunger and better school attendance for children.
With regard to child protection, the programme sought to provide adequate legal and social
protection to children living in difficult circumstances or in need of care. Under the programme,
a total of 3,365 street children were re-integrated with their families and communities. In
addition, Government constructed two children‟s homes in Chikumbi and Mufulira.
Further, to enhance vulnerable people‟s access to justice, the National Communication Strategy
on Sexual and Gender Based Violence (SGBV) was developed to create awareness and combat
gender-based violence and human trafficking in the country.

Sixth National Development Plan 2011 – 2015
175
21.3 Vision, Goal and Strategic Focus
Vision
“A nation with capacity to promote and provide sustainable security against constant or periodic
critical levels of deprivation and extreme vulnerability by 2030”.
Goal
To empower low capacity households and provide social assistance to incapacitated households
and support to vulnerable people to live decent lives.
Strategic Focus The strategic focus of the sector will be to promote human development and dignity through
provision of skills, financial assistance, agricultural inputs and access to services to low capacity
and incapacitated households and other vulnerable persons.
21.4 Policies and Key Reforms
A key objective in the SNDP period is the development of the Social Protection Policy.In the
process, policies including the National Child Development Policy, Youth Policy, Gender
Policy, Health Policy and Education Policy will be taken into consideration to ensure conformity
and harmonization with the Social Protection Policy. Furthermore, the sector will address cross-
cutting issues among them gender, HIV and AIDS, climate change, disability, sexual and gender
based violence and human trafficking.
21.5 Objectives, Strategies and Programmes
The Table below shows the objectives, strategies and programmes for the Social Protection
Sector during the SNDP period. Table 110: Objectives, Strategies and Programmes
No. Objectives Strategies Programmes
1. To empower Low Capacity
Households
(LCHs).
a) Provide access to finance, agricultural inputs
and training to vulnerable groups; and
b) Expand social security coverage to formal and
informal sectors.
Empowerment of Low
Capacity Households
2. To provide Social Assistance
to Incapacitated Households.
a) Provide regular, predictable transfers to the
chronically poor to support basic needs and
human development; and
b) Provide discrete transfers in response to shocks
to people at risk of rapid deterioration in
economic & social wellbeing and security;
Social Assistance to
Incapacitated Households
3. To provide care and support
to vulnerable children and
youth.
a) Provide places of safety, vocational and life
skills training to vulnerable children and youth;
and
b) Support school attendance of vulnerable
children and youth‟.
Support for Vulnerable
Children and Youth
4. To ensure the protection
of human rights and
provision of services to
vulnerable groups
a) Establish one stop centres and places of safety
in all the Provincial centers; and
b) Provide empowerment for survivors of
violence & human trafficking through the
provision of livelihood services.
Enhancementof Access to
Justice for Vulnerable groups

Sixth National Development Plan 2011 – 2015
176
21.6 Implementation, Monitoring and Evaluation
To effectively monitor and evaluate the implementation of sector programmes, the following
output matrix and key performance indicators table will be used: Table 111: Sector Output Matrix
Programmes Projects to be
implemented
Annual Targets Total Output
Expected end of
SNDP
Responsible
Institution(s)
Key
Stakeholders
2011 2012 2013 2014 2015
Empowerment of Low
capacity
Households
Micro-credit to LCHs by MBT (Chongwe,
Kabwe, Lusaka,
Kafue, Chingola, Monze, Mongu,
Petauke, Chipata,
Lundazi, Mpika,
Mansa, Gwembe,
Senanga, Mufulira,
Masaiti&Keembe)
12,000 13,500 15,000 16,500 18,000
75,000
Beneficiaries supported
MCDSS, MBT
Community Self Help
Initiatives (Nation-
wide)
500 600 700 800 1,000 1,000 Initiatives supported
MCDSS,
PUSH
Food Security Pack Programme (Nation-
wide)
25,000 30,000 35,000 40,000 45,000 175,000 House
Holds supported
MCDSS
Women Development groups (Nation-wide) 2,500 3,000 3,500 4000 4,500
17,500 Women Development
.groups supported
MCDSS/GIDD
Functional literacy &
skills training (Nation-wide)
30,000 35,000 40,000 45,000 50,000
200,000
Persons/individuals supported
MCDSS, MoE,
MSYCD
Social
Assistance to Incapacitated
Households
Public Welfare
Assistance Scheme (PWAS) (Nation-
wide)
75,000 100,000 150,000 200,000 250,000 250,000 Individuals
MCDSS
Social Cash Transfer Scheme (Katete,
Chipata, Monze,
Kazungula, Kalomo, Luwingu, Serenje,
Shang‟ombo, Kalabo,
Kaputa, Chiengi, Senanga, Zambezi,
Chilubi Island
&Milenge)
26,500 38,500 54,000 62,200 69,000 69,000 House
Holds supported
MCDSS
Old Age Pension (Katete)
4,500 10,000 50,000 100,000 300,000 300,000 Individuals supported
MLSS
Support for
Vulnerable Children
Expanding the scope
of rehabilitation centres (Provincial
Centres)
1 2 2 2 2 9 Rehabilitation Centres expanded
MCDSS,
MSYCD, CSOs
School feeding
(Eastern, Southern, Western & Lusaka
provinces)
400,000 550,000 700,000 850,000 1,000,000
1,000,000 School
Going Children
supported
MCDSS,MOE,
WFP
Enhancement of Access to
Justice for
Vulnerable Groups
Establish one stop centres in all
provincial
headquarters. (Provincial Centres)
1 2 2 2 2 9 One stop centres established
MCDSS, GIDD, MOHA,
CSOs

Sixth National Development Plan 2011 – 2015
177
Table 112: Key Performance Indicators
Indicator Definition Baseline
Values 2011 2012 2013 2014 2015
Percentage of Low
Capacity Households
receiving agricultural
support under the FSP
programme who graduate
within the prescribed
period.
The percentage of
households
receiving
agricultural
support under the
FSP programme
who graduate
within the
prescribed period
- 10 - 25 - 50
Percentage of social cash
transfer beneficiary
households who are
judged as severely food
insecure
Households on
cash transfer
scheme judged as
severely food
insecure (Food and
Nutrition
Technical
Assistance‟s
(FANTA)
Household Food
Insecurity and
Access Scale
(HFIAS).
-
50 -
30 -
20

Sixth National Development Plan 2011 – 2015
21.7 Sector Budget and Financing
The matrix below shows the Sector Budget and Financing during the SNDP period. Table 113: Sector Budget and Financing (K’ Billion) – Social Protection
Programmes
2011 2012 2013 2014 2015
Cost in K’ Billions Cost in K’ Billions Cost in K’ Billions Cost in K’ Billions Cost in K’ Billions
GRZ Foreign
Financing
Total GRZ Foreign
Financing
Total GRZ Foreign
Financing
Total GRZ Foreign
Financing
Total GRZ Foreign
Financing
Total
Empowerment of
Low Capacity
Households
37.6
-
37.6
40.1
40.1
41.2
41.2
42.5
42.5
43.4
43.4
Social Assistance
to Incapacitated
Households
17.3
44.0
61.3
22.2
44.5
66.7
26.5
47.0
73.5
29.7
42.2
71.9
31.8
36.2
68.0
Support for
Vulnerable
Children and Youth
4.0
-
4.0
4.8
-
4.8
5.2
-
5.2
5.2
-
5.2
4.5
-
4.5
Enhancement of
Access to Justice
for Vulnerable
groups
2.5
-
2.5
2.5
-
2.5
2.5
-
2.5
2.0
-
2.0
2.0
-
2.0
Total
61.4
44.0
105.4
69.6
44.5
114.1
75.4
47.0
122.4
79.4
42.2
121.6
81.7
36.2
117.9

Sixth National Development Plan 2011 – 2015
179
Part VI
Regional Development

Sixth National Development Plan 2011 – 2015
180
22. REGIONAL DEVELOPMENT
22.1 Introduction
Regional16
development is aimed at promoting balanced development, coordinated through a
decentralized and coherent process. The nine provinces comprise 73 districts, including the
newly created Ikelenge District in North-Western Province. In terms of regions, most of the
development is concentrated in four of the nine provinces, namely Copperbelt, Central, Lusaka
and Southern, which are along the line of rail. The other five provinces namely Eastern,
Northern, North-Western, Western and Luapula have registered slower development and have
continued to be predominantly rural.
During the Fifth National Development Plan (FNDP) period, some achievements were registered
in infrastructure development. This was made possible, by Government‟s deliberate policy to
tackle the infrastructure deficits which had accumulated over time in the regions through
decentralised (de-concentrated) implementation of development programmes in health,
education, roads and agriculture.
A fundamental economic challenge was to ensure that the economic gains of the country during
the FNDP period impacted all the regions proportionately. Furthermore, poverty continued to be
more concentrated in rural areas than urban areas. The major challenge was poor infrastructure.
Others were low production and productivity in the agriculture sector, low human capacity
especially in education and health, slow rate of rural electrification and high cost of production.
Poor infrastructure continues to impact on competitiveness and quality of service delivery and
life.
In order to achieve economic and social development and to also bridge the inter and intra-
regional disparities, the Sixth National Development Plan (SNDP) will focus on improving
productivity in the regions based on comparative advantage and socio-economic needs. In line
with the strategic focus for the Plan, regional development will focus on infrastructure
development in roads, housing, agriculture, rail, Information and Communication Technology
(ICT) and energy while education, health and water and sanitation will continue to be important
areas of focus for human development. Similarly, in line with the priority sectors of the Plan, the
focus of investments in the regions will be in agriculture, tourism, energy, manufacturing,
education and skills development, health, and water and sanitation. The SNDP will build on the
regional strengths and endowments to foster rural investment to maximise social and economic
development.
22.2 Review of Past Performance
During the period under review, progress was made in implementing economic and social
investment programmes in all the regions. Focus was on infrastructure investment in education,
health and agriculture. A number of schools, health posts, district hospitals, dams and feeder
16Region is defined in terms of the provincial boundaries

Sixth National Development Plan 2011 – 2015
181
roads were constructed and/or rehabilitated. However, development varied over the years within
the regions as rural investment continued to lag behind that of urban areas.
Regional performance of the key sectors and interventions are highlighted below.
Rural Roads
Rural Roads Units were established in all the provinces in 2008 in order to improve and enhance
productivity and connectivity. The major feeder roads constructed and rehabilitated during the
review period are indicated in Table below. Table 114: Rural Roads - 2009
Province Kilometres Constructed Kilometres Rehabilitated Kilometres Graded
Target Actual Target Actual Target Actual
Central - - 300.0 294.0 300.0 590.0
Copperbelt - - 1,000.0 645.0 236.0 252.0
Eastern - - 168.4. 98.4 642.0 458.4
Luapula - - 637.0 234.9 708.5 825.0
Lusaka - - 212.7 117.5 1,388.7 714.6
Northern 8.0 8.0 564.2 397.0 572.2 405.0
North-Western - - - - 444.9 384.0
Southern - - 1,300.0 1,219.6 - 746.5
Western 40.0 33.5 210.0 189.9 - 25.5
Grand Total 48.0 41.5 4,392.3 3,196.3 4,292.3 4,401 Source: Rural Roads Unit
Agriculture
The agriculture sector over the FNDP period achieved a number of successes in the regions. All
key crops recorded an increase in production especially maize and cassava. Maize production
increased in all the regions recording an increase of 1,960,503 Mt between 2004/2005 and
2009/2010 farming seasons, representing an increase of 235 percent. The provinces with the
highest production increase were Central, Southern, Eastern and Northern recording 587,314 Mt,
410,238 Mt, 346,180 Mt and 215, 393 Mt respectively.
During the same period, cassava production also recorded an increase of 3,662,629 Mt
representing 347 percent over the 2005 production levels. The provinces with the highest
production increase were Northern, Luapula, North-Western and Western recording 1,338,984
Mt, 1,119,698 Mt, and 527,431 Mt 492,270 Mt, respectively.
All key crops recorded an increase in production over the period under review as indicated in the
Table below.

Sixth National Development Plan 2011 – 2015
182
Table 115: 2005 and 2010 Crop Production Figures (in Metric Tonnes)
Perio
d Crop Central Copperbelt Eastern Luapula Lusaka Northern
North
Western Southern Western
Total
Production
2010
Maize 717,444 233,223 548,553 69,363
121,74
0 308,078 130,860 582,984 91,238 2,795,483
2005 130,130 64,598 202,373 23,252 29,322 92,685 34,977 172,746 84,897 834,980
2010 Sorghum
4,223 1,009 2,409 1,421 558 2,418 2,237 10,413 3,045 27,732
2005 2,240 2,690 880 543 139 856 4,013 1,994 5,359 18,714
2010 Millet
2,255 389 1,321 1,704 - 34,498 418 1,936 5,476 47,997
2005 770 75 607 1,929 - 22,767 222 1,464 1,749 29,583
2010 Paddy
Rice
259 34 5,120 3,311 156 20,992 945 25 11,088 41,929
2005 60 - 2,834 1,310 3 6,807 212 - 2,110 13,337
2010 Wheat
89,682 16,445 143 - 42,075 - 840 23,071 - 172,256
2005 48,788 42,048 731 - 26,928 11 - 18,327 - 136,833
2010 Groundn
uts
19,687 9,466 49,854 13,776 1,719 34,858 5,229 23,024 6,120 163,733
2005 4,095 3,156 21,457 10,299 339 22,746 5,423 5,282 1,421 74,218
2010 Soya
Beans
43,342 12,768 7,888 170 21,250 5,178 934 20,318 39 111,888
2005 25,159 30,850 9,852 122 10,322 3,466 303 9,586 1 89,660
2010 Sunflowe
r
2,507 123 18,363 16 415 2,115 14 2,817 51 26,420
2005 957 105 4,761 37 313 1,154 92 688 5 8,112
2010 Mixed
Beans
14,987 3,040 1,595 1,984 1,495 35,988 4,658 1,090 428 65,265
2005 1,206 674 585 1,843 1,366 14,159 2,979 99 187 23,098
2010
Cassava 172,005 35,985 16,923
1,472,40
2 4,012 1,765,608 633,031 8,119 610,542 4,718,629
2005 30,624 12,672 7,392 352,704 1,056 426,624 105,600 1,056 118,272 1,056,000
2010 Sweet
Potatoes
75,929 53,955 5,083 16,982 7,060 49,122 12,281 27,541 4,913 252,867
2005 12,115 19,006 1,569 6,413 231 18,075 5,684 1,499 2,333 66,926
Source: Ministry of Agriculture and Cooperatives
Tourism
The tourism sector focused on infrastructure development, opening up of new areas for tourism,
investment promotion and marketing, product diversification, enforcement of standards and
provision of quality services. In Northern Province, a Provincial Tourism Information Centre
was established to facilitate the opening up of the Northern circuit (which comprises Northern
and Luapula provinces) to tourism. Marketing of tourism potentials in Luapula Province was also
undertaken during the period under review.
As a way of promoting cultural tourism, provincial cultural villages were initiated and
construction was on-going in Central, Copperbelt and Southern Provinces. In Eastern Province,
200 kilometres of park roads was rehabilitated. Southern Province implemented some
components under the Support for Expansion and Economic Diversification (SEED) project
which included, street lighting, rehabilitation of township roads and the Mukuni Park.
Natural Resources
During the FNDP period, efforts were made to promote sustainable use of natural resources by
facilitating alternative livelihoods. Beekeeping activities were scaled-up in all the nine provinces
with a honey factory and storage facility rehabilitated in North-Western province. In North-
Western and Copperbelt provinces, some of the honey produced was exported. In addition to
beekeeping, mushroom production was enhanced through construction of mushroom growing
infrastructure in Central and Copperbelt provinces.
In Eastern Province, the Luangwa Valley Ecosystem Partnership Management Initiative was
developed to address environmental and natural resources concerns. Other notable achievements
in the provinces included expansion of forestry plantations. In Northern Province, 280 hectares
of pine were planted in Kasama and Nakonde, while on the Copperbelt 67 hectares were planted
in Mufulira and Ndola. Other regional programmes included timber processing and bio-diversity
conservation in all the provinces. In addition,the Bio-Mass Project commenced in Kaputa

Sixth National Development Plan 2011 – 2015
183
District. However, deforestation continued to be a major threat to forestry development through
charcoal burning, uncontrolled logging and poor land management.
Education
In the education sector, a number of schools, classrooms and teachers‟ houses were rehabilitated,
expanded and constructed in all the provinces in order to increase access to education. Access to
education varied among the regions, the Copperbelt had the highest completion rates at 76
percent while Eastern Province had the lowest rate of 27 percent. In terms of enrolment, Eastern
Province had the highest level at 55.5 percent while Western Province had the lowest at 45
percent. The Table below indicates the Basic Education infrastructure projects that were
implemented. Table 116: Basic Education Infrastructure during the FNDP Period 2006 - 2009 Province Basic Schools Classrooms Teachers’ Houses Laboratories
Constructed Rehabilitated Constructed Rehabilitated Constructed Rehabilitated Constructed Rehabilitated
Central 26 - 126 219 34 117 7 -
Copperbelt 7 1 340 56 27 - 6 -
Eastern 12 - 616 318 291 256 13 1
Luapula 6 - 584 56 145 165 4 -
Lusaka 16 - 213 219 74 93 12 14
Northern 42 30 420 452 78 120 6 8
North-Western 5 - 500 102 67 - - -
Southern 5 - 643 163 96 27 16 -
Western 59 54 267 - 16 - - -
Grand Total 178 85 3,709 1,585 828 778 64 23
Source: Ministry of Education and Provinces
Health
The health sector benefited from increased infrastructure investments. The main aim of the sector
was to improve access to health for the regions. Malaria continues to be the leading cause of
illness and mortality in all the provinces with Eastern recording the highest incidence at 358 per
1,000 compared to the national average of 252 per 1,000 while Southern recorded the lowest at
117 per 1,000. The Table below highlights programmes implemented in the health sector by
region. Table 117: Health Related Infrastructure Constructed during the FNDP Period Province Hospitals Rural Health Centres Health Post Maternity Blocks
Constructed On-
going
Rehabilitated Constructed On-
going
Rehabilitated Constructed On-
going
Rehabilitated Constructed On-
going
Rehabilitated
Central - 2 4 10 - 11 28 - 11 1 - 1
Copperbelt 1 - - 16 - 6 12 - - 6 - 4
Eastern - 2 1 - - 15 4 - - 5 - -
Luapula - 2 - 12 - - 3 - - 8 - -
Lusaka 1 - 2 - - - - - - - - -
Northern 1 3 5 2 - 6 28 - 3 9 - 3
North-
Western
- 2 4 3 - 4 14 - - 4 - -
Southern - - 3 - - 18 13 - - 4 - -
Western 2 - 1 12 - 1 6 - - 4 - -
Grand
Total
5
11
20
55
-
61
108
-
14
41
-
8
Source: Ministry of Health and Provinces

Sixth National Development Plan 2011 – 2015
184
Water and Sanitation
During the FNDP period, dams and boreholes were constructed and rehabilitated in all the
provinces as indicated in the Table below. It was however, noted that provision of water and
sanitation services to some of the newly constructed health and education facilities was
inadequate because of the poor sectoral linkages. Provision of water and sanitation in the
provinces still remains a challenge and will be an important focus in achieving human
development. Table 118: Water Programmes by Province
Province /
Programme
Dam Construction Dam Rehabilitation Borehole Construction Borehole
Rehabilitation
Target Achieved Target Achieved Target Achieved Target Achieved
Central 4 2 30 17 158 112 14 4
Copperbelt 5 4 7 7 - 55 - -
Eastern 4 3 4 2 520 290 - -
Luapula 7 1 11 3 350 128 200 34
Lusaka 5 1 5 4 12 12 - 3
Northern 4 0 5 4 - 694 - 459
North-Western 2 2 2 2 - 508 - 147
Southern 5 4 20 32 550 55 500 127
Western 2 - - 6 - 394 - 382
Grand Total 38 17 84 77 1,590 2,248 714 1,156 Source: Ministry of Energy and Water Development and the Provinces
Cross-cutting Issues
During the FNDP period, cross-cutting issues such as environment, governance, gender and
development, Nutrition, Human Immune-Deficiency Virus (HIV) and Acquired Immune-
Deficiency Syndrome (AIDS) continued to be mainstreamed in the development programmes.
Efforts were made to roll-out Anti Retro-Viral Therapy (ART) and Prevention of Mother-To-
Child-Transmission (PMTCT) to all districts. In the area of governance, local courts in all
provinces were constructed to enhance access to justice. In addition, Auditor General‟s offices
were opened and District Tender Committees were established to enhance accountability and
transparency.
However, challenges in mainstreaming cross-cutting issues were still prominent in all the
provinces mainly due to weak institutional linkages and capacity constraints. Under
environment, issues of water and air pollution, land degradation, wildlife depletion and waste
management still remained a challenge. In the area of gender, inadequate disaggregated data and
analytical skills in gender mainstreaming remained a challenge. As regards HIV and AIDS, the
reduction in the HIV prevalence rate was minimal mainly due to behavioural change resistance.
Human Development
Generally there was inadequate and poor distribution of skilled personnel to steer the
development agenda in provinces especially in rural areas. This has left rural health centres,
schools and agricultural camps being manned by skeleton staff and untrained personnel resulting
in poor service delivery.
The development of the Provincial Development Index (PDI) was motivated by the need to
gauge the regions in the country on how they were faring in terms of development. The Index
was developed to inform the development of the National Development Plans (NDPs) on the

Sixth National Development Plan 2011 – 2015
185
areas of focus of the plan. The PDI borrows from the indicators used in the development of the
Human Development Index (HDI). The PDI uses three main indicators, namely, education, life
expectancy and average household income. Like the indices in the HDI, these indicators provide
an outlook at life expectancy measured by the length and the quality of life, education which
comprises enrolment and completion rates and income which encompasses among others
productivity.
The PDI revealed that of the nine provinces, namely Central, Copperbelt, Eastern, Luapula,
Lusaka, Northern, North-Western, Southern and Western, only four were above the PDI of
0.385. Copperbelt and Lusaka province were above the average at 0.670 and 0.655 respectively,
while Southern and Central were just above the average index at 0.430 and 0.410 respectively.
These four provinces were notably along the line of rail and were predominantly urban. The
index also provides further evidence to the high rural poverty which was prevalent among the
predominantly rural province.
Interventions to reduce rural poverty should, therefore, be targeted at the five provinces
particularly Western which has the lowest at 0.181 and Eastern province at 0.217. A closer look
at the individual indices revealed that the Copperbelt province was the best performer with
regard to education while Eastern province was the worst. The income index shows that Lusaka
province (1.0) followed by Copperbelt province (0.841) were above the rest of the provinces
while Western, Northern and Eastern provinces were below the national minimum.
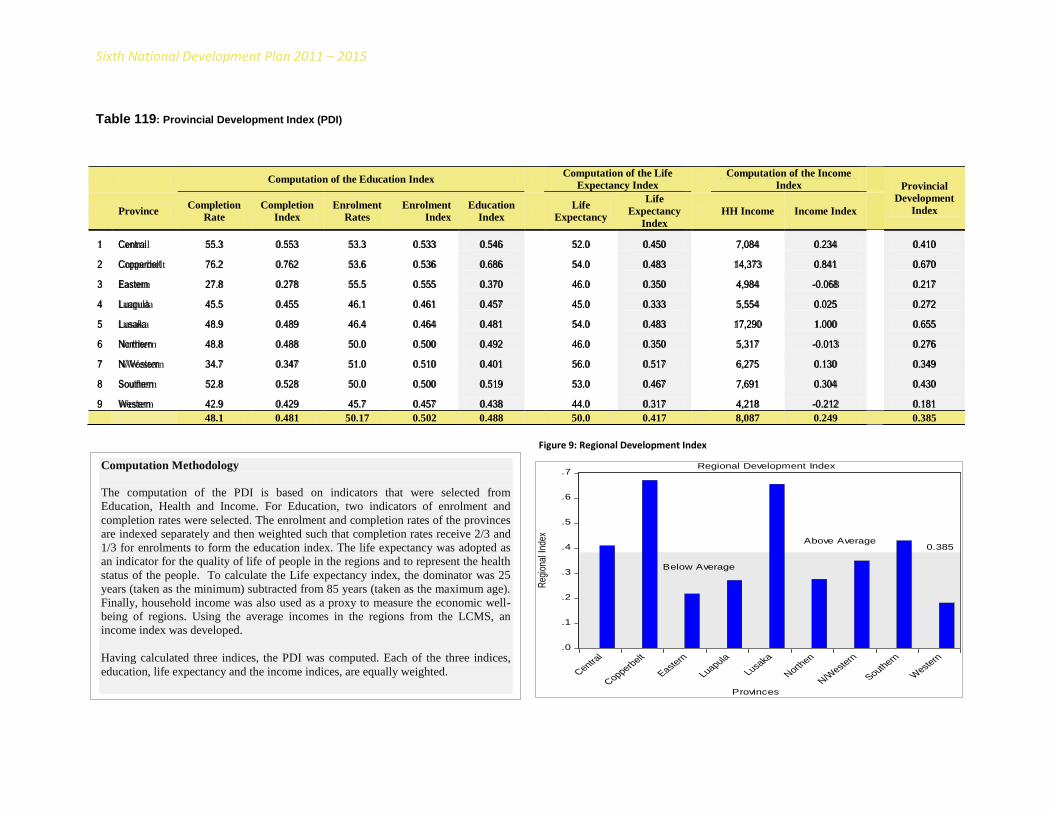
Sixth National Development Plan 2011 – 2015
Table 119: Provincial Development Index (PDI)
Figure 9: Regional Development Index
Computation of the Education Index Computation of the Life
Expectancy Index Computation of the Income Index
Provincial Development
Index Province Completion
Rate Completion
Index Enrolment
Rates Enrolment
Index Education
Index
Life Expectancy
Life Expectancy
Index HH Income Income Index
1 Central 55.3 0.553 53.3 0.533 0.546
52.0 0.450
7,084 0.234
0.410
2 Copperbelt 76.2 0.762 53.6 0.536 0.686
54.0 0.483
14,373 0.841
0.670
3 Eastern 27.8 0.278 55.5 0.555 0.370
46.0 0.350
4,984 -0.068
0.217
4 Luapula 45.5 0.455 46.1 0.461 0.457
45.0 0.333
5,554 0.025
0.272
5 Lusaka 48.9 0.489 46.4 0.464 0.481
54.0 0.483
17,290 1.000
0.655
6 Northern 48.8 0.488 50.0 0.500 0.492
46.0 0.350
5,317 -0.013
0.276
7 N/Western 34.7 0.347 51.0 0.510 0.401
56.0 0.517
6,275 0.130
0.349
8 Southern 52.8 0.528 50.0 0.500 0.519
53.0 0.467
7,691 0.304
0.430
9 Western 42.9 0.429 45.7 0.457 0.438
44.0 0.317
4,218 -0.212
0.181
48.1 0.481 50.17 0.502 0.488 50.0 0.417 8,087 0.249
0.385
Computation of the Education Index Computation of the Life
Expectancy Index
Computation of the Income
Index Provincial
Development
Index Province Completion
Rate
Completion
Index
Enrolment
Rates
Enrolment
Index
Education
Index
Life
Expectancy
Life
Expectancy
Index
HH Income Income Index
1 Central 55.3 0.553 53.3 0.533 0.546
52.0 0.450
7,084 0.234
0.410
2 Copperbelt 76.2 0.762 53.6 0.536 0.686
54.0 0.483
14,373 0.841
0.670
3 Eastern 27.8 0.278 55.5 0.555 0.370
46.0 0.350
4,984 -0.068
0.217
4 Luapula 45.5 0.455 46.1 0.461 0.457
45.0 0.333
5,554 0.025
0.272
5 Lusaka 48.9 0.489 46.4 0.464 0.481
54.0 0.483
17,290 1.000
0.655
6 Northern 48.8 0.488 50.0 0.500 0.492
46.0 0.350
5,317 -0.013
0.276
7 N/Western 34.7 0.347 51.0 0.510 0.401
56.0 0.517
6,275 0.130
0.349
8 Southern 52.8 0.528 50.0 0.500 0.519
53.0 0.467
7,691 0.304
0.430
9 Western 42.9 0.429 45.7 0.457 0.438
44.0 0.317
4,218 -0.212
0.181
48.1 0.481 50.17 0.502 0.488 50.0 0.417 8,087 0.249
0.385
Computation Methodology
The computation of the PDI is based on indicators that were selected from
Education, Health and Income. For Education, two indicators of enrolment and
completion rates were selected. The enrolment and completion rates of the provinces
are indexed separately and then weighted such that completion rates receive 2/3 and
1/3 for enrolments to form the education index. The life expectancy was adopted as
an indicator for the quality of life of people in the regions and to represent the health
status of the people. To calculate the Life expectancy index, the dominator was 25
years (taken as the minimum) subtracted from 85 years (taken as the maximum age).
Finally, household income was also used as a proxy to measure the economic well-
being of regions. Using the average incomes in the regions from the LCMS, an
income index was developed.
Having calculated three indices, the PDI was computed. Each of the three indices,
education, life expectancy and the income indices, are equally weighted.
.0
.1
.2
.3
.4
.5
.6
.7
Central
Copperbelt
Eastern
Luapula
Lusaka
Northen
N/West
ern
Southern
West
ern
0.385Above Average
Below Average
Regional Development Index
Reg
iona
l Ind
ex
Provinces

Sixth National Development Plan 2011 – 2015
187
22.3 Vision, Goal and Strategic Focus
Vision
“Sustainable and equitable socio-economic development through sectoral and regional inter-
linkages by 2030”.
Goal
To reduce the proportion of people living in poverty.
Strategic Focus
Regional development will be achieved through accelerated rural development by focusing on
the following sectors; agriculture, tourism, transport, manufacturing, mining, energy, natural
resources, education, health and water and sanitation. Particular attention will be given to
training of personnel for effective implementation of decentralised functions.
Major programmes to be undertaken will include the following:
(i) Rural electrification
(ii) Feeder roads and bridges
(iii) Housing and town planning
(iv) Disaster risk management
(v) Storage facilities
(vi) Provincial incubation centres
(vii) Infrastructure development in Education and Health, and
(viii) Boreholes and water reticulation systems.
22.4 Policies and Key Reforms During the SNDP period, regional development will be guided by various policies and reforms
implemented in the various sectors. Notably, implementation of the Decentralization
Implementation Plan (DIP) will play a key role in accelerating regional development.
22.5 Regional Priority Investments Given the different comparative advantages and needs of the provinces, the priority areas for
investments in the provinces are highlighted below.
22.5.1 Central Province Central Province has comparative advantage in maize, soya beans, sweet potatoes and wheat
production. The Province has huge potential for maize, sweet potatoes, wheat production due to
its fertile soils and good climatic conditions. Apart from agriculture, the Province has potential as
a transport hub not only for the country but for the SADC region, and has mineral deposits.
However, the Province is faced with several challenges that include poor infrastructure and low
agriculture production by peasant farmers. The main focus for the Province during the SNDP

Sixth National Development Plan 2011 – 2015
188
period will be the provision of relevant infrastructure for agriculture in order to tap its huge
agriculture potential.
The goal of the Province is poverty reduction through economic diversification and increased
investment in agriculture.
22.5.1.1 Objectives, Strategies and Programmes
The Table below shows the objectives, strategies and programmes for Central Province during
the SNDP period. Table120: Objectives, Strategies and Programmes
No. Objectives Strategies Programmes
Infrastructure
1 To enhance movement of goods and
services
a) Establish and rehabilitate feeder roads; and Infrastructure
Development b) Rehabilitate railway lines.
2 To increase electrification levels in the
Rural Areas
Connect rural areas to electricity power supply. Rural Electrification
3 To increase electricity generation
capacity and build appropriate
transmission lines
Expand and Improve infrastructure for electricity
generation, transmission and distribution.
Electricity Generation
and Transmission Line
Development
4 To improve standards in all fields of
engineering
Develop engineering capacity for relevant fields of
engineering.
Human Resource
Development
5 To ensure safety of civil aviation and
reliable weather forecasting
meteorological communication
a) Establish and rehabilitate infrastructure. Meteorological
Infrastructure
b) Provide professional development for ICT;
and
Human Development
c) Provide equipment. Meteorological
Equipment
Agriculture
1 To increase crop productivity a) Provide high yielding seed materials for crop
diversification;
b) Provide equipment and infrastructure for
agricultural extension services;
c) Establish storage facilities.
Crop Production and
Productivity
d) Establish and rehabilitate irrigation
infrastructure.
Irrigation
Development
2 To promote the strengthening of farmer
groups
Provide infrastructure for farmer group
enterprises development.
Farmer Group
Development
3 To increase livestock production and
livestock breeding
a) Establish, rehabilitate and equip livestock
development facilities; and
b) Establish farm power and mechanization
infrastructure.
Livestock
Development
4 To increase fish production Develop fisheries infrastructure. Fisheries Development
5 To improve agriculture research To improve agriculture research
infrastructure.
Research
Development
6 To improve human resource skills Training to support the upgrading of Skills of
technical and professional staff in research
and extension services.
Human resource
Development
7 To develop and identify areas for
resettlement
Provide infrastructure and social services. Resettlement Schemes
Development
Tourism
To develop and rehabilitate tourism
support infrastructure
a) Establish and rehabilitate tourism support
infrastructure; And
Tourism Infrastructure
Development

Sixth National Development Plan 2011 – 2015
189
No. Objectives Strategies Programmes
b) Develop skills for operators and higher level
training in tourism.
Human Resource
Development
Mining
1 To increase productivity a) Facilitate access to capital and equipment;
b) Increase extension services to small-scale
miners;
c) Provide incentives to small-scale miners
particularly those in the gemstone sector; and
d) Mitigate environmental impact of mining.
Development of
Mines
2 To improve human resource skills Develop mining safety and environmental
impact mitigation training.
Human Resource
Development
Education
1 To provide equitable access to quality
education
Establish, rehabilitate and upgrade education
facilities.
Infrastructure
Development
2 To improve standard of education
service delivery for early childhood and
basic education
a) Provide professional development for early
childhood and basic education; and
b) Provide equipment.
Human Resource
Development
Health
1 To provide infrastructure, conducive for
the delivery of quality health services
Establish, expand and rehabilitate health
infrastructure.
Infrastructure
Development
3 To improve the quality of health service
delivery
Provide professional development for heath
personnel.
Human Resource
Development
4 To ensure the availability of medical
equipment in health care facilities
Provide medical equipment. Medical Equipment
Provision
Water and Sanitation
1 To provide water for productive use Provide productive rural water supply
infrastructure (dams, weirs, irrigation
schemes).
Rural Water Supply
and Sanitation
2 To provide sustainable access to safe
water supply and sanitation facilities to
all communities
Develop and rehabilitate water points and
sanitation facilities.
Natural Resources
1 To promote reforestation of depleted
indigenous forests
Establish and expand nurseries and replant
depleted forests.
Reforestation
2 To promote environmentally friendly
technologies for income generation
a) Provide equipment for beekeeping
promotion; And
Enterprise
Development
b) Develop professional expertise in
beekeeping.
Human Development
22.5.2 Copperbelt Province
Copperbelt Province has comparative advantage in mining and wood and wood products. The
Province still remains highly dependent on the mining sector for its economic activity. It
currently has a Multi-Facility Economic Zone (MFEZ) under construction at Chambeshi in
Kalulushi while an Industrial Park will be established in Ndola. The Province has a well-
developed infrastructure and proximity of the districts within the Province. Challenges include
poor state of roads within the districts and collapse of the manufacturing industry which led to
loss of productivity and industrial base which impacted negatively on livelihoods. The focus in
the SNDP will be on economic diversification.
The goal of the Province is to diversify the economic base from mining to agriculture, forestry
and manufacturing.

Sixth National Development Plan 2011 – 2015
190
22.5.2.1 Objectives, Strategies and Programmes
The Table w shows the objectives, strategies and programmes for Copperbelt Province during
the SNDP period. Table 121: Objectives, Strategies and Programmes
No. Objectives Strategies Programmes
Infrastructure
1 To enhance movement of goods and
services
a) Establish and rehabilitate feeder roads;
b) Rehabilitate railway lines; and
c) Establish Railway line.
Infrastructure
Development
2 To provide adequate housing and office
accommodation for improved service
delivery
Establish and rehabilitate institutional
housing units and office blocks.
3 To increase electricity generation
capacity and build appropriate
transmission lines
a) Establish heavy fuel Oil Power Plant; and
b) Expand and Improve infrastructure for
electricity generation, transmission and
distribution.
Electricity Generation
and Transmission Line
Development
4 To increase electrification levels in the
Rural Areas
Connect rural areas to electricity power
supply
Rural Electrification
5 To improve standards in all fields of
engineering
Develop engineering capacity for relevant
fields of engineering.
Human Resource
Development
6 To ensure safety of civil aviation and
reliable weather forecasting
meteorological communication
a) Establish and rehabilitate infrastructure; And Meteorological
Infrastructure
Development
b) Provide equipment. Meteorological
Equipment
Agriculture
1 To increase crop productivity a) Provide high yielding seed materials for crop
diversification;
b) Provide equipment and infrastructure for
agricultural extension services;
c) Establish farm power and mechanization
infrastructure;
d) Establish storage facilities; And
Crop Production and
Productivity
e) Establish and rehabilitate irrigation
infrastructure.
Irrigation Development
2 To promote the strengthening of farmer
groups
Provide infrastructure for farmer group
enterprises development.
Farmer Group
Development
3 To increase livestock production and
livestock breeding
Establish, rehabilitate and equip livestock
development facilities.
Livestock Development
4 To increase fish production Develop fisheries infrastructure. Fisheries Development
5 To improve agriculture research To improve agriculture research
infrastructure.
Research Development
6 To improve human resource skills Training to support the upgrading of skills of
technical and professional staff in research
and extension services.
Human Resource
Development
7 To develop and identify areas for
resettlement
Provide infrastructure and social services. Resettlement Schemes
Development
Tourism
1 To develop and rehabilitate tourism
support infrastructure
Establish and rehabilitate tourism support
infrastructure.
Tourism Infrastructure
Development
2 To improve human resource skills Develop skills for operators and higher level
training in tourism.
Human Resource
Development
1 To expand the industrial base and
increase value addition
a) Facilitate the development of Multi-Facility
Economic Zones; and
Multi-Facility Economic
Zone Development
b) Facilitate the development of an Industrial
Park.
Industrial Park
Development

Sixth National Development Plan 2011 – 2015
191
No. Objectives Strategies Programmes
2 To improve human resource skills Develop entrepreneurship training at all levels
of education and on-farm agro-processing
training.
Human Resource
Development
Mining
1 To increase productivity a) Facilitate access to capital and equipment;
b) Increase extension services to small-scale
miners;
c) Provide incentives to small-scale miners
particularly those in the gemstone sector and;
d) Mitigate environmental impact of mining.
Development of Mines
2 To improve human resource skills Develop mining safety and environmental
impact mitigation training.
Human Resource
Development
1 To improve standard of education
service delivery for early childhood and
basic education
a) Provide professional development for early
childhood and basic education; and
b) Provide equipment.
Human Resource
Development
Health
1 To provide sustainable infrastructure,
conducive for the delivery of quality
health services
Establish, expand and rehabilitate health
infrastructure.
Infrastructure
Development
2 To improve the quality of health service
delivery
Provide professional development for heath
personnel; And
Human Resource
Development
3 To ensure the availability of medical
equipment in health care facilities
Provide medical equipment. Medical Equipment
Provision
Water and Sanitation
1 To provide water for productive use Provide rural water supply infrastructure
(dams, weirs and irrigation schemes).
Rural Water Supply and
Sanitation
2 To provide sustainable access to safe
water supply and sanitation facilities to
all communities
Develop and rehabilitate water points and
sanitation facilities.
Natural Resources
1 To replant and expand plantations of
exotic tree species
Establish nurseries and plantations. Plantation Expansion
and Maintenance
2 To promote reforestation of depleted
indigenous forests
Establish and expand nurseries and replant
depleted forests.
Reforestation
3 To promote environmentally friendly
technologies for income generation
a) Provide equipment for beekeeping promotion;
and
Enterprise Development
b) Develop professional expertise in beekeeping. Human Development
22.5.3 Eastern Province
Eastern Province has comparative advantage in groundnuts, tobacco and sunflower production.
The Province has potential for groundnuts, tobacco, cotton and rice production. The importance
of the Province to the country lies in its high agricultural production as well as it connectivity to
the countries on the east through the Nacala Corridor. The main challenge for the Province is
poor road infrastructure and high drop-out rates. The main focus for the Province during the
SNDP period will be the provision of relevant infrastructure for agriculture production and its
linkages to trade and industry.
The goal of the Province is to improve agricultural productivity and promote tourism.
22.5.3.1 Objectives, Strategies and Programmes
The Table below shows the objectives, strategies and programmes for Eastern Province during
the SNDP period.

Sixth National Development Plan 2011 – 2015
192
Table 122: Objectives, Strategies and Programmes
No. Objectives Strategies Programmes
Infrastructure
1 To enhance movement of goods and services Establish and rehabilitate feeder roads Infrastructure
Development 2 To provide adequate housing and office
accommodation for improved service delivery
Establish and rehabilitate institutional
housing units and office blocks
3 To increase electrification levels in the Rural
Areas
Connect rural areas to electricity power
supply
Rural
Electrification
4 To expand the use of renewable and alternative
energy
a) Promote the development and use of solar
technology systems; and
b) Promote the use of biogas for cooking,
lighting and electricity generation.
Renewable and
Alternative Energy
Development
5 To improve standards in all fields of engineering Develop engineering capacity for relevant
fields of engineering
Human Resource
Development
6 To provide sustainable infrastructure and
equipment conducive for the delivery of quality
meteorological services
Establish and rehabilitate infrastructure Meteorological
Infrastructure
Development
Agriculture
1 To increase crop productivity
a) Provide high yielding seed materials for
crop diversification;
b) Establish storage facilities;
Crop Production
and Productivity
c) Establish and rehabilitate irrigation
infrastructure;
Irrigation
Infrastructure
Development
d) Provide infrastructure for agricultural
extension services; and
Agriculture
Infrastructure
Development
e) Provide equipment for agricultural
extension services
Agriculture
Equipment
2 To promote the strengthening of farmer groups Provide infrastructure for farmer group
enterprises development
Farmer Group
Development
3 To increase livestock production and livestock
breeding
Establish, rehabilitate and equip livestock
development facilities
Livestock
Production and
Productivity
4 To improve crops, fisheries and livestock
research
Improve research development Research
Development
5 To improve human resource skills Training to support the upgrading of skills
of technical and professional staff in
research and extension services
Human Resource
Development
6 To develop and identify areas for resettlement Provide infrastructure and social services Resettlement
Schemes
Development
Tourism
To develop and rehabilitate tourism support
infrastructure
a) Establish and rehabilitate tourism support
infrastructure; and
Tourism
Infrastructure
Development
b) Develop skills for operators and higher
level training in tourism
Human Resource
Development
Education
1 To provide equitable access to quality education Establish, rehabilitate and upgrade
education facilities
Infrastructure
Development
2 To improve standard of education service
delivery for early childhood and basic education
a) Provide professional development for
early childhood and basic education; and
b) Provide equipment.
Human Resource
Development
Health
1 To provide sustainable infrastructure, conducive
for the delivery of quality health services
Establish, expand and rehabilitate health
infrastructure
Infrastructure
Development
2 To improve the quality of health service delivery Provide professional development for
health personnel
Human resource
Development

Sixth National Development Plan 2011 – 2015
193
No. Objectives Strategies Programmes
3 To ensure the availability of medical equipment
in health care facilities
Provide medical equipment.
Medical
Equipment
Provision
Water and Sanitation
1 To provide water for productive use Provide productive rural water supply
infrastructure (dams, weirs and irrigation
schemes)
Rural Water
Supply and
Sanitation
2 To provide sustainable access to safe water
supply and sanitation facilities to all
communities
Develop and rehabilitate water points and
sanitation facilities
Natural Resources
1 To promote reforestation of depleted indigenous
forests
Establish and expand nurseries and
replant depleted indigenous forests
Reforestation
2 To promote environmentally friendly
technologies for income generation
a) Provide equipment for beekeeping
promotion; and
Enterprise
Development
b) Develop professional expertise in
beekeeping.
Human
Development
22.5.4 Luapula Province
Luapula Province has a comparative advantage in fish, rubber, palm oil and tea production.
Luapula Province has potential for cassava, tea, citrus fruit, rice, sugar and palm oil production,
fishing, mining and tourism. The Province has abundant water resources, arable land, favourable
rain for agriculture production and mineral deposits. However, the Province faced some
challenges that include high poverty levels, poor access to social amenities in the swampy areas,
high school drop-out rates and poor infrastructure. Investments will therefore, be made in
education, health, water and sanitation. The main focus for the Province during the SNDP period
will be the provision of relevant infrastructure for production of high value crops.
The goal of the Province is to increase agricultural productivity and expand energy output.
22.5.4.1 Objectives, Strategies and Programmes
The Table below shows the objectives, strategies and programmes for Luapula Province during
the SNDP period. Table 123: Objectives, Strategies and Programmes
No. Objectives Strategies Programmes
1 To enhance movement of goods and
services
Establish and rehabilitate feeder roads. Infrastructure
Development
2 To provide adequate housing and office
accommodation for improved service
delivery
Establish and rehabilitate institutional
housing units and office blocks.
3 To improve access to electricity a) Expand Musonda power station; and
b) Construct new hydro power stations at
Kalungwishi, Mombututa and
Mambilima.
Energy Infrastructure
Development
4 To increase electrification levels in the
Rural Areas
Connect rural areas to electricity power
supply.
Rural Electrification
Programme

Sixth National Development Plan 2011 – 2015
194
No. Objectives Strategies Programmes
5 To expand the use of renewable and
alternative energy
a) Promote the development and use of solar
technology systems; and
b) Promote the use of biogas for cooking,
lighting and electricity generation.
Renewable and
Alternative Energy
Development
6 To improve standards in all fields of
engineering
Develop engineering capacity for relevant
fields of engineering.
Human Resource
Development
1 To increase crop productivity
a) Provide high yielding seed materials for
crop diversification;
b) Establish storage facilities;
Crop Production and
Productivity
c) Establish and rehabilitate irrigation
infrastructure;
Irrigation Infrastructure
Development
d) Provide infrastructure for agricultural
extension services; and
Agriculture Infrastructure
Development
e) Provide equipment for agricultural
extension services.
Agriculture Equipment
2 To promote the strengthening of farmer
groups
Provide infrastructure for farmer group
enterprises development.
Farmer Group
Development
3 To increase fish production Develop fisheries infrastructure. Fisheries Infrastructure
Development
4 To improve crops, fisheries and livestock
research
Improve research development. Research Development
5 To improve human resource skills Training to support the upgrading of
Skills of technical and professional staff
in research and extension services.
Human Resource
Development
6 To develop and identify areas for
resettlement
Provide infrastructure and social services Resettlement Schemes
Development
7 To promote crop diversification Procure and distribute Palm Oil seedlings
to the valley districts.
Agricultural Production
and Productivity
Improvement Programme
8 To improve the marketing of and
investment into agricultural products and
inputs
a) Facilitate the establishment of a
processing plant for palm oil in the valley;
and
b) Establish storage facilities.
Agricultural Marketing
Development and
Investment Promotion
To promote tourism a) Develop Northern circuit infrastructure;
And
Tourism Infrastructure
Development
b) Develop skills for operators and higher
level training in tourism.
Human Resource
Development
Manufacturing
1 To develop rural based industrial
enterprises
Promote and facilitate the development of
appropriate infrastructure.
Rural Industrialisation
2 To improve human resource skills Develop entrepreneurship training at all
levels of education and on-farm agro-
processing training.
Human Resource
Development
1 To provide equitable access to quality
education
Establish, rehabilitate and upgrade
education facilities.
Infrastructure
Development
2 To improve standard of education service
delivery for early childhood and basic
education
a) Provide professional development for
early childhood and basic education; and
b) Provide equipment.
Human Resource
Development
1 To provide sustainable infrastructure,
conducive for the delivery of quality
health services
Establish, expand and rehabilitate health
infrastructure.
Infrastructure
Development
2 To improve the quality of health service
delivery
Provide professional development for
health personnel.
Human Resource
Development
3 To ensure the availability of medical
equipment in health care facilities
Provide medical equipment. Medical Equipment
Provision
To increase access to safe water and
sanitation
Develop water and sanitation
infrastructure.
Water and Sanitation
To replant and expand plantations of
exotic tree species
Establish nurseries and plantations. Plantation Expansion

Sixth National Development Plan 2011 – 2015
195
22.5.5 Lusaka Province
Lusaka Province has a comparative advantage in manufacturing and agro-processing. To this
effect it has been earmarked for the development of two Multi-Facility Economic Zones to
promote value addition. Additionally, the Province has agriculture potential in soya beans and
wheat production because of its arable land and access to markets. In terms of tourism, the
Province needs to exploit its potential in order to benefit from it being a major entry point for
tourists.
Notwithstanding the potentials, the Province faces a number of challenges which include poor
and inadequate road and rail infrastructure, housing and water and sanitation facilities.
Additionally, the increase in population has resulted in increased demand for social services.
The main focus for the Province during the SNDP period will be to develop social and economic
infrastructure in order to enhance accessibility to social and economic services.
The goal of the Province is to improve social-economic infrastructure and promote non-
traditional exports.
22.5.5.1 Objectives, Strategies and Programmes
The Table below shows the objectives, strategies and programmes for Lusaka Province during
the SNDP period. Table 124: Objectives, Strategies and Programmes
No. Objectives Strategies Programmes
Infrastructure
1 To enhance movement of goods and
services
a) Establish and rehabilitate feeder roads; and
b) Rehabilitate railway lines.
Infrastructure
Development
2 To increase electrification levels in the
Rural Areas
Connect rural areas to electricity power
supply.
Rural Electrification
3 To ensure security of supply of petroleum
products
Develop storage infrastructure for the
reserves.
Strategic Petroleum
Reserves
4 To improve standards in all fields of
engineering
Develop engineering capacity for relevant
fields of engineering.
Human Resource
Development
5 To ensure safety of civil aviation and
reliable weather forecasting meteorological
communication
Provide equipment. Meteorological
Equipment
Agriculture
1 To increase crop productivity a) Provide high yielding seed materials for
crop diversification;
b) Provide equipment and infrastructure for
agricultural extension services; and
c) Establish storage facilities.
Crop Production and
Productivity
2 To increase productivity and export of non-
traditional export crops
a) Export of horticultural products; and Horticultural Products
Development
b) Establish and rehabilitate irrigation
infrastructure.
Irrigation Development
3 To promote the strengthening of farmer
groups
Provide infrastructure for farmer group
enterprises development
Farmer Group
Development
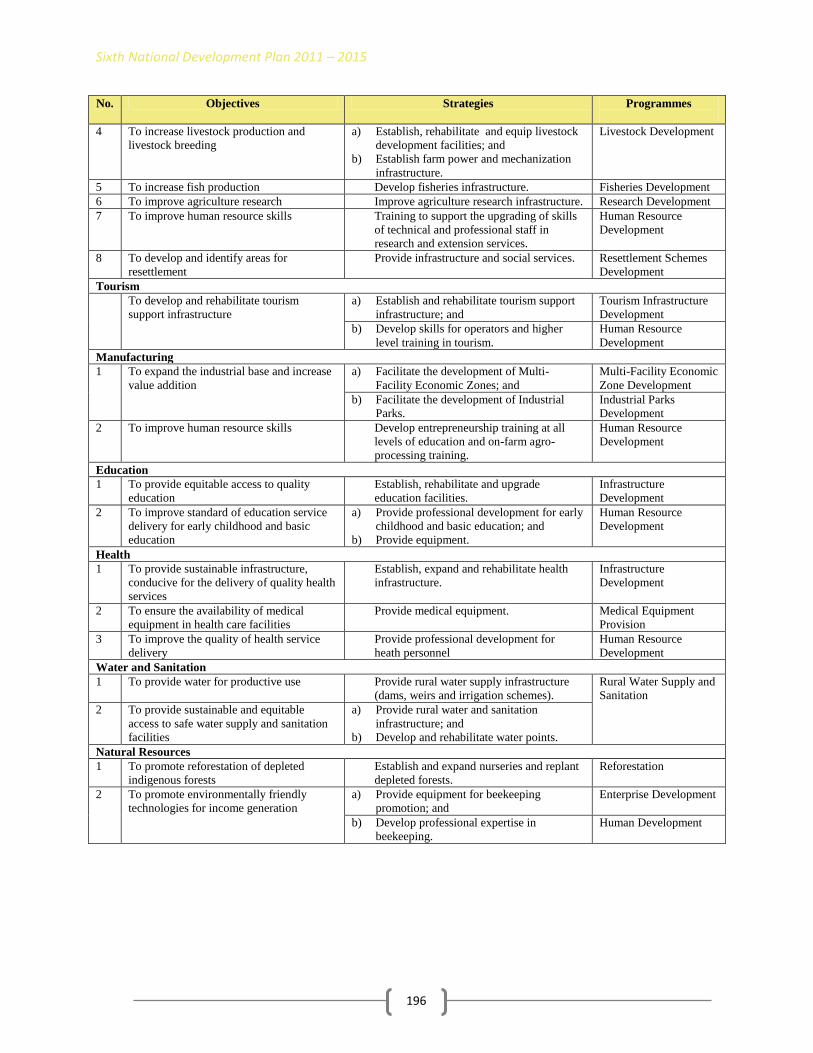
Sixth National Development Plan 2011 – 2015
196
No. Objectives Strategies Programmes
4 To increase livestock production and
livestock breeding
a) Establish, rehabilitate and equip livestock
development facilities; and
b) Establish farm power and mechanization
infrastructure.
Livestock Development
5 To increase fish production Develop fisheries infrastructure. Fisheries Development
6 To improve agriculture research Improve agriculture research infrastructure. Research Development
7 To improve human resource skills Training to support the upgrading of skills
of technical and professional staff in
research and extension services.
Human Resource
Development
8 To develop and identify areas for
resettlement
Provide infrastructure and social services. Resettlement Schemes
Development
Tourism
To develop and rehabilitate tourism
support infrastructure
a) Establish and rehabilitate tourism support
infrastructure; and
Tourism Infrastructure
Development
b) Develop skills for operators and higher
level training in tourism.
Human Resource
Development
Manufacturing
1 To expand the industrial base and increase
value addition
a) Facilitate the development of Multi-
Facility Economic Zones; and
Multi-Facility Economic
Zone Development
b) Facilitate the development of Industrial
Parks.
Industrial Parks
Development
2 To improve human resource skills Develop entrepreneurship training at all
levels of education and on-farm agro-
processing training.
Human Resource
Development
Education
1 To provide equitable access to quality
education
Establish, rehabilitate and upgrade
education facilities.
Infrastructure
Development
2 To improve standard of education service
delivery for early childhood and basic
education
a) Provide professional development for early
childhood and basic education; and
b) Provide equipment.
Human Resource
Development
Health
1 To provide sustainable infrastructure,
conducive for the delivery of quality health
services
Establish, expand and rehabilitate health
infrastructure.
Infrastructure
Development
2 To ensure the availability of medical
equipment in health care facilities
Provide medical equipment. Medical Equipment
Provision
3 To improve the quality of health service
delivery
Provide professional development for
heath personnel
Human Resource
Development
Water and Sanitation
1 To provide water for productive use
Provide rural water supply infrastructure
(dams, weirs and irrigation schemes).
Rural Water Supply and
Sanitation
2 To provide sustainable and equitable
access to safe water supply and sanitation
facilities
a) Provide rural water and sanitation
infrastructure; and
b) Develop and rehabilitate water points.
Natural Resources
1 To promote reforestation of depleted
indigenous forests
Establish and expand nurseries and replant
depleted forests.
Reforestation
2 To promote environmentally friendly
technologies for income generation
a) Provide equipment for beekeeping
promotion; and
Enterprise Development
b) Develop professional expertise in
beekeeping.
Human Development

Sixth National Development Plan 2011 – 2015
197
22.5.6 Northern Province
Northern Province has a comparative advantage in cassava, coffee, paddy rice, mixed beans and
millet. The Province has huge potential for sugar, tea and fish production and tourism. The
Province is the largest in the country and has two busy routes namely, the Great North Road and
TAZARA railway line. It also harbours the Mpulungu Port which is Zambia‟s main route to the
Great Lakes Regions. Over the past years, deforestation, land degradation, poor infrastructure
and access to social services have posed a challenge to development in the Province.
The main focus is the improvement of road and energy infrastructure to facilitate growth in
agriculture and tourism.
The goal of the Province is to achieve increased and equitable access to quality socio-economic
services in order to improve the standard of living.
22.5.6.1 Objectives, Strategies and Programmes
The Table below shows the objectives, strategies and programmes for Northern Province during
the SNDP period.
Table 125: Objectives, Strategies andProgrammes
No. Objectives Strategies Programmes
Infrastructure
1 To enhance movement of goods and services a) Establish and rehabilitate feeder roads;
b) Rehabilitate railway line; and
c) Establish a railway line.
Infrastructure
Development
2 To ensure safety of civil aviation and reliable
weather forecasting meteorological
communication
a) Establish and rehabilitate infrastructure; and
b) Provide equipment.
3 To facilitate the expansion of rural
electrification programme for socio-
economic development
Establish mini-hydro power plants. Rural
Electrification
4 To increase the generation capacity of
electricity
a) Facilitate the opening of new hydro-power
generation plants; and
b) Establish biomass-based power plant.
Infrastructure
Development
5 To expand the use of renewable and
alternative energy
a) Promote the development and use of solar
technology systems; and
b) Promote the use of biogas for cooking, lighting
and electricity generation.
Renewable and
Alternative
Energy
Development
6 To increase electrification levels in the Rural
Areas
Connect rural areas to electricity power supply. Rural
Electrification
Programme
7 To improve standards in all fields of
engineering
Develop engineering capacity for relevant
fields of engineering.
Human Resource
Development
Agriculture
1 To increase crop productivity a) Provide high yielding seed materials for crop
diversification;
b) Provide equipment and infrastructure for
agricultural extension services;
c) Establish farm power and mechanization
infrastructure;
d) Establish storage facilities; and
Crop Production
and Productivity
e) Establish and rehabilitate irrigation
infrastructure.
Irrigation
Development

Sixth National Development Plan 2011 – 2015
198
No. Objectives Strategies Programmes
2 To promote the strengthening of farmer
groups
Provide infrastructure for farmer group
enterprises development.
Farmer Group
Development
3 To increase livestock production and
livestock breeding
Establish, rehabilitate and equip livestock
development facilities.
Livestock
Development
4 To increase fish production Develop fisheries infrastructure. Fisheries
Development
5 To improve agriculture research Improve agriculture research infrastructure. Research
Development
6 To improve human resource skills Training to support the upgrading of skills of
technical and professional staff in research and
extension services.
Human Resource
Development
7 To develop and identify areas for
resettlement
Provide infrastructure and social services. Resettlement
Schemes
Development
Tourism
1 To develop and rehabilitate tourism support
infrastructure
Establish and rehabilitate tourism support
infrastructure
Tourism
Infrastructure
Development 2 To promote investment in quality tourism Develop the Northern Tourism Circuit.
3 To improve on the marketing of tourism sites a) Establish Tourism Information Centres; and Tourism
Marketing
b) Develop skills for operators and higher level
training in tourism.
Human Resource
Development
Manufacturing
1 To develop rural based industrial enterprises Promote and facilitate the development of
appropriate infrastructure.
Rural
Industrialisation
2 To improve human resource skills Develop entrepreneurship training at all levels
of education and on-farm agro-processing
training.
Human Resource
Development
Education
1 To provide equitable access to quality
education
Establish, rehabilitate and upgrade education
facilities.
Infrastructure
Development
2 To improve standard of education service
delivery for early childhood and basic
education
a) Provide professional development for early
childhood and basic education; and
b) Provide equipment.
Human Resource
Development
Health
1 To provide sustainable infrastructure,
conducive for the delivery of quality health
services
Establish, expand and rehabilitate health
infrastructure.
Infrastructure
Development
2 To ensure the availability of medical
equipment in health care facilities
Provide medical equipment. Medical
Equipment
Provision
3 To improve the standard of health service
delivery
Provide skilled human resource. Human Resource
Development
Water and Sanitation
1 To provide water for productive use Provide rural water supply infrastructure
(dams, weirs, irrigation schemes).
Rural Water
Supply and
Sanitation 2 To provide sustainable and equitable access
to safe water supply and sanitation facilities
Develop and rehabilitate water points and
sanitation.
Natural Resources
1 To promote reforestation of depleted
indigenous forests
Establish and expand nurseries and replant
depleted forests.
Reforestation
2 To promote environmentally friendly
technologies for income generation
a) Provide equipment for beekeeping promotion;
and
Enterprise
Development
b) Develop professional expertise in beekeeping. Human
Development
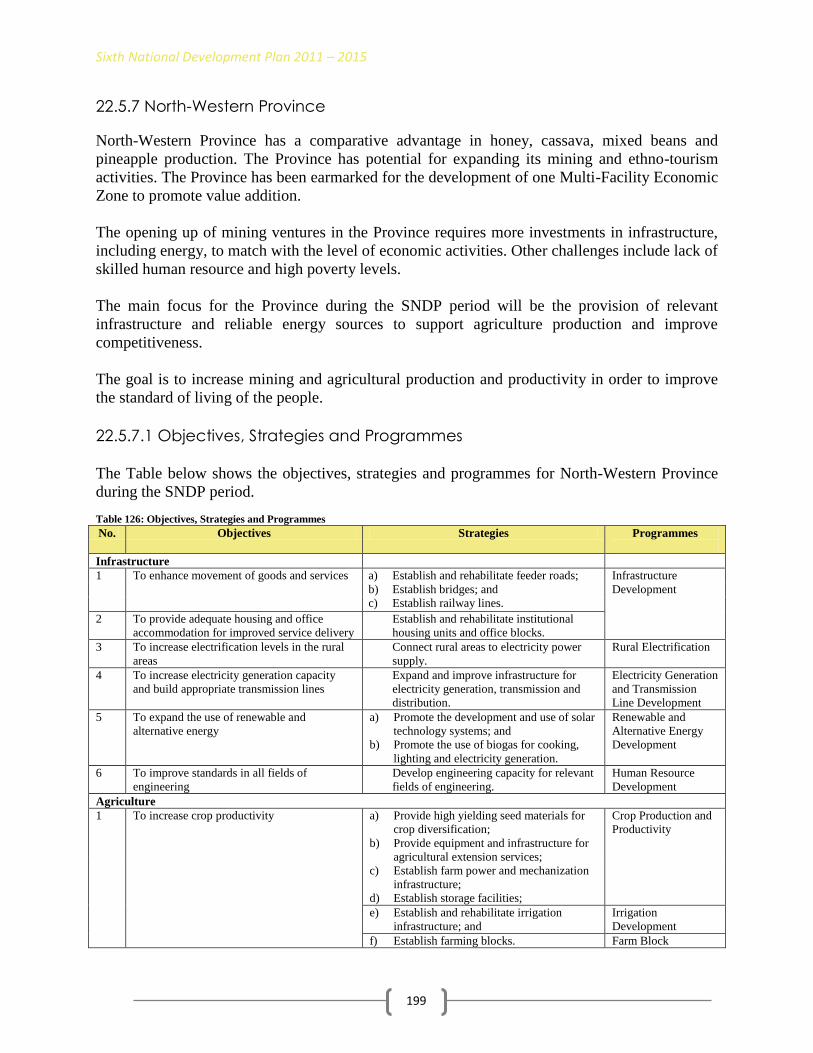
Sixth National Development Plan 2011 – 2015
199
22.5.7 North-Western Province
North-Western Province has a comparative advantage in honey, cassava, mixed beans and
pineapple production. The Province has potential for expanding its mining and ethno-tourism
activities. The Province has been earmarked for the development of one Multi-Facility Economic
Zone to promote value addition.
The opening up of mining ventures in the Province requires more investments in infrastructure,
including energy, to match with the level of economic activities. Other challenges include lack of
skilled human resource and high poverty levels.
The main focus for the Province during the SNDP period will be the provision of relevant
infrastructure and reliable energy sources to support agriculture production and improve
competitiveness.
The goal is to increase mining and agricultural production and productivity in order to improve
the standard of living of the people.
22.5.7.1 Objectives, Strategies and Programmes The Table below shows the objectives, strategies and programmes for North-Western Province
during the SNDP period.
Table 126: Objectives, Strategies and Programmes
No. Objectives Strategies Programmes
Infrastructure
1 To enhance movement of goods and services a) Establish and rehabilitate feeder roads;
b) Establish bridges; and
c) Establish railway lines.
Infrastructure
Development
2 To provide adequate housing and office
accommodation for improved service delivery
Establish and rehabilitate institutional
housing units and office blocks.
3 To increase electrification levels in the rural
areas
Connect rural areas to electricity power
supply.
Rural Electrification
4 To increase electricity generation capacity
and build appropriate transmission lines
Expand and improve infrastructure for
electricity generation, transmission and
distribution.
Electricity Generation
and Transmission
Line Development
5 To expand the use of renewable and
alternative energy
a) Promote the development and use of solar
technology systems; and
b) Promote the use of biogas for cooking,
lighting and electricity generation.
Renewable and
Alternative Energy
Development
6 To improve standards in all fields of
engineering
Develop engineering capacity for relevant
fields of engineering.
Human Resource
Development
Agriculture
1 To increase crop productivity a) Provide high yielding seed materials for
crop diversification;
b) Provide equipment and infrastructure for
agricultural extension services;
c) Establish farm power and mechanization
infrastructure;
d) Establish storage facilities;
Crop Production and
Productivity
e) Establish and rehabilitate irrigation
infrastructure; and
Irrigation
Development
f) Establish farming blocks. Farm Block

Sixth National Development Plan 2011 – 2015
200
No. Objectives Strategies Programmes
Development
2 To promote the strengthening of farmer
groups
Provide infrastructure for farmer group
enterprises development.
Farmer Group
Development
3 To improve agriculture research To improve agriculture research
infrastructure.
Research
Development
4 To improve human resource skills Training to support the upgrading of skills
of technical and professional staff in
research and extension services.
Human Resource
Development
5 To develop and identify areas for resettlement Provide infrastructure and
social services.
Resettlement
Schemes
Development
Tourism
To develop and rehabilitate tourism support
infrastructure
a) Establish and rehabilitate tourism support
infrastructure; and
Tourism
Infrastructure
Development
b) Develop skills for operators and higher
level training in tourism.
Human Resource
Development
Mining
1 To increase productivity a) Facilitate access to capital and equipment;
and
b) Mitigate environmental impact of mining.
Development of
Mines
2 To improve human resource skills Develop mining safety and environmental
impact mitigation training.
Human Resource
Development
Manufacturing
1 To expand the industrial base and increase
value addition
Facilitate the development of Multi-
Facility Economic Zones.
Multi-Facility
Economic Zone
Development
2 To develop rural based industrial enterprises
Promote and facilitate the development of
appropriate infrastructure.
Rural
Industrialisation
3 To ensure security of supply of petroleum
products
Develop storage infrastructure for the
reserves.
Strategic Petroleum
Reserves
4 To improve human resource skills Develop entrepreneurship training at all
levels of education and on-farm agro-
processing training.
Human Resource
Development
Education
1 To provide equitable access to quality
education
Establish, rehabilitate and upgrade
education facilities.
Infrastructure
Development
2 To improve standard of education service
delivery for early childhood and basic
education
a) Provide professional development for
early childhood and basic education; and
b) Provide equipment.
Human Resource
Development
Health
1 To provide sustainable infrastructure,
conducive for the delivery of quality health
services
Establish, expand and rehabilitate health
infrastructure
Infrastructure
Development
2 To ensure the availability of medical
equipment in health care facilities
Provide medical equipment. Medical Equipment
Provision
3 To improve the quality of health service
delivery
a) Provide professional development for
heath personnel; and
b) Develop Land Use Plans.
Human Resource
Development
Land Use Plans
Water and Sanitation
1 To provide water for productive use Provide rural water supply infrastructure
(dams, weirs and irrigation schemes).
Rural Water Supply
and Sanitation
2 To provide sustainable and equitable access to
safe water supply and sanitation facilities
Develop and rehabilitate water points and
sanitation.
Natural Resources
1 To promote reforestation of depleted
indigenous forests
Establish and expand nurseries and replant
depleted forests.
Reforestation
2 To promote environmentally friendly
technologies for income generation
a) Provide equipment for beekeeping
promotion; and
Enterprise
Development

Sixth National Development Plan 2011 – 2015
201
No. Objectives Strategies Programmes
b) Develop professional expertise in
beekeeping.
Human Development
22.5.8 Southern Province
Southern Province has comparative advantage in cattle rearing, sorghum production, tourism and
energy generation. The Province has potential for maize, soya beans, wheat and groundnuts
production. The Province is endowed with mineral deposits as well as tourist‟s attractions which
includes the renowned Victoria Falls, museums and cultural villages.
The main challenge for the Province is poor infrastructure and declining agriculture productivity.
The main focus for the Province during the SNDP period will be the provision of infrastructure
for the promotion of energy generation and irrigation, tourism, skills development and livestock
disease control.
The goal of the Province is to diversify the local economy and revive agriculture.
22.5.8.1 Objectives, Strategies and Programmes
The Table below shows the objectives, strategies and programmes for Southern Province during the SNDP period. Table 127: Objectives, Strategies and Programmes
No. Objectives Strategies Programmes
Infrastructure
1 To enhance movement of goods and services a) Establish and rehabilitate feeder roads; and
b) Rehabilitate railway lines.
Infrastructure
Development
2 To provide adequate housing and office
accommodation for improved service delivery
Establish and rehabilitate institutional
housing units and office blocks.
3 To increase electrification levels in the Rural
Areas
Connect rural areas to electricity power
supply.
Rural Electrification
4 To ensure security of supply of petroleum
products
Develop storage infrastructure for the
reserves
Strategic Petroleum
Reserves
5 To increase electricity generation capacity
and build appropriate transmission lines
Expand and Improve infrastructure for
electricity generation, transmission and
distribution.
Electricity
Generation and
Transmission Line
Development
6 To improve standards in all fields of
engineering
Develop engineering capacity for relevant
fields of engineering.
Human Resource
Development
7 To ensure safety of civil aviation and reliable
weather forecasting meteorological
communication
a) Establish and rehabilitate infrastructure; and Meteorological
Infrastructure
b) Provide equipment. Meteorological
Equipment
Agriculture
1 To increase crop productivity a) Provide high yielding seed materials for crop
diversification;
b) Provide equipment and infrastructure for
agricultural extension services;
c) Establish farm power and mechanization
infrastructure;
d) Establish storage facilities; and
Crop Production and
Productivity

Sixth National Development Plan 2011 – 2015
202
No. Objectives Strategies Programmes
e) Establish and rehabilitate irrigation
infrastructure.
Irrigation
Development
2 To promote the strengthening of farmer
groups
Provide infrastructure for farmer group
enterprises development.
Farmer Group
Development
3 To increase livestock production a) Establish, rehabilitate and equip livestock
development facilities; and
b) Livestock restocking.
Livestock
Development
4 To increase fish production Develop fisheries infrastructure. Fisheries
Development
5 To improve agriculture research Improve agriculture research infrastructure. Research
Development
6 To improve human resource skills Training to support the upgrading of skills of
technical and professional staff in research
and extension services.
Human Resource
Development
7 To develop and identify areas for resettlement Provide infrastructure and social services. Resettlement
Schemes
Development
Tourism
To develop and rehabilitate tourism support
infrastructure
a) Establish and rehabilitate tourism support
infrastructure; and
Tourism
Infrastructure
Development
b) Develop skills for operators and higher level
training in tourism.
Human Resource
Development
Manufacturing
To improve human resource skills Develop entrepreneurship training at all
levels of education and on-farm agro-
processing training.
Human Resource
Development
Mining
1 To increase production and productivity in
the mines
a) Facilitate access to capital and equipment;
b) Increase extension services to small-scale
miners;
c) Provide incentives to small-scale miners
particularly those in the gemstone sector;
d) Enhance skills training of miners in
production, value addition and marketing;
and
e) Mitigate environmental impact of mining.
Development of
Mines
2 To improve human resource skills Develop mining safety and environmental
impact mitigation training.
Human Resource
Development
Education
1 To provide equitable access to quality
education
Establish, rehabilitate and upgrade education
facilities.
Infrastructure
Development
2 To improve standard of education service
delivery for early childhood and basic
education
a) Provide professional development for early
childhood and basic education; and
b) Provide equipment.
Human Resource
Development
Health
1 To provide sustainable infrastructure,
conducive for the delivery of quality health
services
Establish, expand and rehabilitate health
infrastructure.
Infrastructure
Development
2 To ensure the availability of medical
equipment in health care facilities
Provide medical equipment. Medical Equipment
Provision
3 To improve the standard of health service
delivery
Provide skilled human resource. Human Resource
Development
Water and Sanitation
1 To provide water for productive use Provide rural water supply infrastructure
(dams, weirs, irrigation schemes).
Rural Water Supply
and Sanitation
2 To provide sustainable and equitable access
to safe water supply and sanitation facilities
Develop and rehabilitate water points and
sanitation facilities.
Natural Resources

Sixth National Development Plan 2011 – 2015
203
No. Objectives Strategies Programmes
1 To promote reforestation of depleted
indigenous forests
Establish and expand nurseries and replant
depleted forests.
Reforestation
2 To promote environmentally friendly
technologies for income generation
a) Provide equipment for beekeeping
promotion; and
Enterprise
Development
b) Develop professional expertise in beekeeping Human
Development
22.5.9 Western Province
Western Province has comparative advantage in citrus fruits, fish and timber. The Province has
potential for rice, cassava, honey and citrus production, cattle rearing and fishing. Western
Province is well endowed in arable land and pasture, water resources, mineral deposits, ethno-
tourism and forests.
The Province‟s major challenge is poor road infrastructure. The Province is covered by a deep
mantle of Kalahari sands intersected by a huge network of water logged plains of the Zambezi
river and its tributaries. Transportation across this terrain makes delivery of goods and services
difficult and at the same time the terrain makes road building extremely expensive. Further, the
Province continues to face the challenge of high poverty levels.
The main focus for the Province during the SNDP period will be the provision of relevant
infrastructure for water management and livestock disease control.
The goal for the Province in the SNDP period is to revive agricultural production and
productivity and improve transport infrastructure.
22.5.9.1 Objectives, Strategies and Programmes
The Table below shows the objectives, strategies and programmes for Western Province during
the SNDP period.
Table 128: Objectives, Strategies and Programmes
No. Objectives Strategies Programmes
Infrastructure
1 To enhance movement of goods and
services
a) Establish and rehabilitate feeder roads;
b) Construct railway line; and
c) Rehabilitate railway lines.
Infrastructure
Development
2 To provide adequate housing and
office accommodation for improved
service delivery
Establish and rehabilitate institutional housing
units and office blocks.
3 To ensure safety of civil aviation and
reliable weather forecasting
meteorological communication
a) Establish and rehabilitate infrastructure; and Meteorological
Infrastructure
b) Provide equipment. Meteorological
Equipment
4 To ensure security of supply of
petroleum products
Develop storage infrastructure for the reserves. Strategic Petroleum
Reserves
5 To improve standards in all fields of
engineering
Develop engineering capacity for relevant fields
of engineering.
Human Resource
Development
6 To develop rural based industrial
enterprises
Promote and facilitate the development of
appropriate infrastructure.
Rural Industrialisation

Sixth National Development Plan 2011 – 2015
204
No. Objectives Strategies Programmes
7 To improve access to electricity Connect districts to the National Grid. Rural Electrification
Agriculture
1 To increase crop productivity a) Establish Farming Blocks. Farm Block
Development
b) Provide high yielding seed materials for crop
diversification;
c) Provide equipment and infrastructure for
agricultural extension services;
d) Establish farm power and mechanization
infrastructure;
e) Establish and rehabilitate irrigation
infrastructure;
f) Establish storage facilities; and
Crop Production and
Productivity
g) Establish and rehabilitate irrigation
infrastructure.
Irrigation Development
2 To promote the strengthening of
farmer groups
Provide infrastructure for farmer group
enterprises development.
Farmer Group
Development
3 To increase livestock production and
livestock breeding
a) Establish, rehabilitate and equip livestock
development facilities; and
b) Eradicate livestock diseases.
Livestock Development
4 To increase fish production Develop fisheries infrastructure. Fisheries Development
5 To improve agriculture research Improve agriculture research infrastructure. Research Development
6 To improve human resource skills Training to support the upgrading of Skills of
technical and professional staff in research and
extension services.
Human Resource
Development
7 To develop and identify areas for
resettlement
Provide infrastructure and social services. Resettlement Schemes
Development
Tourism
To develop and rehabilitate tourism
support infrastructure
a) Establish and rehabilitate tourism support
infrastructure; and
Tourism Infrastructure
Development
b) Develop skills for operators and higher level
training in tourism.
Human Resource
Development
Education
1 To provide equitable access to quality
education
Establish, rehabilitate and upgrade education
facilities.
Infrastructure
Development
2 To improve standard of education
service delivery for early childhood
and basic education
a) Provide professional development for early
childhood and basic education; and
b) Provide equipment.
Human Resource
Development
Health
1 To provide sustainable infrastructure,
conducive for the delivery of quality
health services
Establish, expand and rehabilitate health
infrastructure.
Infrastructure
Development
2 To ensure the availability of medical
equipment in health care facilities
Provide medical equipment. Medical Equipment
Provision
3 To improve the standard of health
service delivery
Provide skilled human resource. Human Resource
Development
Water and Sanitation
1 To provide water for productive use Provide productive rural water supply
infrastructure (dams, weirs and irrigation
schemes).
Rural Water Supply and
Sanitation
2 To provide sustainable and equitable
access to safe water supply and
sanitation facilities
Develop and rehabilitate water points and
sanitation facilities.
Natural Resources
1 To promote reforestation of depleted
indigenous forests
Establish and expand nurseries and replant
depleted forests.
Reforestation
2 To promote environmentally friendly
technologies for income generation
a) Provide equipment for beekeeping promotion;
and
Enterprise Development
b) Develop professional expertise in beekeeping. Human Development

Sixth National Development Plan 2011 – 2015
205
22.6 Implementation, Monitoring and Evaluation
(j) Implementation and Coordination
The SNDP will be implemented and coordinated by the Provincial Development Coordinating
Committees (PDCCs) and District Development Coordinating Committees (DDCCs) at
provincial and district levels respectively. At sub-district level the Area Development
Committees (ADCs) will coordinate the implementation of the programmes.
In this regard, the PDCCs and the DDCCs will provide a forum for Government Institutions,
Private sector, Non-Governmental Organizations and Civil Society participation in the
implementation and coordination of regional programmes.
The Provincial and District Planning Units will facilitate the operations of the PDCCs and
DDCCs respectively.
(ii) Monitoring and Evaluation
Monitoring and Evaluation will be done at provincial, district and sub-district levels by the
following committees:
a) Sector Monitoring Teams at Provincial and District levels
b) Provincial Monitoring Teams of the PDCCs
c) District Monitoring Teams of the DDCCs
d) Area Development Committees
These committees will systematically monitor and report on the implementation of programmes
so as to provide information on the progress regularly. Sectors will be required to submit
quarterly progress reports to the coordinating units of the PDCCs and DDCCs, namely the
Provincial Planning Units and District Planning Units respectively.
Below are the baselines selected indicators for the regions: Figure 9: Poverty and Income- Poverty Levels (2006)
72
42
7973
29
7872 73
84
64
0102030405060708090
Pe
rce
nta
ge P
ove
rty
leve
ls
Poverty Levels by Province

Sixth National Development Plan 2011 – 2015
206
Figure 10: Household Income (2006)
Figure 11: Education - Completion Rates (2006)
7 084
14 373
4 984 5 554
17 290
5 3176 275
7 691
4 218
8 087
0
2 000
4 000
6 000
8 000
10 000
12 000
14 000
16 000
18 000
20 000
Ho
use
ho
ld In
com
e
Household Income by Province
55.3
76.2
27.8
45.5 48.9 48.834.7
52.842.9 48.1
0
20
40
60
80
100
Co
mp
leti
on
Rat
e
Provinces
Completion Rate by Province

Sixth National Development Plan 2011 – 2015
207
Figure 12: Enrolment Rates by province (2006)
53.3 53.6 55.5
46.1 46.450 51 50
45.7National, 50.17
0
10
20
30
40
50
60En
rolm
en
t R
ate
sEnrolment Rates by Province

Sixth National Development Plan 2011 – 2015
208
Figure 13: Health – Underweight Prevalence (2007)
Table 129: Under Five Mortality and Infant Mortality Baseline (2007)
Province Under five mortality Infant Mortality
Central 118/1,000 64/1000
Copperbelt 133/1,000 79/1000
Eastern 151/1,000 82/1000
Luapula 157/1,000 97/1000
Lusaka 135/1,000 85/1000
Northern 159/1,000 94/1000
North-Western 108/1,000 65/1000
Southern 103/1,000 64/1000
Western 139/1,000 97/1000
National 119/1,000
22.7 Regional Budget and Financing
In order to enhance the fiscal discretion and space of the regions, provinces and districts will be
allocated development funds to implement some of the key programmes identified by the
stakeholders at the provincial and district levels. This is to close the gap between national and
regional level decision making processes. Regional development is peculiar in that it provides a
link between the national and sub-national levels.
The Table below shows the Sector Budget and Financing during the SNDP period.
85
1214
7
12 11 11 10 10
02468
10121416
Un
de
r-fi
ve m
ort
alit
y R
atio
s
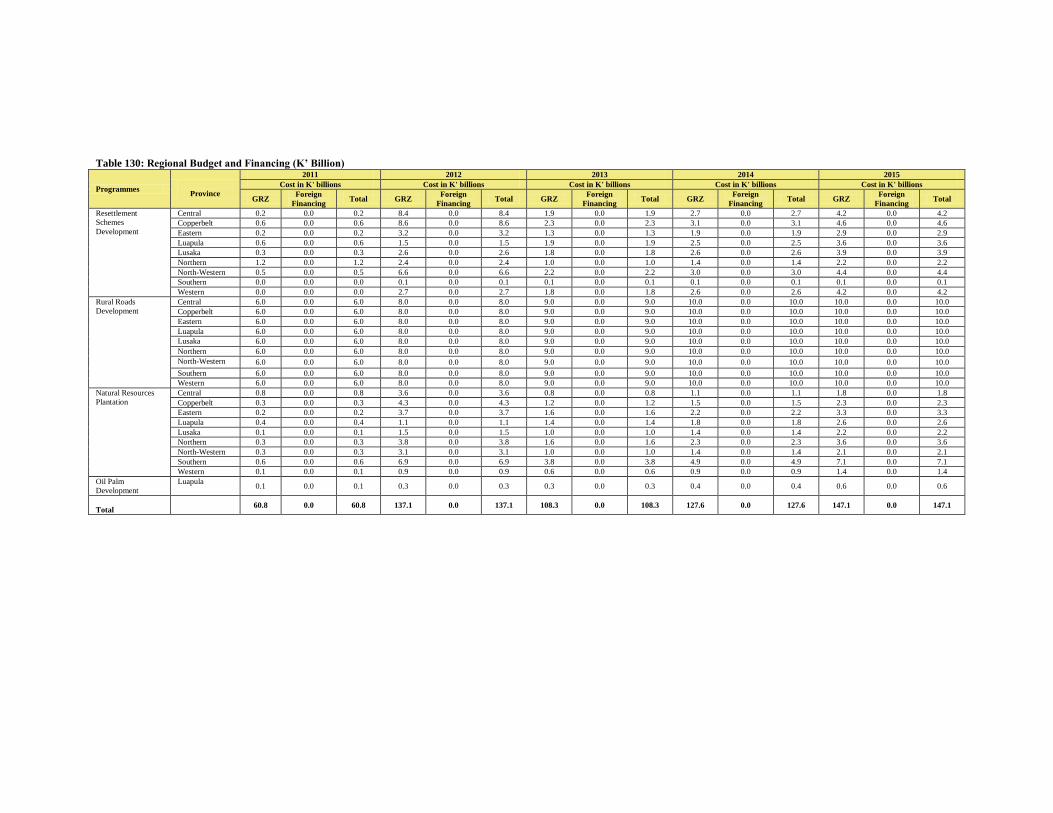
Table 130: Regional Budget and Financing (K’ Billion)
Programmes
Province
2011 2012 2013 2014 2015
Cost in K' billions Cost in K' billions Cost in K' billions Cost in K' billions Cost in K' billions
GRZ Foreign
Financing Total GRZ
Foreign
Financing Total GRZ
Foreign
Financing Total GRZ
Foreign
Financing Total GRZ
Foreign
Financing Total
Resettlement
Schemes
Development
Central 0.2 0.0 0.2 8.4 0.0 8.4 1.9 0.0 1.9 2.7 0.0 2.7 4.2 0.0 4.2
Copperbelt 0.6 0.0 0.6 8.6 0.0 8.6 2.3 0.0 2.3 3.1 0.0 3.1 4.6 0.0 4.6
Eastern 0.2 0.0 0.2 3.2 0.0 3.2 1.3 0.0 1.3 1.9 0.0 1.9 2.9 0.0 2.9
Luapula 0.6 0.0 0.6 1.5 0.0 1.5 1.9 0.0 1.9 2.5 0.0 2.5 3.6 0.0 3.6
Lusaka 0.3 0.0 0.3 2.6 0.0 2.6 1.8 0.0 1.8 2.6 0.0 2.6 3.9 0.0 3.9
Northern 1.2 0.0 1.2 2.4 0.0 2.4 1.0 0.0 1.0 1.4 0.0 1.4 2.2 0.0 2.2
North-Western 0.5 0.0 0.5 6.6 0.0 6.6 2.2 0.0 2.2 3.0 0.0 3.0 4.4 0.0 4.4
Southern 0.0 0.0 0.0 0.1 0.0 0.1 0.1 0.0 0.1 0.1 0.0 0.1 0.1 0.0 0.1
Western 0.0 0.0 0.0 2.7 0.0 2.7 1.8 0.0 1.8 2.6 0.0 2.6 4.2 0.0 4.2
Rural Roads
Development
Central 6.0 0.0 6.0 8.0 0.0 8.0 9.0 0.0 9.0 10.0 0.0 10.0 10.0 0.0 10.0
Copperbelt 6.0 0.0 6.0 8.0 0.0 8.0 9.0 0.0 9.0 10.0 0.0 10.0 10.0 0.0 10.0
Eastern 6.0 0.0 6.0 8.0 0.0 8.0 9.0 0.0 9.0 10.0 0.0 10.0 10.0 0.0 10.0
Luapula 6.0 0.0 6.0 8.0 0.0 8.0 9.0 0.0 9.0 10.0 0.0 10.0 10.0 0.0 10.0
Lusaka 6.0 0.0 6.0 8.0 0.0 8.0 9.0 0.0 9.0 10.0 0.0 10.0 10.0 0.0 10.0
Northern 6.0 0.0 6.0 8.0 0.0 8.0 9.0 0.0 9.0 10.0 0.0 10.0 10.0 0.0 10.0
North-Western 6.0 0.0 6.0 8.0 0.0 8.0 9.0 0.0 9.0 10.0 0.0 10.0 10.0 0.0 10.0
Southern 6.0 0.0 6.0 8.0 0.0 8.0 9.0 0.0 9.0 10.0 0.0 10.0 10.0 0.0 10.0
Western 6.0 0.0 6.0 8.0 0.0 8.0 9.0 0.0 9.0 10.0 0.0 10.0 10.0 0.0 10.0
Natural Resources
Plantation
Central 0.8 0.0 0.8 3.6 0.0 3.6 0.8 0.0 0.8 1.1 0.0 1.1 1.8 0.0 1.8
Copperbelt 0.3 0.0 0.3 4.3 0.0 4.3 1.2 0.0 1.2 1.5 0.0 1.5 2.3 0.0 2.3
Eastern 0.2 0.0 0.2 3.7 0.0 3.7 1.6 0.0 1.6 2.2 0.0 2.2 3.3 0.0 3.3
Luapula 0.4 0.0 0.4 1.1 0.0 1.1 1.4 0.0 1.4 1.8 0.0 1.8 2.6 0.0 2.6
Lusaka 0.1 0.0 0.1 1.5 0.0 1.5 1.0 0.0 1.0 1.4 0.0 1.4 2.2 0.0 2.2
Northern 0.3 0.0 0.3 3.8 0.0 3.8 1.6 0.0 1.6 2.3 0.0 2.3 3.6 0.0 3.6
North-Western 0.3 0.0 0.3 3.1 0.0 3.1 1.0 0.0 1.0 1.4 0.0 1.4 2.1 0.0 2.1
Southern 0.6 0.0 0.6 6.9 0.0 6.9 3.8 0.0 3.8 4.9 0.0 4.9 7.1 0.0 7.1
Western 0.1 0.0 0.1 0.9 0.0 0.9 0.6 0.0 0.6 0.9 0.0 0.9 1.4 0.0 1.4
Oil Palm
Development
Luapula 0.1 0.0 0.1 0.3 0.0 0.3 0.3 0.0 0.3 0.4 0.0 0.4 0.6 0.0 0.6
Total
60.8 0.0 60.8 137.1 0.0 137.1 108.3 0.0 108.3 127.6 0.0 127.6 147.1 0.0 147.1

210
Part VII
Monitoring and Evaluation
Institutional Arrangement

Sixth National Development Plan 2011 – 2015
211
23. IMPLEMENTATION, MONITORING AND EVALUATION INSTITUTIONAL ARRANGEMENT
For the Sixth National Development Plan (SNDP), the focus will be on improving coordination
of Monitoring and Evaluation (M & E) systems at national, provincial and district levels.Cabinet
Office will ensure that the Plan M&E Framework is adhered to by the various implementing
institutions, including the reporting requirements. There will be need for an appropriate legal
framework to support the operationalization of the implementation, monitoring and evaluation
institutional arrangement. Further M&E operational manuals and/or master plan will be
developed to fully articulate the SNDP M&E framework to include strategies and detailed
analysis of systems and tools for monitoring and evaluation of development plans.
In order to enhance the monitoring and evaluation of the Plans, all stakeholders will need to take
up their roles and responsibilities for data collection, analysis and reporting as presented in
Figure 9 below. More specifically Parliament, Auditor General‟s Office, Ministry of Local
Government and Housing and District Councils have been incorporated into the Plan M&E
Institutional Framework, as key institutions to provide oversight, on effective national and sub-
national Monitoring and Evaluation Systems.

Sixth National Development Plan 2011 – 2015
212
Figure 14: Institutional Arrangement for Plans Implementation
23.1 National Level Monitoring
(i) Parliament
Submission of annual progress and evaluation reports to Parliament will be formalised so
as to strengthen the oversight role of Parliament in monitoring and evaluation.
(ii) Office of the Auditor General
The Auditor General‟s Office will continue to undertake audits and value for money
evaluations so as to provide an independent perspective on utilization of resources
allocated to the Plan.
(iii) National Development Coordinating Committee
The National Development Coordinating Committee (NDCC) will be expected to meet
bi-annually to consider emerging issues from implementation of the Plans .
Cabinet
PDCC
(GRZ, CSOs , CPs etc.)
DDCC (GRZ, CSOs , CPs etc.)
Area Development Committees /
Traditional Rulers
Sector Ministries and other Spending
Agencies
Provincial Administration
NDCC
District Administration
MoFNP (M&E, CSO, AG,
BO, CIA)
SAGs (GRZ, CSOs , CPs etc.)
Cabinet Office
Deconcentrated Ministries and / or Council
Administration
Advisory / Consultative
Implementing Structure
Direct Elect Represents.
Parliament
MLGH
District Council
Provides feedback / recommendations
Direction of Info Flow
Auditor General

Sixth National Development Plan 2011 – 2015
213
(iv) Ministry of Finance and National Planning
The Ministry of Finance and National Planning (MoFNP) will coordinate
implementation, monitoring and evaluation processes and ensure that remedial measures
are effected on programmes that are not on course.
23.2 Sector Level Monitoring
(i) Sector Advisory Groups
The Sector Advisory Groups (SAGs) will play a key role in ensuring that monitoring and
evaluation findings fed into sector planning and budgeting. EachSAG will be serviced by
a Monitoring and Evaluation sub-committee to give monitoring and evaluation strategic
guidance and provide a coordinated M&E perspective.
(ii) Sector Ministries/Institutions
Sector lead ministries will undertake M&E activities and these will be coordinated and
spearheaded by M&E personnel who shall also be responsible for Management
Information Systems in their respective Ministries or institutions.
23.3 Provincial Level Monitoring
(i) Provincial Development Coordinating Committee
The Provincial Development Coordinating Committee will play a key role in ensuring
that monitoring and evaluation findings fed into the provincial planning and budgeting
processes. Each PDCC will be serviced by a Monitoring and Evaluation sub-committee
to give monitoring and evaluation strategic guidance and provide a coordinated M&E
perspective.
(ii) Provincial Administration
Provincial Administration will undertake M&E activities and these will be coordinated
and spearheaded by M&E personnel who shall also be responsible for Management
Information Systems in the provinces.
23.4 District level Monitoring
(i) District Development Coordinating Committee
The District Development Coordinating Committee (DDCC) will play a key role in
ensuring that monitoring and evaluation findings feed into the district planning and
budgeting processes. Each DDCC will be serviced by a Monitoring and Evaluation sub-
committee to give monitoring and evaluation strategic guidance and provide a
coordinated M&E perspective.
(ii) District Administration
District Administration will undertake M&E activities and these will be coordinated and
spearheaded by M&E personnel who shall also be responsible for Management
Information Systems in the districts.

Sixth National Development Plan 2011 – 2015
214
(iii) Area Development Committees
At Sub-district level, Area Development Committees (ADCs) will undertake monitoring
and evaluation activities in relation to project implementation in their areas and will
provide information to the district Monitoring and Evaluation sub-committee and the
communities.
23.5 Role of Non-State Actors in Monitoring and Evaluation
Non-state actors will play an important complimentary role in monitoring and evaluation of
Government programmes. The non-state actors will undertake their own independent
monitoring and evaluation of programmes whose findings could be discussed with
Government through existing advisory institutions like SAGs and the Ministry of Finance
and National Planning.
23.6 Monitoring Processes, Systems and Tools
The NDPs monitoring and evaluation will be undertaken through the following processes and
systems:
(i) Budget Execution Monitoring;
(ii) Project Spot monitoring;
(iii)Analysis of administrative data or Management Information Systems;
(iv) Surveys; and
(v) Research and Development.
The Plans will be monitored through Quarterly Progress Reports, Annual Progress Report, Mid-
Term Review Report and Final Evaluation Report.
23.7 Capacity Building for Monitoring and Evaluation
During the SNDP period, a Capacity Building Programme will be established to enhance smooth
implementation, monitoring and evaluation of programmes. A cadre of M&E professionals with
relevant skills to effectively monitor and evaluate development programme.