six months results announcement - bourse · [email protected] . 3 consolidated...
TRANSCRIPT

SIX MONTHS RESULTS ANNOUNCEMENT International Consolidated Airlines Group (IAG) today (August 2, 2013) presented Group consolidated results for the six months to June 30, 2013. IAG period highlights on results:
Second quarter operating profit €245 million (2012: loss €4 million) before exceptional items, based on strong passenger unit
revenues and non-fuel unit cost improvements
Before Vueling at constant currency, second quarter passenger unit revenue up 4.8 per cent and non-fuel unit costs down 0.2 per
cent
Operating loss for the half year €33 million (2012: loss €253 million) before exceptional items
Revenue for the half year up 2.1 per cent to €8,707 million including 1.7 per cent adverse currency impact
Passenger unit revenue for the half year up 2.8 per cent (4.6 per cent at constant currency), on capacity increase of 1.2 per cent
Fuel costs for the half year down 3.7 per cent to €2,864 million (2012: €2,973 million). Fuel unit costs down 4.7 per cent at
constant currency
Non-fuel costs before exceptional items for the half year up 1.1 per cent at €5,876 million. Non-fuel unit costs down 0.2 per cent,
up 0.9 per cent at constant currency
Cash €3,627 million at June 30, 2013, up €718 million including €549 million of Vueling cash
Adjusted gearing up 3 points to 54 per cent including Vueling Performance summary:
Six months to June 30
Financial data € million
2013 2012
(restated)(1) Higher /
(lower)
Passenger revenue 7,498
7,210
4.0 %
Total revenue
8,707
8,532
2.1 %
Operating loss before exceptional items
(33)
(253)
Exceptional items
(312)
(1)
Operating loss after exceptional items
(345)
(254)
Loss after tax
(503)
(197)
Basic loss per share (€ cents)
(27.9)
(11.7)
Operating figures
2013 2012 Higher /
(lower)
Available seat kilometres (ASK million)
108,545
107,267
1.2 %
Revenue passenger kilometres (RPK million)
86,205
84,555
2.0 %
Seat factor (per cent)
79.4
78.8
0.6pts
Passenger yield per RPK (€ cents)
8.70
8.53
2.0 %
Passenger unit revenue per ASK (€ cents)
6.91
6.72
2.8 %
Non-fuel unit costs per ASK (€ cents)
5.41
5.42
(0.2)%
€ million
At June 30, 2013 At December 31,
2012 Higher /
(lower)
Cash and interest bearing deposits 3,627
2,909
24.7 %
Adjusted net debt(2)
5,220
5,345
(2.3)%
Adjusted gearing(3)
54%
51%
(3pts)
(1) Restated for amendment to IAS 19 ‘Employee Benefits’ accounting standard. (2) Adjusted net debt is net debt plus capitalised operating aircraft lease costs. (3) Adjusted gearing is net debt plus capitalised operating aircraft lease costs, divided by net debt plus capitalised operating aircraft lease costs and adjusted equity.
Willie Walsh, IAG chief executive, said:
“These are positive results for the quarter with an operating profit of €245 million based on total revenue up 3.4 per cent and costs down 2 per cent. Fuel costs were down 3.9 per cent.” “Several factors have contributed to this improvement. Firstly, the benefits of Iberia’s restructuring are beginning to show. Having reduced capacity at Iberia in the first quarter, costs began to be taken out in the second quarter following the implementation of the mediator’s proposal. Nearly 1,700 employees have left the airline so far with remaining staff taking salary reductions of 18 per cent for flight and cabin crew and 11 per cent for all other employees. This is the first step in the restructuring but it is already bearing fruit with Iberia’s losses down from €93 million last year to €35 million reversing the negative trend of the last 11 quarters.” “British Airways’ performance has improved with operating profit up from €94 million in 2012 to €247 million. The London market and transatlantic traffic remains strong, legacy costs from the bmi integration have ended and the airline remains focused on cost control.” “Vueling joined IAG on April 26, 2013 and in the rest of the quarter achieved an operating profit of €27 million. The airline has continued to manage its capacity growth effectively by expanding its business while increasing profits. It’s also benefitted from its Barcelona base where it has developed a strong competitive position”.

2
Trading outlook
In the light of the requirement for the Group to seek shareholder approval for fleet orders and the consequent requirement to report on any outstanding profit forecast as part of that process, IAG is no longer giving guidance at the operating profit level for 2013. However, it provides the following statement on the outlook:
Current trading is in line with recent trends. For 2013, we expect to grow Group capacity by 5.2 per cent including Vueling (reduction of 2.4 per cent excluding Vueling). We should see a reduction in the Group’s non-fuel unit cost (flat excluding Vueling). Forward-looking statements: Certain information included in these statements is forward-looking and involves risks and uncertainties that could cause actual results to differ materially from those expressed or implied by the forward-looking statements. Forward-looking statements include, without limitation, projections relating to results of operations and financial conditions and International Consolidated Airlines Group S.A. (the ‘Group’) plans and objectives for future operations, including, without limitation, discussions of the Group’s Business Plan, expected future revenues, financing plans and expected expenditures and divestments. All forward-looking statements in this report are based upon information known to the Group on the date of this report. The Group undertakes no obligation to publicly update or revise any forward-looking statement, whether as a result of new information, future events or otherwise. It is not reasonably possible to itemise all of the many factors and specific events that could cause the Group’s forward-looking statements to be incorrect or that could otherwise have a material adverse effect on the future operations or results of an airline operating in the global economy. Further information on the primary risks of the business and the risk management process of the Group is given in the Annual Report and Accounts 2012; this document is available on www.iagshares.com.
IAG Investor Relations 2 World Business Centre Heathrow Newall Road, London Heathrow Airport HOUNSLOW TW6 2SF Tel: +44 (0)208 564 2900 [email protected]

3
CONSOLIDATED INCOME STATEMENT
Six months to June 30, 2013 Six months to June 30, 2012 (restated)(1)
€ million
Before exceptional
items
Exceptional items
Total
Before exceptional
items
Exceptional items
Total
Higher / (lower)
Passenger revenue 7,498
7,498
7,210
7,210 4.0 %
Cargo revenue
541
541
590
590 (8.3)%
Other revenue
668
668
732
732 (8.7)%
Total revenue
8,707
8,707
8,532
8,532 2.1 %
Employee costs
2,069
268
2,337
2,070
32
2,102
(0.0)%
Fuel, oil costs and emissions charges
2,864
(3)
2,861
2,973
2,973 (3.7)%
Handling, catering and other operating costs
924
924
851
851 8.6 %
Landing fees and en-route charges
655
655
628
628 4.3 %
Engineering and other aircraft costs
626
15
641
635
635 (1.4)%
Property, IT and other costs
457
5
462
470
(30)
440
(2.8)%
Selling costs
398
398
423
3
426
(5.9)%
Depreciation, amortisation and impairment
498
8
506
512
512 (2.7)%
Aircraft operating lease costs
215
19
234
209
(4)
205
2.9 %
Currency differences
34
34
14
14
Total expenditure on operations
8,740
312
9,052
8,785
1
8,786
(0.5)%
Operating loss
(33)
(312)
(345)
(253)
(1)
(254)
Net non-operating costs
(144)
(17)
(161)
(104)
(104)
Loss before tax from continuing operations
(177)
(329)
(506)
(357)
(1)
(358)
Tax
5
(2)
3
152
9
161
Loss after tax from continuing operations
(172)
(331)
(503)
(205)
8
(197)
Loss after tax from discontinued operations
-
-
-
-
(10)
(10)
Loss after tax for the period
(172)
(331)
(503)
(205)
(2)
(207)
Operating figures
2013 (2) 2012 (2)
Higher / (lower)
Available seat kilometres (ASK million) 108,545
107,267
1.2 %
Revenue passenger kilometres (RPK million)
86,205
84,555
2.0 %
Seat factor (per cent)
79.4
78.8
0.6pts
Passenger numbers (thousands)
29,093
25,721
13.1 %
Cargo tonne kilometres (CTK million)
2,756
3,009
(8.4)%
Passenger yield per RPK
8.70
8.53
2.0 %
Passenger unit revenue per ASK
6.91
6.72
2.8 %
Cargo yield per CTK
19.63
19.61
0.1 %
Total cost per ASK
8.05
8.19
(1.7)%
Fuel cost per ASK
2.64
2.77
(4.7)%
Total cost excluding fuel per ASK
5.41
5.42
(0.2)%
Aircraft in service
435
398
9.3 %
Average employee number
60,590
58,476
3.6 %
(1)Restated for amendment to IAS 19 'Employee Benefits' accounting standard.
(2)
Financial ratios are before exceptional items.
4
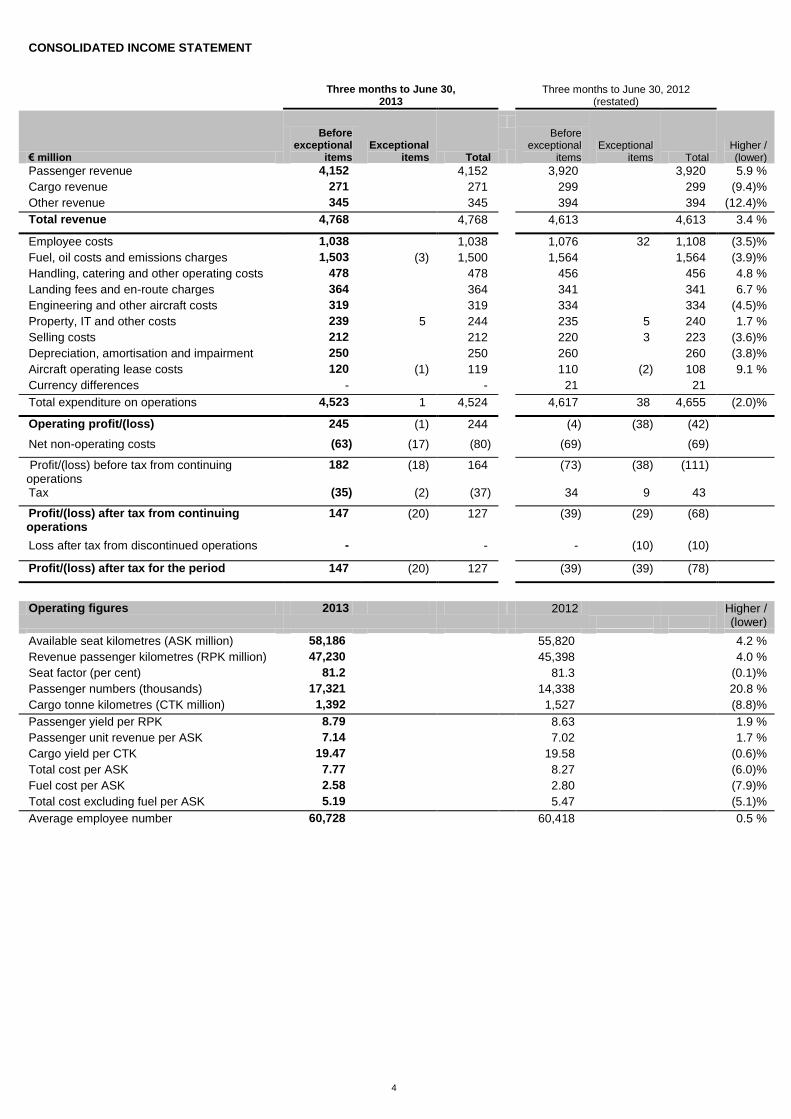
CONSOLIDATED INCOME STATEMENT
Three months to June 30, 2013
Three months to June 30, 2012
(restated)
€ million
Before exceptional
items
Exceptional items
Total
Before exceptional
items
Exceptional items
Total
Higher / (lower)
Passenger revenue 4,152
4,152
3,920
3,920 5.9 %
Cargo revenue 271
271
299
299 (9.4)%
Other revenue 345
345
394
394 (12.4)%
Total revenue 4,768
4,768
4,613
4,613 3.4 %
Employee costs 1,038
1,038
1,076
32
1,108
(3.5)%
Fuel, oil costs and emissions charges 1,503
(3)
1,500
1,564
1,564 (3.9)%
Handling, catering and other operating costs 478
478
456
456 4.8 %
Landing fees and en-route charges 364
364
341
341 6.7 %
Engineering and other aircraft costs 319
319
334
334 (4.5)%
Property, IT and other costs 239
5
244
235
5
240
1.7 %
Selling costs 212
212
220
3
223
(3.6)%
Depreciation, amortisation and impairment 250
250
260
260 (3.8)%
Aircraft operating lease costs 120
(1)
119
110
(2)
108
9.1 %
Currency differences -
-
21
21
Total expenditure on operations 4,523
1
4,524
4,617
38
4,655
(2.0)%
Operating profit/(loss) 245
(1)
244
(4)
(38)
(42)
Net non-operating costs (63)
(17)
(80)
(69)
(69)
Profit/(loss) before tax from continuing operations
182 (18)
164
(73)
(38)
(111)
Tax (35)
(2)
(37)
34
9
43
Profit/(loss) after tax from continuing operations
147 (20)
127
(39)
(29)
(68)
Loss after tax from discontinued operations -
-
-
(10)
(10)
Profit/(loss) after tax for the period 147
(20)
127
(39)
(39)
(78)
Operating figures 2013 2012
Higher / (lower)
Available seat kilometres (ASK million) 58,186
55,820
4.2 %
Revenue passenger kilometres (RPK million) 47,230
45,398
4.0 %
Seat factor (per cent) 81.2
81.3
(0.1)%
Passenger numbers (thousands) 17,321
14,338
20.8 %
Cargo tonne kilometres (CTK million) 1,392
1,527
(8.8)%
Passenger yield per RPK 8.79
8.63
1.9 %
Passenger unit revenue per ASK 7.14
7.02
1.7 %
Cargo yield per CTK 19.47
19.58
(0.6)%
Total cost per ASK 7.77
8.27
(6.0)%
Fuel cost per ASK 2.58
2.80
(7.9)%
Total cost excluding fuel per ASK 5.19
5.47
(5.1)%
Average employee number 60,728
60,418
0.5 %

5
Financial review:
FULL SIX MONTHS PERFORMANCE OF IAG TO PRIOR YEAR SIX MONTHS
Operating and market environment
The half year has seen some stability in fuel prices and foreign exchange rates. Our continental European demand has been higher than
we had expected at the beginning of the year. Our North America market continued to perform well. Africa, South America and Asia,
although having slightly lower economic outlooks than expected are still showing growth opportunities.
Strategic developments
In April, IAG announced that it has placed firm orders for 18 Airbus A350-1000 aircraft and plans to convert 18 Boeing 787 options into firm
orders for British Airways, subject to shareholder approval. These aircraft will be used to replace 30 Boeing 747-400 aircraft between 2017
and 2023. For Iberia, IAG reached agreement with Airbus as well as Boeing to secure commercial terms and delivery slots that could lead
to firm orders for A350s and/or Boeing 787s. Firm orders will only be made when the airline is in a position to grow profitably, having
restructured and reduced its cost base.
On April 23, the majority of Vueling Airlines, S.A.’s (Vueling) shareholders accepted IAG’s cash tender offer for the acquisition of the
remaining shares of the airline. IAG already indirectly owned 45.85 per cent of Vueling and 82.48 per cent of the remaining shareholders
have accepted IAG’s offer of €9.25 per share. Therefore, the IAG Group owns 90.51 per cent of Vueling from the acquisition completion
date of April 26, 2013. The cost of purchasing the Vueling shares was €124 million. On June 27, Vueling agreed at a general shareholders
meeting to delist the remaining 9.49 per cent of shares from the Barcelona, Bilbao, Madrid and Valencia Stock Exchanges.
On May 14, IAG successfully raised €390 million in a senior unsecured convertible bond. The bonds were issued to fund i ts acquisition of
Vueling, enhance liquidity and lower its cost of capital. They accrue a fixed rate of interest of 1.75 per cent per annum, payable semi-
annually in arrears. The conversion price of €4.25 represents a premium of approximately 35 per cent over the volume weighted average
price of ordinary IAG shares on the London Stock Exchange from launch to pricing.
On June 26, IAG announced the successful launch by British Airways of a $927 million publicly-traded bond, using aircraft as collateral.
These bonds are known as EETCs (Enhanced Equipment Trust Certificates) and are a form of aircraft financing commonly used by US
airlines. The transaction included Class A and Class B Certificates, with an annual coupon of 4.625 per cent and 5.625 per cent
respectively. The underlying collateral pool is made up of six new B787-8 aircraft, two new B777-300 ER aircraft and six new A320-200
aircraft, due for delivery within the next 12 months. This is the first time that British Airways has used EETCs and the first time this form of
financing has been used in the UK.
Exchange rates
For the six months the translation of British Airways from sterling functional currency to the Group’s euro reporting currency has resulted in
a €160 million year over year decrease in revenue and a €147 million favourable impact on operating costs, reflecting 2.3 per cent
weakening of the pound sterling against euro.
The transactional exchange rate impacts across the Group for the six months saw a positive impact on revenue of €13 million and an
adverse impact on costs of €86 million.
Therefore the net adverse impact on the half year loss was €86 million, including €147 million adverse impact on revenues and €61 million
favourable on costs.
Vueling
The six month performance to June 30, 2013 includes Vueling from April 26, 2013. Vueling represented 4.1 per cent of the first half
capacity, 3.2 per cent of the total revenue and earned an operating profit of €27 million.
Traffic
Overall capacity grew by 1.2 per cent in the first six months of the year and traffic grew by 2.0 per cent, increasing seat factors 0.6 points
to 79.4 per cent. Excluding Vueling, capacity was down 2.9 per cent and traffic was down 2.1 per cent, leading to seat factor improvement
of 0.7 points.
Passenger revenue
Passenger revenue increased 4.0 per cent compared to the prior year six months or 5.8 per cent at constant currency. Unit passenger
revenue (per ASK) was up 2.8 per cent and passenger yield (per RPK) was up 2.0 per cent. At constant currency passenger unit revenue
was up 4.6 per cent and passenger yield up 3.8 per cent.
The focus during the first six months at British Airways continued to be sustainable yield and unit revenue improvements with restrained
capacity growth to match market demands. At Iberia the focus for the first six months has been the implementation of the Transformation
Plan to improve profitability, reducing capacity by 13.0 per cent, and suspending loss making routes and frequencies.

6
Longhaul
North America capacity decreased by 0.6 per cent and traffic improved by 1.4 per cent, resulting in a seat factor increase of 1.6 points to
83.2 per cent.
Latin America and Caribbean capacity declined by 8.9 per cent and traffic fell by 10.6 per cent leading to a seat factor decrease of 1.6
points to 82.4 per cent.
Africa, Middle East and South Asia saw capacity decreases of 1.1 per cent, traffic decreased by 0.2 per cent leading to a seat factor
increase of 0.6 points to 76.0 per cent.
Asia Pacific capacity increased 1.9 per cent, whilst traffic grew 4.1 per cent, which resulted in a seat factor improvement of 1.7 points to
79.6 per cent.
Shorthaul
The European market has had a strong performance throughout the first half of the year and has benefitted from the addition of Vueling.
Europe saw capacity increase by 13.7 per cent and traffic improved 18.2 per cent leading to a seat factor increase of 2.9 points to 75.3 per
cent. Excluding Vueling, seat factor increases were similar but on a 2.6 per cent capacity decrease.
Domestic capacity increased 22.7 per cent and traffic was up 19.2 per cent leading to a seat factor decrease of 2.1 points to 71.9 per cent.
Excluding Vueling, domestic capacity was down 5.2 per cent, traffic decreased 12.2 per cent leading to a 5.5 points decrease in seat
factor.
Premium
Premium traffic (RPKs) continued to increase in the half year, with a positive mix impact on unit revenues and yields.
Cargo and other revenue
Cargo revenues and volumes were both down but with a small yield improvement of 0.1 per cent over the same period last year.
From April 26, Iberia’s handling and maintenance revenues related to Vueling are eliminated from the Group results. The impact for the
first half of the year was approximately €25 million reduction in both revenues and costs. Other revenue has also been impacted by the
industrial action in Spain due to both losses of productivity in the first quarter and of on-going business in the second quarter. Cargo
handling volumes and yields were also down. Other revenues have seen improvements during the period in areas such as BA Holidays.
Costs
Total costs excluding exceptional items were down €45 million or 0.5 per cent to €8,740 million benefitting from a lower translation
exchange rate reducing costs €147 million offset by transactional currency impacts of €86 million. At constant currency, tota l costs were up
€16 million or 0.2 per cent, on a capacity increase of 1.2 per cent leading to an improvement in total unit costs of 1.0 per cent.
Non-fuel unit costs were down 0.2 per cent. Non-fuel unit costs rose due to timing differences in quarter one from capacity cuts at Iberia as
part of the Transformation Plan in advance of headcount reductions and at British Airways in advance of the new aircraft arriving this year.
Non-fuel unit costs are adversely impacted as we include bmi in quarter one for the first time in 2013; quarter one traditionally generates
higher non-fuel costs per ASK than the rest of the year due to seasonality. Quarter two saw a reversal of these impacts and these were
partially offset by the inclusion of Vueling from April 26, 2013, as it excludes the quarter one period and has an overall lower cost base per
ASK.
Fuel costs were down €109 million or 3.7 per cent to €2,864 million and fuel unit costs were down 4.7 per cent, as a result o f lower fuel
price. At constant currency fuel unit costs were also down 4.7 per cent as adverse transaction exchange rates from the pound sterling to
US dollar movements were offset by translation exchange benefits from pound sterling to euro movements.
Employee costs before exceptional items were flat versus last year but up 1.4 per cent at constant currency, reflecting Vueling costs, wage
awards and higher pension service costs (due to accounting), offset by the impact of the Iberia Transformation Plan. Employee unit costs
at constant currency were flat.
Handling, catering and other operating costs were up 8.6 per cent to €924 million or 10.5 per cent at constant currency. This increase is
driven primarily by the increase in the number of passengers carried during the period of 13.1 per cent, cycling over quarter one where bmi
was not included in the base and the inclusion of Vueling in the second quarter. Other operating costs have also increased as a result of
additional BA Holidays activity, increasing both revenues and costs.
Landing fees and en-route charges rose by 4.3 per cent to €655 million, or up 5.9 per cent at constant currency. Landing fees and en-route
charges have risen due to an increase in the volume of landings and increases in airport charges which have exceeded inflation.

7
Engineering and other aircraft costs before exceptional items were down 1.4 per cent to €626 million, or down 1.6 per cent at constant
currency. The decrease is partially due to reduced third party activity in Spain from industrial action impacting productivity in the first
quarter and a loss of on-going business in the second quarter. These decreases have been partially offset by other volume and price
related increases.
Property, IT and other costs before exceptional items were down €13 million or 2.8 per cent to €457 million. Property, IT and other costs
have decreased due to elimination of bmi head office costs.
Selling costs decreased by 5.9 per cent to €398 million, or down 3.5 per cent at constant currency. The decrease in selling costs is due to
the decrease in passenger numbers at Iberia and the non-repetition of specific 2012 initiatives at British Airways, such as the investment in
Masterbrand and Olympic advertising. These decreases have been partially offset by passenger volume increases at British Airways and
Vueling.
Depreciation, amortisation and impairment costs were down 2.7 per cent to €498 million, which was mostly currency related.
Aircraft operating lease costs before exceptional items rose by 2.9 per cent to €215 million, primarily reflecting an increase of 71 operating
leased aircraft for Vueling and a decrease of nine operating leased aircraft at Iberia.
Exceptional items
Employee restructuring costs associated with the Transformation Plan of Iberia were recorded in 2012, calculated based on Management’s
expectation and taking into consideration the labour laws in Spain. Following acceptance of the mediator proposal in March 2013,
additional employee restructuring provisions of €265 million were recognised. Exceptional restructuring costs of €47 million associated with
the return of leased aircraft and standing down owned aircraft have also been recorded.
The acquisition of Vueling has resulted in a number of exceptional items during the period; the exclusion of fuel cash flow hedges in place
at the time of acquisition resulting in a €3 million credit, acquisition costs related to the transaction of €5 million and a step acquisition loss
related to the original investment held of €17 million. In addition there was an exceptional credit of €2 million related to aircraft lease cash
flow hedges acquired upon the Iberia acquisition.
Prior year exceptional items mainly reflect the benefit realised in the first quarter related to the settlement of competition fines in the UK
leading to a release of provision of €35 million and costs associated with the restructuring of the bmi acquired mainline business which
amounted to €40 million in the second quarter, including €8 million of transaction and integration costs for the bmi acquisit ion. In addition,
there was an exceptional credit of €4 million in the prior six months related to aircraft lease cash flow hedges acquired upon the Iberia
acquisition.
Operating loss
IAG operating loss before exceptional items for the six months was €33 million, compared to a loss of €253 million in the first half of 2012.
Non-operating items
Non-operating costs have increased from €104 million to €144 million due to increases in net financing charges of €32 million and €10
million related to IAG’s share of Vueling’s pre-acquisition losses from equity accounting.
Taxation
During the period deferred tax assets related to Iberia’s current period losses have not been recognised. The recognition of these deferred
tax assets will be reviewed in the second half of the year as part of the annual Business planning process. Excluding this impact, the tax
credit for the quarter of €3 million reflects an effective rate for the Group of 35 per cent.
Discontinued operations
Prior year discontinued operations represents the post-tax loss for the period of bmi regional and bmibaby. bmi regional was sold during
the prior period and bmibaby ceased operations in quarter three 2012.
Cash
Cash at June 30, 2013 was €3,627 million, up €718 million from December 31, 2012. The increase in cash reflects the proceeds from the
€390 million convertible bond, net of the Vueling consideration and acquisition costs; and the cash balances held by Vueling. These
increases have been partially offset by cash used by both British Airways and Iberia since year end in line with the seasonality of business.
The cash balance at June 30, 2013 comprised €2,116 million held by British Airways, €690 million held by Iberia, €549 million held by
Vueling and €272 million held by IAG holding companies.

8
Business review
Our mission is to be the leading international airline group. This means we will:
win the customer through service and value across our global network;
deliver higher returns to our shareholders through leveraging cost and revenue opportunities across the Group;
attract and develop the best people in the industry;
provide a platform for quality international airlines, leaders in their markets, to participate in consolidation;
retain the distinct cultures and brands of individual airlines.
By accomplishing our mission, IAG will help to shape the future of the industry, set new standards of excellence and provide sustainability,
security and growth.
Principal risks and uncertainties
During the period we have continued to maintain and operate our structure and processes to identify, assess and manage risks. The
principal risks and uncertainties affecting us, detailed on pages 79 to 81 of the December 31, 2012 Annual Report and Accounts, remain
relevant for the remaining six months of the year.

9
INTERNATIONAL CONSOLIDATED AIRLINES GROUP S.A.
Unaudited Condensed Consolidated Interim Financial Statements
January 1, 2013 – June 30, 2013

10
CONSOLIDATED INCOME STATEMENT
Six months to June 30, 2013 Six months to June 30, 2012
(restated)
€ million Before
exceptional items
Exceptional items Total
Before exceptional
items Exceptional
items Total
Passenger revenue 7,498 7,498 7,210 7,210
Cargo revenue 541 541 590 590
Other revenue 668 668 732 732
Total revenue 8,707 8,707 8,532 8,532
Employee costs 2,069 268 2,337 2,070 32 2,102
Fuel, oil costs and emissions charges 2,864 (3) 2,861 2,973 2,973
Handling, catering and other operating costs 924 924 851 851
Landing fees and en-route charges 655 655 628 628
Engineering and other aircraft costs 626 15 641 635 635
Property, IT and other costs 457 5 462 470 (30) 440
Selling costs 398 398 423 3 426
Depreciation, amortisation and impairment 498 8 506 512 512
Aircraft operating lease costs 215 19 234 209 (4) 205
Currency differences 34 34 14 14
Total expenditure on operations 8,740 312 9,052 8,785 1 8,786
Operating loss (33) (312) (345) (253) (1) (254)
Finance costs (127) (127) (119) (119)
Finance income 13 13 27 27
Retranslation charges on currency borrowings (4) (4) - -
Losses on derivatives not qualifying for hedge accounting
7 7 2 2
Share of post-tax losses in associates accounted for using the equity method
(10) (10) - -
Loss on sale of property, plant and equipment and investments
(2) (17) (19) (3) (3)
Net financing charge relating to pensions (21) (21) (11) (11)
Loss before tax from continuing operations (177) (329) (506) (357) (1) (358)
Tax 5 (2) 3 152 9 161
Loss after tax from continuing operations (172) (331) (503) (205) 8 (197)
Loss after tax from discontinued operations - - - (10) (10)
Loss after tax for the period (172) (331) (503) (205) (2) (207)
Attributable to:
Equity holder of the parent (184) (515) (215) (217)
Non-controlling interest 12 12 10 10
(172) (503) (205) (207)
Basic loss per share (€ cents)
From continuing operations (27.9) (11.1)
From discontinued operations - (0.6)
From loss for the period (27.9) (11.7)
Diluted loss per share (€ cents)
From continuing operations (27.9) (11.1)
From discontinued operations - (0.6)
From loss for the period (27.9) (11.7)
11
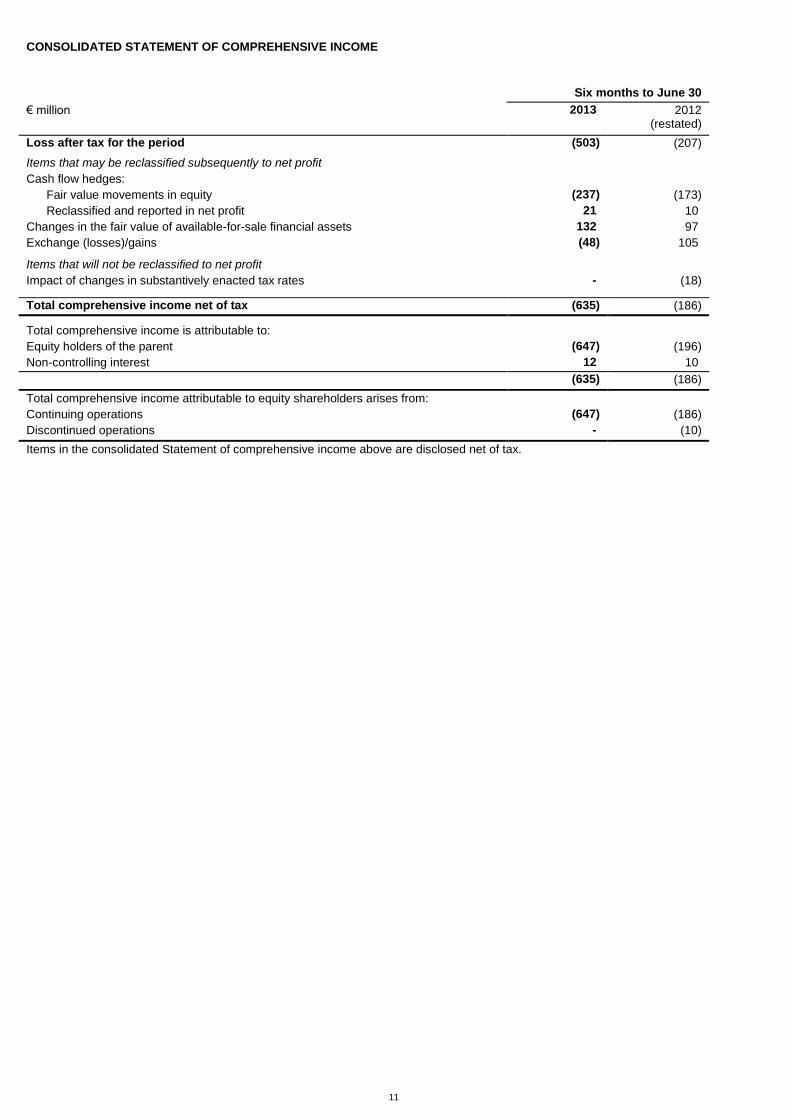
CONSOLIDATED STATEMENT OF COMPREHENSIVE INCOME
Six months to June 30
€ million 2013 2012 (restated)
Loss after tax for the period (503) (207)
Items that may be reclassified subsequently to net profit
Cash flow hedges:
Fair value movements in equity (237) (173)
Reclassified and reported in net profit 21 10
Changes in the fair value of available-for-sale financial assets 132 97
Exchange (losses)/gains (48) 105
Items that will not be reclassified to net profit
Impact of changes in substantively enacted tax rates - (18)
Total comprehensive income net of tax (635) (186)
Total comprehensive income is attributable to:
Equity holders of the parent (647) (196)
Non-controlling interest 12 10
(635) (186)
Total comprehensive income attributable to equity shareholders arises from:
Continuing operations (647) (186)
Discontinued operations - (10)
Items in the consolidated Statement of comprehensive income above are disclosed net of tax.
12
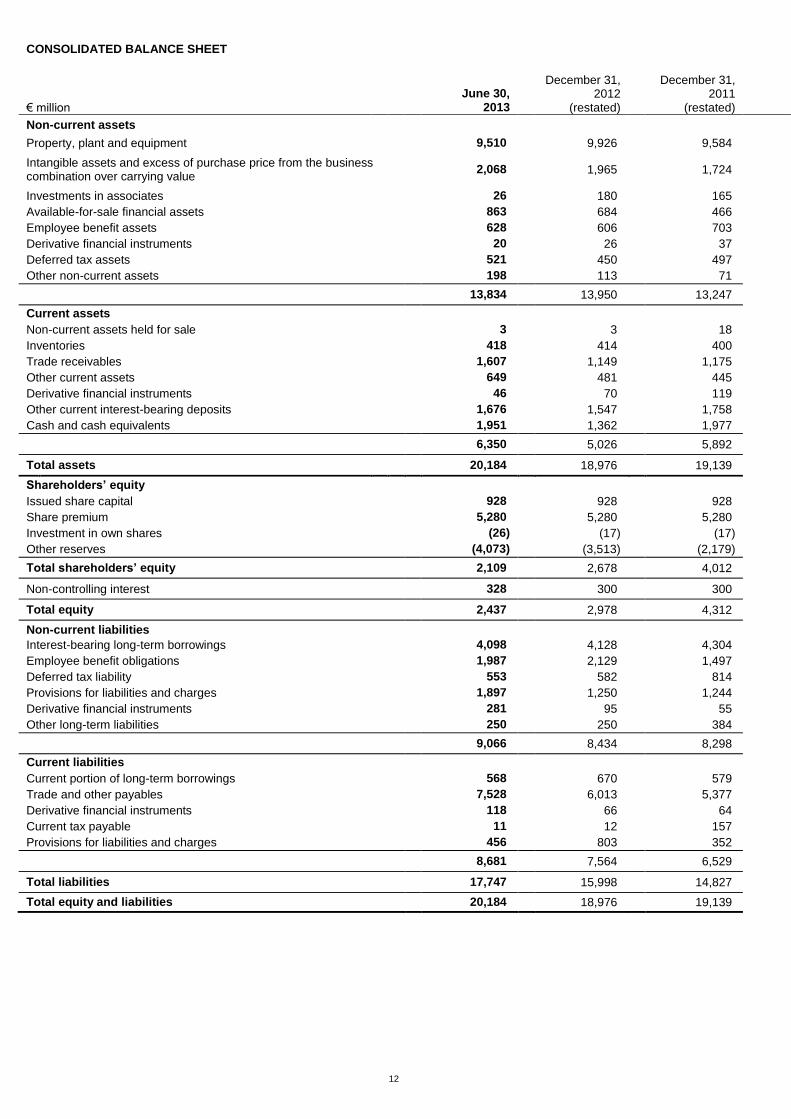
CONSOLIDATED BALANCE SHEET
€ million
June 30, 2013
December 31, 2012
(restated)
December 31, 2011
(restated)
Non-current assets
Property, plant and equipment 9,510 9,926 9,584
Intangible assets and excess of purchase price from the business combination over carrying value
2,068 1,965 1,724
Investments in associates 26 180 165
Available-for-sale financial assets 863 684 466
Employee benefit assets 628 606 703
Derivative financial instruments 20 26 37
Deferred tax assets 521 450 497
Other non-current assets 198 113 71
13,834 13,950 13,247
Current assets
Non-current assets held for sale 3 3 18
Inventories 418 414 400
Trade receivables 1,607 1,149 1,175
Other current assets 649 481 445
Derivative financial instruments 46 70 119
Other current interest-bearing deposits 1,676 1,547 1,758
Cash and cash equivalents 1,951 1,362 1,977
6,350 5,026 5,892
Total assets 20,184 18,976 19,139
Shareholders’ equity
Issued share capital 928 928 928
Share premium 5,280 5,280 5,280
Investment in own shares (26) (17) (17)
Other reserves (4,073) (3,513) (2,179)
Total shareholders’ equity 2,109 2,678 4,012
Non-controlling interest 328 300 300
Total equity 2,437 2,978 4,312
Non-current liabilities
Interest-bearing long-term borrowings 4,098 4,128 4,304
Employee benefit obligations 1,987 2,129 1,497
Deferred tax liability 553 582 814
Provisions for liabilities and charges 1,897 1,250 1,244
Derivative financial instruments 281 95 55
Other long-term liabilities 250 250 384
9,066 8,434 8,298
Current liabilities
Current portion of long-term borrowings 568 670 579
Trade and other payables 7,528 6,013 5,377
Derivative financial instruments 118 66 64
Current tax payable 11 12 157
Provisions for liabilities and charges 456 803 352
8,681 7,564 6,529
Total liabilities 17,747 15,998 14,827
Total equity and liabilities 20,184 18,976 19,139

13
CONSOLIDATED CASH FLOW STATEMENT
Six months to June 30
€ million
2013
2012
Cash flows from operating activities
Operating loss (345) (254)
Depreciation, amortisation and impairment 506 512
Movement in working capital and other non-cash movements 1,064 802
Settlement of competition investigation (32) (70)
Cash payments to pension schemes (net of service costs) (123) (231)
Interest paid
(93)
(99)
Taxation
-
(5)
Net cash flows from operating activities from continuing operations 977 655
Net cash flows used in operating activities from discontinued operations
(20)
(64)
Net cash flows from operating activities 957 591
Cash flows from investing activities
Acquisition of property, plant and equipment and intangible assets (939) (664)
Sale of property, plant and equipment and investments 396 27
Cash on business combinations (net of consideration) 282 (14)
Interest received 14 23
Increase in other current interest-bearing deposits (174) (88)
Dividends received 1 6
Other investing movements 5 -
Net cash flows from investing activities (415) (710)
Cash flows from financing activities
Proceeds from long-term borrowings
49
433
Proceeds from convertible bond
386
-
Repayment of borrowings
(155)
(131)
Repayment of finance leases
(224)
(116)
Acquisition of own shares (8) -
Distributions made to holders of perpetual securities
(10)
(10)
Net cash flows from financing activities
38
176
Net increase in cash and cash equivalents 580 57
Net foreign exchange differences 9 69
Cash and cash equivalents at 1 January 1,362 1,977
Cash and cash equivalents at period end
1,951
2,103
Interest bearing deposits maturing after more than three months
1,676
1,910
Cash, cash equivalents and other interest bearing deposits
3,627
4,013

14
CONSOLIDATED STATEMENT OF CHANGES IN EQUITY
For the six months to June 30, 2013
Issued share
capital
Share premium
Investment in own shares
Other reserves
(1)
Total shareholder
equity
Non-controlling
interest Total
equity
€ million
At January 1, 2013
928
5,280 (17) (1,436)
4,755
300 5,055
Restatement
-
- - (2,077)
(2,077)
- (2,077)
At January 1, 2013 (restated) 928
5,280 (17) (3,513)
2,678
300 2,978
Total comprehensive income for the period (net of tax)
-
- - (647) (647)
12 (635)
Cost of share-based payments
-
- - 16
16
- 16
Exercise of share options
-
- - (1)
(1)
- (1)
Acquisition of own shares
-
- (9) -
(9)
- (9)
Equity portion of convertible bond issued
-
- - 72
72
- 72
Non-controlling interest arising on business combination
-
- - - -
26 26
Distributions made to holders of perpetual securities
-
- - - -
(10) (10)
At June 30, 2013
928
5,280 (26) (4,073)
2,109
328 2,437
(1)Closing balance includes a retained deficit of €1,834 million (excluding pensions restatement: retained earnings of €243 million).
For the six months to June 30, 2012
Issued share
capital
Share premium
Investment in own shares
Other reserves
(1)
Total shareholder
equity
Non-controlling
interest Total
equity
€ million
At January 1, 2012
928
5,280 (17) (805)
5,386
300 5,686
Restatement
-
- - (1,374)
(1,374)
- (1,374)
At January 1, 2012 (restated) 928
5,280 (17) (2,179)
4,012
300 4,312
Total comprehensive income for the period (net of tax)
(restated)
-
- - (196) (196)
10 (186)
Cost of share-based payments
-
- - 8
8
- 8
Distributions made to holders of perpetual securities
-
- - - -
(10) (10)
At June 30, 2012
928
5,280 (17) (2,367)
3,824
300 4,124
(1)Closing balance includes retained earnings of €64 million (excluding pensions restatement: retained earnings of €1,422 million).

NOTES TO THE ACCOUNTS
For the six months to June 30, 2013
15
1. CORPORATE INFORMATION AND BASIS OF PREPARATION
On January 21, 2011 British Airways Plc and Iberia Líneas Aéreas de España S.A. Operadora (hereinafter ‘British Airways’ and ‘Iberia’ respectively) completed a merger transaction of the two companies to create a new leading European airline group. As a result of the merger, International Consolidated Airlines Group S.A. (hereinafter ‘International Airlines Group’, ‘IAG’ or the ‘Group’) was formed to hold the interests of both the existing airline groups. IAG is a Spanish company registered in Madrid and was incorporated on April 8, 2010.
IAG shares are traded on the London Stock Exchange’s main market for listed securities and also on the stock exchanges of Madrid, Barcelona, Bilbao and Valencia (the ‘Spanish Stock Exchanges’), through the Spanish Stock Exchanges Interconnection System (Mercado Continuo Español). The Group’s summary condensed consolidated interim financial statements for the six months to June 30, 2013 were prepared in accordance with IAS 34 and authorised for issue by the Board of Directors on August 1, 2013. The condensed financial statements herein are not the Company’s statutory accounts and are unaudited. The basis of preparation and accounting policies set out in the IAG Annual Report and Accounts for the year to December 31, 2012 have been applied in the preparation of these summary condensed consolidated interim financial statements. IAG’s financial statements for the year to December 31, 2012 have been filed with the Registro Mercantil de Madrid, and are in accordance with the International Financial Reporting Standards as adopted by the European Union (IFRSs as adopted by the EU) and with those of the Standing Interpretations issued by the International Financial Reporting Interpretations Committee (IFRIC) of the International Accounting Standards Board (IASB). The report of the auditors on those financial statements was unqualified. For the purposes of these statements IFRS also includes International Accounting Standards.
On April 23, 2013, the majority of Vueling Airlines, S.A.’s (Vueling) shareholders accepted IAG’s cash tender offer for the acquisition of the remaining shares of the airline. IAG already indirectly owned 45.85 per cent of Vueling and 82.48 per cent of the remaining shareholders have accepted IAG’s offer of €9.25 per share. Therefore, the IAG Group owns 90.51 per cent of Vueling from the acquisition completion date of April 26, 2013. The cost of purchasing the Vueling shares was €124 million. The Group has launched a public tender offer over the remaining 9.49 per cent of Vueling shares which are not already owned by the IAG Group. The delisting tender offer is €9.25 per share. Vueling will be delisted from the Barcelona, Bilbao, Madrid and Valencia stock exchanges upon successful completion of the offer.
2. ACCOUNTING POLICIES
The Directors consider that the Group has adequate resources to remain in operation for the foreseeable future and have therefore continued to adopt the going concern basis in preparing the interim financial statements. The accounting policies and methods of calculation adopted are consistent with those of the annual financial statements for the year to December 31, 2012, as described in the financial statements of IAG, except as set out below:
Prior period restatement - Adoption of IAS 19 ‘Employee Benefits’ accounting standard
The Group has adopted amendments to IAS 19 ‘Employee Benefits’ from January 1, 2013 and has retrospectively applied these
changes to the comparative information.
The revised standard has eliminated the use of the corridor approach. This has resulted in recognition of all re-measurements of
the defined benefit liability or asset including gains and losses in Other comprehensive income. At December 31, 2012 the net
pensions liability has been increased to reflect previously unrecognised cumulative net losses, being an increase in the net
liability of €2,697 million, partially offset by an increase in the related deferred tax asset of €620 million. Total equity is restated at
December 31, 2012 to reduce equity by €2,077 million to €2,978 million.
NOTES TO THE ACCOUNTS continued
For the six months to June 30, 2013
16
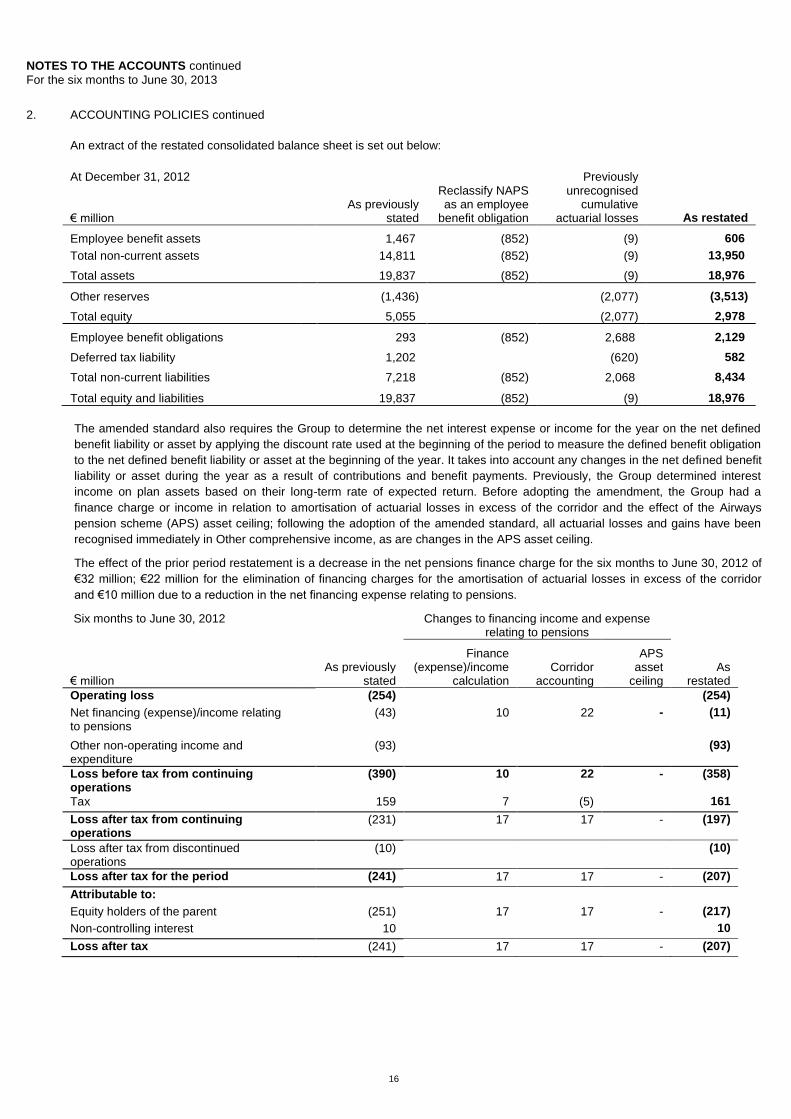
2.
ACCOUNTING POLICIES continued
An extract of the restated consolidated balance sheet is set out below:
At December 31, 2012 € million
As previously stated
Reclassify NAPS as an employee
benefit obligation
Previously unrecognised
cumulative actuarial losses As restated
Employee benefit assets 1,467 (852) (9) 606
Total non-current assets 14,811 (852) (9) 13,950
Total assets 19,837 (852) (9) 18,976
Other reserves (1,436) (2,077) (3,513)
Total equity 5,055 (2,077) 2,978
Employee benefit obligations 293 (852) 2,688 2,129
Deferred tax liability 1,202 (620) 582
Total non-current liabilities 7,218 (852) 2,068 8,434
Total equity and liabilities 19,837 (852) (9) 18,976
The amended standard also requires the Group to determine the net interest expense or income for the year on the net defined
benefit liability or asset by applying the discount rate used at the beginning of the period to measure the defined benefit obligation
to the net defined benefit liability or asset at the beginning of the year. It takes into account any changes in the net defined benefit
liability or asset during the year as a result of contributions and benefit payments. Previously, the Group determined interest
income on plan assets based on their long-term rate of expected return. Before adopting the amendment, the Group had a
finance charge or income in relation to amortisation of actuarial losses in excess of the corridor and the effect of the Airways
pension scheme (APS) asset ceiling; following the adoption of the amended standard, all actuarial losses and gains have been
recognised immediately in Other comprehensive income, as are changes in the APS asset ceiling.
The effect of the prior period restatement is a decrease in the net pensions finance charge for the six months to June 30, 2012 of
€32 million; €22 million for the elimination of financing charges for the amortisation of actuarial losses in excess of the corridor
and €10 million due to a reduction in the net financing expense relating to pensions.
Six months to June 30, 2012
Changes to financing income and expense relating to pensions
€ million As previously
stated
Finance (expense)/income
calculation Corridor
accounting
APS asset
ceiling As
restated
Operating loss (254) (254)
Net financing (expense)/income relating to pensions
(43) 10 22 - (11)
Other non-operating income and expenditure
(93) (93)
Loss before tax from continuing operations
(390) 10 22 - (358)
Tax 159 7 (5) 161
Loss after tax from continuing operations
(231) 17 17 - (197)
Loss after tax from discontinued operations
(10) (10)
Loss after tax for the period (241) 17 17 - (207)
Attributable to:
Equity holders of the parent (251) 17 17 - (217)
Non-controlling interest 10 10
Loss after tax (241) 17 17 - (207)

NOTES TO THE ACCOUNTS continued
For the six months to June 30, 2013
17
2. ACCOUNTING POLICIES continued
Actuarial remeasurements will occur at each year end, resulting in no such adjustment for the six months to June 30, 2012. In
addition, the impact of changes in substantively enacted tax rates on deferred tax assets relating to pensions results in a charge
of €18 million for the six months to June 30, 2012, with a reduction in the substantively enacted tax rate from 25 per cent to 24 per
cent occurring in this period, resulting in a reduction in the valuation of the deferred tax assets.
Unrecognised cumulative gains of €3 million in relation to APS are now recognised as these represent the difference between the
net pension asset recognised and the APS asset ceiling restriction at December 31, 2011. At December 31, 2011 the net
pensions liability has been increased to reflect previously unrecognised cumulative net losses, being an increase in the net
liability of €1,834 million, partially offset by an increase in the related deferred tax asset of €460 million. Total equity is restated at
December 31, 2011 to reduce equity by €1,374 million to €4,312 million.
An extract of the restated consolidated balance sheet is set out below:
At December 31, 2011 € million
As previously stated
Reclassify NAPS as an employee
benefit obligation
Previously unrecognised
cumulative actuarial losses As restated
Employee benefit assets 1,317 (608) (6) 703
Total non-current assets 13,861 (608) (6) 13,247
Total assets 19,753 (608) (6) 19,139
Other reserves (805) (1,374) (2,179)
Total equity 5,686 (1,374) 4,312
Employee benefit obligations 277 (608) 1,828 1,497
Deferred tax liability 1,274 (460) 814
Total non-current liabilities 7,538 (608) 1,368 8,298
Total equity and liabilities 19,753 (608) (6) 19,139
The Group has adopted the following amendments from January 1, 2013: IFRS 7 (Amendment) ‘Financial Instruments: Disclosures’. The amendment includes multiple clarifications related to the disclosure of financial instruments. The standard requires a change in the presentation of the Group’s notes to the financial statements but has no impact on reported profits. IFRS 13 ‘Fair value measurement’. The standard aims to improve consistency and reduce complexity by providing a precise definition of fair value and a single source of fair value measurement and disclosure requirements for use across IFRSs. The requirements do not extend the use of fair value accounting but provide guidance on how it should be applied where its use is already required or permitted by other standards within IFRS. IAS 1 (Amendment) ‘Financial statement presentation’. This amendment requires companies to group together items within other comprehensive income that may be reclassified to the profit or loss section of the income statement. Items in the other comprehensive income should be presented as either a single statement or two consecutive primary statements.
Other amendments resulting from improvements to IFRSs did not have any impact on the accounting policies, financial position or
performance of the Group. The Group has not early adopted any standard, interpretation or amendment that has been issued but
not yet effective.

NOTES TO THE ACCOUNTS continued
For the six months to June 30, 2013
18
3. BUSINESS COMBINATIONS
On April 26, 2013, the Group acquired a further 44.66 per cent of the issued share capital of Vueling for €9.25 per share. The cost of purchasing the additional Vueling shares was €124 million. The Group already indirectly owned 45.85 per cent of Vueling through its subsidiary Iberia. Therefore, the IAG Group owns 90.51 per cent of Vueling. The acquisition will contribute to the geographic diversification of the Group. Through Vueling’s leading position in Barcelona and growth in the rest of Europe, IAG expects incremental synergies primarily from purchasing and financing, additionally Vueling incorporates a low-cost platform for the Group. The assets and liabilities arising from the acquisition are as follows:
€ million Carrying value
Property, plant and equipment 3
Intangible assets 68
Other non-current assets 160
Cash and cash equivalents 406
Other current interest-bearing deposits 24
Trade receivables(1)
70
Other current assets 133
Trade and other payables (436)
Provision for liabilities and charges
(217)
Net identifiable assets/(liabilities) acquired 211
(1)
The gross contractual amount for trade receivables is €70 million, 100 per cent of which is expected to be collected.
The excess of purchase price over carrying value is recognised as follows:
€ million
Cash consideration(1)
124
Fair value of pre-existing interest in Vueling 127
Purchase price representing IAG's 90.51 per cent ownership in Vueling 251
Non-controlling interest(2)
26
Provisional fair value of identifiable net assets (211)
Excess of purchase price over carrying value(3)
66
(1)
There is no deferred or contingent consideration. (2)
The non-controlling interest has been valued at €9.25 per share (note 1). (3)
Fair values have not yet been finalised. The carrying values of the assets and liabilities have been adjusted to align Vueling to Group accounting policies.
Transaction costs related to the acquisition of Vueling totalling €5 million were recognised within Exceptional items in the Income statement for the period to June 30, 2013.
The Vueling contribution to the consolidated Group results was total revenues of €281 million, and an operating profit of €27 million. Had Vueling been consolidated from January 1, 2013, the Group would have reported total revenue of €8,989 million and an operating loss after exceptional items of €376 million for the six months to June 30, 2013.

NOTES TO THE ACCOUNTS continued
For the six months to June 30, 2013
19
4. EXCEPTIONAL ITEMS
Six months to June 30
€ million 2013 2012
Restructuring costs - employee(1)
268 -
Restructuring costs - aircraft(1)
44 -
Settlement of competition investigation(2)
-
(35)
Business combination costs(3)
5
40
Pre-acquisition cash flow hedge impact(4)
(5)
(4)
Recognised in expenditure on operations 312
1
Loss on step acquisition(5)
17
-
Loss on discontinued operations(6)
-
10
Total exceptional charge before tax
329
11
(1)
Restructuring costs A restructuring expense of €312 million has been recognised in relation to the Iberia Transformation Plan. Employee restructuring costs associated with the Transformation Plan of Iberia were recorded in 2012, calculated based on Management’s expectation of the application of the new labour law in Spain. During the period, €265 million of additional employee restructuring costs have been charged to reflect the increased cost of the severance as proposed by the mediator agreement. Restructuring costs of €47 million associated with the return of leased aircraft and standing down owned aircraft have also been recorded. (2)
Provisions In April 2012, British Airways settled a fine with the Office of Fair Trading in the UK relating to investigations into passenger fuel surcharging dating back to 2004 through to 2006. The fine agreed was €70 million (£58.5 million), resulting in a €35 million release in the 6 months to June 30, 2012 of the provision held. This provision release was considered exceptional due to its size, incidence and in line with the recognition of the original charge. (3)
Business combination costs Transaction expenses of €5 million have been recognised in relation to Vueling in the period to June 30, 2013.
A restructuring expense of €32 million was recognised in relation to bmi mainline for the six months to June 30, 2012, and transaction and integration expenses of €8 million.
(4)Derivatives and financial instruments
On January 21, 2011, Iberia had a portfolio of cash flow hedges with a net mark-to-market charge of €67 million recorded within Other reserves on the Balance sheet. On April 26, 2013, Vueling had a portfolio of cash flow hedges with a net mark-to-market charge which rounds to nil recorded within Other reserves in the Balance sheet. As these cash flow hedge positions unwind, Iberia and Vueling will recycle the impact from Other reserves through their respective Income statement. The Group does not recognise the pre-acquisition cash flow hedge net position within Other reserves on the Balance sheet, resulting in fuel and aircraft operating lease costs being gross of the pre-acquisition cash flow hedge positions. For the six months to June 30, 2013 this has resulted in a decrease in reported aircraft operating lease costs of €2 million (2012: decrease of €4 million), a decrease in reported fuel expense of €3 million and a related €2 million tax charge.
(5)Loss on step acquisition
As a result of Iberia’s initial investment in Vueling, the Business combination was achieved in stages. The Group revalued its initial investment in Vueling to fair value at the acquisition date resulting in a non-cash loss of €17 million recognised in the Loss on sale of property, plant and equipment and investments line within Exceptional items in the Income statement.
(6)Loss on discontinued operations
From the date of acquisition, the loss after tax from discontinued operations of bmibaby and bmi regional was €10 million for the six months to June 30, 2012.
5. SEASONALITY
The Group’s business is highly seasonal with demand strongest during the summer months. Accordingly higher revenues and operating profits are usually expected in the latter six months of the financial year than in the first six months.

NOTES TO THE ACCOUNTS continued
For the six months to June 30, 2013
20
6. SEGMENT INFORMATION
a. Business segments British Airways, Iberia and Vueling are managed as individual operating companies. Each company operates its network operations as a single business unit. The chief operating decision maker is responsible for allocating resources and assessing performance of the operating segments, and has been identified as the IAG Management Committee. The IAG Management Committee makes resource allocation decisions based on network profitability, primarily by reference to the markets in which the companies operate. The objective in making resource allocation decisions is to optimise consolidated financial results. Therefore, based on the way the Group treats its businesses, and the manner in which resource allocation decisions are made, the Group has three (2012: two) reportable operating segments for financial reporting purposes, reported as British Airways, Iberia and Vueling.
For the six months to June 30, 2013
€ million
British Airways
Iberia Vueling
(1) Unallocated Total
Revenue
External revenue
6,455
1,971 281 - 8,707
Inter-segment revenue
8
38 - 45 91
Segment revenue
6,463
2,009 281 45 8,798
Depreciation and amortisation
(416)
(91) (1) 2 (506)
Operating profit/(loss)
(2) 175
(551) 27 4 (345)
Net non-operating costs
(161)
Loss before tax from continuing operations
(506)
(1) The Vueling performance is reported under the Group accounting policies and represents results from the acquisition
date of April 26, 2013.
(2) The Iberia segment includes an exceptional charge of €312 million related to the Iberia transformation plan, and the
Unallocated segment includes an exceptional credit of €5 million associated with derivatives and financial instruments, and an exceptional charge of €5 million related to business combination costs (note 4).
For the six months to June 30, 2012
€ million
British Airways Iberia Unallocated Total
Revenue
External revenue
6,242 2,290 - 8,532
Inter-segment revenue
12 19 22 53
Segment revenue
6,254 2,309 22 8,585
Depreciation, amortisation and impairment
(419) (84) (9) (512)
Operating profit/(loss)
(1) 13 (263) (4) (254)
Net non-operating costs (104)
Loss before tax from continuing operations
(358)
(2)
The British Airways segment includes an exceptional charge of €5 million, and the Unallocated
(1)The British Airways segment includes an exceptional charge of €5 million, and the Unallocated segment includes an exceptional
credit of €4 million (note 4). b. Geographical analysis
Revenue by area of original sale
Six months to June 30
Six months to June 30
€ million 2013 2012
UK 2,968 2,874
Spain 1,219 1,245
USA 1,299 1,316
Rest of world 3,221 3,097
8,707 8,532

NOTES TO THE ACCOUNTS continued
For the six months to June 30, 2013
21
6. SEGMENT INFORMATION continued b. Geographical analysis continued
Assets by area At June 30, 2013
€ million
Property, plant and equipment
Intangible assets
UK 8,186 943
Spain 1,254 1,089
USA 59 5
Unallocated 11 31
Total 9,510 2,068
At December 31, 2012 € million
UK 8,460 968
Spain 1,394 960
USA 61 5 Unallocated 11 32
Total 9,926 1,965
7. FINANCE COSTS AND INCOME
Six months to June 30,
€ million 2013
2012 (restated)
Finance costs
Interest payable on bank and other loans, finance charges payable under finance leases (111) (117)
Unwinding of discount on provisions (20) (17)
Capitalised interest on progress payments 2 2
Change in fair value of cross currency swaps (1) 2
Currency credits on financial fixed assets 3 11
Total finance costs (127) (119)
Finance income
Interest on other interest bearing deposits 13 27
Total finance income 13 27
Net charge relating to pensions
Net financing expense relating to pensions (21) (11)
Net financing charge relating to pensions (21) (11)
8. TAX
The tax credit for the six months to June 30, 2013 is €3 million (six months to June 30, 2012 (restated): €161 million credit). During the period €174 million of deferred tax assets related to current year Iberia tax losses incurred have not been recognised. The recovery of these tax losses will be reviewed as part of the annual Business Plan review in the second half of the year. Excluding the tax assets not recognised during the period, the effective tax rate for the six months to June 30, 2013 was 35 per cent. Reductions to the UK corporation tax rate to 21 per cent from April 1, 2014 and 20 per cent from April 1, 2015 have been substantively enacted in July 2013. The total estimated financial effect of these announced changes is a reduction in the net deferred tax liability of €43 million and will be recorded in the second half of the year.
9. EARNINGS PER SHARE
Basic earnings per share for the six months to June 30, 2013 are calculated on a weighted average of 1,848,760,446 ordinary shares and adjusted for shares held for the purposes of Employee Share Ownership Plans. Diluted earnings per share for the period to June 30, 2013 are calculated on a weighted average of 2,168,681,808 diluted ordinary shares (2012: 2,050,822,515). The number of shares in issue at June 30, 2013 was 1,855,369,557 ordinary shares of €0.50 each (2012: 1,855,369,557 ordinary shares of €0.50 each).

NOTES TO THE ACCOUNTS continued
For the six months to June 30, 2013
22
10. DIVIDENDS
The Directors propose that no dividend be paid for the six months to June 30, 2013 (June 30, 2012: €nil). 11. PROPERTY, PLANT AND EQUIPMENT AND INTANGIBLE ASSETS
€ million
Property, plant and
equipment Intangible
assets
Net book value at January 1, 2013 9,926 1,965
Additions 866 53
Acquired through business combination 3 134
Disposals (399) (24)
Depreciation, amortisation and impairment (492) (14)
Exchange movements (394) (46)
Net book value at June 30, 2013 9,510 2,068
Net book value at January 1, 2012 9,584 1,724
Additions 616 48
Acquired through business combination 103 313
Disposals (11) -
Reclassifications (8) (3)
Depreciation, amortisation and impairment (489) (23)
Exchange movements 310 22
Net book value at June 30, 2012 10,105 2,081
Capital expenditure authorised and contracted for but not provided for in the accounts amounts to €5,083 million for the Group commitments (December 31, 2012: €4,910 million). In April 2013, IAG announced that it has placed firm orders for 18 Airbus A350-1000 aircraft and plans to convert 18 Boeing 787 options into firm orders for British Airways, subject to shareholder approval. These amounts will be included in capital expenditure authorised but not provided for once shareholder approval has been obtained. The majority of capital expenditure commitments are denominated in US dollars and are subject to fluctuations in exchange rates.
12. IMPAIRMENT REVIEW
At December 31, 2012 as part of the annual impairment test of the Iberia cash generating unit, the carrying amount of Iberia’s goodwill was fully impaired and the carrying amount of its Brand was impaired by €79 million. The impairment of these assets reduced Iberia’s carrying value to its estimated value-in-use. Any further declines in Iberia’s estimated value-in-use remains liable for additional impairment of Brand, customer loyalty programmes or landing rights. Any increase in Iberia’s estimated value-in-use could result in the reversal of all or a portion of the original impairment of Brand. Annually the Group prepares and approves formal five year Business Plans during the second half of the year. For the six months to June 30, 2013, Management has reviewed the indefinite life intangible assets using consistent methodologies from year end as disclosed in the 2012 Annual report and accounts. The 2012 Business Plans were updated with the 2013 revised full year forecast for this exercise, taking into account the impacts of the mediator agreements. Based on these revised assumptions, management considers the carrying values to continue to be supported at June 30, 2013.
13. NON-CURRENT ASSETS HELD FOR SALE The non-current assets held for sale of €3 million represent property acquired as part of the bmi acquisition which is expected to
be sold within 12 months (2012: €3 million).

NOTES TO THE ACCOUNTS continued
For the six months to June 30, 2013
23
14. FINANCIAL INSTRUMENTS a. Financial assets and liabilities by category
The detail of the Group’s financial instruments at June 30, 2013 and December 31, 2012 by nature and classification for measurement purposes is as follows:
At June 30, 2013 Financial assets
€ million Loans and
receivables
Assets at FV through
P&L
Derivatives used for hedging
Available for sale
Assets held to maturity
Non-financial
assets
Total carrying
amount by balance
sheet item
Non-current assets
Available-for-sale financial assets - - - 863 - - 863
Derivative financial instruments - - 20 - - - 20
Other non-current assets 175 - - - 2 21 198
Current assets
Trade receivables 1,607 - - - - - 1,607
Other current assets 240 - - - - 409 649
Derivative financial instruments - - 46 - - - 46
Other current interest-bearing deposits
1,596 - - - 80 - 1,676
Cash and cash equivalents 1,951 - - - - - 1,951
Financial liabilities
€ million
Loans and
payables
Liabilities at FV
through the P&L
Derivatives used for hedging
Non-financial liabilities
Total carrying
amount by balance
sheet item
Non-current liabilities
Interest-bearing long term borrowings 4,098 - - - 4,098
Derivative financial instruments - - 281 - 281
Other long-term liabilities 19 - - 231 250
Current liabilities
Current portion of long-term borrowings 568 - - - 568
Trade and other payables 3,830 - - 3,698 7,528
Derivative financial instruments - - 118 - 118
At December 31, 2012 Financial assets
€ million Loans and
receivables
Assets at FV through
P&L
Derivatives used for hedging
Available for sale
Assets held to maturity
Non-financial
assets
Total carrying amount by
balance sheet item
Non-current assets
Available-for-sale financial assets - - - 684 - - 684
Derivative financial instruments - - 26 - - - 26
Other non-current assets 92 - - - 4 17 113
Current assets
Trade receivables 1,149 - - - - - 1,149
Other current assets 123 - - - - 358 481
Derivative financial instruments - - 70 - - - 70
Other current interest-bearing deposits
1,543 - - - 4 - 1,547
Cash and cash equivalents 1,362 - - - - - 1,362
NOTES TO THE ACCOUNTS continued
For the six months to June 30, 2013
24
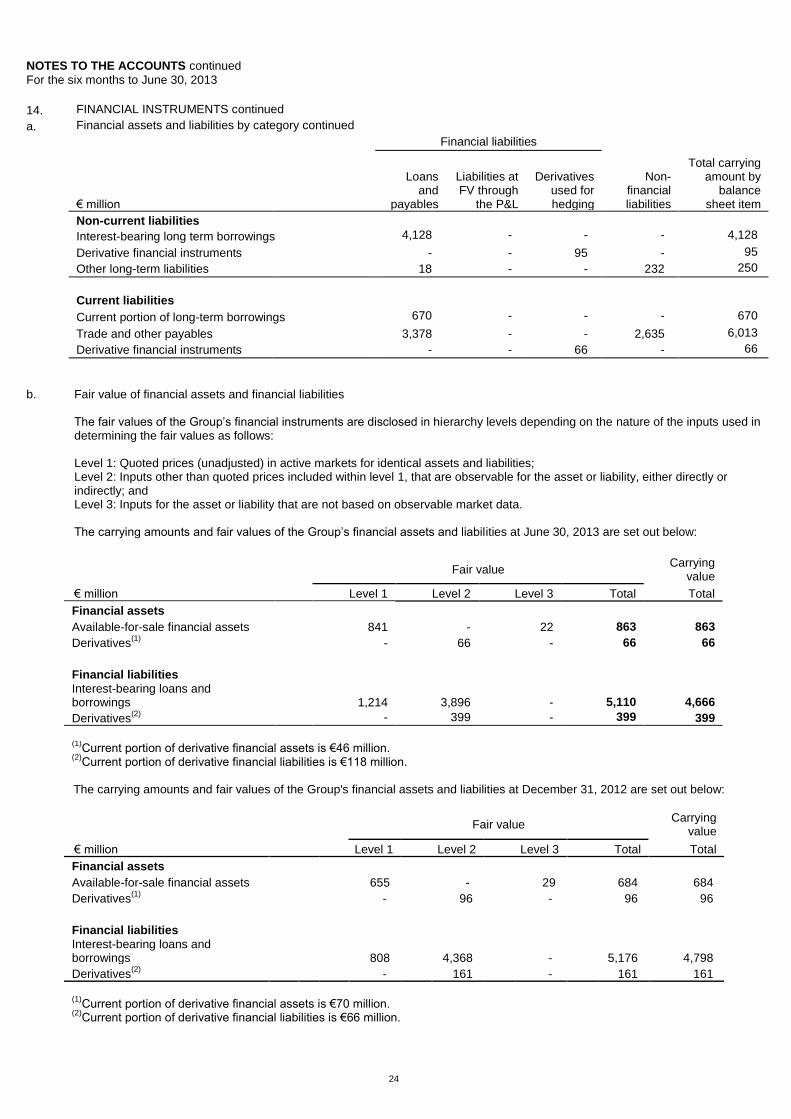
14. FINANCIAL INSTRUMENTS continued
a. Financial assets and liabilities by category continued
Financial liabilities
€ million
Loans and
payables
Liabilities at FV through
the P&L
Derivatives used for hedging
Non-financial liabilities
Total carrying amount by
balance sheet item
Non-current liabilities
Interest-bearing long term borrowings 4,128 - - - 4,128
Derivative financial instruments - - 95 - 95
Other long-term liabilities 18 - - 232 250
Current liabilities
Current portion of long-term borrowings 670 - - - 670
Trade and other payables 3,378 - - 2,635 6,013
Derivative financial instruments - - 66 - 66
b. Fair value of financial assets and financial liabilities
The fair values of the Group’s financial instruments are disclosed in hierarchy levels depending on the nature of the inputs used in determining the fair values as follows: Level 1: Quoted prices (unadjusted) in active markets for identical assets and liabilities; Level 2: Inputs other than quoted prices included within level 1, that are observable for the asset or liability, either directly or indirectly; and Level 3: Inputs for the asset or liability that are not based on observable market data. The carrying amounts and fair values of the Group’s financial assets and liabilities at June 30, 2013 are set out below:
Fair value Carrying
value
€ million
Level 1 Level 2 Level 3 Total Total
Financial assets
Available-for-sale financial assets
841 - 22 863 863
Derivatives(1)
- 66 - 66 66
Financial liabilities
Interest-bearing loans and borrowings
1,214 3,896 - 5,110 4,666
Derivatives(2)
- 399 - 399 399
(1)Current portion of derivative financial assets is €46 million.
(2)Current portion of derivative financial liabilities is €118 million.
The carrying amounts and fair values of the Group's financial assets and liabilities at December 31, 2012 are set out below:
Fair value Carrying
value
€ million
Level 1 Level 2 Level 3 Total Total
Financial assets
Available-for-sale financial assets
655 - 29 684 684
Derivatives(1)
- 96 - 96 96
Financial liabilities
Interest-bearing loans and borrowings
808 4,368 - 5,176 4,798
Derivatives(2)
- 161 - 161 161
(1)Current portion of derivative financial assets is €70 million.
(2)
Current portion of derivative financial liabilities is €66 million.

NOTES TO THE ACCOUNTS continued
For the six months to June 30, 2013
25
14. FINANCIAL INSTRUMENTS continued b. Fair value of financial assets and financial liabilities continued
The following methods and assumptions were used by the Group in estimating its fair value disclosures for financial instruments: Available-for-sale financial assets
Listed fixed asset investments (level 1) are stated at market value as at June 30, 2013. For other investments (level 3) where the fair value cannot be measured reliably, these assets are stated at historic cost less accumulated impairment losses. Forward currency contracts, options, over-the-counter (OTC) fuel derivatives, and interest rate derivatives
These are stated at the market value of instruments with similar terms and conditions at the balance sheet date (level 2). Interest-bearing loans and borrowings and finance leases excluding i-ii below:
The repayments that the Group is committed to make have been discounted at the relevant market interest rates applicable at June 30, 2013.
(i) Euro-sterling notes euro-sterling bond 2016 and convertible bond 2018: These are stated at quoted market value (level 1). (ii) Iberbond 2014: These are valued at amortised cost (level 2).
c. Level 3 financial assets reconciliation
The following table summarises key movements in level 3 financial assets:
€ million
June 30,
2013 December 31,
2012
Opening balance 29 28
Unrealised gains relating to instruments still held at the reporting date - 1
Purchase, issuances and settlements (7) (3)
Fair value uplift upon disposal - 3
22 29
During the six months to June 30, 2013 there were no transfers between level 1 and 2 of the fair value hierarchy, nor were there transfers into or out of level 3.
15. RECONCILIATION OF NET CASH FLOW TO MOVEMENT IN NET DEBT
Six months to June 30
€ million 2013 2012
Increase in cash and cash equivalents during the period 307 76
Net funds/(debt) acquired through business combination 306 (48)
Net cash outflow from repayments of debt and lease financing 379 247
Increase in other current interest-bearing deposits 174 88
New loans and finance leases (361) (433)
Decrease/(increase) in net debt resulting from cash flow 805 (70)
Exchange movements and other non-cash movements 45 (90)
Decrease/(increase) in net debt during the period 850 (160)
Net debt at January 1 (1,889) (1,148)
Net debt at June 30 (1,039) (1,308)
Net debt comprises the current and non-current portions of long-term borrowings less cash and cash equivalents and other current interest-bearing deposits.

NOTES TO THE ACCOUNTS continued
For the six months to June 30, 2013
26
16. BORROWINGS
June 30, 2013
December 31, 2012
Current
Bank and other loans 235 235
Finance leases 333 435
568 670
Non-current
Bank and other loans 1,625 1,491
Finance leases 2,473 2,637
4,098 4,128
The Group issued a €390 million fixed rate convertible bond in May 2013, raising net proceeds of €386 million, which holds a coupon rate of 1.75 per cent and is convertible into ordinary shares at the option of the holder before or upon maturity in May 2018. The conversion price was set at a premium of 35 per cent on the Group’s share price on the date of issuance. The Group holds an option to redeem the convertible bond at its principal amount, together with accrued interest, upon fulfilment of certain pre-determined criteria. The equity portion of the convertible bond issue is included in Other reserves. From issuance and at June 30, 2013 91,758,228 options were outstanding.
In August 2009, British Airways issued a £350 million fixed rate 5.8 per cent convertible bond, convertible into ordinary shares at the option of the holder, before or on maturity in August 2014. Under the terms of the merger, the bondholders are now eligible to convert their bonds into ordinary shares of IAG. Conversion into ordinary shares will occur at rate of £1.89 per share. The equity portion of the convertible bond issue is included in Other reserves. At June 30, 2013 184,708,995 options were outstanding (December 31, 2012: 184,708,995).
At June 30, 2013 the Group had an undrawn, fully committed financing agreement in place related to a $927 million EETC bond issue in June 2013.
17. SHARE BASED PAYMENTS During the period 7,625,742 conditional shares were awarded under the Group’s Performance Share Plan (PSP) to key senior executives and selected members of the wider management team. No payment is due upon the vesting of the shares. The fair value of equity-settled share options granted is estimated as at the date of the award using the Monte-Carlo model, taking into account the terms and conditions upon which the options were awarded. The following are the inputs to the model for the PSP options granted in the period:
Expected share price volatility: 40 per cent Expected life of options: 3 years Weighted average share price: £2.69
The Group also made awards under the Bonus Deferral Plan (BDP) during the period, under which 2,753,837 conditional shares were awarded.
18. EMPLOYEE BENEFIT OBLIGATIONS
The Group operates two principal funded defined benefit pension schemes in the UK, the Airways pension scheme (APS) and the New Airways pension scheme (NAPS), both of which are closed to new members. The Group did not perform an interim valuation as at June 30, 2013 as there had been no significant movement in assumptions. During the period, the Group has adopted amendments to IAS19 ‘Employee Benefits’, and applied these retrospectively. The impact of the restatement is set out in note 2. The Group has reached agreement in principle with the trustees of its two main pension schemes on the schemes' regular triennial valuations. The agreement confirms that the existing contribution plans for the APS and NAPS remain on track to pay the pension liabilities. The valuations are based on the schemes' funding position as at March 31, 2012.

NOTES TO THE ACCOUNTS continued
For the six months to June 30, 2013
27
19. PROVISIONS FOR LIABILITIES AND CHARGES
€ million
Employee leaving indemnities and other employee
related provisions
Legal claims
provisions
Restoration and
handback provisions
Other provisions Total
Net book value January 1, 2013 1,115 211 484 243 2,053 Provisions recorded during the period 295 5 68 28 396 Acquired through business combination - 9 208 - 217 Utilised during the period (86) (59) (73) (58) (276) Release of unused amounts and other movements (12) (5) (15) (1) (33) Unwinding of discount 12 3 4 1 20 Exchange differences (3) (4) (10) (7) (24)
Net book value at June 30, 2013 1,321 160 666 206 2,353
Analysis:
Current 158 83 126 89 456
Non-current 1,163 77 540 117 1,897
20. CONTINGENT LIABILITIES
There were contingent liabilities at June 30, 2013 in respect of guarantees and indemnities entered into as part of the ordinary course of the Group’s business. No material losses are likely to arise from such contingent liabilities. A number of other lawsuits and regulatory proceedings are pending, the outcome of which in the aggregate is not expected to have a material effect on the Group's financial position or results of operations. The Group has certain liabilities and commitments, which at June 30, 2013 amounted to €110 million (December 31, 2012: €110 million).
21. RELATED PARTY TRANSACTIONS
The Group had the following transactions in the ordinary course of business with related parties.
Sales and purchases of goods and services:
Six months to June 30
€ million 2013 2012
Sales of goods and services
Sales to associates 8 72
Sales to significant shareholders - - Purchases of goods and services
Purchases from associates 28 27 Purchases from significant shareholders - 12
Period end balances arising from sales and purchases of goods and services:
June 30, December 31,
€ million 2013 2012
Receivables from related parties
Amounts owed by associates 10 35 Amounts owed by significant shareholders - 31 Payables to related parties
Amounts owed to associates 5 22 Amounts owed to significant shareholders - 2
For the six months to June 30, 2013, the Group had not made any provisions for doubtful debts relating to amounts owed by related parties (six months to June 30, 2012: €nil).

NOTES TO THE ACCOUNTS continued
For the six months to June 30, 2013
28
21. RELATED PARTY TRANSACTIONS continued
Board of Directors and Management Committee remuneration
At period end the Board of Directors consisted of 13 members (2012: 14 members) and the Management Committee of six (2012: five members).
Compensation received by the Group’s key management personnel is as follows:
Six months to June 30
€ million 2013 2012
Base salary, fees and benefits
Board of Directors' remuneration 4 3
Management Committee remuneration 1 1
The Company provides life insurance for all members of the Management Committee. For the six months to June 30, 2013 the Company’s obligation was €13,000 (2012: €14,000). At June 30, 2013 the transfer value of accrued pensions covered under defined benefit pension obligation schemes, relating to both the Board of Directors and the Management Committee totalled €5 million (2012: €4 million).
No loans or credit transactions were outstanding with Directors or officers of the Group at June 30, 2013 (2012: €nil).

STATEMENT OF DIRECTORS' RESPONSIBILITIES
LIABILITY STATEMENT OF COMPANY DIRECTORS FOR THE PURPOSES ENVISAGED UNDER ARTICLE 11.1.b OF SPANISH ROYAL DECREE 1362/2007 OF 19 OCTOBER (REAL DECRETO 1362/2007).
At a meeting held on August 1, 2013, the Directors of International Consolidated Airlines Group, S.A. confirmed that to the best of their knowledge the half year Condensed Consolidated Financial Statements for the six months to June 30, 2013 were prepared in accordance with IAS 34 as adopted by the European Union, offer a true and fair view of the assets, liabilities, financial situation and the results of International Consolidated Airlines Group, S.A. and of the companies that fall within the consolidated group taken as a whole, and the Interim Condensed Consolidated Management Report includes an accurate analysis of the required information also in accordance with the Financial Conduct Authority’s DTR 4.2.7R and DTR4.2.8R including an indication of important events in the period, a description of the principal risks and material related party transactions. August 1, 2013
______________________________
Antonio Vázquez Romero
Chairman
______________________________
Martin Faulkner Broughton
Deputy Chairman
______________________________
William Matthew Walsh
Chief Executive Officer
______________________________
César Alierta Izuel
______________________________
Patrick Jean Pierre Cescau
______________________________
Alberto Terol Esteban
______________________________
Luis Gallego Martín
______________________________
Denise Patricia Kingsmill
______________________________
James Arthur Lawrence
______________________________
José Pedro Pérez-Llorca y Rodrigo
______________________________
Kieran Charles Poynter
______________________________
John William Snow
______________________________
Keith Williams
REVIEW REPORT ON THE CONSOLIDATED CONDENSED INTERIM FINANCIAL STATEMENTS To the Shareholders of International Consolidated Airlines Group S.A. at the request of Management:
1. We have carried out a review of the accompanying condensed consolidated interim financial statements (hereinafter the interim financial statements) of International Consolidated Airlines Group S.A. (hereinafter the Parent Company) and subsidiaries (hereinafter the Group), which comprise the consolidated balance sheet at 30 June 2013, the consolidated income statement, consolidated statement of comprehensive income, the consolidated statement of changes in equity, the consolidated cash flow statement, and the notes thereto , all of them condensed for the six-month period then ended. The Parent Company's directors are responsible for the preparation of said interim financial statements in accordance with the requirements established by IAS 34, "Interim Financial Reporting," as adopted by the European Union for the preparation of interim condensed financial reporting as per article 12 of Royal Decree 1362/2007 and the Disclosure and Transparency Rules of the United Kingdom’s Financial Services Authority. Our responsibility is to conclude on these interim financial statements based on our review.
2. Our review was performed in accordance with the International Standard on Review Engagements 2410, “Review of Interim Financial Reporting Performed by the Independent Auditor of the Entity”. A review of the interim financial statements consists of making inquiries, primarily of personnel responsible for financial and accounting matters, and applying certain analytical and other review procedures. The scope of a review is substantially smaller than that of an audit and therefore, it is not possible to provide assurance that all the significant matters that could be identified in an audit have come to our attention. Therefore, we do not express an audit opinion on the accompanying interim financial statements.
3. During the course of our review, which under no circumstances can be considered an audit of financial statements, no matter came to our attention which would lead us to conclude that the accompanying interim financial statements for the six-month period ended 30 June 2013 have not been prepared, in all material respects, in accordance with the requirements established by International Accounting Standard 34, "Interim Financial Reporting," as adopted by the European Union in conformity with article 12 of Royal Decree 1362/2007 for the preparation of condensed interim financial statements and the Disclosure and Transparency Rules of the United Kingdom's Financial Services Authority.
4. Without qualifying our opinion, we draw attention to accompanying explanatory Note 1 to the interim financial statements, where it is stated that the abovementioned interim financial statements do not include all the information that would be required for complete consolidated financial statements prepared in accordance with International Financial Reporting Standards, as adopted by the European Union, and therefore the accompanying interim financial statements should be read in conjunction with the consolidated financial statements for the year ended 31 December 2012. 5. The accompanying interim consolidated management report for the six-month period ended 30 June, 2013 contains such explanations as the Parent Company’s directors consider necessary regarding the events which occurred during said period and their effect on the interim financial statements, of which it is not an integral part, as well as on the information required in conformity with article 15 of Royal Decree 1362/2007. We have checked that the accounting information included in the report mentioned above agrees with the interim financial statements for the six months period ended 30 June 2013. Our work is limited to verifying the management report in accordance with the scope mentioned in this paragraph, and does not include the review of information other than that obtained from the accounting records of the consolidated companies.
6. This report has been prepared at the request of Management with regard to the publication of the half-year financial report required by article 35 of Securities Market Law 24/1988, of July 28, further developed by Royal Decree 1362/2007, of October 19 and the Disclosure and Transparency Rules of the United Kingdom's Financial Services Authority.
ERNST & YOUNG, S.L.
___________________ Rafael Páez Martínez August 1, 2013

AIRCRAFT FLEET
Number in service with Group companies
On balance sheet fixed
assets
Off balance sheet operating
leases(1)
Total
June 30, 2013
Total December 31,
2012
Changes since
December 31, 2012
Future deliveries Options
Airbus A318
2
-
2
2 - - -
Airbus A319
31
30
61
63 (2) 2 -
Airbus A320
41
101
142
85 57 12 35
Airbus A321
18
18
36
36 - - -
Airbus A330
-
4
4
- 4 4 8
Airbus A340-300
7
5
12
13 (1) - -
Airbus A340-600
2
15
17
17 - - -
Airbus A350
-
-
-
- - 18 18
Airbus A380
-
-
-
- - 12 7
Boeing 737-400
19
-
19
19 - - -
Boeing 747-400
52
-
52
52 - - -
Boeing 757-200
1
2
3
3 - - -
Boeing 767-300
21
-
21
21 - - -
Boeing 777-200
41
5
46
46 - - -
Boeing 777-300
5
1
6
6 - 6 -
Boeing 787
-
-
-
- - 40 16
Embraer E170
6
-
6
6 - - -
Embraer E190
8
-
8
8 - - 15
Group total
254
181
435
377 58 94 99
(1)A total of 71 aircraft under operating lease were acquired in the six months to June 30, 2013.
Future deliveries include 18 Airbus A350s and 18 Boeing 787s awaiting shareholders’ approval.