situation awareness application -...
TRANSCRIPT
Situation Awareness Application
Thesis by
Judy Mou
Computer Science, Caltech
Advisors: Prof. K. Mani Chandy
Dr. Julian Bunn
In Partial Fulfillment of the Requirements for the degree
of
Master of Science
CALIFORNIA INSTITUTE OF TECHNOLOGY
Pasadena, California
2013
(Submitted July 5, 2013)
ii
2013
Judy Mou
All Rights Reserved
iii
Abstract This thesis describes the design and implementation of a situation awareness application. The
application gathers data from sensors including accelerometers for monitoring earthquakes,
carbon monoxide sensors for monitoring fires, radiation detectors, and dust sensors. The
application also gathers Internet data sources including data about traffic congestion on daily
commute routes, information about hazards, news relevant to the user of the application, and
weather. The application sends the data to a Cloud computing service which aggregates data
streams from multiple sites and detects anomalies. Information from the Cloud service is then
displayed by the application on a tablet, computer monitor, or television screen. The situation
awareness application enables almost all members of a community to remain aware of critical
changes in their environments.
iv
Contents Abstract Introduction Motivation Goal System Requirements System Overview
I. A client for CSN. II. Data process platform
Design Consideration System Architecture Design Detail
Application initialization flow Application components
Services Data Centers CloudClient Fragments MainActivity Additional components
System Behavior Platform Example Usage Future Directions Conclusion References
1
Introduction
In natural or manmade disasters, preemptive hazard detection is critical for minimizing damage. In instances such as earthquakes, fires, floods, and gas leaks, we need to promptly provide real-time information to nearby residents and emergency responders in case of any impending disaster. Unfortunately, deploying quality sensors that produce high resolution environmental data is both difficult and expensive. With the improving accuracy of low cost sensors, we can combine existing sensors with cheaper sensors to improve the accuracy and reliability of hazard detection. The Community Seismic Network (CSN) is an open seismic network that allows low cost sensors to contribute to a cloud-based server for aggregation. It analyzes incoming data to determine environmental changes, and thus provides alert of hazardous emergency situations. For example, during an earthquake, the CSN can deliver a map of peak acceleration within seconds of the first tremor [Clayton et al. 738]. Previously, CSN focused on earthquake detection, but with an improved cloud backend, it now accepts data from many types of sensors, such as temperature sensors, humidity sensors, and gas sensors. With a more versatile set of sensors, the CSN can make more powerful inferences. For example, a rising temperature coupled with a high concentration of carbon monoxide may indicate the presence of a fire. Through the use of low cost sensors, residents can provide data to the CSN backend to help contribute to disaster detection in their neighborhood. At the same time, they can quickly be notified when an emergency is detected by the CSN. As more sensors are used to collect data, the CSN has access to more information and thus can detect an emergency faster. Additionally, data stored on the cloud can be used to study natural disasters and further improve our system.
Motivation
Accuracy of hazard detection relies on a dense network of sensors. Many affordable and accurate sensors are available, but they are not being used. For instance, Android phones contain motion sensors, environmental sensors, and position sensors that can provide raw data with high precision and accuracy. A Caltech student designed and prototyped a compact home weather station that contains cheap (albeit less accurate) sensors, such as gas, light, radiation, and position sensors. There are many readily obtainable options that can contribute to hazard detection. Previously, there was an effort to distribute cheap accelerometers (Phidgets) to volunteers (mostly students). When the Phidget is connected to a computer, a software client sends collected data to the CSN cloud backend. However, only 33% of distributed Phidgets are active, introducing the challenge of maintaining a consistent data stream. Although individuals were initially willing to use them, some data streams stopped due to network problems, power loss, or accidental
2 powering off by users. By the time users realized that a sensor has stopped working, valuable information had already been lost.
Goal
Crowdsourcing data for hazard detection is a valuable approach to minimize damage during environmental disasters. With the robust CSN backend built to handle impulsive emergency events and the increasing availability of cheap sensors, the missing link is a platform that can collect various types of sensor data, send them to the backend server, and display alerts and dynamic information tailored to the users, such as weather forecasts and traffic updates. The primary goal is to raise user awareness of potential dangers. In addition to sending data to the server, the platform described in this thesis provides relevant and reliable information that benefits all users. The purpose of the platform is to
● Notify users of hazardous situations in the area. This includes local abnormality detection and hazard detection delivered by the cloud.
● Collect and process sensor data ○ There is an abundance of cheap sensors available for gathering localized
environmental data. ○ To avoid sending unnecessary information to the cloud, the platform will process
the data beforehand, saving bandwidth and alleviating load on the backend. ● Display a collection of dynamic situation and environment information, such as weather,
traffic, and news feeds. ○ The application acts as a hub for all environment related data or news. While
users check their devices for situational changes happening around them and all over the world, they will also contribute to hazard detection through the use of cheap sensors. With more client data, hazard detection becomes more accurate.
System Requirements
● The application collects data from attached sensors. It locally detects abnormalities in the collected data and sends them to the cloud.
● Notifications appear on the screen when abnormal activity is detected in order to draw users attention to them.
● Additional dynamic situation/environment information is frequently refreshed.
3 System Overview
I. A client for CSN.
Process sensor data
● An algorithm detects anomalies locally from sensor data collected from a single client. ● The application maintains a connection with the CSN cloud. It sends data to the cloud
when an anomaly is detected and also sends a required heartbeat message every ten minutes indicating it is active. CSN marks the client as inactive if a heartbeat message was not received within last 30 minutes. Data from inactive clients is not included in event detection in an area.
User interface
The UI has a sliding tiles format, which allows the application to display more information with a limited screen size. Sensor data is displayed in a waveform format to represent the changing values. The goal is a balance between displaying sensor data and other relevant environment information on a limited screen size. The different UI tiles are discussed below. Sensor data
There are multiple tiles dedicated for displaying sensors. One tile displays sensor data collected from the Hazard Weather Station described above and is always visible. There are two other tiles for accelerometer data, one for the Android phone and one for the Phidget, which are usually hidden. When there is an anomaly detected from either device, the corresponding tile will slide in and take over the central UI area. It will slide away after 20 seconds and the normal information display will resume. Recent earthquakes
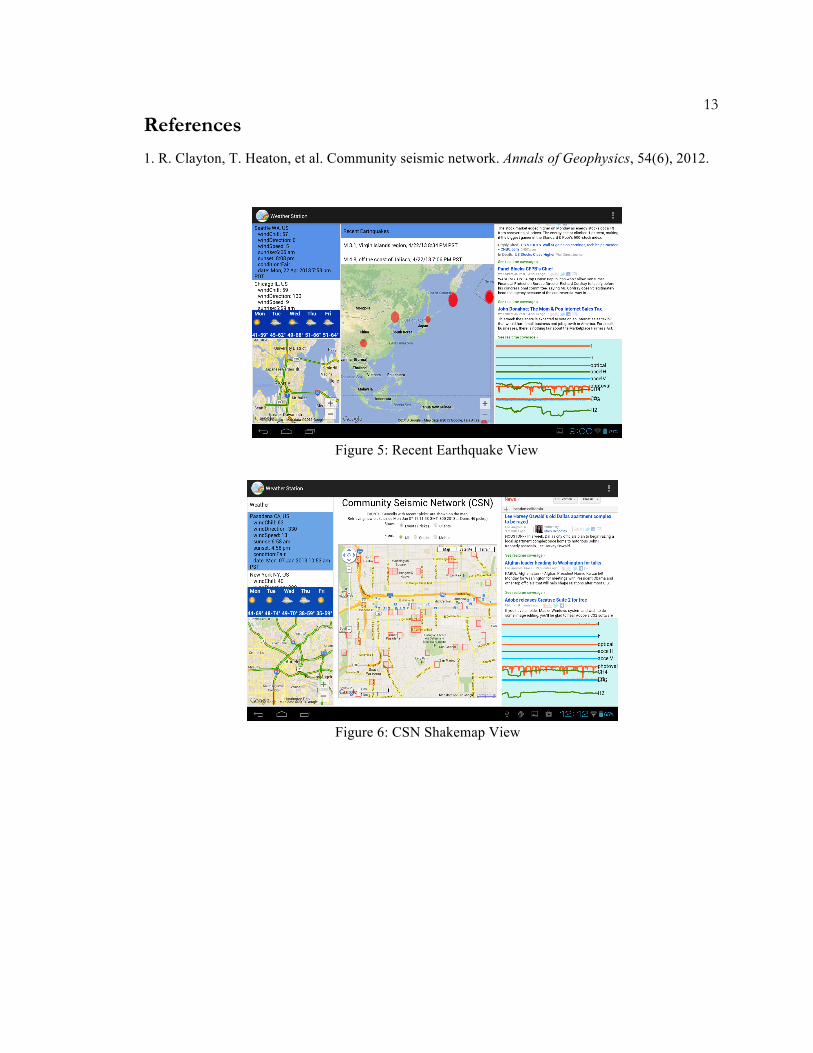
There is another tile with a list of the two most recent earthquakes on the top. The rest of the tile reveals a world map, with red circles representing earthquakes that have occurred in the past day; the diameter of the circle is proportional to the magnitude of the quake. The map also auto scrolls to show different parts of the world. Earthquake information is taken from the U.S. Geological Survey(USGS) RSS feed. Using other RSS feed links (e.g. past 7 days quakes with magnitude more than 2.5), we could potentially have the map display additional information. CSN website
CSN publishes a website that is similar to a shakemap. When a client detects an anomaly and sends the information to the CSN, it displays this event as a red block on the map. http://apps.communityseismicnetwork.org/#picks
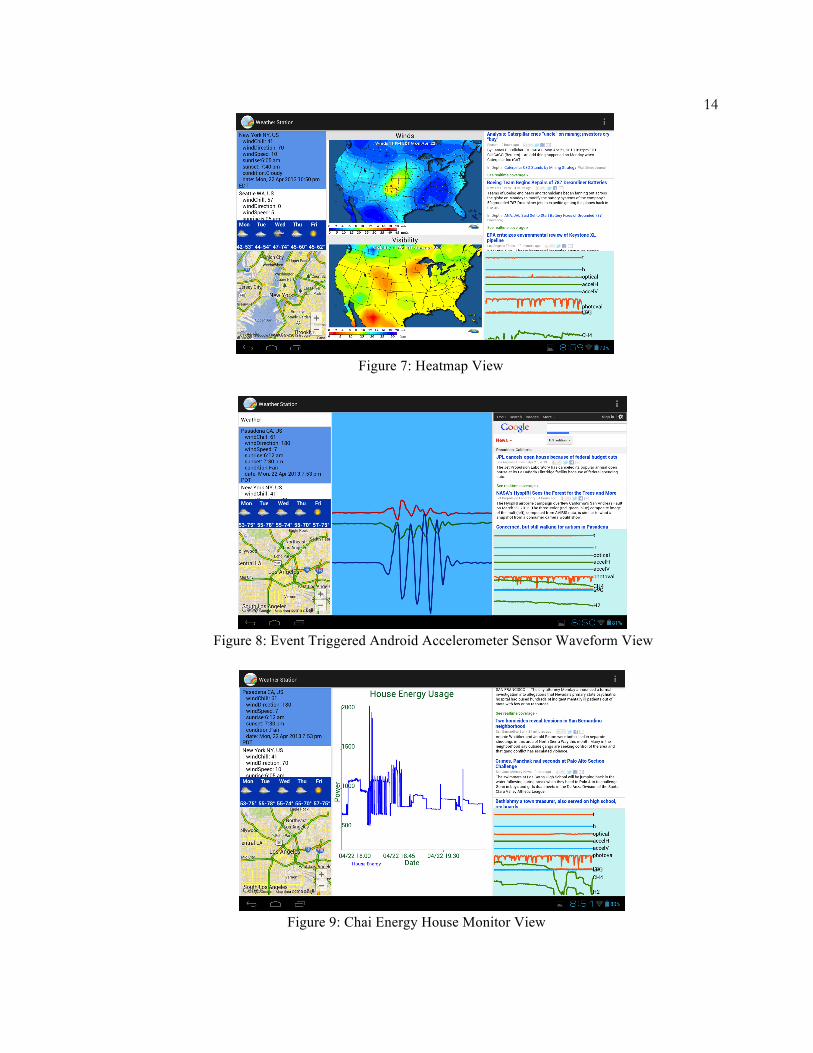
4 U.S. environment heatmaps
The platform retrieves weather related heatmaps, such as temperature, wind, precipitation, and humidity, from www.wunderground.com. Two heatmaps are displayed on a tile at a time. Weather reports and forecasts
Current weather information and forecasts for Los Angeles, San Francisco, Seattle, New York, Chicago, and Texas, are presented in a list format with a 5-day forecast located at the lower portion of the tile. The highlighted list item displays the name, temperature, precipitation, humidity and other information for that city. When the next list item is highlighted, the forecast potion slides to display information for the next city. Traffic
The traffic tile is in sync with the weather tile and shows the current traffic in the city. News feed
Google news is displayed on one tile. The news is configurable and currently set to local news, world, technology, entertainment, health, and environment. II. Data process platform
This is a platform for developers to process sensor data and display a collection of dynamic information. The platform should allow the application’s functionality to be easily configurable. Configurable tiles
● Size, orientation, and combination of tiles ● Display on each tile ● Tile animation
Alert triggered display
● Special events can trigger the main display to change, making the user interface center on the event
Data processing
● Easily allows to incorporate additional sensors/data streams/RSS feeds for processing and displaying
Cloud connection
● Dedicated activity to perform registration (upon installation of application) ● Maintain connection and post information to a remote backend server if desired
5 Design Consideration
Assumption and dependencies
Application users have the following on their Android devices ● Google Play Service ● Google Android Maps version v2 ● Android version (4.0.3 Ice-Cream Sandwich or higher)
Constraints
● Application users should have internet access ○ Users may have bandwidth limits
● Mobile devices have limited battery power
System Architecture
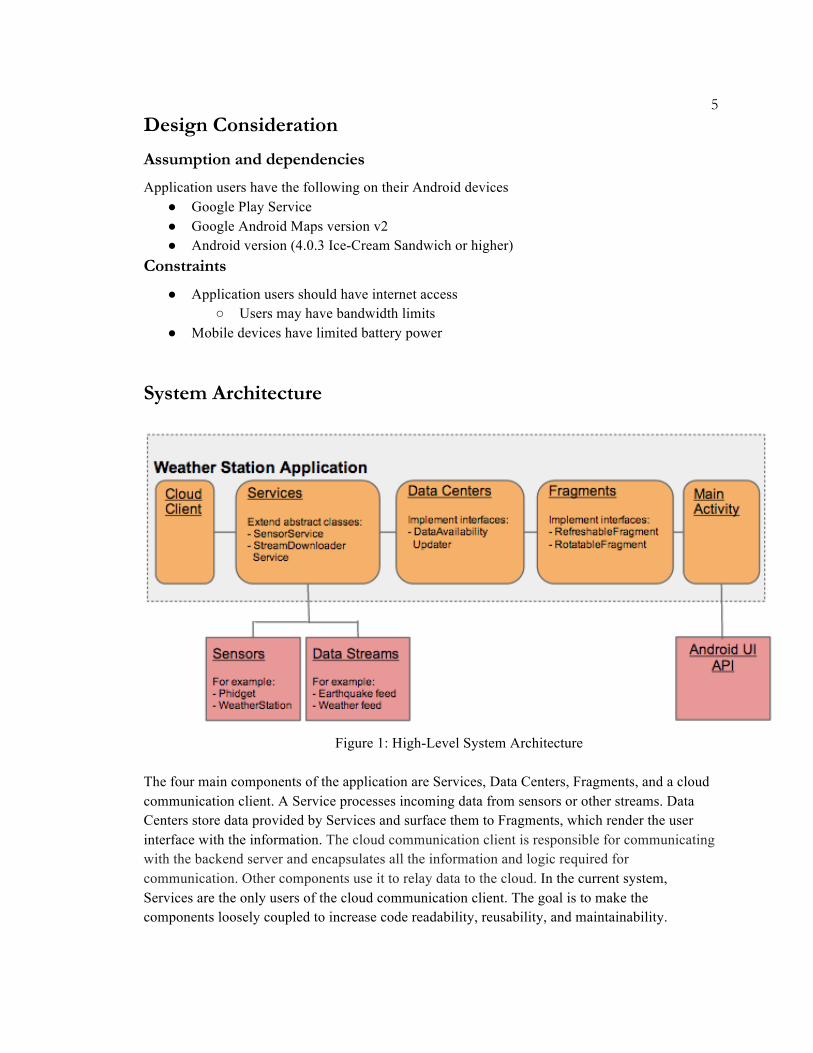
Figure 1: High-Level System Architecture
The four main components of the application are Services, Data Centers, Fragments, and a cloud communication client. A Service processes incoming data from sensors or other streams. Data Centers store data provided by Services and surface them to Fragments, which render the user interface with the information. The cloud communication client is responsible for communicating with the backend server and encapsulates all the information and logic required for communication. Other components use it to relay data to the cloud. In the current system, Services are the only users of the cloud communication client. The goal is to make the components loosely coupled to increase code readability, reusability, and maintainability.
6 In the system architecture for the Weather Station application, the dependencies between components are minimized. There are no direct dependencies between data providers (Services) and data consumers (Fragments). Decoupling them allows multiple services to provide data for one fragment or multiple fragments to use one type of data. The interfaces enforce the minimal communication requirements between components. For example, the main activity requires Fragments to be refreshable and rotatable, and the Fragment needs to check the availability of new data in Data Center. The interfaces will be discussed in more detail in the section below.
Design Detail
Application initialization flow
When the application is started, a chain of Activities is executed. This makes it easy to define dependencies between Activities. For example, the application requires the user to login or register before main application screen will be shown. The Weather Station application currently has the following chain of Activities.
● Activity 1 (SensorPermissionRequestActivity) ○ Prompts users to grant permissions for accessing attached sensors.
● Activity 2 (RegistrationActivity) ○ When the application is started for the very first time, it registers sensors on the
CSN server. CSN returns a client ID, a secret string, and sensor IDs for each of the registered sensors. This information is required for sending data to the server, and it is stored in persistent storage so that it is available the next time the application is started.
○ With this information, it initializes a CloudClient instance, which is in charge of sending and receiving messages from the server.
● Activity 3 (LoadingActivity) ○ The purpose of this activity is to prevent users from seeing a blank screen in the
next step. It starts the Services that take time to retrieve data. It will continue to the next step when the data is ready, or it will stay in this activity for a maximum of 10 seconds.
● Activity 4 (MainActivity) ○ It starts the main application, which consists of tiles.
7 Application components
Services
Figure 2: Service Component Diagram
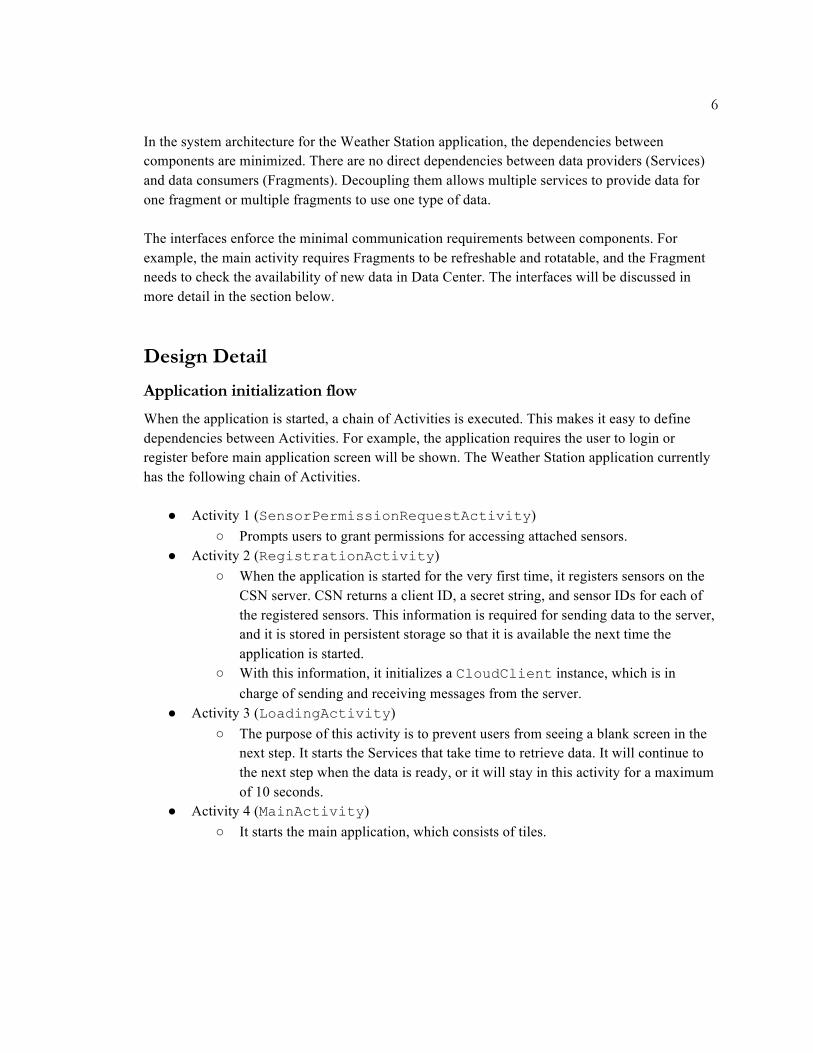
A Service is an Android application component that performs long running background operations, which is an ideal platform for data processing. All Services in the application have the following responsibilities:
● At the startup stage, it connects to sensors or data streams. ● It periodically retrieves data, and the data rate is predetermined by the nature of the
information. For example, it processes weather information hourly whereas Phidget data is processed whenever it becomes available, which is fifty times per second.
● It uses Data Center interfaces to store collected data. ● Anomaly detection is performed for each data point if necessary.
○ If an abnormality is detected, it sends an alert to MainActivity via an Intent and then requests CloudClient to deliver the abnormal data to the server.
Many Services share common resources, so the platform defines and uses two abstract classes, SensorService and StreamDownloaderService. SensorService
This is the base class for the Service that processes sensor data. Since its task includes storing data and sending abnormal data points to the cloud server, the abstract class contains a SensorDataCenter instance and a CloudClient instance. This abstract class also includes a Localizer instance because the device location is required when delivering data to the server. Device opening, closing, and reporting anomalies steps vary across different sensor devices, so they are defined as abstract methods.
8 StreamDownloaderService
This is the base class for the Service that downloads information from a data stream (e.g. weather forecast and earthquake RSS feeds). In this case, instead of processing the data points as they become available (usually via a data listener), a timer-triggered task downloads information from a data stream periodically. This abstract class sets up the timer and leaves only the refreshStreamHelper method to be implemented by children classes, so Services can perform their own data processing strategy. Data Centers
Figure 3: Data Center Component Diagram
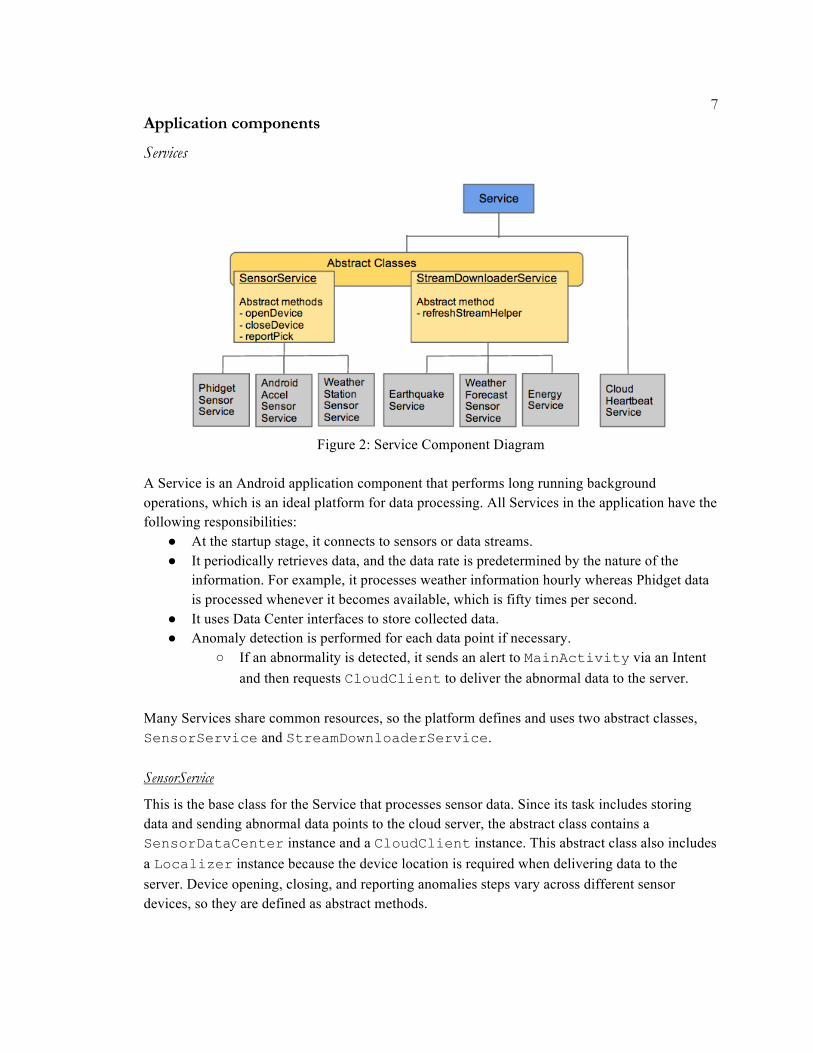
Data Centers are a group of singleton classes that store data in memory, and provide interfaces for storing and accessing the data. They also provide a Boolean variable indicating if there is new information available that has not been accessed for display. There are four data centers: SensorDataCenter, EarthquakeDataCenter, WeatherDataCenter,and EnergyDataCenter. SensorDataCenter stores data from all sensors using a hashmap with the sensor ID as the key and a list for data point storage as the value. The amount of sensor data to keep in memory depends on the time window and resolution (number of samples to be plotted per second). The storage of different types of data is separated because they require different modification and access mechanisms. For example, the earthquake data stream consists of duplicated quake information, and weather data are refreshed hourly by a service that does not depend on a time window. All Data Centers implement the DataAvailabilityUpdater interface. Data providers can use the interface to indicate availability of new data, while data consumers can check whether new data is available for display. This interface allows consumers to check for changed data before performing a UI refresh instead of wasting processing time on rerendering old information.
9 CloudClient
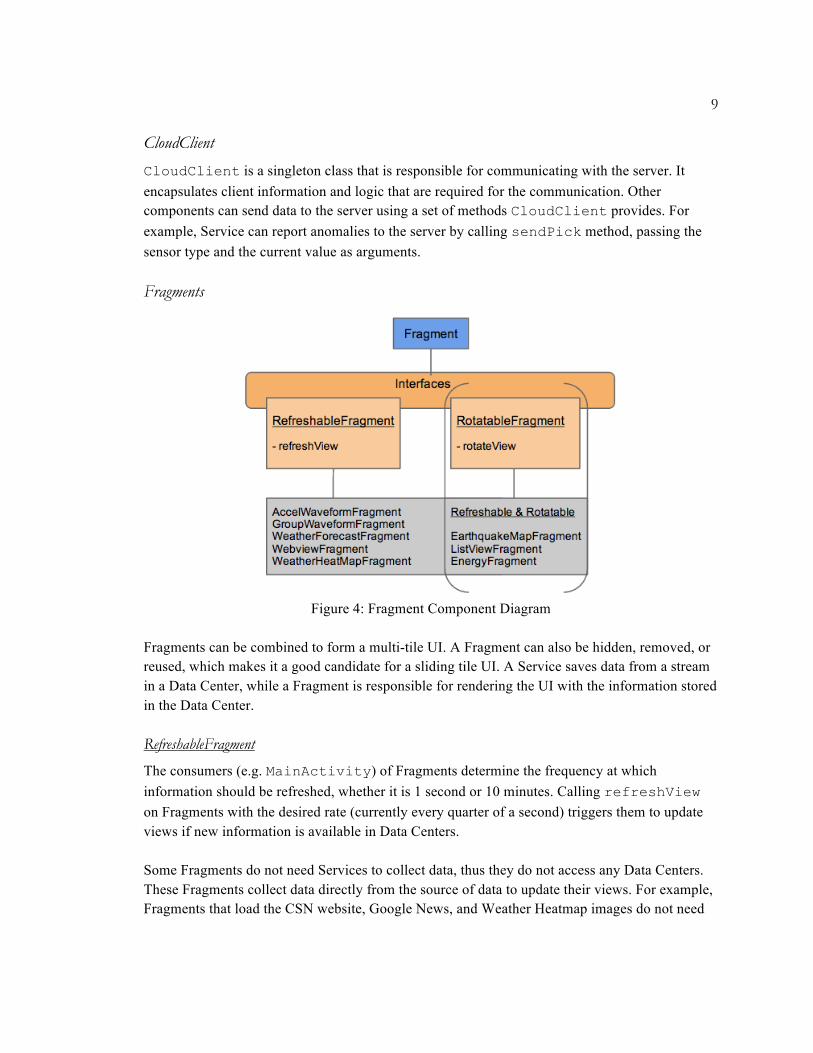
CloudClient is a singleton class that is responsible for communicating with the server. It encapsulates client information and logic that are required for the communication. Other components can send data to the server using a set of methods CloudClient provides. For example, Service can report anomalies to the server by calling sendPick method, passing the sensor type and the current value as arguments. Fragments
Figure 4: Fragment Component Diagram
Fragments can be combined to form a multi-tile UI. A Fragment can also be hidden, removed, or reused, which makes it a good candidate for a sliding tile UI. A Service saves data from a stream in a Data Center, while a Fragment is responsible for rendering the UI with the information stored in the Data Center. RefreshableFragment
The consumers (e.g. MainActivity) of Fragments determine the frequency at which information should be refreshed, whether it is 1 second or 10 minutes. Calling refreshView on Fragments with the desired rate (currently every quarter of a second) triggers them to update views if new information is available in Data Centers. Some Fragments do not need Services to collect data, thus they do not access any Data Centers. These Fragments collect data directly from the source of data to update their views. For example, Fragments that load the CSN website, Google News, and Weather Heatmap images do not need
10 Services to preprocess data because new information is automatically loaded by accessing URLs. In these cases, refreshView is a no-op. RotatableFragment
This interface is useful for Fragments that are responsible for displaying large amounts of information because it allows the Fragment to rotate between different portions of the view. When rotateView is called on a Fragment, it updates its display but it will not refresh its data from the Data Center. For example, a Map Fragment can move the map horizontally by 20 degrees longitude; a Weather List Fragment can rotate between weather reports for different cities; a News Fragment can rotate between different news story headlines. MainActivity
MainActivity handles the lifecycles of the Services and manages the UI. It has the following responsibilities:
● It starts up services and stops them when the user quits the application. ● It refreshes views of Fragments using a timer that calls refreshView on all Fragments
every quarter of a second. ● It calls rotateView on the visible Fragments that implement the
RotatableFragment interface every 10 seconds, so different view portions can be displayed.
● It determines the order Fragments are visible to users. A different Fragment slides in to take over the central view every 10 seconds.
● It shows corresponding tiles when an alert is received. Fragments are all optimized such that if no new information is available, refreshView does not result in any work. An alternative would be to have different refresh timers for Fragments. It could save function calls, but the code would be more complicated and harder to maintain. MainActivity should not be responsible for tracking when new information becomes available for each Fragment. Additional components
Ksigma
This class implements an anomaly detection algorithm that uses the ratio of short-term-average to long-term-average of data samples [Clayton et al. 743]. Services that perform anomaly detection on incoming data points retrieve a Ksigma instance for each dimension of data. An abnormal value in a stream of data is called a pick. A Ksigma instance also counts the number of picks in a certain time frame. For example, a 3-axis accelerometer requires three Kisgma instances, and a data point is considered to be abnormal if one of the dimensions generates a pick.
11 Network time protocol thread
CSN only accepts messages that are time-stamped within 10 seconds of receipt time. The application uses NTP Thread to synchronize time in an Android device. Although syncing with one of the standard public NTP servers would be preferable, better results (increasing consistency between sensor times) are obtained when using a dedicated Caltech NTP server [Clayton et al. 743]. Cloud heartbeat Service
Data from inactive clients do not contribute to event detection. This service sends a heartbeat message to CSN server every 10 minutes to ensure the client is marked as active. Weather Station Application class
The Android system creates an instance of the WeatherStationApplication class upon starting, which can be accessed by all activities. It is a good place to store preset configurations. It includes the following information:
● All supporting sensor names and their types. Sensor name is unique across sensors. Each sensor processing Service is associated with a sensor name.
● CSN shakemap website link ● Google news URLs ● City zip codes and locations (Latitude and Longitude)
System Behavior
The screen is split into three columns. The central portion displays earthquake, CSN shakemap, and weather heatmaps one at a time. Every ten seconds, it slides to the next display. The left portion display cities’ current weather report, forecast, and traffic. It keeps rotating between five chosen cities. The right portion displays the Google News and sensor data from the weather station box. If an anomaly is detected, the notification appears in the central portion. Figures 5-8 are examples of the application’s UI. Currently, earthquake data are refreshed every 15 minutes, and weather data are refreshed hourly. Sensor data displays are refreshed every quarter of a second.
Platform Example Usage
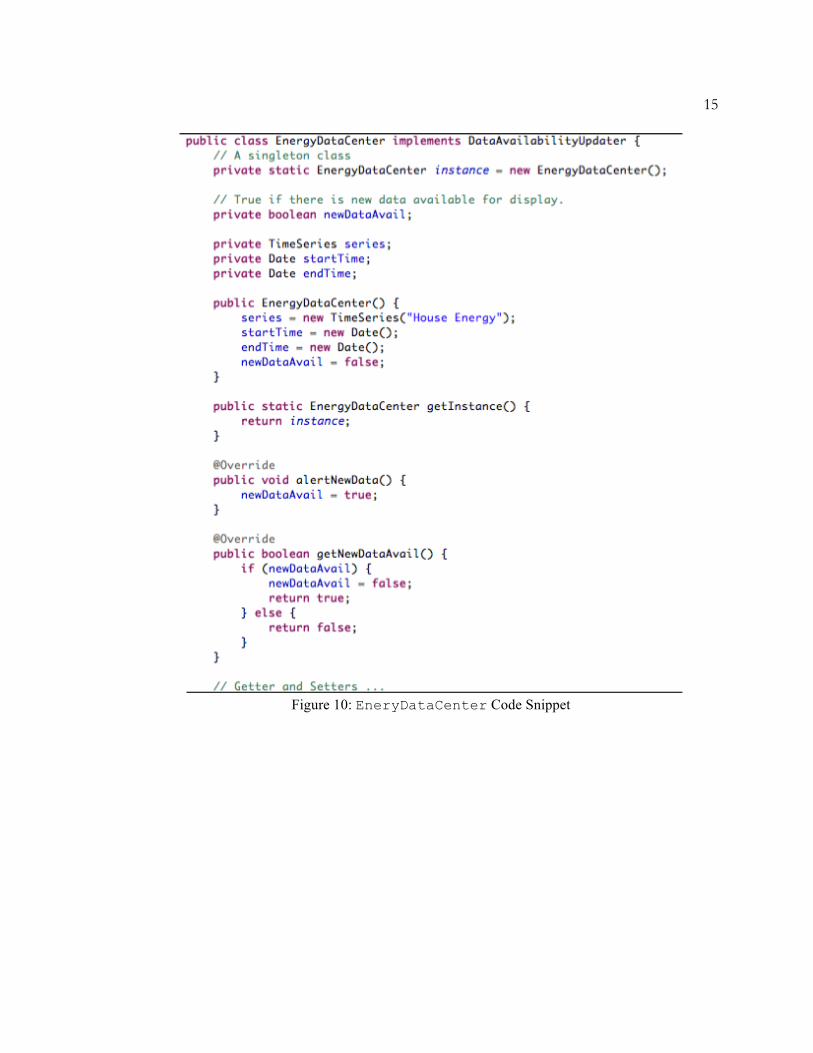
Chai Energy monitors home energy consumption. They want users to visualize and be aware of the energy they are consuming every day. A new tile is added to display this information. This is an example of incorporating an additional data stream into the platform. Figure 9 contains a display of this Fragment in the center, and Figures 10-12 are code snippets.
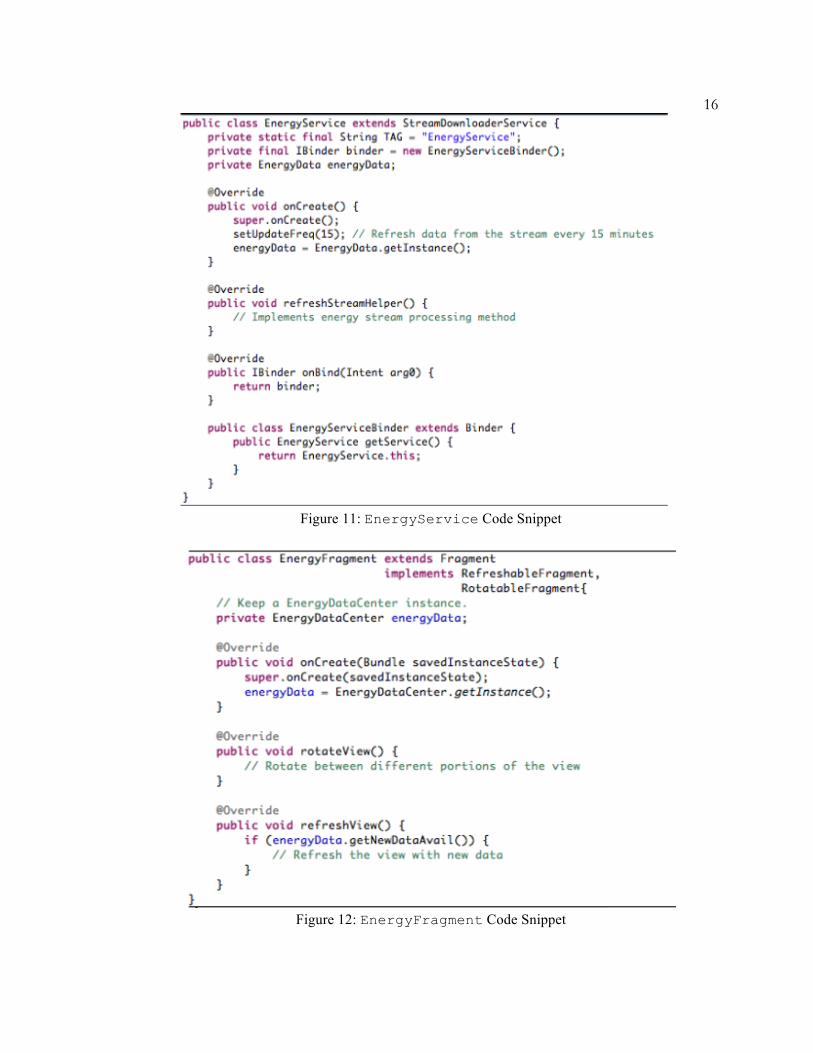
12 Step 1: Create an EnergyDataCenter that stores energy data. Step 2: Create a Service that retrieves data from Chai Energy server and stores them in the EnergyDataCenter. This Service extends the StreamDownloaderService abstract class. Step 3: Create a Fragment that reads from the EnergyDataCenter and displays the information. It implements RotatableFragment and RefreshableFragment. Step 4: In MainActivity class, add this Fragment to the list to be refreshed and rotated.
Future Directions
Configurable settings
Instead of having preset cities and news feeds, users should be able to configure these settings to their preferences. Caltech building monitoring
Energy data for some Caltech buildings are available, which can be incorporated into additional tiles. Most Caltech buildings have screens near their entrances that display preconfigured slideshows. It will be useful to utilize those screens to display more dynamic environmental information that is more relevant to the building’s occupants. CSN alert
The application should listen for CSN alerts and display them on the screen. This alerts users of emergency events, minimizing damages during disasters.
Conclusion
With this platform, users receive notifications of emergency events and utilize inexpensive sensors to contribute to the hazard detection on a large scale. The sliding tile design provides a way to display dynamic information with limited screen size. This platform also defines useful interfaces and abstract classes so that developers can easily incorporate additional data streams into the existing functionalities and UI. Additionally, the platform provides numerous examples of using Services, Fragments, Intents, AysncTasks, Protocol Buffers, Threads, and Timers to aid future developers. As more and more users begin to use this application, the emergency event detection receives more input and in return, provides more reliable results to the users. This data processing platform is a critical step in crowdsourcing data to create a reliable hazard detection system in a community.
13 References
1. R. Clayton, T. Heaton, et al. Community seismic network. Annals of Geophysics, 54(6), 2012.
Figure 5: Recent Earthquake View
Figure 6: CSN Shakemap View
14
Figure 7: Heatmap View
Figure 8: Event Triggered Android Accelerometer Sensor Waveform View
Figure 9: Chai Energy House Monitor View
15
Figure 10: EneryDataCenter Code Snippet
16
Figure 11: EnergyService Code Snippet
Figure 12: EnergyFragment Code Snippet