site specific report - frtr
TRANSCRIPT

NAVAL FACILITIES ENGINEERING COMMANDWashington, DC 20374-5065
Site Specific ReportSSR-2537-ENV
EASTERN GROUNDWATER PLUMENaval Air Station Brunswick
REMEDIAL ACTION OPERATIONOPTIMIZATION CASE STUDY
January 2000
Prepared forDepartment of the Navy RAO/LTM Optimization Working Group
Approved for public release; distribution is unlimited.
Printed on recycled paper

FINAL
Eastern Groundwater PlumeNaval Air Station Brunswick
Remedial Action Operation (RAO) Optimization Case Study
Contract No. N47408-99-C-7017
Prepared for:
Department of the NavyNaval Facilities Engineering Service Center (NFESC)
Code ESC4131100 23rd Avenue
Port Hueneme, CA 93043-4370
Prepared by:
Radian International1600 Perimeter Park Drive
Morrisville, NC 27560
January 2000

FINAL
NAS Brunswick RAO (EASTERN PLUME) ii January 2000
TABLE OF CONTENTS
EXECUTIVE SUMMARY...............................................................................................................................ES-1
1.0 INTRODUCTION .................................................................................................................................1-11.1 Purpose and Objectives ..........................................................................................................1-11.2 Optimization Approach ..........................................................................................................1-1
2.0 LOCATION AND PHYSICAL SETTING OF NAS BRUNSWICK................................................2-12.1 Location of NAS Brunswick and Case Study Site ...............................................................2-12.2 Physical Setting.......................................................................................................................2-1
2.2.1 Geology ....................................................................................................................2-12.2.2 Surface Water – Hydrology.....................................................................................2-32.2.3 Groundwater.............................................................................................................2-32.2.4 Land Use...................................................................................................................2-3
3.0 EASTERN PLUME REMEDIAL SYSTEM ASSESSMENT ...........................................................3-13.1 Eastern Plume Background and Regulatory Framework .....................................................3-1
3.1.1 Description ...............................................................................................................3-13.1.2 Regulatory Framework............................................................................................3-1
3.2 Current Eastern Plume Conceptual Model............................................................................3-43.3 System Descriptions and Design Basis .................................................................................3-6
3.3.1 Description of Extraction and Monitoring Well Network.....................................3-63.3.2 Description of Aboveground Treatment Train for the Eastern Plume. ..............3-133.3.3 Design Specifications and Parameters..................................................................3-153.3.4 System Upgrades and Modifications....................................................................3-163.3.5 Total Capital Costs ................................................................................................3-16
3.4 Best Practices Already in Place for the Eastern Plume......................................................3-163.5 Eastern Plume System Performance Baseline.....................................................................3-18
3.5.1 Eastern Plume Treatment System Cost and Performance Baseline....................3-183.5.2 Extraction and Monitoring Well Network Performance .....................................3-223.5.3 Aboveground Treatment Train Performance. ......................................................3-34
4.0 CONCLUSIONS AND RECOMMENDATIONS FOR THE EASTERN PLUME SYSTEM .......4-14.1 Primary Recommendations for Eastern Plume.....................................................................4-1
4.1.1 Implementation of an MNA Program.....................................................................4-24.1.2 Establishment of Alternate Concentration Limits (ACLs)....................................4-2
4.2 Eastern Plume Extraction and Monitoring Network Recommendations ............................4-44.2.1 Extraction Well Network.........................................................................................4-44.2.2 Monitoring Well Network.......................................................................................4-7
4.3 Eastern Plume Aboveground Treatment Train Recommendations .....................................4-74.3.1 Recommendations for Groundwater Treatment at the Eastern Plume .................4-74.3.2 Considerations for Proposed Modifications of the Existing Treatment Train.....4-84.3.3 Recommendations for Operation Using the Existing Treatment Train..............4-10
4.4 Additional Considerations for Groundwater Discharge.....................................................4-114.5 Eastern Plume Recommendations Life-Cycle Costs..........................................................4-12
5.0 DATA ANALYSIS, TREND EVALUATION AND REPORTING.................................................5-15.1 Performance Plots...................................................................................................................5-15.2 Contaminant Tracking ............................................................................................................5-15.3 Operational and Performance Reporting...............................................................................5-2
6.0 REFERENCES ......................................................................................................................................6-1
APPENDIX A: Eastern Groundwater Plume NAS Brunswick RAO Optimization Case StudyPore Volume and Extraction Rate Calculations

FINAL
NAS Brunswick RAO (EASTERN PLUME) iii January 2000
LIST OF FIGURES
2-1 Site Location Map, Eastern Plume NAS Brunswick.........................................................................2-23-1 Location of Extraction Wells and Eastern Plume..............................................................................3-23-2 Groundwater Pump and Treat System................................................................................................3-73-3 Eastern Plume, Long-Term Monitoring Sampling Points...............................................................3-113-4 Eastern Plume, Long-Term Monitoring Gauging Locations ..........................................................3-133-5 Process Flow Diagram for Eastern Plume .......................................................................................3-143-6 Influent VOC Concentrations vs. Time Eastern Groundwater Plume ...........................................3-193-7 Cumulative Mass Recovered vs. Time Eastern Groundwater Plume.............................................3-203-8 Cumulative Costs vs. Cumulative VOCs Recovered Eastern Groundwater Plume......................3-213-9 Average Cost Per Pound Recovered vs. Time Eastern Groundwater Plume.................................3-233-10 Interpreted Shallow Groundwater Potentiometric Surface Contour Map......................................3-253-11 Interpreted Deep Groundwater Potentiometric Surface Contour Map...........................................3-263-12 Interpreted Total VOC Concentration Contour Map, Shallow Wells, Nov., 1998 .......................3-293-13 Interpreted Total VOC Concentration Contour Map, Deep Wells, Nov., 1998............................3-303-14 Interpreted Total VOC Concentration Contour Map, Shallow Wells, Mar., 1997 .......................3-323-15 Interpreted Total VOC Concentration Contour Map, Deep Wells, Mar., 1997 ............................3-33
LIST OF TABLES
3-1 Description of Contaminated Sites for the Eastern Plume................................................................3-33-2 Groundwater Cleanup Levels Sites 4, 11, 13, and Eastern Plume ROD..........................................3-33-3 Summary of Regulatory Framework for Eastern Plume...................................................................3-43-4 Summary of Monitoring Status for Eastern Plume ...........................................................................3-43-5 Summary of Installation Details for Extraction Wells in the Eastern Plume...................................3-83-6 Summary of Sentinel, Perimeter, and Interior Plume Wells...........................................................3-103-7 Summary of the Eastern Plume Groundwater Treatment Plant Data
Input for Instrumentation and Control System.................................................................................3-153-8 Effluent Standards for the Eastern Plume Treatment Plant.............................................................3-173-9 Performance Monitoring for Eastern Plume Groundwater Treatment Plant .................................3-173-10 Capital Costs for the Eastern Plume and Landfill Treatment System ............................................3-183-11 Eastern Plume System Performance vs. Design Data .....................................................................3-223-12 Annual Operation and Maintenance Costs for the Eastern Plume
Groundwater Treatment System .......................................................................................................3-364-1 Natural Attenuation Sampling Parameters.........................................................................................4-34-2 Eastern Plume Evaluation and Optimization Recommendations Summary ....................................4-54-3 Treatment Required for Proposed Eastern Plume Effluent Discharge Options...............................4-94-4 Life Cycle Cost Analysis for Eastern Plume System Recommendations ......................................4-13

FINAL
NAS Brunswick RAO (EASTERN PLUME) iv January 2000
LIST OF ACRONYMS
ACL Alternate Cleanup levels
ARAR Applicable or relevant and appropriate requirements
AS Air Stripper
CERCLA Comprehensive Environmental Response, Compensation and Liability Act
COC Contaminant of Concern
CSM Conceptual Site Model
DCA 1,1-Dichloroethane
DCE 1,1-Dichloroethene; 1,2-Dichloroethene
DO Dissolved oxygen
DON Department of the Navy
DRMO Defense Reutilization and Marketing Office
EW Extraction Well
FTA Fire Training Area
GAC Granular Activated Carbon
GIS Geographic Information System
gpm gallons per minute
GWTP Groundwater Treatment Plant
lb(s) pounds
LTM Long-Term Monitoring
MCB Marine Corps Base
MCL Maximum Contaminant Levels
MEDEP Maine Department of Environmental Protection
MEG Maximum Exposure Guideline
Mgal Million Gallons
MNA Monitored Natural Attenuation
MW Monitoring Well
NA Not Applicable
NAS Naval Air Station
NFA No Further Action
NFESC Naval Facilities Engineering Service Center
NORTHDIV Northern Division
NPDES National Pollution Discharge Elimination System
NPV Net Present Valve
NTU Nephelometric Torbidity Unit
O&M Operation and Maintenance

FINAL
NAS Brunswick RAO (EASTERN PLUME) v January 2000
LIST OF ACRONYMS (Continued)
ODC Other Direct Costs
ORP Oxidation Reduction Potential
P&T Pump and Treat
PCE Tetrachloroethene
PLC Programmable Logic Controller
ppb parts per billion
RAO Remedial Action Operation
Redox Reduction Oxidation
ROD Record of Decision
RW Recovery Well
SCADA Supervisory Control And Data Acquisition
TCA 1,1,1-Trichloroethane
TCE Trichloroethene
TOC Total Organic Compound
USEPA United States Environmental Protection Agency
USN United States Navy
UST Underground Storage Tank
UV-Ox Ultraviolet Oxidation
VOC Volatile Organic Compound
Y2K Year 2000

Executive Summary FINAL
NAS Brunswick RAO (EASTERN PLUME) ES-1 January 2000
EXECUTIVE SUMMARY
ES.1 Purpose of the Case Study Report
This case study report includes an effectiveness evaluation for the EasternGroundwater Plume (Eastern Plume) pump and treat (P&T) system located at Naval AirStation (NAS) Brunswick, Maine. The primary purpose of the evaluation is to assess theongoing remedial action operation (RAO) program for this system; and providerecommendations resulting in attainment of site remedial action objectives and ultimateclosure for optimal life-cycle costs. For the purposes of this report, optimal is defined asthe minimum cost without sacrificing data quality or decision-making. NAS Brunswickand Northern Division (NORTHDIV) view this independent confirmation of theiroptimization plan as an important, proactive step toward operating and maintaining acost-effective and protective remedy.
This project was conducted for the Naval Facilities Engineering Service Center(NFESC) under a Broad Agency Announcement contract. NFESC is leading aDepartment of the Navy (DON) working group in developing guidance on optimizingmonitoring and remedial action operations for Navy/Marine Corps activities. Thisworking group is comprised of members from NFESC, NORTHDIV, other EngineeringField Divisions/Activities, Naval Facilities Engineering Command, and Chief of NavalOperations.
ES.2 Optimization Approach
The approach employed in this RAO optimization project to achieve site closurefor optimal life-cycle cost is outlined below:
• Gain a detailed understanding of the remedial decision-making framework,remedial action objectives, and site closure criteria for each site.
• Describe and understand past investigation and remedial actions taken to date,and how they have affected the current evolution and understanding of theconceptual site model.
• Describe the current conceptual site model, i.e., geology, pathways, receptors,and contaminants of concern (COCs).
• Gain an understanding of other remedial actions and associated data at NASBrunswick having potential applicability at the Eastern Plume.
• Describe the system design basis and operational objectives for the P&Tsystem, including extraction trench and well network.
• Baseline the past and current cost and operational data.

Executive Summary FINAL
NAS Brunswick RAO (EASTERN PLUME) ES-2 January 2000
• Compare the cost and performance data with the system design basis.
• Assess the need for additional system operation.
• Provide the future decision strategy framework and prioritizedrecommendations to improve total system performance and achieve siteremedial action objectives for optimal cost.
A site visit at NAS Brunswick was conducted from 20-21 July 1999 to gather therequired information for this report.
ES.3 Eastern Plume Remedial Action Overview
The Eastern Plume pump and treat (P&T) system was evaluated over an operatingperiod of approximately 3 years (July 1996 to May 1999). The treatment system iscomprised of a network of extraction wells (EWs) with treatment using ultravioletoxidation (UV-Ox). The system was designed to accommodate influent flow rates up to110 gallons per minute (gpm). The extraction system consists of 5 EWs. These extractionwells contain pumps rated at over 20 gpm.
Remedial action objectives for the system are covered under the United StatesEnvironmental Protection Agency (US EPA) Comprehensive Environmental Response,Compensation and Liability Act (CERCLA) program. A Record of Decision (ROD) forthis site was signed in February 1998. The remedial action proposed included operationof a P&T system and long term monitoring. Groundwater cleanup levels are those listedin the State of Maine Maximum Exposure Guidelines (MEGs). Current total volatileorganic compound (VOC) contaminant levels in the influent average 500 parts per billion(ppb).
ES.4 Eastern Plume System Performance Summary
The performance of the Eastern Plume system from July 1996 to May 1999 hasbeen fair, with increased performance following the addition of a new extraction well inJuly 1998. The overall performance is summarized below:
• Influent treatment plant flow rates are adequate, averaging 70 percent ofdesign capacity.
• Total mass removal has been 536 pounds of VOCs in 3 years of operation at acost of $3.4 million.
• The average mass removal rate of the system has been approximately15 pounds per month.
• The average cost per pound of contaminant removed is approximately $7,800.

Executive Summary FINAL
NAS Brunswick RAO (EASTERN PLUME) ES-3 January 2000
ES.5 Eastern Plume System Recommendations
The primary recommendation of this case study is to implement four primary,strategic recommendations. These four parallel activities are as follows:
• As groundwater monitoring results indicate that the downgradient edge of theEastern Plume has not changed position since 1995, focus futureinvestigations on confirming that the plume is stable or receding, and begin aformal evaluation of Monitored Natural Attenuation (MNA);
• Pursue negotiations with the regulators to establish risk-based cleanup levelsfor the entire Eastern Plume, and Alternate Concentration Limits (ACLs) forany groundwater discharging to Mere Brook;
• Continue and enhance contaminant mass removal in the Eastern Plume; and
• Modify the aboveground treatment system to allow effluent discharge tosurface water or to an infiltration gallery after confirming the most effectiveand efficient option based on a detailed technical review and life cycle costanalysis.
These four parallel activities will enable NAS Brunswick to prepare to work withregulators during any current and future performance evaluations. In addition, thisdiscussion should be used to reach an agreement on how to implement required changesto the ROD, i.e., via explanation of significant difference (ESD), or a ROD amendment.

Section 1 FINAL
NAS Brunswick RAO (EASTERN PLUME) 1-1 January 2000
1.0 INTRODUCTION
The Department of the Navy (DON) formed a working group in April 1998 toprovide guidance to the DON for optimizing Remedial Action Operation (RAO) andLong-Term Monitoring (LTM) programs at remediation sites. This Working Group, ledby the Naval Facilities Engineering Service Center (NFESC), selected four pump andtreat sites for detailed RAO evaluations. Three of these sites are at Marine Corps Base(MCB) Camp Lejeune, North Carolina, and the fourth is located at Naval Air Station(NAS) Brunswick, Maine. This case study report includes an evaluation of a groundwaterpump and treat (P&T) system located at the Eastern Groundwater Plume (Eastern Plume)at NAS Brunswick. Separate reports are available for evaluations of P&T systems atOperable Units 1 and 2 at MCB Camp Lejeune, and the Campbell Street Fuel Farm atMarine Corps Air Station, New River (co-located at Camp Lejeune).
1.1 Purpose and Objectives
The primary purpose of this case study is to evaluate and assess the ongoingRAO program at the Eastern Plume system at NAS Brunswick, Maine; and providerecommendations resulting in attainment of site remedial action objectives and closurefor optimal life-cycle costs.
Specific elements that were evaluated for the Eastern Plume P&T system include:
• Overall site remediation strategy and approach;
• Best operation and management practices already in place;
• Extraction system network, including all wells, screen intervals, and piping;
• Performance of treatment system components, including control systems;
• Operation, maintenance, and control for the treatment units;
• Treatment system data collection, analysis, and reporting;
• Effluent discharge options;
• Appropriate exit strategy for site closeout, including recommendations for theuse of alternative technologies, as appropriate; and
• Total estimated cost avoidance/savings from optimized operations.
1.2 Optimization Approach
The overall goal of this case study report is to provide a decision framework andrecommendations which will facilitate attainment of site remedial action objectives andclosure for optimal life-cycle costs. For the purposes of this report, optimal is defined as

Section 1 FINAL
NAS Brunswick RAO (EASTERN PLUME) 1-2 January 2000
the minimum cost without sacrificing data quality or decision-making. The approachemployed in this RAO optimization project to achieve this goal is outlined below:
• Gain a detailed understanding of the remedial decision-making framework,remedial action objectives, and site closure criteria for each site.
• Describe and understand past investigation and remedial actions taken to date,and how they have affected the current evolution and understanding of theconceptual site model.
• Describe the current conceptual site model, i.e., geology, pathways, receptors,and contaminants of concern (COCs).
• Gain an understanding of other remedial actions and associated data at NASBrunswick having potential applicability at the Eastern Plume.
• Describe the system design basis and operational objectives for the P&Tsystem, including extraction well network.
• Baseline the past and current cost and operational data for the system.
• Compare the cost and performance data with the system design basis.
• Assess the need for additional system operation.
• Provide the future decision strategy framework and prioritizedrecommendations to improve total system performance and achieve siteremedial action objectives for optimal cost.

Section 2 FINAL
NAS Brunswick RAO (EASTERN PLUME) 2-1 January 2000
2.0 LOCATION AND PHYSICAL SETTINGOF NAS BRUNSWICK
NAS Brunswick comprises 3,094 acres located south of the Androscoggin Riverbetween Brunswick and Bath, Maine, south of Route 1 and between Routes 24 and 123.The southern edge of the base borders the estuary of Harpswell Cove. NAS Brunswick isan active facility supporting the U.S. Navy’s antisubmarine warfare operations in theAtlantic Ocean and Mediterranean Sea. The base’s primary mission is to operate andmaintain P-3 Orion aircraft. NAS Brunswick first became active in the 1940s duringWorld War II, and underwent major expansion in the 1950s.
2.1 Location of NAS Brunswick and Case Study Site
The locations of the Eastern Plume and the three contributing sites ofcontamination at NAS Brunswick are shown in Figure 2-1. Descriptions of the sites areprovided in Section 3.0. The Eastern Plume is the result of contamination from threecontributing sites:
• Site 4 - the Acid/Caustic Pit, under the eastern portion of Building 584
• Site 11 - the former Fire Training Area (FTA)
• Site 13 - the Defense Reutilization and Marketing Office (DRMO) Areaimmediately south of Building 584 and Site 4
2.2 Physical Setting
This section describes the geology, hydrogeology, and geography at NASBrunswick. The information in this section is summarized from the 1995 Annual ReportMonitoring Events 1 through 4, Sites 1 and 3 and Eastern Plume, NAS Brunswick, ME(EA Engineering, July 1996).
2.2.1 Geology—In the shallow subsurface of the eastern portion of NAS Brunswick aresand, silt, and clay units overlying a moderately sloping bedrock surface. The mainaquifer impacted by the COCs occurs within the unconsolidated deposits. Three majorunits have been identified in the unconsolidated deposits: sand, transition, and clay(E.C. Jordan, 1990). The sand unit consists of fine sand which readily transmits water,and ranges from 10 to 20 feet thick in the Eastern Plume area. The transition unit liesbetween the overlying sand and underlying clay, and is composed of interbedded sands,silts, and clays. The transition unit thickens from 5 to 80 feet from west to east across the


Section 2 FINAL
NAS Brunswick RAO (EASTERN PLUME) 2-3 January 2000
Eastern Plume. The clay unit underlies the transition and overlies the bedrock surface in anearly continuous layer. The clay has low permeability, and ranges from 15 feet thick inthe northern portion of the Eastern Plume to an undetermined thickness in the south.
2.2.2 Surface Water – Hydrology—Most of NAS Brunswick lies within the MereBrook watershed, and most of the runoff from the installation drains into Mere Brook orits largest tributary, Merriconeag Stream. The brook drains into the tidally-influencedHarpswell Cove on the Atlantic Ocean.
2.2.3 Groundwater—Groundwater flow at the site occurs within an unconfined tosemi-confined aquifer system composed primarily of transitional, stratified, silty sandsand coarse sands. These transitional soils overlay a glacio-marine clay considered to bean underlying aquitard to the shallow groundwater flow system. The clay unit rangesfrom 20 to 60 feet thick, and is found throughout most of the Eastern Plume area. Thetransitional soils are separated into an upper stratified sandy silt unit and a lower coarsesand unit. Groundwater flow is largely influenced by Mere Brook and MerriconeagStream.
Average hydraulic conductivities at the site are 9.4 feet per day (ft/day) for thecoarse sands, 0.5 ft/day in the stratified silts, and 0.11 ft/day for the stream bottomsediments. Groundwater seepage velocities range from 85 to 1,200 ft/yr. Downwardvertical gradients exist in upland areas whereas upward gradients are generally present instream valleys.
2.2.4 Land Use—Land use around NAS Brunswick includes residential, park,industrial, and commercial properties. On base, natural areas such as wetlands andwooded areas are interspersed with developed land that houses administrative andmission-related buildings and airfield facilities. It is not anticipated that land use, eitheron or off base, will change in the foreseeable future.

Section 3 FINAL
NAS Brunswick RAO (EASTERN PLUME) 3-1 January 2000
3.0 EASTERN PLUME REMEDIALSYSTEM ASSESSMENT
3.1 Eastern Plume Background and Regulatory Framework
This section provides a description, regulatory information, and site activity statusfor the Eastern Plume and its contributing sites (Sites 4, 11, and 13) at NAS Brunswick.Figure 3-1 shows the location of the Eastern Plume. Tables 3-1 to 3-3 summarize theinformation for the sites.
3.1.1 Description—The Eastern Plume consists of contaminated groundwater locatedat the eastern edge of the installation. The Eastern Plume originated at three distinct siteslocated within several hundred feet of each other near Old Gurnet Road between theintersection of Orion Street and Sandy Road:
• Site 4: The Acid/Caustic Pit – Under the eastern portion of Building 584, thispit was used from 1969 to 1974 to dispose of acidic and caustic liquid wastes.The wastes were poured into the pit, which was approximately 4 feet squareand 3 feet deep. In 1975, Building 584 was constructed on top of the pit.Investigations showed that subsurface soils around Site 4 were notcontaminated and deemed suitable for no further action (NFA).
• Site 11: The former FTA – This area was used regularly over a 30-year perioduntil it was closed in the fall of 1990. Waste liquids, including fuels, oils, anddegreasing solvents, were used as fuel for the fire training exercises.
• Site 13: The DRMO Area – This area consisted of the former locations ofthree underground storage tanks (USTs) south of Site 4. One UST was usedfor diesel fuel; the other two tanks were reportedly used for storage of wastefuels, oils, and degreasing solvents. All three tanks were removed during thelate 1980s.
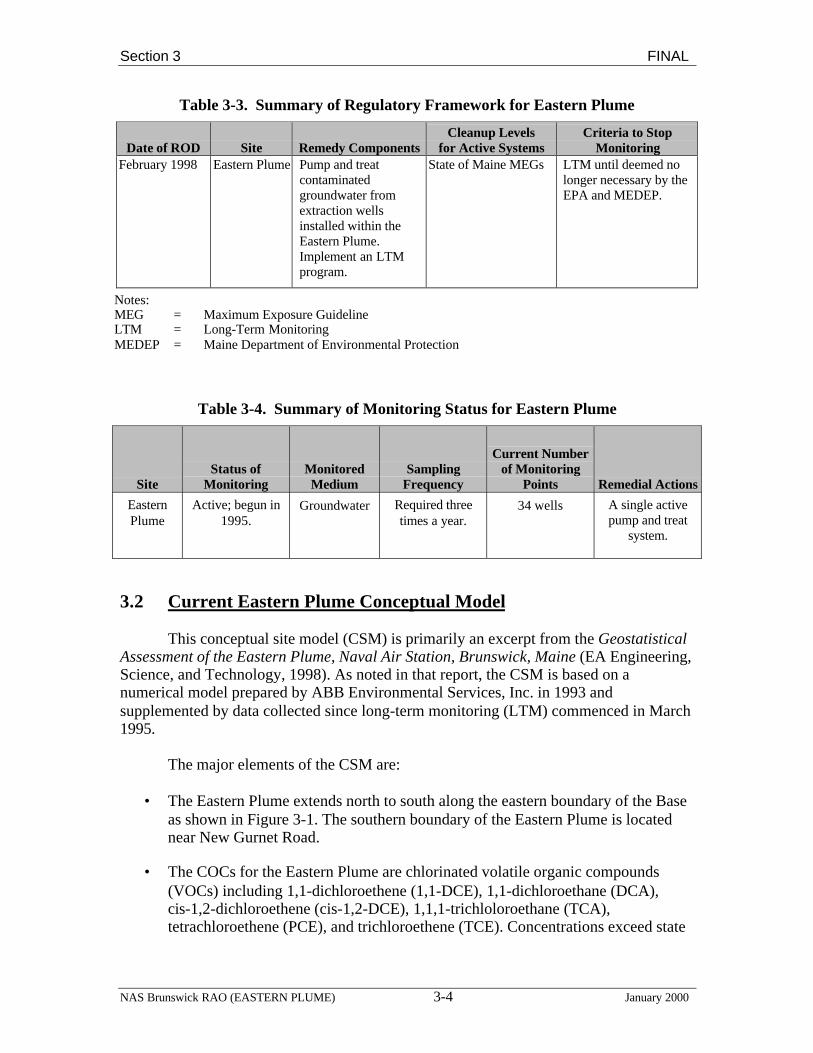
3.1.2 Regulatory Framework—A Record of Decision (ROD) for the Eastern Plumewas signed in February 1998. The ROD specified NFA for Sites 4, 11, and 13, and a finalremedial action for the Eastern Plume. The associated cleanup levels and selected remedycomponents are summarized in Tables 3-2 and 3-3. As shown in the tables, the RODspecifies continuation of extraction, treatment, and discharge of contaminatedgroundwater; these were selected as actions in the Interim ROD signed in 1992. TheLTM that began under the Interim ROD is also continued under the new ROD, withspecifications to modify, if necessary, to ensure proper coverage of the Eastern Plumearea. The monitoring status for the Eastern Plume is shown in Table 3-4.
For groundwater, ROD-specified cleanup levels are those listed in the MEG. TheROD states that the selected remedy will be operated until the cleanup levels for COCshave been met. In addition, Section X of the ROD contains language stating that althoughP&T is an effective method of reducing concentrations of highly contaminatedgroundwater, natural attenuation may be an important aspect in achieving the finalincrement of site cleanup.


Section 3 FINAL
NAS Brunswick RAO (EASTERN PLUME) 3-3 January 2000
Table 3-1. Description of Contaminated Sites for the Eastern Plume
Site Description Source of Release Contaminated MediaContaminants
of Concern
4 Acid/Caustic Pit
Liquid wastes Groundwater and Soil Chlorinated VOCs
11 FTA Waste fuels, oils,degreasing solvents
Groundwater and Soil Chlorinated VOCs
13 DRMO Waste diesel, fuels, oils,degreasing solvents
Groundwater and Soil Chlorinated VOCs
EasternPlume
EasternGroundwaterPlume
Contributingcontamination fromSites 4, 11, and 13
Groundwater Chlorinated VOCs
Note:VOC = Volatile Organic Compound
Table 3-2. Groundwater Cleanup Levels Sites 4, 11, 13, and Eastern Plume ROD
Contaminant of ConcernFederal MCL
(ppb)Maine MEG
(ppb) Cleanup Level (ppb)
1,1-dichloroethylene 7 7 7
1,1-dichloroethane - 5 (70**) 5
1,2-dichloroethane 5 5 5
cis-1,2-dichloroethylene 70 70 70
trans-1,2-dicholoroethylene 100 70 70
1,1,1-trichloroethane 200 200 200
1,1,2-trichloroethane 5 3 3
trichloroethylene 5 5 5
perchloroethylene 5 5 3Notes:
- = Not AvailableMCL = Maximum Contaminant LevelMEG = Maximum Exposure Guidelineppb = parts per billion** = Revised MEG recommended by State of Maine on June 19, 1995
Section 3 FINAL
NAS Brunswick RAO (EASTERN PLUME) 3-4 January 2000
Table 3-3. Summary of Regulatory Framework for Eastern Plume
Date of ROD Site Remedy ComponentsCleanup Levels
for Active SystemsCriteria to Stop
MonitoringFebruary 1998 Eastern Plume Pump and treat
contaminatedgroundwater fromextraction wellsinstalled within theEastern Plume.Implement an LTMprogram.
State of Maine MEGs LTM until deemed nolonger necessary by theEPA and MEDEP.
Notes:MEG = Maximum Exposure GuidelineLTM = Long-Term MonitoringMEDEP = Maine Department of Environmental Protection
Table 3-4. Summary of Monitoring Status for Eastern Plume
SiteStatus of
MonitoringMonitoredMedium
SamplingFrequency
Current Numberof Monitoring
Points Remedial Actions
EasternPlume
Active; begun in1995.
Groundwater Required threetimes a year.
34 wells A single activepump and treat
system.
3.2 Current Eastern Plume Conceptual Model
This conceptual site model (CSM) is primarily an excerpt from the GeostatisticalAssessment of the Eastern Plume, Naval Air Station, Brunswick, Maine (EA Engineering,Science, and Technology, 1998). As noted in that report, the CSM is based on anumerical model prepared by ABB Environmental Services, Inc. in 1993 andsupplemented by data collected since long-term monitoring (LTM) commenced in March1995.
The major elements of the CSM are:
• The Eastern Plume extends north to south along the eastern boundary of the Baseas shown in Figure 3-1. The southern boundary of the Eastern Plume is locatednear New Gurnet Road.
• The COCs for the Eastern Plume are chlorinated volatile organic compounds(VOCs) including 1,1-dichloroethene (1,1-DCE), 1,1-dichloroethane (DCA),cis-1,2-dichloroethene (cis-1,2-DCE), 1,1,1-trichloloroethane (TCA),tetrachloroethene (PCE), and trichloroethene (TCE). Concentrations exceed state

Section 3 FINAL
NAS Brunswick RAO (EASTERN PLUME) 3-5 January 2000
maximum exposure guidelines (MEGs) and federal maximum contaminant levels(MCLs) in drinking water.
• The sources of dissolved-phase VOC in the Eastern Plume are considered to beSite 4 (Acid/Caustic Pit), Site 11 (former FTA), and Site 13 (DRMO area).
• The COCs are present in the unconsolidated aquifer system and have notimpacted the bedrock aquifer.
• Based on the numerical model and measured potentiometric head changes withdepth, groundwater in the Eastern Plume can be defined as a two-layer system.Unconfined groundwater occurs within the upper stratified sand/silt unit (referredto as Layer 1 in the numerical model and as the upper or shallow sand andtransition unit in various reports). This upper sand/silt transition unit has asaturated thickness of approximately 20 to 30 feet. Semi-confined groundwateroccurs within a lower coarse sand unit (referred to as Layer 2 in the numericalmodel and as the lower or deep sand in various reports). This lower coarse sandunit is considered semi-confined due to the presence of the transition unit above,and the Presumscot clay formation below.
• The Presumscot clay foundation is considered an impermeable base for theunconsolidated aquifer system due to the thickness of the clay (i.e., 20 to 60 feet)across most of the Eastern Plume, and its low hydraulic conductivity (1x10⁻⁸
cm/sec).
• The confining clay formation is present over bedrock throughout most of theEastern Plume. The surface of this clay formation forms troughs that influence themovement of groundwater and migration of COCs. The troughs present in theclay formation appear to be the focal point of the dissolved-phase VOCs.
• Groundwater flow at the Eastern Plume is interpreted to discharge to MerriconeagStream, Mere Brook, Picnic Area Pond, and the Harpswell Cove watershed area.
• The Eastern Plume is recharged principally by infiltration of precipitation, and toa much lesser degree by upward groundwater flow. Measured potentiometricheads indicating an upward flow component from the lower sand unit to the uppersand/silt transition unit are commonly observed near Mere Brook and its majortributary, Merriconeag Stream. The upward flow gradients suggest that the MereBrook drainage system is recharged by groundwater throughout its length in thevicinity of the Eastern Plume.
• Samples collected from wells located in the upper sand/silt transition unit(Layer 1) generally have non-detectable or less than cleanup level concentrationsof COCs. Only one location in the upper sand/silt transition unit, at well MW-332,is known to exceed groundwater cleanup goals. The highest concentrations ofCOCs are reported in lower sand unit (Layer 2) wells screened within the claytroughs.

Section 3 FINAL
NAS Brunswick RAO (EASTERN PLUME) 3-6 January 2000
• Two areas of elevated VOC concentrations are observed in the lower coarse sandunit of the Eastern Plume: a northern lobe in the vicinity of extraction wells EW-4and EW-5, and a southern lobe in the vicinity of extraction wells EW-1 throughEW-3.
• Based on the results of LTM, the Eastern Plume is considered relativelystationary. The stability of the plume and the distribution of parent/daughtercompounds in the plume suggest that natural attenuation processes are occurringin the Eastern Plume.
• Groundwater in the area of the plume is not currently used for drinking water orother purposes; therefore, there are no human receptors (ABB EnvironmentalServices, Inc., 1993). Groundwater use on base can be prevented through the useof institutional controls; however, there is future potential exposure fromingestion for off base receptors if plume migration occurs (E. C. Jordan, 1990).Groundwater cleanup levels are based on applicable or relevant and appropriaterequirements (ARARs), which include drinking water MCLs and the MEGs(OHM Remediation Services Corp., 1996).
• In 1991, the Eastern Plume was predicted to discharge to Harpswell Cove in5 years, potentially affecting ecological receptors; however, there is currently noevidence that the predicted discharge is occurring.
3.3 System Descriptions and Design Basis
The groundwater P&T system at the Eastern Plume has been in operation sinceMay 1995. The system was designed to collect and treat contaminated groundwater fromthe Eastern Plume. Contaminated groundwater is extracted via a network of extractionwells and is then treated and discharged to the sanitary sewer. Figure 3-2 depicts a planview of the extraction system.
The groundwater P&T system for the Eastern Plume is co-located in the sametreatment building as the Landfill Sites 1 and 3 dewatering treatment system. The landfilldewatering system ceased operation in November 1997 because the system hadeffectively dewatered the landfill. This system may be restarted in the future ifgroundwater levels rise in the landfill area. The landfill dewatering system is notaddressed in the report except as it relates to the Eastern Plume P&T system.
3.3.1 Description of Extraction and Monitoring Well Network—The groundwaterP&T system was designed to collect landfill leachate and to dewater the waste buried atSites 1 and 3; and, to contain and remove dissolved-phase VOCs from groundwater in theEastern Plume (EA Engineering, Science, and Technology, 1999d). The P&T Systemutilizes a network of extraction wells to provide hydraulic control and removecontaminated water and a network of monitoring wells to measure system performance.The two well networks are described in the following sections.


Section 3 FINAL
NAS Brunswick RAO (EASTERN PLUME) 3-8 January 2000
3.3.1.1 Extraction Well Network
The original extraction well network, installed in 1995, included seven wells, EW-1through EW-7. Well EW-2A was added in 1998. The network currently includes fivepumping wells (EW-1, EW-2, EW-2A, EW-4, and EW-5) and three inactive wells(EW-3, EW-6, and EW-7). Extraction wells EW-1 through EW-5 are located at theEastern Plume and wells EW-6 and EW-7 are located at Sites 1 and 3. Althoughconnected to the same treatment system as the other wells, EW-6 and EW-7 wereinstalled to dewater the landfill wastes at sites 1 and 3, and are not directly related withremediation of the Eastern Plume. Figure 3-2 shows the locations of the eight extractionwells and the approximate boundary of the Eastern Plume. The locations of wells EW-1through EW-5 were selected based on groundwater modeling completed in 1993 thatpredicted hydraulic control of the Eastern Plume at a pumping rate of approximately20 gallons per minute (gpm) per well (ABB Environmental Services, Inc., 1993).
Operation of the original seven wells began in May 1995 with the initiation of a1-year system startup/prove-out period. In November 1997, pumping of EW-6 and EW-7was terminated when groundwater levels had been lowered below the landfill waste. Thewells remain on standby if needed in the future to dewater the waste. In June 1998,EW-2A was added to the extraction well network. It was installed downgradient ofEW-2, near the Eastern Plume Boundary, to capture and remove a portion of the plume inwhich concentrations of VOCs exceed 5,000 micrograms per liter (µg/L). In December1998, pumping at EW-3 was terminated due to the failure of the filter pack and wellscreen that allowed excessive amounts of silt and fine sand to enter the well(EA Engineering, Science, and Technology, 1999d). The well has been recommended forpermanent abandonment.
Each extraction well is constructed with 6-inch diameter, stainless steel wellcasing and screen. Each well screen is surrounded by a sand pack. The seven originalwells were installed with 6-inch diameter, stainless steel sumps of varying lengths belowthe screens; EW-2A was installed without a sump. Construction information for theindividual wells installed at the Eastern Plume is summarized in Table 3-5. The tableindicates that wells EW-1 to EW-5 are screened through both the sand/silt transition unitand the lower sand. Only well EW-2A is screened solely in the lower sand unit.
Table 3-5. Summary of Installation Details for Extraction Wellsin the Eastern Plume
Well Component Interval (feet below ground surface)
Well Component EW-1 EW-2 EW-2A EW-3 EW-4 EW-5Upper Grout Seal 0-13 0-9 0-44 0-11.5 0-6 0-14Bentonite Seal NA NA 44-46 NA NA NA
Sand Pack 13-95 9-86 46-65 11.5-65 6-66 14-84Screen 16-94 12-85 48-63 15-64 9-65 17-83Sump 94-101 85-92 NA 64-71 65-72 83-90Lower Grout Seal 95-101.5 86-94 NA 65-71 66-72 94-90
NA = Not Applicable

Section 3 FINAL
NAS Brunswick RAO (EASTERN PLUME) 3-9 January 2000
A stainless steel submersible pump is installed approximately 5 feet from thebottom of wells EW-1 through EW-5. At EW-2A, the pump is installed approximately9 feet from the bottom of the well. The extraction system controls are designed to protectthe pump from damage if the water level in the well is drawn down to a predetermineddepth. In the event of a low water level condition, a capacitance probe in the well casingtransmits a signal to the programmable logic controller (PLC), which instructs the motorcontrol center to shut off the pump (Woodard & Curran, 1996).
Each extraction well is equipped with an in-line, magnetic flow meter that is usedwhen adjusting the well’s pumping rate. The meter measures flow at the well head only.It does not transmit flow data to the treatment facility and has no totalizing capability(Woodard & Curran, 1996).
The water level in each extraction well is measured in a piezometer locatedadjacent to the well. A transducer installed in the piezometer measures pressure andtransmits the data to the PLC where the readings are converted to equivalent feet of water(Woodard & Curran, 1996).
3.3.1.2 Monitoring Well Network
The monitoring well network is a component of a LTM program that is designedto measure the effectiveness of remedial actions being conducted at Sites 1 and 3 and theEastern Plume. Specifically, monitoring data from the Eastern Plume are being used(EA Engineering, Science, and Technology, 1999d):
• To assess the ambient water quality trends from analyses of well samples andthe effectiveness of the P&T action;
• To evaluate the effectiveness of the groundwater extraction system byassessing trends in the concentration of VOCs in the Eastern Plume, andprovide recommendations to improve system effectiveness; and,
• To analyze the effective capture zone of the groundwater extraction system todetermine if hydraulic control of the plume is being maintained.
The well network includes the extraction wells and the monitoring wells listed inTable 3-6. As shown in the table, monitoring wells are assigned to one of three categoriesbased on their location relative to the Eastern Plume (EA Engineering, Science, andTechnology, 1999d). Each monitoring well is also classified as shallow or deep. Shallowwells are screened in the upper portion of the transition unit. Deep wells are screened inthe lower portion of the transition unit and in the coarse (deep) sand unit above the clayaquitard. Water samples are collected and analyzed for VOCs from these wells in March,July, and November of each year. Figure 3-3 shows the locations of the sampling points.
The LTM program requires that water levels be measured in conjunction withgroundwater sampling. In 1998, water levels were also measured in January, May, andSeptember. Water levels are measured in each of the sampled wells and in other selectedmonitoring wells. Figure 3-4 shows the locations of the water level gauging points.

Section 3 FINAL
NAS Brunswick RAO (EASTERN PLUME) 3-10 January 2000
Table 3-6. Summary of Sentinel, Perimeter, and Interior Plume Wells
Sentinel Wells Perimeter Wells Interior Plume Wells
MW-230A MW-229A MW-205
MW-231A MW-1104 MW-207A
MW-231B MW-105A MW-311
MW-313 MW-225A MW-319
MW-318 MW-306 MW-331
MW-333 MW-NASB-212 MW-332
MW-334 MW-224 P-106
MW-303 MW-330 EW-1
MW-305 P-111 EW-2
P-132 EW-2A
MW-308 EW-3
MW-309B EW-4
EW-5
Note: Only monitoring wells located within the Eastern Plume which are sampled under the draftLTM Plan have been assigned designations.
Definitions listed below were established during the 10 February 1999 Technical RestorationAdvisory Board Meeting:
• Sentinel wells are located outside the area of known contamination to be used to warn ofplume migration.
• Perimeter wells are located at the edge of the plume to monitor the plume boundary.
• Interior plume wells are located within the area of known contamination to monitorplume migration.
Source: 1998 Annual Report - Sites 1 and 3 and Eastern Plume Monitoring Events 11 through 13(EA Engineering, Science, and Technology, 1999d).


Section 3 FINAL
NAS Brunswick RAO (EASTERN PLUME) 3-13 January 2000
Annual routine maintenance of the monitoring wells includes inspection andmaintenance of identifying markings on each well; and inspection and replacement, asnecessary, of caps, locks, seals, and grouting (ABB Environmental Services, Inc., 1994).
3.3.2 Description of Aboveground Treatment Train for the Eastern Plume—Aschematic of the aboveground groundwater treatment plant for the Eastern Plume ispresented in Figure 3-5. The aboveground treatment train for the Landfill Sites 1 and 3dewatering system is also included in Figure 3-5 as it exists in the same treatmentbuilding. The following describes the treatment process for the Eastern Plume.
Metals Precipitation. Groundwater from the extraction wells is pumped directlyto a 1,400-gallon equalization tank equipped with a mixer. Potassium permanganate maybe added to the equalization tank to oxidize any iron and manganese present in thegroundwater. The metals precipitation process is currently not in use, as the first O&Mcontractor felt it was not needed to meet effluent standards.
Clarifier and Sand Filtration. The water is then either pumped to a clarifierand/or four green sand filters to remove any precipitated metals or bypassed directly tothe ultraviolet oxidation (UV-Ox) system. The filters are designed to treat a maximumflow of 110 gpm from the Eastern Plume and 20 gpm from landfill dewatering. Thefilters are equipped with a backwash system.
Ultraviolet Oxidation (UV-Ox). Prior to entering the UV-Ox system, theEastern Plume process stream is combined with the landfill process stream (ifoperational). Hydrogen peroxide is added to the combined process stream before it entersthe UV-Ox system. In the UV-Ox unit, the groundwater is irradiated with ultravioletlight. In the presence of ultraviolet light, hydrogen peroxide forms hydroxyl radicals,which is a strong oxidizer that can oxidize organic and inorganic compounds. Onceoxidized, organic molecules form various end products, such as carbon dioxide, water,and chloride.
Treated Effluent Storage and Discharge. From the UV-Ox system, the water isconveyed to the discharge holding tank. The discharge holding tank has a gravity outletto the Brunswick District sewer system.
Landfill Process Stream. The landfill process stream (designed for 20 gpm)includes metal precipitation involving an oxidation tank, solids and metals removal, andfiltration prior to being combined with the Eastern Plume process stream for treatment byUV-Ox. This system is currently idle.
Instrumentation and Control System. A PLC and a supervisory control anddata acquisition (SCADA) system are used to control the treatment plant. Signals fromvarious equipment transmit data such as flow, level, pH, turbidity, etc. The data is used tocontrol the process, alert the operator of alarm conditions, and log historical data to theSCADA system. There are personal computers equipped with the SCADA package tocontrol the treatment plant at the treatment plant building, the Base Fire Department, andthe Public Works


Section 3 FINAL
NAS Brunswick RAO (EASTERN PLUME) 3-15 January 2000
Building. Also, the operator may control the system via the phone lines with a portablecomputer equipped with the SCADA package. In the event of an alarm, the controlsystem alerts the operator by pager via modem and through the SCADA systems. Asummary of the data inputs of the instrumentation and control system (manual and/orcontrolled by the PLC) is provided in Table 3-7.
Table 3-7. Summary of the Eastern Plume Groundwater Treatment PlantData Input for Instrumentation and Control System
Process Data Input
Trend Recorders Two strip chart recorders are being used to monitor:
• Landfill Influent Flow (not operating)
• Eastern Plume Influent Flow
• Effluent Flow
Flow Meters Fourteen flow meters are located at the two extraction and treatmentfacilities. However, the individual flow meters at the wells do not transmit tothe control room. They are used for manually adjusting the flow at the wellhead. Six of these flow meters are located in the treatment plant and transmitflow data to the PLC.
pH and Oxidation ReductionPotential (ORP) Analyzers
Several ORP and pH analyzers are used to monitor flow, signal alarms, andcontrol chemical feed pumps.
Pressure Transducers Pressure transducers are used to control water levels in the equalization tank.This signal is sent to the PLC and is used to control the discharge pumps.
Level Switches Each process and bulk chemical tank has one or more level switches thatsignal the PLC to control pumps or activate alarm conditions.
Turbidity Meters In-line turbidity meters are installed to monitor turbidity and shut down thesystem when the turbidity is greater than 5 nephelometric turbidity units(NTU). The operator then manually diverts flow through the sand filters. Ifthe flow is greater than 10 NTU the operator manually diverts flow to theclarifier.
3.3.3 Design Specifications and Parameters—The remedial action objectives for theEastern Plume P&T system are summarized below:
• Minimize further migration of the Eastern Plume;
• Minimize any future negative impact to the Harpswell Cove estuary resultingfrom discharge of contaminated groundwater;
• Reduce the potential risk associated with ingestion of contaminatedgroundwater to acceptable levels; and
• Reduce the time required for restoration of the aquifer.
The total system design flow for the Eastern Plume P&T system is 110 gpm fromfive extraction wells. The landfill dewatering treatment system is designed to treat anadditional 20 gpm. The treatment plant is designed to remove VOC and metals to

Section 3 FINAL
NAS Brunswick RAO (EASTERN PLUME) 3-16 January 2000
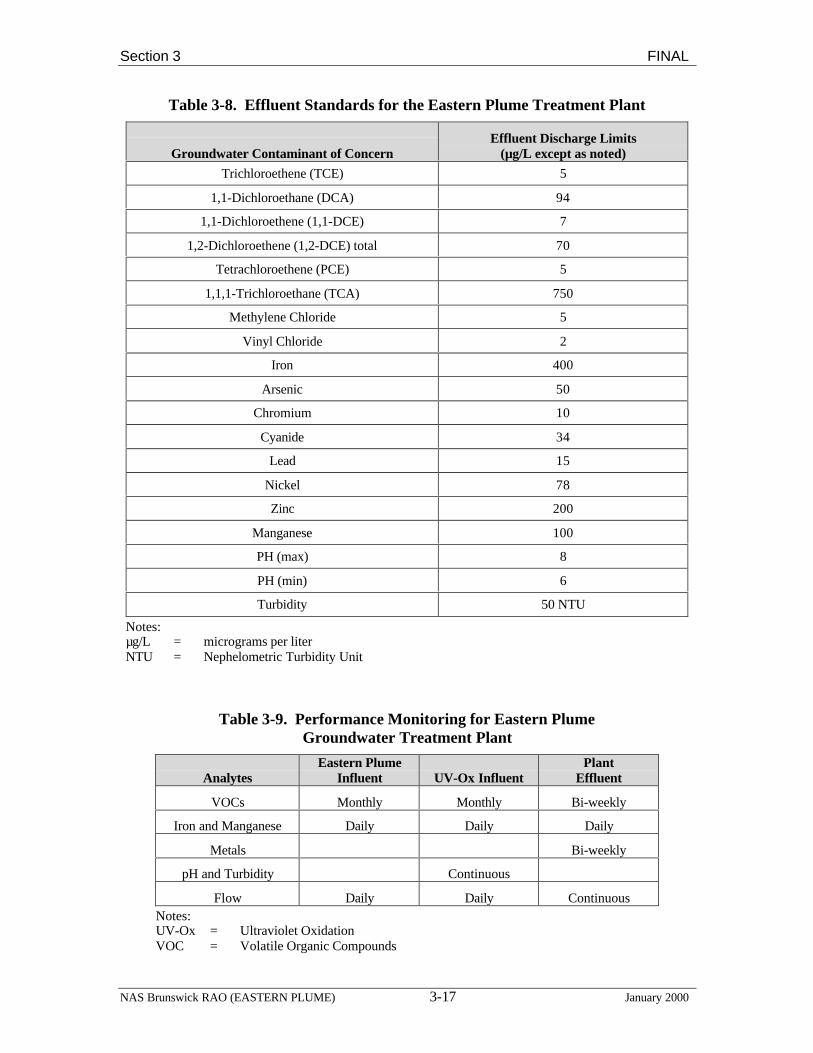
concentrations below the Brunswick Sewer District limits for discharge to the sanitarysewer. These limits for discharge are shown in Table 3-8. To monitor the performance ofthe Eastern Plume treatment plant, samples are collected monthly as shown in Table 3-9.
3.3.4 System Upgrades and Modifications—At the Navy’s request, the operations andmaintenance (O&M) contractor has recommended upgrading the Eastern Plumetreatment plant. Several upgrade options are presented in “Technical EngineeringEvaluation Report for Groundwater Extraction and Treatment System NAS Brunswick”(EA Engineering, 1999c). The report recommends modifying the Eastern Plumetreatment system by replacing the UV-Ox system with an air stripper followed bygranular activated carbon (GAC) polishing. This report also documents the Navy’sinvestigation which revealed that discharging to surface water and/or to groundwater viainfiltration galleries may be a more cost-effective approach than the current dischargemethod to the sanitary sewer. Other major upgrades include addition of the SCADAsystems in November 1997. The SCADA system was previously discussed in Section3.3.2.
3.3.5 Total Capital Costs—The total capital cost of the combined Eastern Plume P&Tsystem and the Landfill Sites 1 and 3 dewatering system was $4.25M. These costs aresummarized in Table 3-10. Given an estimated operational life of 10 years, this capitalcost translates to over $632,000 per year.
3.4 Best Practices Already in Place for the Eastern Plume
This section is intended to highlight good management practices that have beenimplemented by NAS Brunswick and its O&M contractors. The following are consideredgood O&M practices:
• Recently, the current O&M contractor verified that the treatment plantSCADA system was year 2000 (Y2K) compliant.
• From 1996 through 1999, the treatment plant operated at annual operatingpercentages ranging from 94 to 97 percent. These operating uptimes areconsidered above average.
• NAS Brunswick has implemented use of an interactive geographicinformation system (GIS). GIS, along with other graphic packages, help withthe visual interpretation of large amounts of data and allows for data query tohelp easily track trends in plume and contaminant migration at the EasternPlume.
• The addition of EW-2A increased mass removal. EW-2A now accounts for85 percent of the mass removal at the Eastern Plume. This represents goodoptimization practice.
• NAS Brunswick successfully dewatered the waste in the landfill, thuseliminating direct contact of groundwater with contaminants. The landfilldewatering system was turned off after only 17 months of operation.
Section 3 FINAL
NAS Brunswick RAO (EASTERN PLUME) 3-17 January 2000
Table 3-8. Effluent Standards for the Eastern Plume Treatment Plant
Groundwater Contaminant of ConcernEffluent Discharge Limits
(µg/L except as noted)
Trichloroethene (TCE) 5
1,1-Dichloroethane (DCA) 94
1,1-Dichloroethene (1,1-DCE) 7
1,2-Dichloroethene (1,2-DCE) total 70
Tetrachloroethene (PCE) 5
1,1,1-Trichloroethane (TCA) 750
Methylene Chloride 5
Vinyl Chloride 2
Iron 400
Arsenic 50
Chromium 10
Cyanide 34
Lead 15
Nickel 78
Zinc 200
Manganese 100
PH (max) 8
PH (min) 6
Turbidity 50 NTU
Notes:µg/L = micrograms per literNTU = Nephelometric Turbidity Unit
Table 3-9. Performance Monitoring for Eastern PlumeGroundwater Treatment Plant
AnalytesEastern Plume
Influent UV-Ox InfluentPlant
Effluent
VOCs Monthly Monthly Bi-weekly
Iron and Manganese Daily Daily Daily
Metals Bi-weekly
pH and Turbidity Continuous
Flow Daily Daily ContinuousNotes:UV-Ox = Ultraviolet OxidationVOC = Volatile Organic Compounds

Section 3 FINAL
NAS Brunswick RAO (EASTERN PLUME) 3-18 January 2000
Table 3-10. Capital Costs for the Eastern Plume and Landfill Treatment System
Description CostMobilization $19,620
Technical Plans $93,835
Site Preparation $279,090
Groundwater Extraction System $932,560
Utilities Groundwater Treatment Plant (GWTP) Building $153,164
GWTP Building $1,737,100
Groundwater Treatment - Process Equipment $851,800
Groundwater Treatment Plant Start-up $89,250
Groundwater Treatment Plant - Site Restoration $80,200
Demobilization $9,700
Total $4,246,319
Note: GWTP = Groundwater Treatment Plant
• Passive aqueous diffusion samplers were placed in the bed of Mere Brook toevaluate if contaminated groundwater discharge from the Eastern Plumemeasurably impacts Mere Brook. This is a proactive step in establishing themost appropriate cleanup requirements. Only toluene was detected in allsamples, and it was determined to be a method contaminant.
3.5 Eastern Plume System Performance Baseline
3.5.1 Eastern Plume Treatment System Cost and Performance Baseline—Figures 3-6 through 3-9 are cost and performance plots for July 1996 through May 1999 for theEastern Plume Treatment System. The dashed lines in each of the plots reflect the lineartrend of the data. Taken collectively, these plots provide valuable information on thecurrent and historical performance baseline for this system, and are discussed below:
• Figure 3-6, “Influent VOC Concentrations vs. Time”: As shown in Figure 3-6,the monthly total VOC influent concentrations for the Eastern Plume haveincreased steadily since system start-up. The increase is indicative of the additionof extraction wells in contaminant hot spots to improve system performance,particularly the installation of EW-2A in July 1998.
• Figure 3-7, “Cumulative Mass Recovered vs. Time”: The Eastern Plumesystem removed approximately 536 pounds of VOC during an operational periodof July 1996 through May 1999. Mass removal from the Eastern Plume had begunto decrease prior to the installation of EW-2A. Mass removal averages 15 poundsper month.
• Figure 3-8, “Cumulative Costs vs. Cumulative VOCs Recovered”: Figure 3-8graphically displays the relatively stable cost effectiveness of the Eastern Plumetreatment system; however, this figure also shows how expensive this operationhas been during its lifetime. With capital costs included, it has cost almost $3.5million (the amortized total cost increment) to remove approximately 536 pounds.So while the system has not experienced a significant decrease in mass removalefficiency, the price of operation has been high.

Section 3 FINAL
NAS Brunswick RAO (EASTERN PLUME) 3-19 January 2000
Figure 3-6. Influent VOC Concentrations vs. TimeEastern Groundwater Plume
NAS Brunswick
0
200
400
600
800
1,000
1,200
1,400
1,600
May
-96
Dec
-96
Jun-
97
Jan-
98
Jul-9
8
Feb
-99
Aug
-99
Time
VO
C C
on
cen
trat
ion
(u
g/L
)

Section 3 FINAL
NAS Brunswick RAO (EASTERN PLUME) 3-20 January 2000
Figure 3-7. Cumulative Mass Recovered vs. TimeEastern Groundwater Plume
NAS Brunswick
0.00
100.00
200.00
300.00
400.00
500.00
600.00
May
-96
Dec
-96
Jun-
97
Jan-
98
Jul-9
8
Feb
-99
Aug
-99
Time
Cu
mu
lati
ve M
ass
VO
C R
eco
vere
d (
lb)

Section 3 FINAL
NAS Brunswick RAO (EASTERN PLUME) 3-21 January 2000
0
500,000
1,000,000
1,500,000
2,000,000
2,500,000
3,000,000
3,500,000
4,000,000
0.00 100.00 200.00 300.00 400.00 500.00 600.00
Cumulative Mass VOC Recovered (lb)
Cu
mu
lati
ve C
ost
($)
Figure 3-8. Cumulative Costs vs. Cumulative VOCs RecoveredEastern Groundwater Plume
NAS Brunswick

Section 3 FINAL
NAS Brunswick RAO (EASTERN PLUME) 3-22 January 2000
• Figure 3-9, “Average Cost Per Pound Recovered vs. Time”: As seen inFigure 3-9, the average cost per pound removed for the Eastern Plume systemis trending steadily downward. Since a September 1996 high of approximately$11,000 per pound of VOC removed, the average cost per pound of VOCremoved has decreased to approximately $6,200 for the most recent 8 months.This decrease in cost can be directly attributed to the installation of EW-2A,which has improved system performance. The Eastern Plume treatment plantwas originally designed to handle not only the Eastern Plume, but also thelandfill site, and was consequently overbuilt for the site. The inclusion ofthese capital costs significantly skews the average cost per pound recoveredupward.
Table 3-11 summarizes selected performance parameters for the system.
Table 3-11. Eastern Plume System Performance vs. Design Data
Parameter Design Actual Average1 Actual Median1
Aquifer Average Flow Rate (gpm) 110 76.8 76.8
Monthly Aquifer Volume (gallons) 5,616,000 3,318,862 3,319,430
Monthly Mass removed (lbs.) - 15.3 15.5
Average cost per mass ($/lb.) - $7,781 $7,7421Based on performance data from July 1996-May 1999.- = Not Available
3.5.2 Extraction and Monitoring Well Network Performance—This sectiondiscusses the performance of the extraction and monitoring well networks at the EasternPlume. It also identifies data gaps that may preclude fully assessing system performance,groundwater conditions, or plume behavior.
3.5.2.1 Extraction Well Network
Mechanically, the operation of the Eastern Plume extraction well network in 1998was acceptable. Annual “uptime” of the wells ranged from 64 percent for EW-5 to100 percent for EW-2A, which began operating in June 1998. Most of the interruptions inthe operation of the extraction wells were due to power fluctuations and turbid conditionsin wells EW-1, EW-3, and EW-5 (EA Engineering, Science, and Technology, 1999d).Pumping at EW-3 was terminated in December due to the pumping of excessive sand andis not scheduled to resume. Pumping at EW-5 was suspended at the end of January untilthe well was redeveloped and restarted in June. Well EW-4 was removed from service inNovember due to pump motor problems and was not restarted until 1999. The operatingstatistics and the nature of the interruptions recorded in 1998 are typical of earlier yearsin the system’s operating history. Turbid conditions and “sand pumping” are anticipatedto be a recurring problem in those wells whose design and construction require that thepump be located in or near the screened, rather than the cased, portion of the well. Pumpplacement within the well screen increases water entrance velocities and contributes tohigher rates of corrosion, incrustation, and sand pumping.

Section 3 FINAL
NAS Brunswick RAO (EASTERN PLUME) 3-23 January 2000
Figure 3-9. Average Cost Per Pound Recovered vs. Time EasternGroundwater Plume
NAS Brunswick
$0
$2,000
$4,000
$6,000
$8,000
$10,000
$12,000M
ay-9
6
Dec
-96
Jun-
97
Jan-
98
Jul-9
8
Feb
-99
Aug
-99
Time
Ave
rag
e C
ost
of
VO
C R
eco
vere
d (
$/lb
)

Section 3 FINAL
NAS Brunswick RAO (EASTERN PLUME) 3-24 January 2000
Despite acceptable mechanical operation, a fundamental flaw in the design of wellsEW-1, EW-2, EW-3, EW-4, and EW-5 has resulted in sub-par system performance sinceoperation began. Each of the five wells is screened throughout the entire unconsolidatedaquifer system so that water is pumped not only from the contaminated lower sand unit,but also from the essentially uncontaminated upper sand/silt transition unit. As discussedbelow, the consequence of this well design will continue to negatively impact plumecontainment, contaminant mass removal, and operating cost.
Hydraulic Head and Gradients
In the lower sand unit, where contaminant concentrations are highest, large areasof the Eastern Plume that are located between the individual extraction wells ordowngradient of them are not hydraulically contained by the extraction well network.Capture zones measured in the lower sand unit extend only several tens-of-feet fromEW-1, EW-2, EW-3, EW-4, and EW-5. In comparison, distances separating adjacentextraction wells range from approximately 350 to 1000 feet. Due to the use of wells withscreen intervals that draw water from the entire unconsolidated aquifer system, capturezones have also been developed in the upper sand/silt transition unit, despite the nearlycomplete absence of COCs at concentrations above the cleanup levels in this unit.
Hydraulic head, represented by the water level measured in extraction andmonitoring wells, is illustrated on potentiometric surface contour maps for the shallowand deep zones in Figures 3-10 and 3-11, respectively. The figures show that, althoughinward gradients have been established around each extraction well, the radius ofinfluence extends only a short distance from the well. At EW-1, EW-2, EW-3, EW-4, andEW-5, which are screened through the entire unconsolidated aquifer system, the typicalradius of influence in the lower sand (deep zone) is 25 feet or less, and the maximumradius of influence is about 70 feet at well EW-5. By comparison, the radius of influenceat well EW-2A, which is screened in the lower sand unit only, is approximately 175 feet.The larger radius of influence measured at EW-2A demonstrates the advantage ofscreening extraction wells in the lower sand unit only. Although pumping at the sameapproximate rate as the fully screened wells, EW-2A is capturing a portion of the EasternPlume that is nearly 50 times larger than that being captured by each of the other fullyscreened extraction wells.
Because the extraction wells, other than EW-2A, are fully screened, capture zoneshave also been developed in the upper portion of the sand/silt transition unit (shallowzone). The typical radius of influence in this unit is approximately 75 to 100 feet and themaximum radius of influence was about 200 feet at well EW-3, before the well failed andwas abandoned. However, extracting groundwater from the upper sand/silt transition unitis not cost effective. Pumping and treating water that meets cleanup levels results in theuse of system capacity and other resources managing water that need not be extracted.
Data regarding vertical gradients near the extraction wells is sparse, but notconsidered critical to evaluating plume containment, because downward migration of theEastern Plume is precluded by the Presumscot clay layer.


Section 3 FINAL
NAS Brunswick RAO (EASTERN PLUME) 3-27 January 2000
Pumping Rates
The extraction wells have not achieved the individual pumping rates specified indesign documents (ABB Environmental Services, Inc., 1993) to prevent further migrationof the Eastern Plume, nor is the combined pumping rate sufficient to ensure adequateflushing of the contaminant plume. In 1998, the average annual pumping rate of theindividual extraction wells ranged from 8.0 gpm for EW-5 to 18.6 gpm for EW-4. Theaverage pumping rates are less than the design rate of approximately 20 gpm estimatedfor each of the five original extraction wells by numerical modeling completed in 1993(ABB Environmental Services, Inc., 1993). In 1998, the combined average pumping rateof the six extraction wells in the Eastern Plume including EW-2A, which was added inmid-year, was 85.8 gpm (EA Engineering, Science, and Technology, 1999d). Althoughthe addition of EW-2A increased the combined pumping rate for the well network, theaverage pumping rate of well EW-2 dropped from about 25 gpm to 13.8 gpm after theaddition. EA Engineering, Science, and Technology (1999d) attributed the reducedpumping rate to limits in the capacity of the piping that connects the two wells, not tolimits in the aquifer yield.
The pore volume of the Eastern Plume’s northern and southern lobes is roughlyestimated at 45 million gallons (Mgal) each. Typically, extraction well systems should bedesigned and operated to extract between 0.3 and 2 pore volumes per year from thecontaminant plume (Cohen, 1994). Based on 1998 pumping rates, less than 0.3 and 0.5pore volumes were extracted from the northern and southern lobes of the Eastern Plume,respectively. These values are liberal estimates that overstate the actual number of porevolumes removed for several reasons. First, they assume 100 percent “uptime” for thesystem and, second, they assume that all of the water extracted was derived from thecontaminated portion of the lower sand unit. Since neither of these conditions was met,removal from the two plume lobes may be as low as half the number of pore volumesestimated.
Extracted Water Quality
Trends in the chemical quality of the treatment system influent indicate that theextraction wells are removing contaminant mass, but are not doing so efficiently. Inaddition to extracting water from the contaminated lower sand unit, the fully screenedwells are extracting uncontaminated water from the upper sand/silt transition unit. Moreefficient mass removal is evident in the performance of well EW-2A, which is screenedonly in the lower sand unit.
Prior to the addition of well EW-2A in June 1998, total VOC concentrations inthe treatment system influent ranged from 274 µg/L to 537 µg/L with a medianconcentration of 411 µg/L. Since EW-2A was added, total VOC concentrations haveranged from 608 µg/L to 1483 µg/L with a 72 percent increase in the medianconcentration to 760 µg/L. Part of the increase in the median concentration is due to theinstallation of EW-2A within a “hotspot” in the plume. However, a second factorcontributing to the increase is the design of EW-2A, which isolates the well screen in the

Section 3 FINAL
NAS Brunswick RAO (EASTERN PLUME) 3-28 January 2000
contaminated lower sand unit. Due to the well design, water extracted by EW-2A is notdiluted by groundwater from the upper sand/silt transition unit.
In contrast, an example of the dilution occurring in fully screened extraction wellsis evident at EW-5, where monitoring points in the lower sand unit are located near theextraction well. Total VOC concentrations detected in groundwater samples from thedeep monitoring points are an order-of-magnitude higher than total VOC concentration inwater extracted from EW-5 (EA Engineering, Science, and Technology, 1999d). Thedevelopment of capture zones in the upper sand/silt transition unit, discussed earlier,provides supporting evidence that dilution of the influent is occurring.
A similar trend is seen in the record of contaminant mass removed by the system.The mass of VOCs removed in 1998 totaled 240 pounds as compared to 112 pounds in1997 (EA Engineering, Science, and Technology, 1999d). The highest mass removalrates in 1998 were experienced in June and July, shortly after EW-2A was put on-line.Over the remainder of the year, mass removal rates decreased, exhibiting an asymptotic“tailing” phenomenon that is typical in P&T systems. Nevertheless, at year’s end, themass removal rate was approximately 60 percent above rates measured earlier in the year(EA Engineering, Science, and Technology, 1999d), justifying both the design andlocation of EW-2A.
Contaminant Concentration and Distribution
Contaminant distribution in the Eastern Plume has been consistent since LTMbegan in 1995. The distribution of VOCs within the Eastern Plume as determined byLTM suggests that no measurable migration of the plume has occurred. Trends in VOCconcentrations in samples collected from monitoring and extraction wells over the sameperiod have varied with location within the plume. VOC concentrations in perimetermonitoring wells generally exhibit a decreasing trend, whereas concentrations at interiormonitoring wells appear stable. Total VOC concentration in samples from EW-1, EW-3,and EW-5 have decreased over time exhibiting a tailing phenomenon common toextraction. However, experience at other P&T systems indicates that concentrations mayrebound if pumping is terminated.
Isoconcentration contour maps illustrated in Figures 3-12 and 3-13 estimate theareal extent of groundwater with VOCs exceeding cleanup levels in the shallow and deepzones of the Eastern Plume during November 1998. Figure 3-12 shows that MEGs orMCLs are exceeded in only three isolated areas within the upper sand/silt transition layeror shallow zone. Two of the areas are located near Sites 1 and 3 and the third area is nearwell MW-332. Geostatistical analysis, previously completed in early 1998, confirmedthat the upper sand/silt transition is "relatively unaffected by volatile organic compounds"(EA Engineering, Science, and Technology, 1998b). Figure 3-13 shows that, within thelower sand unit or deep zone, two lobes of the Eastern Plume exhibit VOC concentrationsthat exceed the MCLs or MEGs. The separation of the Eastern Plume into two lobes istentatively attributed to a bedrock formed ridge.


Section 3 FINAL
NAS Brunswick RAO (EASTERN PLUME) 3-31 January 2000
In comparison to these maps, Figures 3-14 and 3-15 show concentration contourmaps for the shallow and deep zones in the Eastern Plume based on LTM monitoringresults from March 1997. No changes are evident between the figures from 1997 and1998 for the shallow zone, whereas the western, or upgradient extent of the southern lobein the deep zone, between well MW-225A and Mere Brook, appears to have migratedeastward several tens-of-feet over the period of 20 months. During the same periodhowever, the figures indicate no apparent change in the downgradient position of theEastern Plume. The size of the southern lobe within the deep zone appears to haveincreased since 1997, but the apparent growth is due to the availability of new data fromadditional monitoring wells, rather than from a physical change. Geostatistical analysisalso determined that the distribution of concentrations within the lower sand duringMarch 1997 had not changed significantly from concentrations measured 22 monthsearlier in May 1995, and concluded that “the Eastern Plume is stationary” (EAEngineering, Science, and Technology, 1998b). Therefore, LTM results for the entireperiod of record suggest that except for a minor shift in the position of the southern lobe’supgradient boundary, the extent and position of the plume is unchanged since at least1995.
Because large areas of the plume are not captured by the extraction wells, theapparently unchanging position of the plume is due to one or more other factors. Onepossible explanation, supported by the potentiometric surface data, is that contaminatedgroundwater is discharging into the Mere Brook drainage system. Figures 3-10 and 3-11show that groundwater flows under natural gradients toward Mere Brook andMerriconeag Stream. The maps depict a groundwater drainage basin with concentrateddischarge areas along Mere Brook and Merriconeag Stream. The gradients illustrated arecharacteristic of local groundwater flow systems that are common in areas with well-defined local relief. However, analysis of surface water samples collected from thedrainage system detected COCs at only trace concentrations and the analysis of aqueousdiffusion samplers placed in Mere Brook did not detect COCs. These results suggest thatplume constituents may be degrading under natural remediation processes that areoperating in wetland areas adjacent to the streams.
Another contributing factor may be the degradation of COCs through the processof reductive dechlorination. LTM results indicate the presence of PCE, TCE, and 1,2-DCE within the Eastern Plume. The results also indicate that a higher proportion of PCEoccurs at interior monitoring wells with an increasing proportion of 1,2-DCE toward theperimeter of the plume. The presence and distribution of daughter products within theEastern Plume indicates that reductive dechlorination is taking place. In 1998, the resultsof statistically analyzing the relative distribution of parent and daughter products in theEastern Plume also suggested that “chemical transformation and/or bioremediation isoccurring” (EA Engineering, Science, and Technology, 1998b).
3.5.2.2 Monitoring Well Network
The LTM program including the monitoring well network at the Eastern Plume isperforming as designed. Gauging and sampling locations are adequate to interpret


Section 3 FINAL
NAS Brunswick RAO (EASTERN PLUME) 3-34 January 2000
groundwater flow and to assess contaminant distribution. Interior plume wells monitorthe impacts of the extraction system and perimeter and sentinel wells assess potentialcontaminant migration. Monitoring results are evaluated regularly, possible trends areidentified, and the LTM program is re-assessed and modified, as necessary. However,two elements of the monitoring network and LTM program can be optimized.
First, piezometers currently in the monitoring well network are not adequate tomeasure the development of capture zones in the lower sand unit. However, this failure isdue as much to the small radius of influence established around each extraction well as itis due to the number and location of the piezometers. Nevertheless, except at EW-2A,additional piezometers should not be installed until properly screened extraction wells areinstalled and operating.
Second, the practice of illustrating total VOC concentrations on the groundwaterisoconcentration contour maps, particularly the 100 µg/L contour concentration curve,can be misleading. Plotting total VOC concentration provides a general perspective of theplume, but does not provide a comparison with cleanup levels, which are specific toindividual COCs.
3.5.3 Aboveground Treatment Train Performance—Since operation began in 1995,the aboveground treatment train for the Eastern Plume has been performing at a level thatmeets requirements of the design basis. From 1996 through April 1999, the plant hasoperated at an average flow rate of 76 gpm, approximately 70 percent of its design flowof 110 gpm for the Eastern Plume. Most of the equipment at the plant is functioning asdesigned.
From 1996 through 1999, the treatment plant operated at annual operatingpercentages ranging from 94 to 97 percent. These operating uptimes are considered aboveaverage. One primary cause of system downtime that has not been remedied is plant shutdown due to fluctuations in turbidity. Currently the plant is set to shut down when theturbidity exceeds 5 NTU. The operator then manually switches the flow through the sandfilters prior to treatment by UV-Ox. When turbidity is greater than 10 NTU, the plantautomatically shuts down and the operator manually switches the flow through theclarifier prior to treatment by UV-Ox.
Exceedance of the Brunswick Sewer District Discharge requirements for VOCshave occurred twice since 1996. In December 1998, concentrations of 1,1-DCE slightlyexceeded the discharge limit of 7 ppb. This was attributed to high turbidity, causinginefficiencies in the UV-Ox system. In June 1998, due to the addition of extraction wellEW-2A, a discharge exceedance TCA occurred. Corrective action was taken to optimizethe hydrogen peroxide rate and UV-Ox process to ensure additional exceedances wouldnot occur.
Since 1996, only one exceedance of pH over the maximum effluent requirement(pH of 8) occurred. This pH exceedance occurred in June 1996.

Section 3 FINAL
NAS Brunswick RAO (EASTERN PLUME) 3-35 January 2000
The groundwater treatment plant (GWTP) for the Eastern Plume has consistentlyexceeded the discharge requirements of 100 ug/l for manganese. Manganeseconcentrations are recorded daily. A few days of each of the following months were inexceedance of the discharge requirements up to concentrations of 300 ug/L: Aug 96, Dec96, June 97, Aug 97, Sept 97, Oct 97, Nov 97, Dec 97, Jan 98, May 98, Aug 98, Dec 98,Jan 99, Feb 99, and June 99. In addition, most days in the months of March 99 and May99 exceeded the effluent discharge requirements for manganese. Note that theprecipitation process previously described is not currently in use at the Eastern Plumetreatment plant.
A review of the existing sampling and analysis plan for the Eastern Plumeindicates that the individual effluent from each well is not analyzed separately. Inaddition, the effluent samples from the treatment plant are collected on a bi-weekly basisas prescribed by the National Pollutant Discharge Elimination System (NPDES) permit.This frequency is considered high as many GWTP NPDES permits only require monthlyeffluent sampling. Also, because the landfill dewatering system is not active, the EasternPlume influent sample and the UV-Ox influent sample are considered redundant, as thereis no treatment occurring to the process stream between the sample points.
The annual O&M costs for the Eastern Plume Groundwater P&T system areprovided in Table 3-12. The most costly O&M item for the Eastern Plume is the sanitarysewer discharge fee of $0.03 per cubic foot for treated water discharge, or approximately$158,000 annually. The sewer fee is considered extremely high in comparison to otherP&T systems around the country. Currently, NAS Brunswick is considering otherdischarge options mentioned in Section 3.3.4 and/or renegotiating with the BrunswickSewer District. The second most costly O&M item is the labor (operator and support) at atotal of $180,000 annually. This equates to more than two full time personnel to run theEastern Plume Treatment Plant. These labor hours are considered excessive in light of theactivities performed. NAS Brunswick is currently renegotiating the O&M contract toinclude one part time operator with reduced support.

Section 3 FINAL
NAS Brunswick RAO (EASTERN PLUME) 3-36 January 2000
Table 3-12. Annual Operation and Maintenance Costsfor the Eastern Plume Groundwater Treatment System
Description Cost
Amortized Capital Cost (10 years) $632,826.75
Sewage Discharge Fees $158,000.00
Replacement of UV Lamps $18,000.00
UV Replacement Parts $4,200.00
On-site Service $7,200.00
Chemical Usage (50% Hydrogen Peroxide) $8,500.00
Electrical Usage $47,304.00
Laboratory Analysis $29,700.00
Reporting $12,000.00
Labor (Grade 1 Phy/Chem Treatment Plant Operator) $110,000.00
Support Labor $70,000.00
ODCs $46,300.00
Total Annual Cost $1,144,030.75
Average Monthly Cost $95,335.90

Section 4 FINAL
NAS Brunswick RAO (EASTERN PLUME) 4-1 January 2000
4.0 CONCLUSIONS AND RECOMMENDATIONSFOR THE EASTERN PLUME SYSTEM
Based on the information reviewed and presented in Section 3.0, five primaryrecommendations are presented below for the Eastern Plume P&T system. The resultingdata and information will form the basis for any current and future performanceevaluations discussed in recommendation V. In addition, current and future operationalrecommendations to optimize the Eastern Plume P&T system are summarized inTable 4-2 and discussed in Sections 4.2 and 4.3.
4.1 Primary Recommendations for Eastern Plume
I. Begin a formal evaluation for Monitored Natural Attenuation (MNA) for theEastern Plume. In particular, determine whether natural wetlandbiodegradation and/or natural attenuation processes are occurring atacceptable rates in the aquifer zone and at Mere Brook, as discussed in section4.1.1. Groundwater monitoring results indicate that the downgradient extent ofthe plume has not changed since at least 1995. Verify, through continuedmonitoring, that the Eastern Plume is not migrating and identify themechanisms (e.g., discharge to surface waters, natural attenuation) by whichthis is occurring. It may be necessary to suspend operation of the remediationsystem in order to monitor natural attenuation processes.
II. Pursue negotiations with the regulatory agencies to establish risk-basedcleanup levels for the entire Eastern Plume, and Alternate ConcentrationLimits (ACLs) for any groundwater discharging to Mere Brook. Groundwaterat the Eastern Plume is not a drinking water source, thus cleanup to MCLs orState of Maine standards is not necessary for the remedy to remain protectiveof human health. In addition, per SARA Section 121(d), ACLs may beestablished if groundwater is shown to discharge to Mere Brook withoutmeasurably degrading the water quality of the brook as discussed in Section4.1.2.
III. Continue and enhance contaminant mass removal in the Eastern Plume. Asrecommended in Section 4.2.1, mass removal should be enhanced byreplacing existing extraction wells EW-4 and EW-5 with wells that arescreened solely in the lower sand unit “hotspots”. In order to ensureappropriate piping size and treatment system capacity, determine groundwaterflowrates and mass removal from these new extraction wells prior to makingany modifications to the aboveground treatment system.
IV. Modify the aboveground treatment system to allow effluent discharge tosurface water or to an infiltration gallery after confirming the most effectiveand efficient option based on a detailed technical review and life cycle costanalysis.

Section 4 FINAL
NAS Brunswick RAO (EASTERN PLUME) 4-2 January 2000
V. Utilize the data and trend analysis resulting from recommendations I throughIV to prepare for any current and future performance evaluations. Inparticular, begin discussions with the regulatory agencies to establishdefinitive criteria for discontinuing active pump and treat (P&T) as the finalremedy. As an example, “discontinue pump and treat operations for theEastern Plume if MNA is demonstrated to occur at acceptable rates, and whenmass removal from extraction wells EW-4, EW-5, and EW-2A reachasymptotic levels.” Also, reach agreement with the agencies on the criteriaand process for implementing required changes to the ROD, i.e., explanationof significant difference (ESD) or a ROD amendment.
4.1.1 Implementation of an MNA Program—Evidence should be gathered toevaluate the downgradient wetlands of the Eastern Plume as a viable, passive,biodegradation treatment option. In addition, the groundwater at the Eastern Plumeshould be screened to determine if natural attenuation processes are occurring. The parentproducts that have been released to the aquifer appear to be TCA, PCE, and potentiallyTCE. The presence of 1,2-DCE, a daughter product of TCE, indicates that reductivedechlorination may be occurring in the aquifer. Furthermore, in addition to being a parentcompound, TCE can also occur as a daughter product from reductive dechlorinationprocesses. As a first step, the following parameters should be collected to screen fornatural attenuation:
• Aromatic and chlorinated hydrocarbons (parent and daughter products)- fullsuite SW8260, including the existing NAS Brunswick SW8260 analyte list,plus the addition of the following daughter products: cis-1,2-DCE, trans-1,2-DCE, vinyl chloride (VC), and chloroethane in all appropriate wells;
• Methane, ethane, and ethene;
• Dissolved oxygen (DO);
• Total organic carbon (TOC);
• Reduction oxidation (Redox) potential; and
• Water quality parameters.
To perform a complete natural attenuation study, Table 4-1 summarizes thenatural attenuation sampling parameters to be measured and the data use for eachparameter as requested by NAS Brunswick. It is recommended that all samples becollected using low flow techniques and a flow-through sample collection cell. For moreinformation on natural attenuation, refer to the “Technical Guidelines for EvaluatingMonitored Natural Attenuation at Naval and Marine Corps Facilities” (Department ofthe Navy, 1998).
4.1.2 Establishment of Alternate Concentration Limits (ACLs)—It is recommendedthat NAS Brunswick pursue discussions with the regulatory agencies to establish lessstringent groundwater cleanup criteria known as ACLs. Per SARA Section 121(d), ACLscan be established when it can be shown that groundwater discharging to a surface water

Section 4 FINAL
NAS Brunswick RAO (EASTERN PLUME) 4-3 January 2000
Table 4-1. Natural Attenuation Sampling Parameters
Analyses Method/Reference Data Use
WATER ANALYSESAromatic and Chlorinatedhydrocarbons - Full Suite includingexisting SW8260 analyte list, plusthe addition of cis-1,2-DCE, trans-1,2-DCE, VC, and chloroethane
SW8260(full suite)
Used to identify the primary target analytes and theirdaughter products. The presence of daughterproducts is a good indicator of dechlorination.
Methane, Ethene and Ethane SW3810Mor Microseeps
The presence of ethane and ethene suggestsbiological transformation of chlorinated solvents.The presence of methane may suggest degradationthrough methanogenesis.
Dissolved Oxygen (option to fieldanalysis)
Microseeps Concentrations less than 1 mg/l indicate ananaerobic condition.
Nitrate, Sulfate, Chloride E300.0 Nitrate and sulfate are the substrate for anaerobicmicrobial respiration. Chloride is the final productof chlorinated solvent reduction.
Nitrite E354.1 Reduced form of nitrate, indicates reductivechlorination.
Alkalinity E310.1 General water quality parameter used to measure thebuffering capacity of groundwater. May also be usedto indicate dissolved inorganic carbon, which is abyproduct of organic carbon oxidation.
Ferrous Iron – 10% laboratory QC(confirmation for field analysis)
E310 Used to confirm ferrous iron field measurements.Reduced form of ferric iron, indicates reductivechlorination.
Total Iron and Manganese SW6010 Used to determine Ferric iron [Iron (III)] and Mn(IV) concentrations as they are the substrate foranaerobic microbial respiration.
TOC SW9060 TOC used to determine if cometabolism is possible.
FIELD ANALYSESFerrous Iron [Iron (II)] Colorimetric
HACH 8146Reduced form of Iron (III), may indicate reductivechlorination.
Manganese [Mn (II)] ColorimetricHACH
Reduced form of Mn (IV), may indicate reductivechlorination.
H2S ColorimetricHACH 2238-01
The presence of H2S suggests degradation via sulfatereduction.
Dissolved Oxygen (DO) Direct-reading meter Concentrations less than 1 mg/l indicate an anaerobiccondition. Anaerobic conditions are required forreductive dechlorination.
Redox Potential Direct-reading meter(A258OB)
Indicates the biological degradation of contaminantsand the relative oxidizing or reducing nature of theaquifer.
pH E150.1 DirectReading Meter
Standard water quality parameter measured duringwell sampling to indicate sample is representative ofthe aquifer. Also anaerobic processes are sensitive topH.
Temperature E170.1 DirectReading Meter
Standard water quality parameter measured duringwell sampling to indicate sample is representative ofthe aquifer.
Conductivity E120.1 DirectReading Meter
Standard water quality parameter measured duringwell sampling to indicate sample is representative ofthe aquifer.
mg/L = milligrams per literpH = Hydrogen Ion ConcentrationQC = Quality ControlTOC = Total Organic Carbon
H2S = Hydrogen SulfideRedox = Reduction OxidationDCE = DichloroetheneVC = Vinyl Chloride

Section 4 FINAL
NAS Brunswick RAO (EASTERN PLUME) 4-4 January 2000
body does not measurably degrade the surface water body; and, there are no known points ofhuman exposure to the contaminated groundwater prior to it reaching the surface water body.
This appears to be the case for the Eastern Plume. In this instance, the allowable ACLfor the plume is the maximum groundwater contaminant concentration which candischarge to Mere Brook without measurably degrading its water quality. It is expected thatthis allowable concentration would be significantly higher than MCLs and/or current State ofMaine standards.
Typically, supporting data requirements to establish ACLs include simple mixingzone model results and/or sampling results from the interface of the groundwater and surfacewater bodies. The samples previously collected using vapor passive diffusion samplers in thebed of Mere Brook can serve as direct supporting evidence for this evaluation.
4.2 Eastern Plume Extraction and Monitoring NetworkRecommendations
This section provides specific recommendations for improving the performance of theextraction well network at the Eastern Plume; and for enhancing monitoring capabilitiesunder the LTM program. These recommendations are summarized in Table 4-2.
4.2.1 Extraction Well Network—The steps outlined below should be implemented toenhance contaminant mass removal from the lower sand unit and to improve overall systemperformance and efficiency:
• The use of all current extraction wells, except EW-1 and EW-2A, should bediscontinued and the wells should be properly abandoned. The existing wellscannot be modified to isolate their production intervals in the contaminated lowersand unit.
• The abandoned wells should be selectively replaced by properly designed,constructed, and developed extraction wells that are screened solely in the lowersand unit. In general, the new extraction wells should be located in the areas ofgreatest known contamination to reduce the flow path and travel time ofcontaminants to the extraction wells. Specifically, new wells should be installednear current wells EW-4 and EW-5. No replacements are recommended for EW-2and EW-3 because total VOC concentrations at these locations are insufficient tojustify a focused mass removal approach.
• Well EW-1 should continue to be operated. Replacement of EW-1 is notrecommended because analytical results from recent LTM events indicate similarVOC concentrations in samples collected from EW-1 and deep monitoring wellMW-229A. Therefore, a new extraction well screened only in the lower sand unitmay not enhance contaminant mass removal at this location. Additional LTM datafrom future sampling events, particularly concentrations of individual COCs,should be evaluated to confirm this conclusion.

Section 4
FIN
AL
NA
S Brunsw
ick RA
O (E
AST
ER
N PL
UM
E)
4-5January 2000
Table 4-2. Eastern Plume Evaluation and Optimization Recommendations Summary
System Component Consideration Cost Impacts Effectiveness ImpactsEastern Plume Extraction WellNetwork
Discontinue use of all EW’s exceptEW-1 and EW-2A.
• Unknown • Eliminates ineffective wellsthat cannot be modified toimprove performance.
Eastern Plume Extraction WellNetwork
Position pumps in EW-2A and allnew wells so that intakes are not inwell screen.
• Unknown • Decrease in pump corrosion,incrustation, and sand pumping.
Eastern Plume Extraction WellNetwork
Size and configure EW distributionpiping to handle pumping rates ofindividual wells.
• Unknown • Increased mass removal.
Eastern Plume Extraction WellNetwork
Install piezometers in the lowersand unit at each new EW.
• $20,000 • Allows monitoring of EWcapture zones.
Eastern Plume Extraction WellNetwork
Install extraction wells screenedsolely in the contaminated lowersand unit. Install at “hotspots” in theEastern Plume, specifically nearcurrent EW-4 and EW-5.
• $15,000 to $20,000 per well,exclusive of distribution piping.
• Increase contaminant massremoval.
• Enlarge capture zones in thelower sand unit.
• Optimize well locations.• Eliminate the extraction and
subsequent treatment ofuncontaminated water from theupper sand/silt transition zone.
Eastern Plume AbovegroundTreatment Plant
If the UV-Ox system operates for atleast two more years, installmotorized valves to control flow toproper turbidity treatment systems.
• Increase in one time cost ofapproximately $4,500.
• Reduce system down time dueto changes in turbidity.
Eastern Plume AbovegroundTreatment Plant
Utilize existing precipitation system(not in use) to remove manganesefrom process stream.
• Increase potassiumpermanganate cost of $700 to$1000/year.
• Reduce effluent concentrationsof manganese to meet effluentrequirements.

Table 4-2. Eastern Plume Evaluation and Optimization Recommendations Summary (Continued)
Section 4
FIN
AL
NA
S Brunsw
ick RA
O (E
AST
ER
N PL
UM
E)
4-6January 2000
System Component Consideration Cost Impacts Effectiveness ImpactsEastern Plume AbovegroundTreatment Plant
Sample influent from individualwells for VOCs once a quarter.
• Increase analytical costs by$2,640/year.
• Determine the effectiveness ofeach individual well forremoval of contaminants fromthe subsurface.
Eastern Plume AbovegroundTreatment Plant
Negotiate a new NPDES permit toreduce effluent sampling frombi-weekly to monthly sampling.
• Decrease analytical costs by$1,800/year.
• None
Eastern Plume AbovegroundTreatment Plant
Discontinue VOC analysis of UV-Ox influent sample when landfilldewatering system is not inoperation, due to redundancy.
• Decrease analytical costs by$1,300/year when the landfillde-watering system is idle.
• None
Eastern Plume AbovegroundTreatment Plant
Renegotiate with the Brunswicksewer district to lower the $158,000annual sewer discharge fee.
• Unknown (up to$158,000/year)
• None
Eastern Plume AbovegroundTreatment Plant
Reduce current 2 person operatingteam to a part-time operator.
• Decrease in labor cost of$90,00 to $110,000/year.
• None
Eastern Plume AbovegroundTreatment Plant
Combine the landfill dewateringtreatment system with the EasternPlume groundwater treatmentsystem.
• Increase cost for addingpotassium permanganate of$3,000 to $6,000/year, whenlandfill dewatering is active.
• Costs savings from salvage orresale of idle equipment.
• Increase in metals treatmentrequired.
Eastern Plume AbovegroundTreatment Plant
Consider connecting the well headflow meters to the SCADA system.
• One time implementation cost(unknown).
• Provides accurate extractionwell flow rates.

Section 4 FINAL
NAS Brunswick RAO (EASTERN PLUME) 4-7 January 2000
• Pumps in existing well EW-2A and in all new extraction wells should bepositioned so that the intakes are located above the well screen in order tominimize water entrance velocity contributing to corrosion, incrustation, andsand pumping.
• The capacity of distribution piping from the extraction wells should be sizedand configured to adequately handle the pumping rate of the individual wells.
Replacing the original extraction wells with wells screened only in the lower sandunit will cost up to eighty thousand dollars. However, the performance of EW-2A isevidence of the improvement in capture and mass removal that can be expected whenwells are installed in hot spots within the lower sand unit. While pumping at the sameapproximate rate as each original extraction well, EW-2A has established a radius ofinfluence that is seven times greater than that measured at the original wells. Also, wellEW-2A is currently contributing 85 percent of the contaminant mass now being extractedby the P&T system. By isolating the extraction well network to the contaminated lowersand unit, performance of the P&T system will improve significantly and shorten the timeto clean up or initiate of passive remedies.
4.2.2 Monitoring Well Network—The steps outlined below should be implemented toimprove monitoring of the P&T system performance:
• Piezometers should be installed in the lower sand unit around the newextraction wells to monitor the capture zones established by them.
• At least one piezometer installed at each extraction well should monitor theupper sand/silt transition zone to assess the degree of leakage due to extractionwell pumping.
4.3 Eastern Plume Aboveground Treatment Train Recommendations
The current O&M contractor recently recommended modifying the Eastern Plumetreatment system by replacing the UV-Ox system with an air stripper followed by GACpolishing. The O&M contractor also suggested that discharge to surface water and/or togroundwater via infiltration galleries appears to be a more cost-effective approach thanthe current discharge method to the sanitary sewer. NAS Brunswick has indicated thatthese modifications will be implemented.
Additional recommendations on the proposed and existing treatment systems areorganized in the following subsections.
4.3.1 Recommendations for Groundwater Treatment at the Eastern Plume—Thefollowing are recommendations for the Eastern Plume aboveground treatment train as itexists now or following any future modifications. These recommendations may be

Section 4 FINAL
NAS Brunswick RAO (EASTERN PLUME) 4-8 January 2000
implemented regardless of any changes to the treatment system. These recommendationsare also summarized in Table 4-2.
• Sample the influent for VOCs from individual wells, once a quarterconcurrent with the groundwater monitoring program, to determine theremoval effectiveness of each well. This recommendation represents anannual cost increase of $2,640.
• Renegotiate a new NPDES permit that allows for effluent samples to becollected on a monthly basis during long-term operation. The past 4 years ofdata may be used to argue that the effluent data is consistent and the need forbi-weekly sampling is not warranted. This recommendation represents anannual cost savings of $1,800. Note that system changes to the treatment trainmay require more frequent sampling during prove out.
• Currently, the treatment plant that processes dewatering flow from landfillsites 1 and 3 is idle. If the groundwater level in the landfill rises in the future,dewatering will need to occur. Currently, there is excess capacity (35 gpm) ofthe Eastern Plume treatment plant. Any future flow from dewatering thelandfill is expected to be small (2 to 6 gpm) and can be redirected to theEastern Plume treatment plant. We recommend combining these two processstreams and selling or reusing the landfill sites 1 and 3 treatment plantequipment. This equipment is in very good condition and may be sold orsalvaged to other Department of Defense facilities. However, due to the highmetals content expected in any future landfill process stream, additionalpotassium permanganate will be required to precipitate metals (i.e., arsenic,iron, manganese, and lead) out of the process stream to meet effluentrequirements. Approximately 2 to 5 pounds of potassium permanganate perday would be needed when landfill dewatering is occurring. Based on effluentdischarge requirements, when the landfill is being dewatered, metals must beremoved from the process stream regardless of whether the process stream isdischarged to the sanitary sewer, groundwater, or surface water. (Refer toTable 4-3 for more information.) Approximate costs for adding potassiumpermanganate are $3,000 to $6,000 per year when the landfill dewateringsystem is running. However, these costs may be offset by the operations costsof the current landfill dewatering treatment system and any costs recoveredduring salvage or resale of the idle equipment.
• It is recommended that the extraction well head flow meters be connected tothe SCADA system. Actual implementation cost would be dependent upon thetransmitting capability of the existing flow meters and the SCADA system’savailability of inputs. Cost data on this recommendation is not currentlyavailable.
4.3.2 Considerations for Proposed Modifications of the Existing TreatmentTrain—The recommendation to replace the UV-Ox system with an air stripper (AS) andto select an alternative discharge method is appropriate. In addition, the followingcomments should be considered when evaluating these proposed modifications:

NA
S Brunsw
ick RA
O (E
AST
ER
N PL
UM
E)
4-9January 2000
Section 4
FIN
AL
Table 4-3. Treatment Required for Proposed Eastern Plume Effluent Discharge Options
UV-Oxidation Air Stripper
DischargeEastern PlumeInfluent only
Eastern Plumeand Landfill Influent
Eastern PlumeInfluent only
Eastern Plumeand Landfill Influent
Sewer Discharge 1) Occasional metalstreatment required tomeet dischargerequirements
2) Meets VOC dischargerequirements
1) Metals treatment required tomeet discharge requirements
2) Meets VOCs dischargelimits
1) Occasional metals treatmentrequired to meet sewerdischarge requirements
2) Meets VOCs discharge limits
1) Metals treatment required tomeet sewer dischargerequirements
2) Meets VOCs discharge limits3) No iron fouling expected
from combined flow.
Infiltration toGroundwater
Does not meet VOCdischarge requirements
Does not meet VOC dischargerequirements
1) Meets VOC dischargerequirements
2) Meets Federal MCL and StateMEG metals requirements.
1) Meets VOC dischargerequirements
2) Occasional metals treatment(for manganese) may berequired if effluent must meetFederal MCLs
3) No iron fouling expectedfrom combined flow.
Surface Discharge Does not meet VOCdischarge requirements
Does not meet VOC dischargerequirements
1) Meets VOC dischargerequirements, may need GACpolishing to meet state humanhealth criteria.
2) Occasional metals treatment(for manganese and lead) maybe required if effluent mustmeet Federal MCLs and StateHuman Health CriteriaAquatic Life Criteria
1) Meets VOC dischargerequirements, may need GACpolishing to meet statehuman health criteria.
2) Metals treatment (for arsenic,iron, manganese, and lead)may be required if effluentmust meet Federal MCLs,State Aquatic Criteria andState Human Health Criteria
3) No iron fouling expectedfrom combined flow.

Section 4 FINAL
NAS Brunswick RAO (EASTERN PLUME) 4-10 January 2000
• Total labor costs of $180,000 for all options presented in the EvaluationReport appear excessive.
1. Recommend reducing the greater than full time (48 hours per week)operator to a part time operator with the appropriate number of hoursreflected in the cost estimate for each type of remedial equipment beingconsidered. Each system will have different labor needs.
2. Reevaluate the estimate for support labor (20-30/week) for all of thetreatment systems; reduce and modify to make system specific.
3. Recommend defining support labor.
• The Maine Department of Environmental Protection (DEP) only requires airpermitting and best available control technologies (BACT) where VOCemissions would exceed 10 pounds/hour or 100 pounds/day. If vapor GAC isrequired, re-evaluate the need for a second blower prior to vapor GAC asshown in Figure 2-2 of the Evaluation Report.
• Based on the potential for fouling and the high turbidity water as mentioned inthe report, recommend installing filters prior to liquid GAC to remove fines<10 microns to avoid clogging liquid GAC.
• Cost of replacing filters may range from $5,000 to $25,000 annuallydepending on presence of fines, biofouling, and flow rates. Recommendadding to life cycle and capital costs.
• Recommend considering choosing the AS only option versus AS with liquidGAC (AS/GAC) if the groundwater infiltration or sewer discharge options arechosen. For mean concentrations at the higher flow rates, the total costs (lifecycle + capital) are lower for the AS than the AS/GAC. At lower flow ratesthe AS/GAC is only $7,000 (total cost) lower than AS. With the addition of$5,000 to $25,000 per year (not amortized) for filter replacement and the costof a plant operator for carbon change out, the AS/GAC exceeds the cost forAS under all flow and discharge scenarios.
• If AS/GAC is chosen, take note to monitor air stripper effluent as remediationcontinues. If the air stripper effluent decreases to below effluent standards,bypass liquid GAC to save expenses.
• Metals treatment may be required to meet surface discharge requirements andshould be addressed in the Evaluation Report. Refer to Section 4.4 for moreinformation.
4.3.3 Recommendations for Operation Using the Existing Treatment Train—Thefollowing are recommendations for the existing Eastern Plume aboveground treatmenttrain. These recommendations are provided in the event that the proposed modificationsabove are delayed or not implemented. These recommendations are also summarized inTable 4-2.

Section 4 FINAL
NAS Brunswick RAO (EASTERN PLUME) 4-11 January 2000
• If the UV-Ox systems will remain in place for at least 2 more years,recommend installing approximately five motorized valves controlled by thePLC and SCADA system to direct flow: (1) directly to the UV-Ox unit, (2)through the sand filters, or (3) to the clarifier depending on the turbidity. Thiswill reduce system downtime. This will represent a one time cost increase of$4,500.
• The effluent from the treatment plant has consistently exceeded the effluentrequirements for manganese. Recommend using the existing Eastern Plumeprecipitation system (currently not in use) to reduce metal concentrations inthe process stream. Approximately 0.6 pounds of potassium permanganate perday is needed when influent concentrations of manganese exceed 100 ug/L.Approximate costs for adding potassium permanganate is $700 to $1,000 peryear.
• The Eastern Plume influent sample and the UV-Ox influent sample areconsidered redundant when the Landfill dewatering system is idle.Recommend discontinuing VOC analysis of the UV-Ox influent sample whenthe Landfill dewatering system is not operating. This recommendationrepresents an annual cost savings of $1,300.
• The sewer discharge cost of approximately $158,000 annually is consideredexcessive. The sewer discharge fee should be renegotiated based on thefollowing:
1. Discharge fees charged by other local districts
2. Discharge fees for other NAS Brunswick sewer discharges
3. Discharge fees for other Brunswick Sewer District customers
• Currently, there are two full-time people supporting the operation of thegroundwater treatment plant. Renegotiate the contract to a part-time operatorwith some support. Reducing the labor costs will represent an annual costsavings of $90,000 to $110,000.
4.4 Additional Considerations for Groundwater Discharge
Three discharge options are being considered for discharge of the Eastern Plumetreatment plant effluent. These include: sanitary sewer (current discharge method),infiltration to groundwater, and surface discharge to a ditch. Possible dischargerequirements for each of these options may include the following:
• Sewer: Brunswick Sewer District Discharge Limits
• Infiltration to groundwater: Federal MCLs and State MEGs
• Discharge to surface water: State Aquatic Life Criteria, State Human HealthCriteria, Federal MCLs, and State MEGs

Section 4 FINAL
NAS Brunswick RAO (EASTERN PLUME) 4-12 January 2000
We have reviewed historical influent and effluent concentrations and possibledischarge requirements for several of the proposed process stream treatment scenarios.Note that by combining the landfill influent and Eastern Plume influent, several metalssuch as zinc and nickel are diluted to below all discharge requirements. Table 4-3summarizes the additional treatment that may be required for each of the dischargeoptions being considered.
In general, surface water discharge is considered more favorable than infiltrationfor several reasons. Infiltration systems may often lose their infiltration capacity, clog dueto fouling, are more difficult to maintain, and are dependent on the infiltration capacity ofthe subsurface. However, a cost analysis, a watershed study, an infiltration study, and adetailed review of the regulatory requirements must be performed prior to a finaldischarge decision. Also note that the discharge requirements for surface water are muchmore stringent than infiltration and sewer discharge.
4.5 Eastern Plume Recommendations Life-Cycle Costs
A life cycle cost analysis was conducted for each of the RAO optimizationrecommendations for the Eastern Plume system. In addition, the costs of continuingoperation “as is” and system shutdown leading to MNA are presented for respectivecomparison. The life cycle cost analysis provides a net present value (NPV) for costs orsavings incurred over the life of the operation. The NPV was calculated for operations of5, 10, and 15 years, assuming a 6 percent interest rate. Results of the life cycle costanalysis are presented in Table 4-4.

NA
S Brunsw
ick RA
O (E
AST
ER
N PL
UM
E)
4-13January 2000
Section 4
FIN
AL
Table 4-4. Life Cycle Cost Analysis for Eastern Plume System Recommendations
Annual Costs Net Present ValueRecommendations Material Labor Analytical Total 5 years 10 years 15 years
Continued operation of existing P&T as is $1.14M $4.8M $8.4M $11.1M
Implement MNA $10,000 $30,000 $10,000 $50,000 $210,618 $368,000 $485,612
Install motorized valves on UV-Ox system to control flowto proper turbidity treatment systems $4,500 $4,500 One time cost - no recurring impacts.
Use existing precipitation system to remove manganesefrom process stream $300 $300 $1,264 $2,208 $2,914
Sample influent from individual wells for VOCs quarterly $2,640 $2,640 $11,121 $19,431 $25,640
Negotiate a new NPDES permit to reduce effluentsampling from bi-weekly to monthly sampling. ($1,800) ($1,800) ($7,582) ($13,248) ($17,482)
Discontinue VOC analysis of UV-Ox influent samplewhen landfill dewatering system is not in operation, due toredundancy.
($1,300) ($1,300) ($5,476) ($9,568) ($12,626)
Renegotiate with the Brunswick sewer district to lower the$158,000 annual discharge fee. Unknown - up to $158,000/yr.
Reduce current two person operating team to a part-timeoperator ($90,000) ($90,000) ($379,113) ($662,408) ($874,102)
Combine landfill dewatering treatment system withEastern Plume treatment system* ($3,000) ($3,000) $12,637 $22,080 $29,137
Install two new extraction wells with three piezometers One time installation cost of $100,000, recurring annual costs difficult to quantify.
(Figures in parenthesis indicate cost savings)*Annual cost of landfill dewatering treatment system unavailable; therefore, life-cycle costs only reflect annual increase in potassium permanganate costs.Recommendation would also result in a net decrease of the operating cost and some salvage value.

Section 5 FINAL
NAS Brunswick RAO (EASTERN PLUME) 5-1 January 2000
5.0 DATA ANALYSIS, TREND EVALUATIONAND REPORTING
A review of the existing monitoring reports for the Eastern Plume P&T systemindicates that several steps may be taken to optimize the data analysis, trend evaluation, andreporting for the P&T system. The following recommendations will help improveunderstanding, decision making, and help optimize these remedial actions. Each of thefollowing items should be included in quarterly operations reports and/or included in theannual monitoring reports.
5.1 Performance Plots
It is recommended to plot the monthly operation and cost data on performance plotssimilar to those found in Section 3.0 (i.e., Figures 3-6 to 3-9). These plots will help visualizethe cost and performance trends for each system as well as help in making appropriateoptimizations and remedial strategy decisions. More explanation of these plots as they relateto the past performance at the Eastern Plume is included in Section 3.5. The recommendedperformance plots are:
• Influent VOC Concentrations vs. Time
• Cumulative Mass Recovered vs. Time
• Cumulative Costs vs. Cumulative VOCs Recovered
• Average Cost Per Pound Recovered vs. Time
5.2 Contaminant Tracking
By periodically tracking the migration of contaminants, the performance of theEastern Plume remedial action may be assessed. In addition, optimization decisions may bemade as the plume changes shape or stabilizes. GIS, along with other graphics packages, willincrease the visual impact of large amounts of data and will allow for data query to helpeasily track trends in plume and contaminant migration.
Secondly, plot contaminant plume contours for individual COCs. These plots willallow NAS Brunswick to assess how well the remedial action is addressing each contaminantcompared to their individual cleanup levels. These plots will allow NAS Brunswick to targetand optimize the remedial systems based on the most problematic COCs.

Section 5 FINAL
NAS Brunswick RAO (EASTERN PLUME) 5-2 January 2000
5.3 Operational and Performance Reporting
Currently, the monthly operations reports for the Eastern Plume contain the followingoperation and performance related items:
• A short summary of operations;
• A discussion and analysis of whether the effluent is meeting dischargerequirements (iron and manganese are not currently included);
• A table of performance monitoring analytical results;
• A table with daily flow, iron, manganese, pH, and turbidity measurements;
• A table summarizing the system downtime/repair actions; and
• A table with flow and operation time information.
Manganese and iron should be included when comparing the effluent results to effluentstandards in the monthly operations reports. In addition to the information already providedin the monthly reports, the following information should be included in quarterly operationreports:
• Performance plots as mentioned above;
• Summary of operations and maintenance costs including maintenance, repairs,capital improvements, and utility costs;
• Detailed operations and maintenance logs as an appendix;
• Discussion and analysis of system, plant, and extraction well performance; and
• Recommendations for system, plant, and extraction well optimization.
Presentation of this information will allow the NAS Brunswick team members to have abetter understanding of the performance of the P&T system. It will also help in identifyingproblematic operation and encourage optimization.

Section 6 FINAL
NAS Brunswick RAO (EASTERN PLUME) 6-1 January 2000
6.0 REFERENCES
ABB Environmental Services, Inc., 1993. Remedial Design Summary Report, Sites 1, 3, 5, 6,8, and the Eastern Plume, NAS Brunswick, Brunswick, Maine. May.
ABB Environmental Services, Inc., 1994. Final Long Term Monitoring Plan, Building 95,Sites 1 and 3 and the Eastern Plume. August.
ABB Environmental Services, Inc., 1998. Record of Decision for No Further Action atSites 4, 11, and 13 and a Remedial Action for the Eastern Plume, Naval Air Station,Brunswick, Maine. February.
Cohen et. al., 1994. Methods for Monitoring Pump and Treat Performance. EPA/600/R-94/123. June.
Department of the Navy, 1998. Technical Guidelines for Evaluating Monitored NaturalAttenuation at Naval and Marine Corps. Facilities. Draft-Revision 2. March.
EA Engineering, 1996a. 1996 Monthly Operations Reports. Groundwater Extraction andTreatment System, Building 50, Naval Air Station, Brunswick, Maine. June – December.
EA Engineering, 1996b. 1995 Annual Report Events 1 through 4 Sites 1 and 3 and EasternPlume, Naval Air Station, Brunswick, Maine. Final. July.
EA Engineering, 1997a. 1997 Monthly Operations Reports. Groundwater Extraction andTreatment System, Building 50, Naval Air Station, Brunswick, Maine. January – December.
EA Engineering, 1997b. 1996 Annual Report Events 5 through 7 Sites 1 and 3 and EasternPlume, Naval Air Station, Brunswick, Maine. Final. December.
EA Engineering, 1998. Geostatistical Assessment of the Eastern Plume, Naval Air Station,Brunswick, Maine. Draft. February.
EA Engineering, 1998a. 1998 Monthly Operations Reports. Groundwater Extraction andTreatment System, Building 50, Naval Air Station, Brunswick, Maine. January – December.
EA Engineering, 1998b. 1997 Annual Report Events 8 through 10 Sites 1 and 3 and EasternPlume, Naval Air Station, Brunswick, Maine. Draft. June.
EA Engineering, 1999a. 1999 Monthly Operations Reports. Groundwater Extraction andTreatment System, Building 50, Naval Air Station, Brunswick, Maine. January – May.
EA Engineering, 1999b. Summary of Monitoring Well Installation and Direct-Push Ground-Water Sampling Conducted 13-30 October 1998 at Sites 1 and 3 and the Eastern Plume,Naval Air Station, Brunswick, Maine. January.

Section 6 FINAL
NAS Brunswick RAO (EASTERN PLUME) 6-2 January 2000
EA Engineering, 1999c. Technical Engineering Evaluation Report for Ground-waterExtraction and Treatment System, Naval Air Station, Brunswick, Maine. 22 February.
EA Engineering, 1999d. 1998 Annual Report Events 11 through 13 Sites 1 and 3 andEastern Plume, Naval Air Station, Brunswick, Maine. Draft. May.
EA Engineering, 1999e. Monitoring Event 14 - April 1999 Sites 1 and 3 and Eastern Plume,Naval Air Station, Brunswick, Maine. June
E. C. Jordan, 1990. Draft Final Remedial Investigation Report, RI/FS Program, Naval AirStation Brunswick. August.
OHM, 1996. Remedial Action Final Report, Eastern Plume Remediation, Naval Air Station,Brunswick, Maine. July 22.
Strack, O.D.L., 1994. Modeling Capture Zones of Groundwater Well, Using AnalyticalElements. EPA/600/R-94/174.
Woodard & Curran, 1996. Operations and Maintenance Manual, Sites 1 & 3, Eastern PlumeGroundwater Extraction and Treatment System, Naval Air Station, Brunswick, Maine.January.

Appendix A FINAL
NAS Brunswick RAO (EASTERN PLUME) January 2000
APPENDIX A
EASTERN GROUNDWATER PLUMENAS BRUNSWICK RAO OPTIMIZATION CASE STUDY
PORE VOLUME AND EXTRACTION RATE CALCULATIONS

Appendix A FINAL
NAS Brunswick RAO (EASTERN PLUME) January 2000
Pore Volume Estimate
The volume of groundwater within a contaminant plume is the pore volume (PV) and isapproximated by
PV = BnA
where B is the average thickness of the plume (assume 15 feet in the lower sand unit), n is theporosity of the formation (assume 33% for the lower sand unit), and A is the area of the plume ateach lobe.
The number of pore volumes (NPV) extracted per year is approximated by
NPV = Q/PV
where Q is the total annual pumping rate.
Northern Lobe
PV = 15ft x 0.33 x 1,225,000ft2 x 7.48gal/ft3 = ~45 million gallons
Wells EW-4 and EW-5 were pumped at 26.6 gallons per minute in 1998. Therefore, Q =13,980,960 gallons per year (gpy)
NPV = 13,980,960 gpy/~45,000,000 gallons = ~0.3
Southern Lobe
PV = 15ft x 0.33 x 1,218,750ft2 x 7.48gal/ft3 = ~45 million gallons
Wells EW-1, EW-2, and EW-2A were pumped at 44.6 gallons per minute in 1998. Therefore, Q= 23,441,760 gpy
NPV = 23,441,760 gpy/~45,000,000 gallons = ~0.5