sipm research & development
DESCRIPTION
SiPM Research & Development. Teacher: Mark Kirzeder Student: Emily Lohr Advisors: Dr. Randi Ruchti Mr. Barry Bambaugh. What is a SiPM?. Sil icon P hoto M ultiplier A new generation of detection system. An alternative to traditional PMTs. SiPMs vs. PMTs. - PowerPoint PPT PresentationTRANSCRIPT

SiPM Research & Development
Teacher: Mark Kirzeder
Student: Emily Lohr
Advisors: Dr. Randi Ruchti
Mr. Barry Bambaugh

Silicon Photo Multiplier A new generation of detection system.
An alternative to traditional PMTs.
What is a SiPM?

SiPMs vs. PMTs Small Low voltage Relatively low cost Recoverability Signal consistency Unaffected by B field Single photon
counting ability Fast response time
Relatively Large High voltage Expensive Non-recoverable Inconsistent signals Affected by B fields Not as precise Slower response time

SiPM Signals
Individual photon counting ability Active area Inactive area

SiPM Drawbacks
Optical cross talk A signal from one pixel generates a signal
in an adjacent pixel High rates of noise

Objectives Quantify SiPM performance with respect
to Manufacturer: Sensl vs. Hamamatsu Number of pixels (active area) Size: 1mm (square) vs. 3mm (square) Bias Voltage Temperature
Determine best configuration for SiPM operation

Experimental Set Up

Experimental Devices
Hamamatsu device with
electronics for controlling bias
voltage
Sensl device with electronics for cooling and controlling bias voltage

Experimental Devices Sensl – Major Focus
1mm x 1mm square 35 micron x 35 micron square pixels
3mm x 3mm square 35 micron x 35 micron square pixels
Hamamatsu – Minor Focus 1mm x 1mm square
25 micron x 25 micron (1600 total pixels) 50 micron x 50 micron (400 total pixels)

Experimental Set Up SiPM Location Light Splitter
For future use when operating 2 SiPMs simultaneously
LED Red Pulsed at 50 kcps
Noise Study - Methods
SiPM turned on in the box without the LED
A counter was used to determine number of events that were above a given threshold
Temperatures were tested from +25 oC to -30 oC
Bias voltages were tested from 29.5V 31.5V
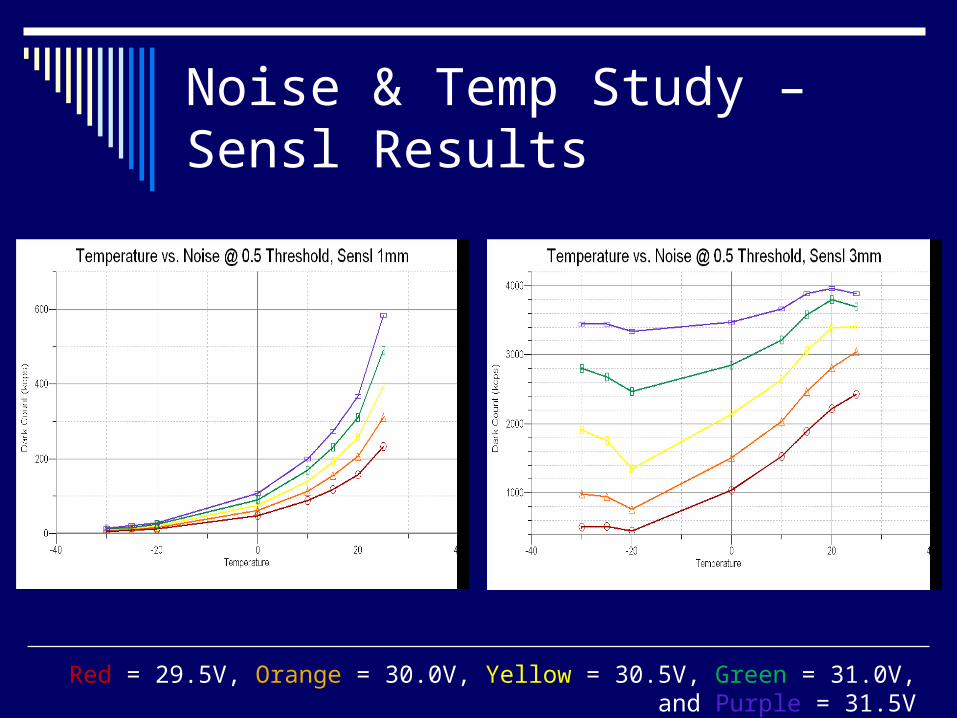
Noise & Temp Study – Sensl Results
Red = 29.5V, Orange = 30.0V, Yellow = 30.5V, Green = 31.0V, and Purple = 31.5V

Noise & Bias Study – Sensl Results
Red = +25C, Orange = +20C, Yellow = +10C, Green = 0C, L. Blue = -20C, D. Blue = -25C, and Purple = -30C
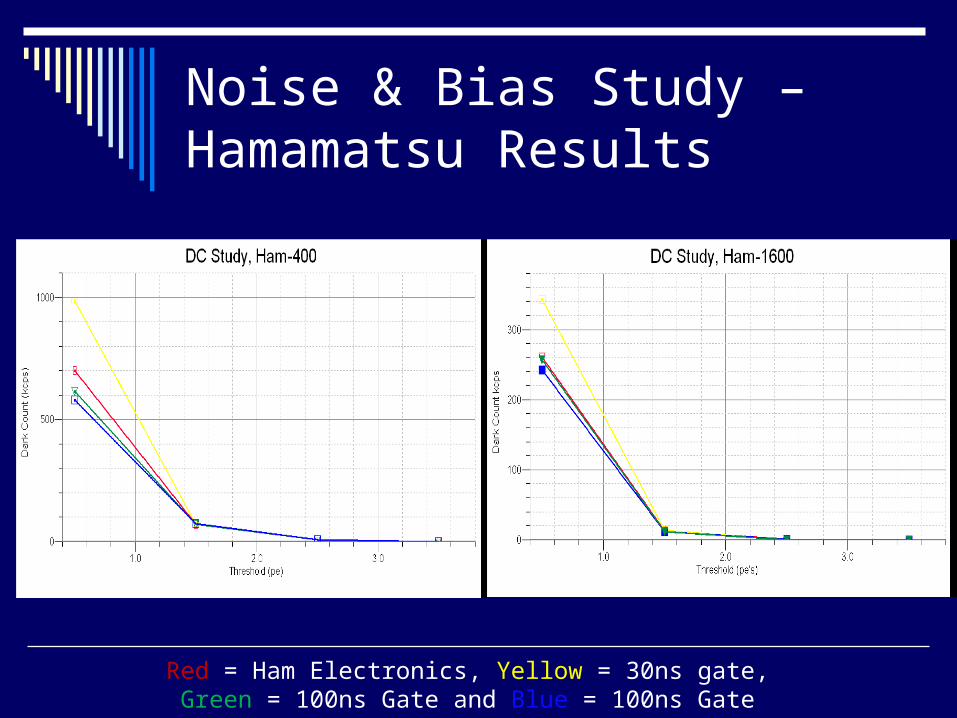
Noise & Bias Study – Hamamatsu Results
Red = Ham Electronics, Yellow = 30ns gate, Green = 100ns Gate and Blue = 100ns Gate

Conclusions 3mm Sensl Device
Noise was minimized at -20 oC A bias of 30.0 V allows for greatest
reduction of noise at -20 oC 1mm Sensl Device
Noise continued to decrease slightly at -25 oC and -30 oC, although it seems to plateau
A bias of 29.5 V allows for greatest reduction of noise at -30 oC
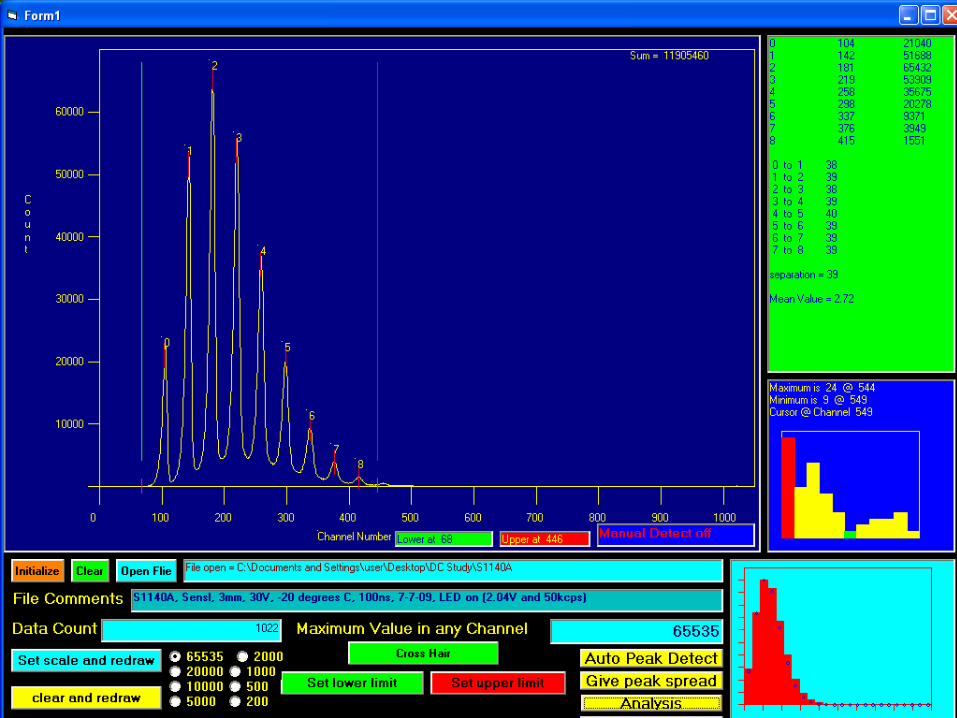
Signal Quality Study - Methods LED was used as the trigger Signals were read into a QVT from the
SiPM Data was then analyzed using a program
developed by Barry Bambaugh according to a Poisson Distribution Identified number of events Calculated the mean number of photons,
peak separation, and number of peaks.

Signal Quality Study - Methods
A desirable signal is one that has Large average number of photons Large peak separation Large number of peaks Low amount of noise
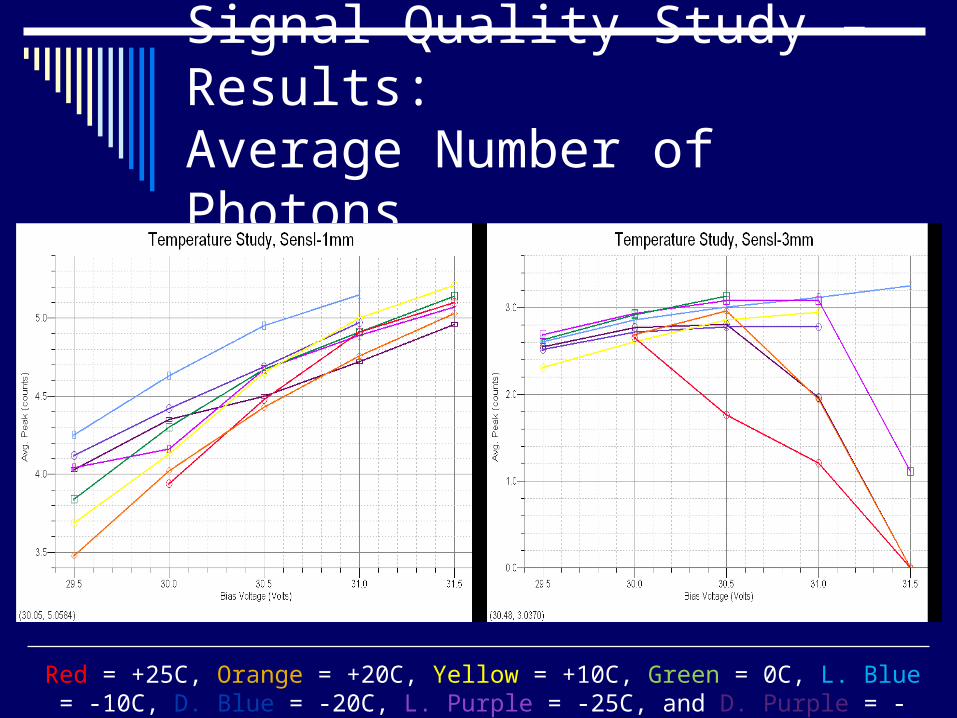
Signal Quality Study – Results:Average Number of Photons
Red = +25C, Orange = +20C, Yellow = +10C, Green = 0C, L. Blue = -10C, D. Blue = -20C, L. Purple = -25C, and D. Purple = -30C

Signal Quality Study – Results:Average Number of Photons
Red = 29.5V, Orange = 30.0V, Yellow = 30.5V, Green = 31.0V, and Blue = 31.5V

Conclusions 3mm Sensl Device
Little difference in photon detection (+/- 0.2) efficiency at all temperatures at 30.0V
Peak separation increases with increased bias
1mm Sensl Device Most photons detected at -10 oC Peak separation increases with increased
bias

Future Work
Exact operational conditions will depend on the application of the SiPM Noise can be reduce drastically with temp Efficiency can be increased with bias
Bias does affect noise
Operate two SiPMs simultaneously to verify that the LED is unchanged
Experiment with the Hamamatsu devices more thoroughly