sinusoidal rumble strip design optimization study
TRANSCRIPT

Edward Terhaar, Principal InvestigatorWenck Associates, Inc.
June 2016
Research ProjectFinal Report 2016-23
Sinusoidal Rumble Strip Design Optimization Study

To request this document in an alternative format call 651-366-4718 or 1-800-657-3774 (Greater Minnesota) or email your request to [email protected]. Please request at least one week in advance.

Technical Report Documentation Page 1. Report No. 2. 3. Recipients Accession No.MN/RC 2016-234. Title and Subtitle 5. Report DateSinusoidal Rumble Strip Design Optimization Study June 2016
6.
7. Author(s) 8. Performing Organization Report No.Edward Terhaar, David Braslau, Katie Fleming9. Performing Organization Name and Address 10. Project/Task/Work Unit No.
Wenck Associates, Inc. Katie Fleming 1800 Pioneer Creek Center Minnesota Department of Transportation Maple Plain, MN 55359 Traffic, Safety, & Technology
1500 West County Rd B-2 David Braslau Associates, Inc. Roseville, MN 55113 6603 Queen Ave. South Suite N Richfield, MN 55424
11. Contract (C) or Grant (G) No.
(c) 06806
12. Sponsoring Organization Name and Address 13. Type of Report and Period CoveredMinnesota Department of TransportationResearch Services & Library395 John Ireland Boulevard, MS 330St. Paul, Minnesota 55155-1899
Final Report14. Sponsoring Agency Code
15. Supplementary Noteshttp://www.lrrb.org/pdf/201623.pdf16. Abstract (Limit: 250 words)This Sinusoidal Rumble Strip Design Optimization Study presents results of sound level monitoring of four typesof centerline rumble strips installed along Trunk Highway (TH) 18 in Mille Lacs and Aitken counties in Minnesota.This study is in response to objections raised by some landowners about the unwanted noise caused by vehiclestraveling over rumble strips when they drift over the edge or centerline of the roadway. By changing andmodifying the design, the ultimate goal is to provide the maximum safety by capturing the driver’s attentionthrough in-vehicle generated sound levels while minimizing the associated external noise generated by the rumblestrips.
Tests on TH 18 were performed with three different vehicles – passenger car, pickup truck and a class 35 tandem dump truck. A single speed of 60 mph was used, as this was shown to provide the most meaningful data in the previous study. For each of the designs, an initial test was performed with vehicles traveling on normal pavement, followed by three passes on the rumble strip.
Rumble strip designs 1 and 4 created lower exterior sound level increases but created interior levels similar to designs 2 and 3. The external results correspond to the depth of the rumble strip design, with designs 1 and 4 having a maximum depth of 1/8 inch less than designs 2 and 3. The interior sound level increases are similar for all four designs but vary by vehicle type. All of the designs created increases greater than 10 dBA for the passenger car, which is a desirable level for gaining attention of the driver. For the pickup truck, the interior sound level increases ranged from 4.5 to 6.8 dBA, while the increases for the dump truck ranged from 0.8 to 2.7 dBA. 17. Document Analysis/Descriptors 18. Availability Statementrumble strips, road markings, design practices, noise control, trafficnoise, traffic safety
No restrictions. Document available from:National Technical Information Services,Alexandria, Virginia 22312
19. Security Class (this report) 20. Security Class (this page) 22. PriceUnclassified Unclassified
21. No. of Pages 103

Sinusoidal Rumble Strip Design Optimization Study
Final Report
Prepared by:
Edward Terhaar Wenck Associates, Inc.
David Braslau
David Braslau Associates, Inc.
Katie Fleming Minnesota Department of Transportation
June 2016
Published by:
Minnesota Department of Transportation Research Services & Library 395 Ireland Boulevard M330
St. Paul, MN 55155
This report represents the results of research conducted by the authors and does not necessarily represent the views or policies of the Minnesota Department of Transportation or Wenck Associates. This report does not contain a standard or specified technique. The authors, the Minnesota Department of Transportation, and Wenck Associates do not endorse products or manufacturers. Any trade or manufacturers’ names that may appear herein do so solely because they are considered essential to this report.

ACKNOWLEDGEMENTS
We would like to thank the following people and organizations for their generous help and support: Ken Johnson, Alan Rindels, Michelle Moser, Derek Leuer, and Jack Herndon of the Minnesota Department of Transportation (MnDOT), Diamond Surface, Inc., and Surface Preparation Technologies, Inc. The authors would also like to thank the following people and organizations for their assistance with this project: Jim Miles, Peter Buchen, Mark Vizecky, Larry Lucht, Jeff Morey, Ben Worel, Jeff Dows, John Holbert, Terry Kraemer, Andy McDeid, Al Adamek, Ted Ulven, Bernard Izevbekhai, Bill Pirkl, Chad Erickson, Mel Roseen, Michael Schweyen, Victor Lund, Will Stein, Rich Sanders, Alex Schieferdecker, and Caitlin Johnson.

Table of Contents
CHAPTER 1: INTRODUCTION ................................................................................................ 1 1.1 Introduction and Purpose of the Study ................................................................................. 1 1.2 Study Objectives ................................................................................................................... 1
CHAPTER 2: LITERATURE REVIEW.................................................................................... 2 CHAPTER 3: RUMBLE STRIP DESIGNS ............................................................................... 3
3.1 Initial Designs at MnROAD ................................................................................................. 3 3.2 Designs Installed on TH 18................................................................................................... 6
CHAPTER 4: IMPACTS ON NON-TRADITIONAL VEHICLES ....................................... 19 4.1 Motorcycle Testing Procedures .......................................................................................... 19 4.2 Motorcycle Testing Results ................................................................................................ 20
4.2.1 Statistical method ......................................................................................................... 20 4.2.2 Motorcycle riding experience ...................................................................................... 20 4.2.3 Motorcycle riders’ assessment of risk.......................................................................... 20 4.2.4 Findings........................................................................................................................ 22
4.3 Bicycle Testing Procedures ................................................................................................. 37 4.4 Bicycle Testing Results....................................................................................................... 37
CHAPTER 5: MONITORING PROGRAM ............................................................................ 38 5.1 Final Test Program for TH 18 ............................................................................................. 38 5.2 Vehicle Types and Interior Meter Location ........................................................................ 42
CHAPTER 6: TEST RESULTS ................................................................................................ 45 6.1 Overall Sound Level Results .............................................................................................. 46 6.2 Comparison of Interior Levels ............................................................................................ 47 6.3 Exterior and Interior Sound Levels ..................................................................................... 49 6.4 Increase in Exterior and Interior Sound Level .................................................................... 51 6.5 Exterior and Interior Sound Level Spectra ......................................................................... 53 6.6 Exterior Sound Level Decay with Distance ........................................................................ 57 6.7 Detectability of Rumble Strip Noise ................................................................................... 59
6.7.1 Ambient of Background Level ..................................................................................... 60 6.7.2 Determining the Detectability of an “Intruding” Sound .............................................. 61 6.7.3 Rumble Strip Detectability-Theoretical ....................................................................... 61
CHAPTER 7: STUDY CONCLUSIONS .................................................................................. 65 REFERENCES ............................................................................................................................ 67 GLOSSARY................................................................................................................................. 68 APPENDIX A APPENDIX B APPENDIX C APPENDIX D APPENDIX E

LIST OF FIGURES Figure 3.1. MnROAD Centerline Rumble Strips ............................................................................ 5 Figure 3.2. Rumble Strip Design 1 (14 inches wide, 1/16 – 3/8 inch depth) .................................. 9 Figure 3.3. Rumble Strip Design 2 (Two 8 inch wide strips 4 inches apart, 1/16 – ½ inch depth)....................................................................................................................................................... 12 Figure 3.4. Rumble Strip Design 3 (14 inches wide, 1/16 – 1/2 inch depth) ................................ 15 Figure 3.5. Rumble Strip Design 4 (Two 8 inch wide strips 4 inches apart, 1/16 – 3/8 inch depth)....................................................................................................................................................... 18 Figure 4.1: Participants Level of Agreement by Theme and Question Test Strip One ................ 23 Figure 4.2: Participants Level of Agreement by Theme and Question Test Strip Two ................ 25 Figure 4.3: Participants Level of Agreement by Theme and Question Test Strip Three .............. 27 Figure 4.4: Participants Level of Agreement by Theme and Question Test Strip Four ............... 29 Figure 4.5: Participants Level of Agreement by Theme and Question Test Strip Five ................ 31 Figure 4.6: Participants Level of Agreement by Theme and Question Test Strip Six .................. 33 Figure 4.7: Participants Level of Agreement by Theme and Question Test Strip Seven ............. 35 Figure 5.1 Test Area for Rumble Strips ........................................................................................ 38 Figure 5.2 TH 18 Typical Corridor View ..................................................................................... 39 Figure 5.3 Locations of Centerline Rumble Strips ....................................................................... 40 Figure 5.4 Location of Sound Level Meters and Video Camera .................................................. 41 Figure 5.5 Passenger Car Used in Tests ........................................................................................ 42 Figure 5.6 Location of Sound Level Meter in the Passenger Car ................................................. 42 Figure 5.7 Pickup Used in Tests ................................................................................................... 43 Figure 5.8 Dump Truck Used in the Tests .................................................................................... 44 Figure 5.9 Location of Sound Level Meter in the Dump Truck ................................................... 44 Figure 6.1 Exterior LAeq at 50 feet .............................................................................................. 46 Figure 6.2 Interior LAeq Levels ................................................................................................... 47 Figure 6.3 Car – Interior Sound Levels ........................................................................................ 48 Figure 6.4 Pickup – Interior Sound Levels ................................................................................... 48 Figure 6.5 Truck – Interior Sound Levels ..................................................................................... 49 Figure 6.6 Exterior and Interior Sound Levels with the Car ......................................................... 50 Figure 6.7 Exterior and Interior Sound Levels with the Pickup ................................................... 50 Figure 6.8 Exterior and Interior Sound Levels with the Truck ..................................................... 51 Figure 6.9 Cartesian Plot of Interior vs Exterior Sound Level Increase in the Car ...................... 52 Figure 6.10 Cartesian Plot of Interior vs Exterior Sound Level Increase in the Pickup ............... 52 Figure 6.11 Cartesian Plot of Interior vs Exterior Sound Level Increase in the Truck ................ 53 Figure 6.12 Sound Level Spectra a 50 feet of Car Pass-by .......................................................... 54 Figure 6.13 Sound Level Spectra a 50 feet of Pickup Pass-by ..................................................... 54 Figure 6.14 Sound Level Spectra at 50 ft of Truck Pass-by ......................................................... 55 Figure 6.15 Sound Level Spectra a (L10) Inside the Car ............................................................. 56 Figure 6.16 Sound Level Spectra a (L10) Inside the Pickup ........................................................ 56 Figure 6.17 Sound Level Spectra a (L10) Inside the Truck .......................................................... 57 Figure 6.18 Decay of Sound with Distance – Car ........................................................................ 58 Figure 6.19 Decay of Sound with Distance – Pickup ................................................................... 58 Figure 6.20 Decay of Sound with Distance – Truck ..................................................................... 59

Figure 6.21 Some Typical Quiet Ambient Background Spectra .................................................. 60 Figure 6.22 Example of Determining Detectability ...................................................................... 61 Figure 6.23 Theoretical Detectability of a Passenger Car ............................................................ 62 Figure 6.24 Theoretical Detectability of a Passenger Car with a Minnesota Strip ....................... 62 Figure 6.25 Theoretical Detectability of a Pickup ........................................................................ 63 Figure 6.26 Theoretical Detectability of a Truck .......................................................................... 64
LIST OF TABLES
Table 4.1: Consecutive years of riding experience ....................................................................... 20 Table 4.2: Themes from PCA of Test Strip One .......................................................................... 22 Table 4.3: Themes from PCA of Test Strip Two .......................................................................... 23 Table 4.4: Themes from PCA of Test Strip Three ........................................................................ 26 Table 4.5: Themes from PCA of Test Strip Four.......................................................................... 27 Table 4.6: Themes from PCA of Test Strip Five .......................................................................... 29 Table 4.7: Themes from PCA of Test Strip Six ............................................................................ 31 Table 4.8: Themes from PCA of Test Strip Seven ....................................................................... 34 Table 4.9: Percentage of Participants’ Favorability by Theme and Rumble Strip Design ........... 36 Table 7.1: Increase (dBA) over No-Strip for Rumble Strip Designs ............................................ 65

EXECUTIVE SUMMARY
This Sinusoidal Rumble Strip Design Optimization Study presents results of sound level monitoring of four types of centerline rumble strips installed along Trunk Highway (TH) 18 in Mille Lacs and Aitken counties in Minnesota. This study follows an extensive study that compared three alternative longitudinal edge line rumble strips along the edge of two roadways in Polk County, Minnesota, sponsored by the Minnesota Local Road Research Board.
These studies are in response to objections raised by some landowners about the unwanted noise caused by vehicles traveling over rumble strips when they drift over the edge or centerline of the roadway. By changing and modifying the design, the ultimate goal is to provide the maximum safety by capturing the driver’s attention through in-vehicle generated sound levels while minimizing the associated external noise generated by the rumble strips.
All four of the centerline rumble strips evaluated in this report were a 14 inch wavelength sinusoidal design but with different geometric configurations. A single strip 14 inches wide and a double strip of two 8 inch wide strips spaced 4 inches apart were tested, each with two different depths – 3/8 inch and 1/2 inch.
An evaluation of motorcycles and bicycles was carried out at the MnROAD facility near Albertville, Minnesota, to determine how various rumble strip configurations affected rider performance. An overall summary of the survey data indicates a preference for rumble strip designs which were 14 inches wide with a maximum depth of 3/8 inch. Designs with two strips spaced 4 inches apart were the least desirable, according to the motorcyclist evaluations due to the raised section located between the two rumble strips.
Tests on TH 18 were performed with three different vehicles – passenger car, pickup truck and a class 35 tandem dump truck. A single speed of 60 mph was used, as this was shown to provide the most meaningful data in the previous study. For each of the designs, an initial test was performed with vehicles traveling on normal pavement, followed by three passes on the rumble strip.
One-third octave band sound levels were taken 50 feet and 75 feet from the edge of the roadway, as well as inside the vehicle adjacent to the driver. Video recordings were taken 50 feet from the edge of the roadway. Digital audio recordings were captured for each of the sound level readings. The maximum observed pass-by level is used here for the comparative analysis.
Observed interior and exterior sound levels were generally similar to the California strip tested in the previous study at 60 mph, but there were measurable variations between the four different designs. The shallower strips increased the interior sound level, not greatly different from the deeper strips, but generated slightly lower sound levels measured 50 and 75 feet from the highway centerline.
Rumble strip designs 1 and 4 created lower exterior sound level increases but created interior levels similar to designs 2 and 3. The external results correspond to the depth of the rumble strip
design, with designs 1 and 4 having a maximum depth of 1/8 inch less than designs 2 and 3. The interior sound level increases are similar for all four designs but vary by vehicle type. All of the designs created increases greater than 10 dBA for the passenger car, which is a desirable level for gaining attention of the driver. For the pickup truck, the interior sound level increases ranged from 4.5 to 6.8 dBA, while the increases for the dump truck ranged from 0.8 to 2.7 dBA.
As in the earlier study, estimates of sound level with distance from the roadway were made using a typical outdoor sound propagation model, using one-third octave band source levels taken from the maximum pass-by levels at 50 feet. These were then compared with the background sound level spectrum measured in Polk County, which is representative of rural areas near two-lane roadways. Using the concept of sound detectability developed originally for the Army Tank Automotive Command in the early 1970s, the detectability of the rumble strips was calculated. “Detectability” level is normally lower than “audibility” level since it is associated with actively listening for a sound compared with passively hearing a sound. For example, in a restaurant, one can hear people at the next table but not pay much attention to what is being said. This can be called “passive” hearing. On the other hand, when one tries to understand carefully what is being said at the next table, this can be called “active” listening.
For the passenger car, all four of the sinusoidal designs created less exterior sound levels than the standard Minnesota rumble strip design. Theoretical detectability of the no-strip and Strip 4 sound level with a car extends out to about 2,000 feet. With the pickup Strip 4 is detectable up to 2,500 feet. Sound from the truck with no rumble strip can be detectable at more than 3,000 feet, with sound from the rumble strips heard at slightly farther distances. As described in the previous study in Polk County, Minnesota, the detectability distance for the standard Minnesota rumble strip design was well over 3000 feet.
In summary, it is the authors’ opinion that Rumble Strip Design 3 (14 inches wide, 1/16 – 1/2 inch depth) be considered for further implementation by MnDOT. While all of the sinusoidal designs provided adequate driver feedback and minimal exterior noise for passenger cars, Design 3 also gave good results for pickup trucks. This is important because pickup trucks make up a significant portion of the vehicle fleet. The single 14 inch wide strip of Design 3 was also more desirable for motorcycle riders compared to the double 8 inch strips of Designs 2 and 4. Additional feedback from motorcycle riders should be obtained for this design since the rumble strips installed at MnROAD were less than ½ inch in depth. In areas where there is extreme sensitivity to external noise, Rumble Strip Design 1 (14 inches wide, 1/16 – 3/8 inch depth) would be an acceptable alternate design.

1
CHAPTER 1: INTRODUCTION
1.1 Introduction and Purpose of the Study
This Sinusoidal Rumble Strip Design Optimization Study presents results of sound level monitoring of four alternative sinusoidal designs of centerline rumble strips installed along Trunk Highway 18 in Mille Lacs and Aitken counties in Minnesota, USA.
This study follows a previous study which compared three alternative longitudinal rumble strips along the edge of two roadways in Polk County, Minnesota.[1] These studies are in response to objections raised by some landowners about the unwanted noise caused by vehicles traveling over rumble strips when they drift over the edge or centerline of the roadway. By changing and modifying the design, the ultimate goal is to provide the maximum safety by capturing the driver’s attention through in-vehicle generated sound levels while minimizing the associated external noise generated by the rumble strips.
The purpose of this study is to provide guidance to engineers in the selection and use of centerline rumble strips that will generate the least external noise on adjacent land uses while maximizing the sound level at the driver. The ultimate goal is to provide the optimal safety by capturing the driver’s attention through sound levels and vibratory response while minimizing the associated external noise generated by the rumble strips. This study focused on the sound level impacts and did not include vibratory response because this was not found to be a critical factor in the extensive research literature reviewed.
1.2 Study Objectives
Collection of the most relevant data and information on external and internal noise generated by travel over rumble strips is the primary objective of the study. This includes collection of external sound level data as one-third octave bands that can be used to characterize the “quality” and perception of rumble strip noise. These data can then be used to predict how rumble strip sound levels decay with distance and ultimately how far from the roadway rumble strip sound can be audible, which is a one objective of this study. This also includes collection of internal noise at the driver position to provide a basis for comparing relative differences between internal and external sound levels for different rumble strips and vehicles.
Simultaneous collection of digital audio recordings with sound level data can provide the opportunity for persons other than the driver and the sound level monitoring technicians to experience these sound levels. A list of available audio files is provided in Appendix D for those who would like to experience the results of these tests. Different vehicle types provide a range of data for evaluation. By choosing three different vehicle types (passenger car, pickup truck, and heavy maintenance truck), the effectiveness of rumble strips was tested for both the driver and the adjacent landowners. A single speed of 60 mph was used, as this was shown to provide the most meaningful data in the previous study.[1] For each of the designs, an initial test was performed with vehicles traveling on normal pavement, followed by three passes on the rumble strip.

2
CHAPTER 2: LITERATURE REVIEW
This chapter summarizes three recent studies that appeared after the earlier rumble strip study was completed and supplements the literature reviewed in that report.[1] Summaries of the four investigations are included below. Detailed excerpts from these studies are included and discussed in Appendix B. Some observations and comments on the studies are presented here.
The most recent paper dated June 2015, appearing in the Society of Automotive Engineers Journal, concluded that longer wavelength strips reduce exterior noise while not reducing interior noise.[2] This is consistent with findings of the previous rumble strip study. The recent study concluded that the interior noise and steering column responses were strongly influenced by vehicle-specific characteristics both in terms of isolation and modal response. Our previous and current tests show relatively consistent sound levels for different configurations of sinusoidal rumble strips with the same wavelength. Variability in steering wheel vibration has been identified in other studies but has not been correlated with exterior sound levels. For this reason vibration levels were not considered in the current study.
The next paper dated October 2014 from the Swedish National Road and Transport Research Institute evaluated sound, vibration and road wear from “intermittent” and “sinusoidal” centerline rumble strips.[3] The study concluded that sinusoidal strips were preferable for reducing exterior noise as long as the interior sound level was sufficient to alert drivers. Findings from our previous study showed this to be the case. It was felt that vibration can also play a role in alerting drivers, but again there was no detailed analysis relating interior vibration levels to exterior sound levels.
The third paper from the Washington State Department of Transportation dated September 2014 evaluated seven different rumble strip designs at nine locations with extensive 1/3 octave band sound level analysis.[4] They concluded that rectangular indentations generate significantly higher sound levels than sinusoidal strips which was the similar finding in our previous study. However, they found a dominant frequency at 800 Hz which is quite different from the twin 80Hz and 160Hz peak observed with the California 14 inch wavelength sinusoidal strip tested in our previous study. Their recommendation included a strip wave length of only 8 inches with a depth of 3/8 inch to ½ inch.
3
CHAPTER 3: RUMBLE STRIP DESIGNS
This chapter describes the rumble strip designs that were tested in this study.
3.1 Initial Designs at MnROAD
The rumble strip design process began with the installation of six sinusoidal and one non-sinusoidal centerline rumble strips at MnROAD. MnROAD is a pavement test track made up of various research materials and pavements owned and operated by the Minnesota Department of Transportation and located near Albertville, MN.
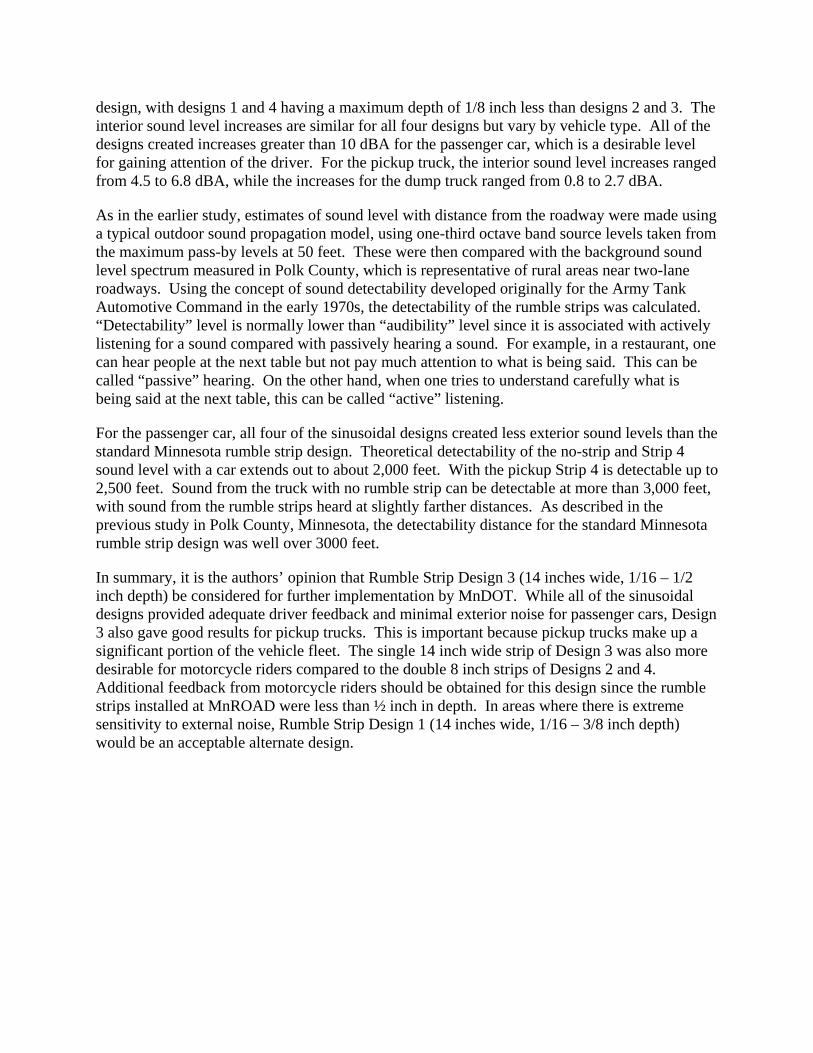
The details for each rumble strip design are shown below, with a photo of each rumble strip shown in Figure 3.1
Design 1 • Sinusoidal with tapered edge • 16 inch center to center wavelength • 14 inches wide • 1/16 - 3/8 inch depth
Design 2 • Sinusoidal with straight edge • 16 inch center to center wavelength • 14 inches wide • 1/16 - 3/8 inch depth
Design 3 • Sinusoidal with straight edge • 16 inch center to center wavelength • Two 8 inch wide strips located 4 inches
apart • 1/16 - 3/8 inch depth
Design 4 • Non-sinusoidal with straight edge • 12 inches center to center • 14 inches wide • 3/8 inch depth
Design 5 • Sinusoidal with tapered edge • 14 inch center to center wavelength • 14 inches wide • 1/16 - 3/8 inch depth
Design 6 • Sinusoidal with straight edge • 14 inch center to center wavelength • 14 inches wide • 1/16 - 3/8 inch depth
Design 7 • Sinusoidal with straight edge • 14 inch center to center wavelength • Two 6 inch wide strips located 4 inches
apart • 1/16 - 3/8 inch depth

4
Design 1 Design 2
Design 4 Design 5 Design 3

5
Design 7 Design 6
Figure 3.1. MnROAD Centerline Rumble Strips

6
3.2 Designs Installed on TH 18
After the installation at MnROAD, the Technical Advisory Panel (TAP) met at the site to determine which rumble strips to install in the field for further testing. Through this discussion it was decided to focus on the 14 inch wavelength for both the single 14 inch wide (Design 6) and two 8 inch wide strip designs (Design 7). In addition, it was decided to include two designs that were slightly deeper at the lower point of the sinusoidal wave pattern.
The detail for each design installed in the field is shown below.
Design 1 • Sinusoidal with straight edge • 14 inch center to center wavelength • 14 inches wide • 1/16 - 3/8 inch depth
Design 2 • Sinusoidal with straight edge • 14 inch center to center wavelength • Two 8 inch wide rumble strips separated by 4 inches • 1/16 – 1/2 inch depth
Design 3 • Sinusoidal with straight edge • 14 inch center to center wavelength • 14 inches wide • 1/16 – 1/2 inch depth
Design 4 • Sinusoidal with straight edge • 14” center to center wavelength • Two 8 inch wide rumble strips separated by 4 inches • 1/16 – 3/8 inch depth
A close-up photograph of each design and a road perspective are shown in Figures 3.2 to 3.5.

7

8

9
Figure 3.2. Rumble Strip Design 1 (14 inches wide, 1/16 – 3/8 inch depth)

10

11

12
Figure 3.3. Rumble Strip Design 2 (Two 8 inch wide strips 4 inches apart, 1/16 – ½ inch depth)

13

14

15
Figure 3.4. Rumble Strip Design 3 (14 inches wide, 1/16 – 1/2 inch depth)

16

17

18
Figure 3.5. Rumble Strip Design 4 (Two 8 inch wide strips 4 inches apart, 1/16 – 3/8 inch depth)

19
CHAPTER 4: IMPACTS ON NON-TRADITIONAL VEHICLES
The potential impact on non-traditional vehicles (motorcycles and bicycles) was evaluated through observations of driver reaction at MnROAD. MnROAD is a pavement test track made up of various research materials and pavements owned and operated by the Minnesota Department of Transportation and located near Albertville, MN. The seven rumble strip designs described in Chapter 3, with the addition of the standard non-sinusoidal MnDOT design, were used for the evaluation.
4.1 Motorcycle Testing Procedures
Three groups of motorcycle riders were used for the evaluation. All riders were volunteers who used their privately owned motorcycle. A wide range of motorcycle types were represented in the evaluation. All motorcycles used in the tested were legally registered in the state of Minnesota.
Motorcycle testing occurred on the following dates:
• September 14, 2015 – 34 riders evaluated • October 13, 2015 – 5 riders evaluated • October 24, 2015 – 13 riders evaluated
On all of the testing dates, the test track and rumble strips were dry, with good driving conditions.
The test day consisted of an initial introduction meeting, which included the completion of a waiver form for each rider. The testing procedure was explained to the riders. A rider evaluation survey specific to this study was developed by MnDOT staff. The survey was divided into two sections: Pre-participation and Post-participation. The Pre-Participation portion was completed by each rider prior to riding on the test track, with the purpose of identifying preexisting knowledge of rumble strips and impacts to motorcycle riders. The full survey is shown in Appendix E.
Each participant rode on the test track and traversed all of the rumble strip designs. Riders were allowed to drive the test track as many times as they felt necessary to give adequate feedback. After riding on the track and all of the rumble strips, each rider returned to the classroom and completed the Post-Participation survey. The testing procedures were designed to allow for unbiased rider feedback in order to ensure none of the designs received preferential treatment. The survey data were analyzed to identify themes and clusters within the data.

20
4.2 Motorcycle Testing Results
4.2.1 Statistical method
In order to best understand the underlying themes or factors within the data, these data were analyzed using a Principal Component Analysis (PCA) (Mertler, 2011) with a Varimax rotation. Principal Component Analysis allows the researcher to reduce large amounts of data and identify underlying relationships between variables. This type of analysis allows the researcher to view the data from multiple angles in order to identify less obvious relationships between variables.
Our analyses revealed up to three themes: comfort, control, and function, derived from a total of 11 Likert Scale questions. In order to fit the criteria and assumptions of PCA methodology, some questions were removed from the analyses.
4.2.2 Motorcycle riding experience
Fifty-two participants contributed survey data. The sample included five females and 46 males (one participant chose not to indicate their sex in the survey). Most riders reported more than 20 years of experience riding motorcycles.
Table 4.1: Consecutive years of riding experience
Number of years of experience riding a motorcycle
Frequency
N=52
M=36.1
Percent
<= 10 years 5 9.6
11-20 Years 7 13.5
21-30 Years 6 11.5
31-40 Years 9 17.3
41-50 Years 20 38.5
51-60 Years 4 7.7
61+ Years 1 1.9
4.2.3 Motorcycle riders’ assessment of risk
The survey included questions about riders’ perception of risk on the roadway and high risk behaviors of other drivers. Ninety-seven percent of motorcyclists viewed sand or gravel on the roadway as high risk. Eighty-three percent of participants view distracted driving as high risk behavior. However, only 17% of motorcycle riders identified speeding as high risk behavior.

21
This is somewhat troubling because speeding plays a key role in the risk of injury and death in motorcycle crashes (Fleming, 2015).
Most participants reported a favorable view of centerline and edge line rumble strips and demonstrated a high level of understanding of how rumble strips work. Only 2% of participants viewed edge line rumble strips as risky and 9.6% viewed centerline rumble strips as high risk roadway features.

22
4.2.4 Findings
Each test strip was analyzed independently. Results for each strip are described below.
4.2.4.1 Test strip one
The Varimax rotation offered no statistical benefit, therefore the initial component analysis was selected. The first theme, comfort and control accounted for 38.1% of the variance, and the second theme, function, accounted for 22.0% of the variance. For test strip one, two persistent underlying themes emerged: comfort/control and function. This tells us that for test strip one, specific questions best serve as a measure for each theme.
Table 4.2: Themes from PCA of Test Strip One
Components (Themes) Loading1
Theme 1: Comfort/Control
I had no trouble steering as I crossed the RS* .820
I felt comfortable crossing this rumble strip .797
I was able to control my MC as I crossed this RS .741
Other MC riders will have no trouble controlling their MC as they cross this RS** .663
Other MC riders would feel comfortable crossing this rumble strip .635
My MC did not lose traction as I crossed the RS*** .581
Theme2: Function
The vibration of the RS would sufficiently alert other MC riders when they drift out of a lane .921
The RS created enough vibration to get my attention .900
1 Principal component loading values indicate the degree to which each question loads onto a specified theme. Values closer to one indicate a stronger contribution to the theme and values closer to zero indicate a weaker contribution to the theme.
Note: RS represents rumble strip and MC represents motorcycle
* The original question was “I had trouble steering as I crossed this rumble strip.”
** The original question was “Other MC riders may have trouble controlling their bikes when they cross this rumbles strip.” This question was reverse coded for analyses.
*** The original question was “My MC lost traction as I crossed the rumble strip.” This question was reverse coded for analyses.
Figure 4.1 shows the levels of participant agreement with the corresponding statements about their experience with test strip one. This graph shows only questions associated with each theme found through the Principal Component Analysis. Participants indicated low levels of agreement for “Other motorcycle riders would feel comfortable crossing this rumble strip.” Generally, participants reported very little agreement within the function questions.

23
*The original survey question was reverse coded for analyses. For clarity, this question is displayed differently than as it appears in the survey.
4.2.4.2 Test strip two
Using data associated with test strip two, a factor analysis with Varimax rotation was conducted. This analysis revealed three themes: comfort, function, and control. The first theme, comfort accounted for 28.1% of the variance, the second theme, function, accounted for 23.8% of the variance, and the final theme, control accounted for 22.3% of the variance. This analysis tells us that for test strip two, specific questions best serve as a measure for each theme.
Table 4.3: Themes from PCA of Test Strip Two
Components (Themes) Loading
Theme 1: Comfort
Other MC riders would feel comfortable crossing this rumble strip .848
Other MC riders will have no trouble controlling their MC as they cross this RS* .791
I felt comfortable crossing this rumble strip .674
67.3%
84.6%
88.5%
26.9%
51.9%
73.1%
42.3%
42.3%
23.1%
11.5%
11.5%
51.9%
44.2%
23.1%
48.1%
48.1%
I had trouble steering as I crossed the rumble strip*
I felt comfortable crossing this rumble strip
I was able to control my bike as I crossed therumble strip
Other motorcycle riders will have no troublecontrolling their bikes when they cross this…
Other motorcycle riders would feel comfortablecrossing this rumble strip
My bike did not lose traction as I crossed therumble strip*
The vibration of this rumble strip would sufficientlyalert other motorcycle riders when they drift out…
The vibration of this rumble strip would sufficientlyalert other motorcycle riders when they drift out…
Com
fort
/Con
trol
Func
tion
Agree Neutral Disagree
Figure 4.1: Participants Level of Agreement by Theme and Question Test Strip One

24
Theme2: Function
The vibration of the RS would sufficiently alert other MC riders when they drift out of a lane .947
The RS created enough vibration to get my attention .935
Theme 3: Control
I was able to control my MC as I crossed this RS .800
My MC did not lose traction as I crossed the RS** .794
I had no trouble steering as I crossed the RS*** .649
Note: RS represents rumble strip and MC represents motorcycle
*The original question was “Other MC riders may have trouble controlling their bikes when they cross this rumbles strip.” This question was reverse coded for analyses.
**The original question was “My MC lost traction as I crossed the rumble strip.” This question was reverse coded for analyses.
*** The original question was “I had trouble steering as I crossed this rumble strip.” This question was reverse coded for analyses.
Figure 4.2 shows the levels of participant agreement with the corresponding statements about their experience with test strip two. This graph shows only questions associated with each theme found through the Principal Component Analysis. Participants indicated low levels of agreement for questions in the Function Theme. Generally, participants reported very high agreement within the Control Theme questions and reported high levels of agreement with their level of comfort while crossing this rumble strip.

25
Figure 4.2: Participants Level of Agreement by Theme and Question Test Strip Two
*The original survey question was reverse coded for analyses. For clarity, this question is displayed differently than as it appears in the survey.
50.0%
30.8%
80.8%
44.2%
48.1%
92.3%
73.1%
65.4%
46.2%
55.8%
17.3%
42.3%
36.5%
7.7%
23.1%
26.9%
Other motorcycle riders would feel comfortablecrossing this rumble strip
Other motorcycle riders will have no troublecontrolling their bikes when they cross this rumble
strip*
I felt comfortable crossing this rumble strip
The vibration of this rumble strip would sufficientlyalert other motorcycle riders when they drift out of
their lane.
The rumble strip created enough vibration to get myattention
I was able to control my bike as I crossed the rumblestrip
My bike did not lose traction as I crossed the rumblestrip*
I had no trouble steering as I crossed the rumble strip*
Com
fort
Func
tion
Cont
rol
Agree Neutral Disagree

26
4.2.4.3 Test strip three
Using data associated with test strip three, a factor analysis with Varimax rotation was conducted. This analysis revealed two themes: comfort and control and function. The first theme, comfort and control accounted for 46.0% of the variance, and the second theme, function, accounted for 22.3% of the variance. This analysis tells us that, for test strip three, specific questions best serve as a measure for each theme.
Table 4.4: Themes from PCA of Test Strip Three
Components (Themes) Loading
Theme 1: Comfort/Control
I had no trouble steering as I crossed the RS* .889
I felt comfortable crossing this rumble strip .857
I was able to control my MC as I crossed this RS .786
Other MC riders would feel comfortable crossing this rumble strip .785
Other MC riders will have no trouble controlling their MC as they cross this RS** .781
My MC did not lose traction as I crossed the RS*** .547
Theme2: Function
The vibration of the RS would sufficiently alert other MC riders when they drift out of a lane .933
The RS created enough vibration to get my attention .905
Note: RS represents rumble strip and MC represents motorcycle
* The original question was “I had trouble steering as I crossed this rumble strip.”
**The original question was “Other MC riders may have trouble controlling their bikes when they cross this rumbles strip.” This question was reverse coded for analyses.
***The original question was “My MC lost traction as I crossed the rumble strip.” This question was reverse coded for analyses.
Figure 4.3 shows the levels of participant agreement with the corresponding statements about their experience with test strip three. This graph shows only questions associated with each theme found through the Principal Component Analysis. Participants indicated high levels of agreement with their ability to steer across the rumble strip, comfort crossing the rumble strip, and ability to control their bike across the rumble strip; however, they reported low levels of agreement for “Other motorcycle riders would have no trouble controlling their bikes when the cross this rumble strip.” Generally, participants reported lower levels of agreement with the function questions.

27
Figure 4.3: Participants Level of Agreement by Theme and Question Test Strip Three
*The original survey question was reverse coded for analyses. For clarity, this question is displayed differently than as it appears in the survey.
4.2.4.4 Test strip four
Using data associated with test strip four, a factor analysis with Varimax rotation was conducted. This analysis revealed two themes: comfort and control and function. The first theme, comfort and control accounted for 46.0% of the variance, and the second theme, function, accounted for 22.3% of the variance. This analysis tells us that, for test strip four, specific questions best serve as a measure for each theme.
Table 4.5: Themes from PCA of Test Strip Four
Components (Themes) Loading
Theme 1: Comfort/Control
I had no trouble steering as I crossed the RS* .834
Other MC riders would feel comfortable crossing this rumble strip .808
59.6%
63.5%
80.8%
40.4%
32.7%
61.5%
40.4%
46.2%
30.8%
28.8%
17.3%
44.2%
42.3%
36.5%
46.2%
36.5%
I had no trouble steering as I crossed the rumblestrip.*
I felt comfortable crossing this rumble strip.
I was able to control my bike as I crossed the rumblestrip.
Other motorcycle riders would feel comfortablecrossing this rumble strip.
Other motorcycle riders will have no troublecontrolling their bikes when they cross this rumble.*
My bike did not lose traction as I crossed the rumblestrip.*
The vibration of this rumble strip would sufficientlyalert other motorcycle riders when they drift out of
their lane.
The rumble strip created enough vibration to get myattention.
Com
fort
and
Con
trol
Func
tion
Agree Neutral Disagree

28
Other MC riders will have no trouble controlling their MC as they cross this RS** .780
My MC did not lose traction as I crossed the RS*** .763
I felt comfortable crossing this rumble strip .743
I was able to control my MC as I crossed this RS .709
Theme2: Function
The vibration of the RS would sufficiently alert other MC riders when they drift out of a lane .950
The RS created enough vibration to get my attention .947
Note: RS represents rumble strip and MC represents motorcycle
* The original question was “I had trouble steering as I crossed this rumble strip.”
**The original question was “Other MC riders may have trouble controlling their bikes when they cross this rumbles strip.” This question was reverse coded for analyses.
***The original question was “My MC lost traction as I crossed the rumble strip.” This question was reverse coded for analyses.
Figure 4.4 shows the levels of participant agreement with the corresponding statements about their experience with test strip four. This graph shows only questions associated with each theme found through the Principal Component Analysis. Participants indicated high levels of agreement with their ability to steer across the rumble strip, comfort crossing the rumble strip, and ability to control their bike across the rumble strip; however, they reported low levels of agreement for “Other motorcycle riders would have no trouble controlling their bikes when the cross this rumble strip” and “Other motor cycles riders would feel comfortable crossing this rumble strip.” Generally, participants reported high levels of agreement of agreement with the function questions.

29
Figure 4.4: Participants Level of Agreement by Theme and Question Test Strip Four
*The original survey question was reverse coded for analyses. For clarity, this question is displayed differently than as it appears in the survey.
4.2.4.5 Test strip five
Using data associated with test strip five, a factor analysis with Varimax rotation was conducted. This analysis revealed two themes: comfort and control and function. The first theme, comfort and control accounted for 46.0% of the variance, and the second theme, function, accounted for 22.3% of the variance. This analysis tells us that, for test strip five, specific questions best serve as a measure for each theme.
Table 4.6: Themes from PCA of Test Strip Five
Components (Themes) Loading
Theme 1: Comfort/Control
I had no trouble steering as I crossed the RS* .908
65.4%
42.3%
38.5%
80.8%
86.5%
69.2%
90.4%
90.4%
30.8%
48.1%
38.5%
15.4%
11.5%
26.9%
5.8%
7.7%
I had trouble no steering as I crossed the rumblestrip.*
Other motorcycle riders would feel comfortablecrossing this rumble strip.
Other motorcycle riders will have no troublecontrolling their bikes when they cross this rumble
strip.*
I felt comfortable crossing this rumble strip.
I was able to control my bike as I crossed the rumblestrip.
My bike did not lose traction as I crossed the rumblestrip.*
The vibration of this rumble strip would sufficientlyalert other motorcycle riders when they drift out of
their lane.
The rumble strip created enough vibration to get myattention.
Com
fort
and
Con
trol
Func
tion
Agree Neutral Disagree

30
I felt comfortable crossing this rumble strip .871
Other MC riders will have no trouble controlling their MC as they cross this RS** .857
Other MC riders would feel comfortable crossing this rumble strip .809
My MC did not lose traction as I crossed the RS*** .754
I was able to control my MC as I crossed this RS .580
Theme 2: Function
The vibration of the RS would sufficiently alert other MC riders when they drift out of a lane .928
The RS created enough vibration to get my attention .896
Note: RS represents rumble strip and MC represents motorcycle
* The original question was “I had trouble steering as I crossed this rumble strip.”
**The original question was “Other MC riders may have trouble controlling their bikes when they cross this rumbles strip.” This question was reverse coded for analyses.
***The original question was “My MC lost traction as I crossed the rumble strip.” This question was reverse coded for analyses.
Figure 4.5 shows the levels of participant agreement with the corresponding statements about their experience with test strip five. This graph shows only questions associated with each theme found through the Principal Component Analysis. Participants indicated high levels of agreement with their ability to steer across the rumble strip, comfort crossing the rumble strip, and ability to control their bike across the rumble strip; however, they reported low levels of agreement for “Other motorcycle riders would have no trouble controlling their bikes when the cross this rumble strip.” Generally, participants reported very low levels of agreement of agreement with the function questions.

31
Figure 4.5: Participants Level of Agreement by Theme and Question Test Strip Five
*The original survey question was reverse coded for analyses. For clarity, this question is displayed differently than as it appears in the survey.
4.2.4.6 Test strip six
Using data associated with test strip six, a factor analysis with Varimax rotation was conducted. This analysis revealed two themes: comfort and control and function. The first theme, comfort and control accounted for 46.8% of the variance, and the second theme, function, accounted for 20.9% of the variance. This analysis tells us that, for test strip six, specific questions best serve as a measure for each theme.
Table 4.7: Themes from PCA of Test Strip Six
Components (Themes) Loading
Theme 1: Comfort/Control
I had no trouble steering as I crossed the RS* .876
Other MC riders would feel comfortable crossing this rumble strip .821
65.4%
73.1%
46.2%
53.8%
65.4%
86.5%
34.6%
38.5%
28.8%
23.1%
32.7%
42.3%
28.8%
13.5%
50.0%
48.1%
I had no trouble steering as I crossed the rumblestrip.*
I felt comfortable crossing this rumble strip.
Other motorcycle riders will have no troublecontrolling their bikes when they cross this rumble…
Other motorcycle riders would feel comfortablecrossing this rumble strip
My bike did not lose traction as I crossed the rumblestrip*
I was able to control my bike as I crossed the rumblestrip
The vibration of this rumble strip would sufficientlyalert other motorcycle riders when they drift out of…
The rumble strip created enough vibration to get myattention
Com
fort
and
Con
trol
Func
tion
Agree Neutral Disagree

32
Other MC riders will have no trouble controlling their MC as they cross this RS** .800
I was able to control my MC as I crossed this RS .784
I felt comfortable crossing this rumble strip .736
My MC did not lose traction as I crossed the RS*** .697
Theme2: Function
The RS created enough vibration to get my attention .905
The vibration of the RS would sufficiently alert other MC riders when they drift out of a lane .874
Note: RS represents rumble strip and MC represents motorcycle
* The original question was “I had trouble steering as I crossed this rumble strip.”
**The original question was “Other MC riders may have trouble controlling their bikes when they cross this rumbles strip.” This question was reverse coded for analyses.
***The original question was “My MC lost traction as I crossed the rumble strip.” This question was reverse coded for analyses.
Figure 4.6 shows the levels of participant agreement with the corresponding statements about their experience with test strip six. This graph shows only questions associated with each theme found through the Principal Component Analysis. Participants indicated high levels of agreement with their ability to steer across the rumble strip, comfort crossing the rumble strip, and ability to control their bike across the rumble strip; however, they reported low levels of agreement for “Other motorcycle riders would have no trouble controlling their bikes when the cross this rumble strip.” Generally, participants reported very low levels of agreement of agreement with the function questions.

33
Figure 4.6: Participants Level of Agreement by Theme and Question Test Strip Six
*The original survey question was reverse coded for analyses. For clarity, this question is displayed differently than as it appears in the survey.
61.5%
53.8%
38.5%
86.5%
84.6%
65.4%
38.5%
34.6%
28.8%
40.4%
51.9%
11.5%
13.5%
30.8%
48.1%
51.9%
I had no trouble steering as I crossed the rumblestrip.*
Other motorcycle riders would feel comfortablecrossing this rumble strip.
Other motorcycle riders will have no troublecontrolling their bikes when they cross this rumble
strip.*
I was able to control my bike as I crossed the rumblestrip
I felt comfortable crossing this rumble strip.
My bike did not lose traction as I crossed the rumblestrip.*
The rumble strip created enough vibration to get myattention.
The vibration of this rumble strip would sufficientlyalert other motorcycle riders when they drift out of
their lane.
Com
fort
and
Con
trol
Func
tion
Agree Neutral Disagree

34
4.2.4.7 Test strip seven
Using data associated with test strip seven, a factor analysis with Varimax rotation was conducted. This analysis revealed two themes: comfort and control and function. The first theme, comfort and control accounted for 52.1% of the variance, and the second theme, function, accounted for 23.2% of the variance. This analysis tells us that, for test strip seven, specific questions best serve as a measure for each theme.
Table 4.8: Themes from PCA of Test Strip Seven
Components (Themes) Loading
Theme 1: Comfort/Control
I had no trouble steering as I crossed the RS* .923
I felt comfortable crossing this rumble strip .894
Other MC riders would feel comfortable crossing this rumble strip .849
My MC did not lose traction as I crossed the RS** .811
Other MC riders will have no trouble controlling their MC as they cross this RS** .763
I was able to control my MC as I crossed this RS .741
Theme2: Function
The RS created enough vibration to get my attention .947
The vibration of the RS would sufficiently alert other MC riders when they drift out of a lane .938
Note: RS represents rumble strip and MC represents motorcycle
* The original question was “I had trouble steering as I crossed this rumble strip.”
**The original question was “My MC lost traction as I crossed the rumble strip.” This question was reverse coded for analyses.
***The original question was “Other MC riders may have trouble controlling their bikes when they cross this rumbles strip.” This question was reverse coded for analyses.
Figure 4.7 shows the levels of participant agreement with the corresponding statements about their experience with test strip seven. This graph shows only questions associated with each theme found through the Principal Component Analysis. Participants indicated high levels of agreement with their ability to steer across the rumble strip, comfort crossing the rumble strip, and ability to control their bike across the rumble strip; however, they reported low levels of agreement for “Other motorcycle riders would have no trouble controlling their bikes when the cross this rumble strip.” Generally, participants reported very low levels of agreement of agreement with the function questions.

35
Figure 4.7: Participants Level of Agreement by Theme and Question Test Strip Seven
50.0%
67.3%
48.1%
61.5%
32.7%
82.7%
36.5%
32.7%
42.3%
25.0%
40.4%
25.0%
44.2%
17.3%
48.1%
57.7%
I had no trouble steering as I crossed the rumblestrip.*
I felt comfortable crossing this rumble strip.
Other motorcycle riders would feel comfortablecrossing this rumble strip.
My bike did not lose traction as I crossed the rumblestrip.*
Other motorcycle riders will have no troublecontrolling their bikes when they cross this rumble…
I was able to control my bike as I crossed the rumblestrip.
The rumble strip created enough vibration to get myattention
The vibration of this rumble strip would sufficientlyalert other motorcycle riders when they drift out of…
Com
fort
and
Con
trol
Func
tion
Agree Neutral Disagree

36
4.2.4.8 Results Summary
Table 4.9 summarizes the level of agreement for each rumble strip design by three themes: control, comfort, and function. A higher percentage of participants who Agree indicate more favorable views of a particular rumble strip design. Based on a given theme, each rumble strip design is divided into one of three categories: the two rumble strip designs with the two highest levels of favorability are shown in green, the two rumble strip designs with mid-level favorability are shown in yellow, and the rumble strip designs with the two lowest levels of favorability are shown in red. Test strip four is our standard rumble strip design and was excluded in this analysis.
Table 4.9: Percentage of Participants’ Favorability by Theme and Rumble Strip Design
Theme Level of agreement
TS 1 TS2 TS3 TS4 TS 5 TS6 TS7 Total
Control Agree 64.0 65.4 61.5 64.9 66.8 63.0 56.7 63.2
Neutral 27.4 28.4 28.4 26.9 25.5 30.8 32.2 28.5
Disagree 8.7 6.3 10.1 8.2 7.7 6.3 11.1 8.3
Comfort Agree 68.3 65.4 51.9 61.5 63.5 69.2 57.7 62.5
Neutral 27.9 31.7 36.5 31.7 32.7 26.9 32.7 31.5
Disagree 3.8 2.9 11.5 6.7 3.8 3.8 9.6 6.0
Function Agree 40.4 46.2 43.3 90.4 36.5 36.5 34.6 46.8
Neutral 49.0 39.4 41.3 6.7 49.0 50.0 52.9 41.2
Disagree 10.6 14.4 15.4 2.9 14.4 13.5 12.5 12.0
Participants were encouraged to share additional thoughts and concerns through a final open-ended survey question, “From the perspective of a motorcycle rider, please share any additional thoughts or experiences you had with the rumble strips you tested today.” The analyses of these responses revealed a high level of concern over rumble strips with a split design. To a much lesser degree, participants mentioned concern over rumble strips with the taper design. These comments are consistent with the quantitative analyses presented in this report.
An overall summary of the survey data indicates a preference for rumble strip designs two and six. Both of these sinusoidal designs were 14 inch wide with a maximum depth of 3/8 inch. Designs three and seven were the least desirable, likely due to the raised section located between the two rumble strips.

37
4.3 Bicycle Testing Procedures
Due to scheduling difficulties, only a small sample of bicycle riders was completed in this study. One group of three riders was used for the evaluation on October 24, 2015. The bicycle types tested included two standard road bikes and one tandem road bike. On the testing date, the test track and rumble strips were dry, with normal driving conditions.
The test day consisted of an initial introduction meeting, which included the completion of a wavier form for each rider. The testing procedure was explained to the riders. A rider evaluation survey specific to this study was developed by MnDOT staff. The survey was divided into Pre-Participation and Post-Participation parts. The Pre-Participation portion was completed by each rider prior to riding on the test track, with the purpose of identifying preexisting knowledge of rumble strips and impacts to bicycle riders.
Each participant rode on the test track and traversed all of the rumble strip designs. Riders were allowed to drive the test track as many times as they felt necessary to give adequate feedback. After riding on the track and all of the rumble strips, each rider returned to the classroom and completed the Post-Participation survey. The survey information was tabulated and evaluated to identify rider feedback and trends.
4.4 Bicycle Testing Results
Due to the small sample size, statistical analysis of the data was not completed. A review of comments left by the bicycle riders indicated a preference for rumble strip designs three and seven, both of which have the raised section located between the two rumble strips. The bicycle riders were able to ride on the raised area with being impacted by the rumble strip. The riders did indicate that all of the sinusoidal designs were preferable over the standard MnDOT non-sinusoidal design, which is very abrupt and jarring to bicycle riders.
38
CHAPTER 5: MONITORING PROGRAM
5.1 Final Test Program for TH 18
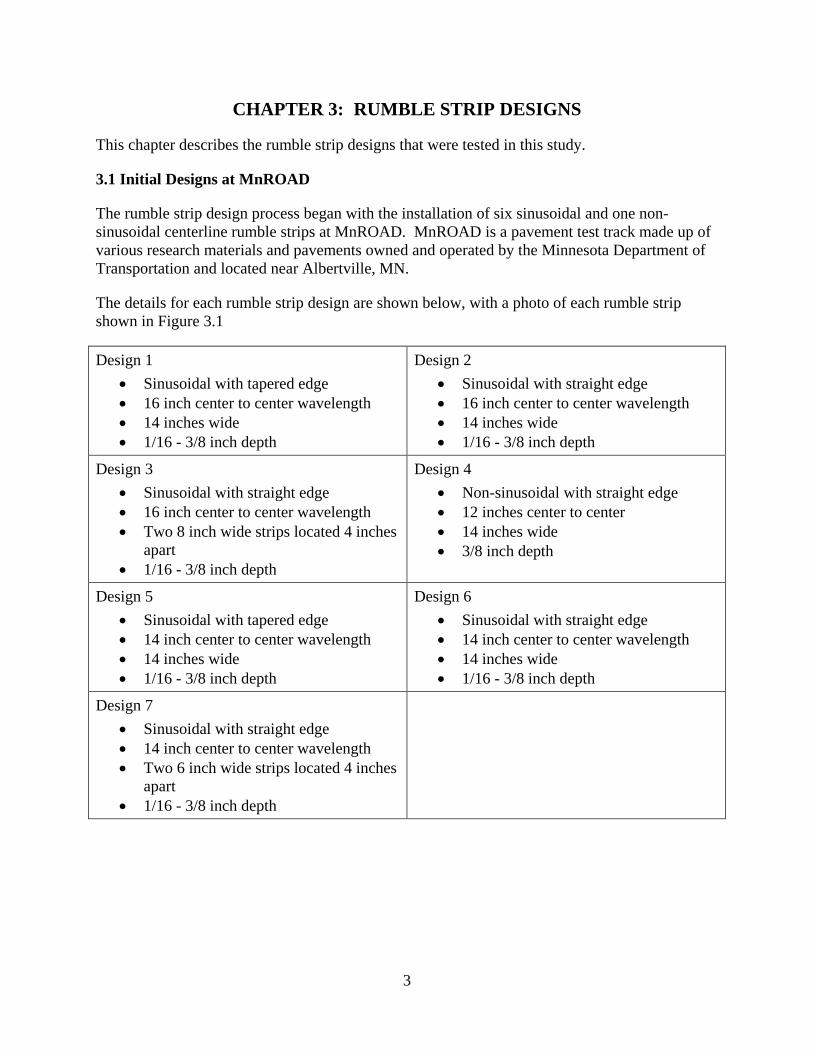
The selected centerline rumble strip designs were installed on TH 18 in east central Minnesota. TH 18 is a two lane rural section roadway that extends east from TH 47 north of Isle, MN. Figure 5.1 shows the general location of the westbound and eastbound tests. Figure 5.2 shows a typical corridor view of TH 18.
Figure 5.1 Test Area for Rumble Strips

39
Figure 5.2 TH 18 Typical Corridor View
The centerline rumble strips were installed in one mile increments, providing ample distance for acceleration and deceleration. The location of each rumble strip design is shown in Figure 5.3.
Details of Designs 1-4 are described in Section 3.2 of this report.
All data were collected on Monday, September 21, 2015. Additional details of the testing protocol are included in Appendix C.

40
Figure 5.3 Locations of Centerline Rumble Strips

41
The monitoring locations provided flat space for meter setup at 50 feet and 75 feet from the centerline rumble strips. The meter locations for the tests are shown on Figure 5.4. The meter at 75 feet is closest to the camera. To the right of the 50 foot meter is a video camera used to capture all of the tests.
Figure 5.4 Location of Sound Level Meters and Video Camera
42
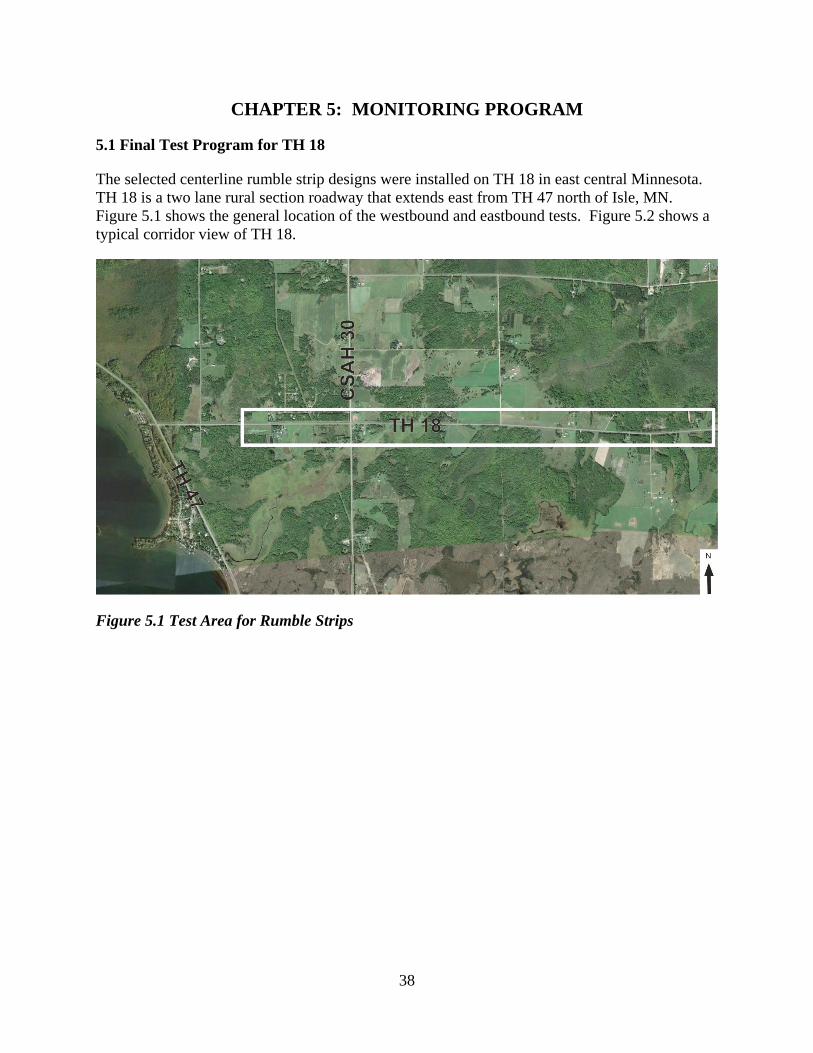
5.2 Vehicle Types and Interior Meter Location
The passenger car tested was a Ford Fusion shown in Figure 5.5.
Figure 5.5 Passenger Car Used in Tests
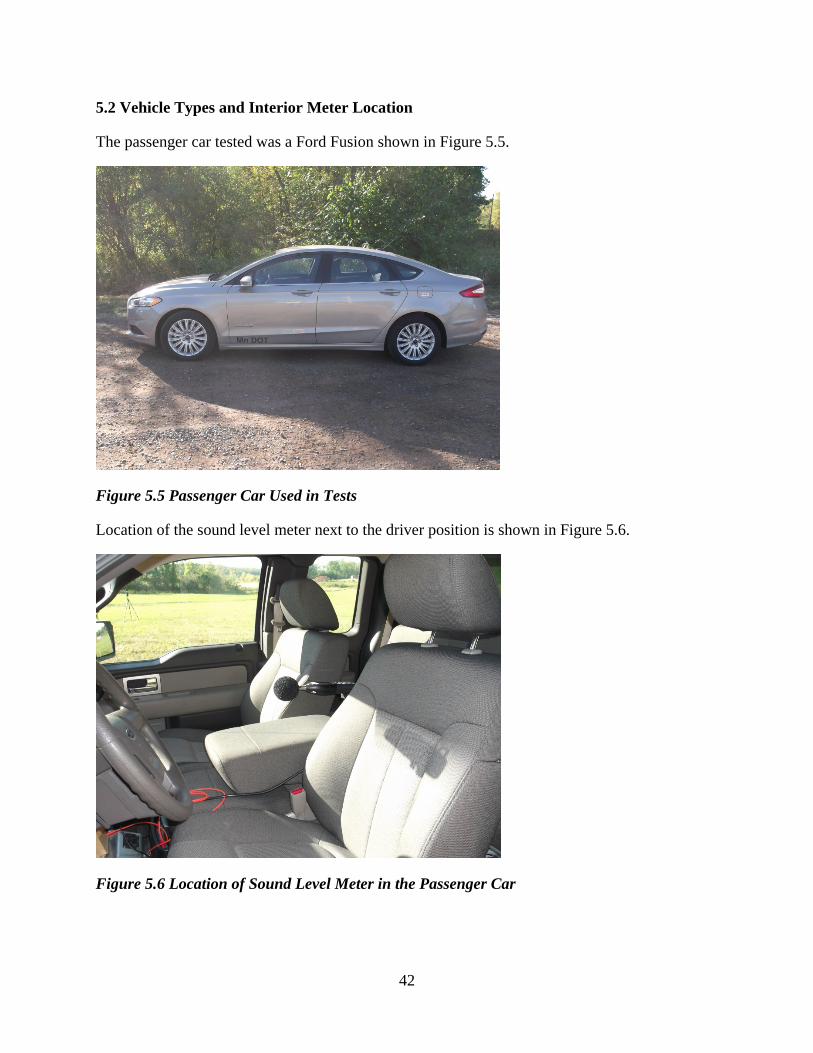
Location of the sound level meter next to the driver position is shown in Figure 5.6.
Figure 5.6 Location of Sound Level Meter in the Passenger Car

43
The pickup tested was a Ford F-150 shown in Figure 5.7.
Figure 5.7 Pickup Used in Tests
The sound level meter was located next to the driver.

44
The dump truck, a Sterling Class 35 tandem, is shown in Figure 5.8.
Figure 5.8 Dump Truck Used in the Tests
Location of the sound level meter next to the driver position is shown in Figure 5.9.
Figure 5.9 Location of Sound Level Meter in the Dump Truck
45
CHAPTER 6: TEST RESULTS
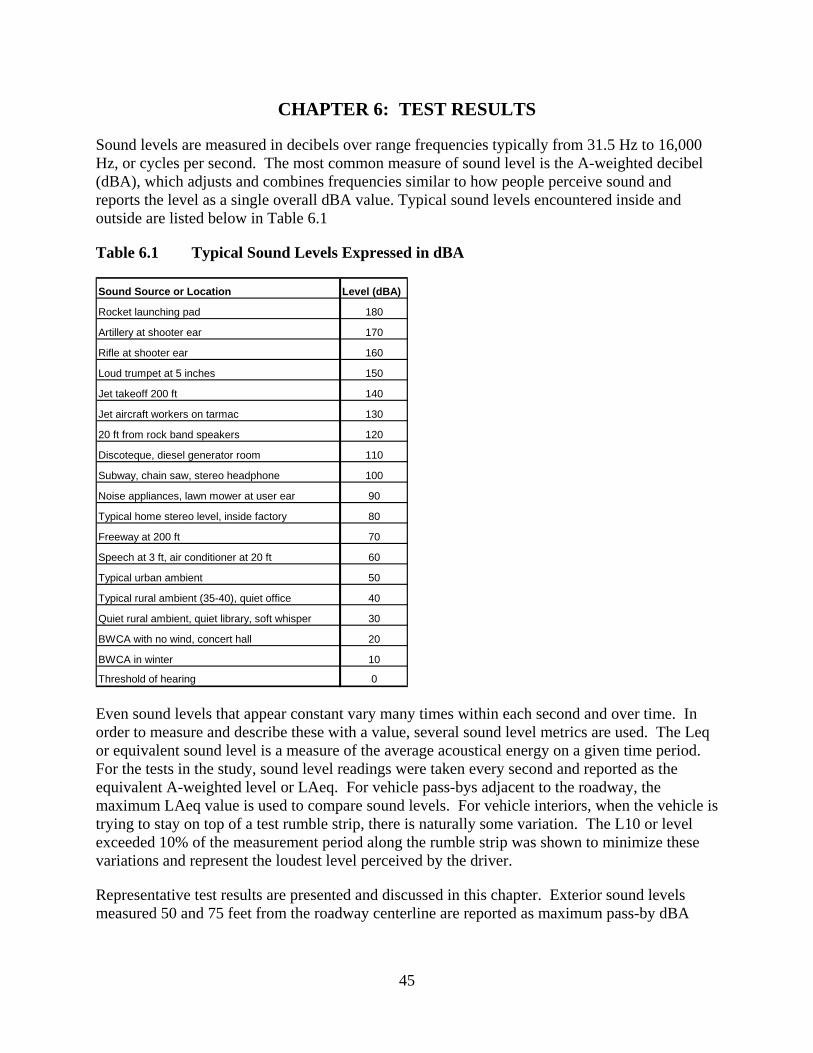
Sound levels are measured in decibels over range frequencies typically from 31.5 Hz to 16,000 Hz, or cycles per second. The most common measure of sound level is the A-weighted decibel (dBA), which adjusts and combines frequencies similar to how people perceive sound and reports the level as a single overall dBA value. Typical sound levels encountered inside and outside are listed below in Table 6.1
Table 6.1 Typical Sound Levels Expressed in dBA
Even sound levels that appear constant vary many times within each second and over time. In order to measure and describe these with a value, several sound level metrics are used. The Leq or equivalent sound level is a measure of the average acoustical energy on a given time period. For the tests in the study, sound level readings were taken every second and reported as the equivalent A-weighted level or LAeq. For vehicle pass-bys adjacent to the roadway, the maximum LAeq value is used to compare sound levels. For vehicle interiors, when the vehicle is trying to stay on top of a test rumble strip, there is naturally some variation. The L10 or level exceeded 10% of the measurement period along the rumble strip was shown to minimize these variations and represent the loudest level perceived by the driver.
Representative test results are presented and discussed in this chapter. Exterior sound levels measured 50 and 75 feet from the roadway centerline are reported as maximum pass-by dBA
Sound Source or Location Level (dBA)
Rocket launching pad 180
Artillery at shooter ear 170
Rifle at shooter ear 160
Loud trumpet at 5 inches 150
Jet takeoff 200 ft 140
Jet aircraft workers on tarmac 130
20 ft from rock band speakers 120
Discoteque, diesel generator room 110
Subway, chain saw, stereo headphone 100
Noise appliances, lawn mower at user ear 90
Typical home stereo level, inside factory 80
Freeway at 200 ft 70
Speech at 3 ft, air conditioner at 20 ft 60
Typical urban ambient 50
Typical rural ambient (35-40), quiet office 40
Quiet rural ambient, quiet library, soft whisper 30
BWCA with no wind, concert hall 20
BWCA in winter 10
Threshold of hearing 0

46
levels. Interior sound levels, as the vehicle passes over the rumble strip at the test location, are reported as L10 levels to represent the loudest observed sound levels that could alert the driver.
Comparisons are made between exterior and interior sound levels to show which strips best signal the driver with the least amount of exterior noise. Following the overall sound level comparisons, one-third octave band comparisons are made that show differences in sound level characteristics with different rumble strips.
6.1 Overall Sound Level Results
Figure 6.1 compares maximum pass-by sound levels at 50 feet from the roadway centerline for all of the tests in the order in which they were made, with averages of three pass-by maxima for each of the rumble strip designs. Levels at 75 feet were on average 4.5 dBA lower but with the same relative levels as shown on Figure 6.1. Results from the standard Minnesota rumble strip design are also included for comparison.
Figure 6.1 Exterior LAeq at 50 feet
The data are presented in no-strip/strip pairs for each vehicle and each rumble strip design. The first bar of each pair represents the peak pass-by level with no strip (NO) while the second bar of each pair is the average of three pass-bys on the rumble strip (Strip). The first three pairs are overall dBA levels for the car, pickup and truck on Strip 1. This is followed by three sets of data for Strip 2, Strip 3 and Strip 4. As can be seen from the data, the increased level in the car with a rumble strip is the highest, followed by the pickup and the truck. Both exterior and interior noise levels with the truck are high but some rumble strip effects can still be observed. The standard Minnesota rumble strip results are from an 8 inch wide strip. The current standard Minnesota rumble strip design for centerlines is 16 inches.
50
55
60
65
70
75
80
85
90
Car
-NO
Car
-Stri
pP
ick-
NO
Pic
k-S
trip
Truc
k-N
O
Truc
k-S
trip
Car
-NO
Car
-Stri
p
Pic
k-N
OP
ick-
Stri
p
Truc
k-N
OTr
uck-
Stri
pC
ar-N
OC
ar-S
trip
Pic
k-N
OP
ick-
Stri
p
Truc
k-N
OTr
uck-
Stri
p
Car
-NO
Car
-Stri
pP
ick-
NO
Pic
k-S
trip
Truc
k-N
O
Truc
k-S
trip
Car
MN
Pic
k M
N
Soun
d Le
vel (
LAeq
)
STRIP 1 STRIP 2 STRIP 3 STRIP 4 MN

47
Figure 6.2 shows measured interior sound level averages for each of the three pass-bys and rumble strip designs. Results from the Minnesota strip are also included for comparison.
Figure 6.2 Interior LAeq Levels
This figure compares interior sound levels with no rumble (NO) strip and for each rumble strip (strip) design. It can be seen that in the car, levels increase by 14 dBA for Strip 1, Strip 2 and Strip 3 and 10 dBA for Strip 4. The increase from the Minnesota Strip would be 18 dBA. For the pickup, the increase is 5 to 6 dBA over the no strip level for all four designs. The interior level in the truck increases only 1 to 2 dBA. No truck tests on the Minnesota strip were made. The standard Minnesota rumble strip results are from an 8 inch wide strip. The current standard Minnesota rumble strip design for centerlines is 16 inches.
6.2 Comparison of Interior Levels
The following three figures compare the interior sound level in each of the three vehicles for all four of the strips so the differences in interior sound level can be better compared. These figures also show more clearly the relatively small differences in sound level between the strips, with the level increase in the pickup less than half of that in the car and only a very small increase in the truck.
Figure 6.3 compares interior sound levels in the car and also includes the previously measured interior level from the Minnesota strip. Figure 6.4 compares interior sound levels in the pickup and also includes the previously measured interior level from the Minnesota strip. Figure 6.5 compares interior sound levels in the truck but without the Minnesota strip for which data were not previously measured.
50
55
60
65
70
75
80
85
90C
ar 1
-NO
Stri
p1
Pic
k 1
NO
Stri
p1
Truc
k 1
NO
Stri
p1
Car
2 N
O
Stri
p 2
Pic
k 2-
NO
Stri
p2Tr
uck
2-N
O
Stri
p2C
ar 3
-NO
Stri
p3
Pic
k 3N
O
Stri
p3Tr
uck
3-N
O
Stri
p3C
ar 4
-NO
Stri
p4
Pic
k 4-
NO
Stri
p4
Truc
k 4-
NO
Stri
p4
Car
MN
Pic
k M
N
Soun
d Le
vel (
LAeq
)
STRIP 1 STRIP 2 STRIP 3 STRIP 4 MN

48
Figure 6.3 Car – Interior Sound Levels
Sound levels increase about 14 dBA for Strip 1, Strip 2, and Strip 3, but only about 10 dBA for Strip 4. The sound level from the Minnesota strip is about 3 dBA higher than for the first three strips.
Figure 6.4 Pickup – Interior Sound Levels
30
40
50
60
70
80
90
No Strip Strip 1 Strip 2 Strip 3 Strip 4 Strip MN
Soun
d Le
vel (
dBA
)
30
40
50
60
70
80
90
No Strip Strip 1 Strip 2 Strip 3 Strip 4 Strip MN
Soun
d Le
vel (
dBA
)
CAR
PICKUP

49
Sound levels increase about 4 to 6 dBA for Strip 1, Strip 2, and Strip 3, and only slightly less for Strip 4. The sound level from the Minnesota strip is about 12 dBA higher than for the first three strips.
Figure 6.5 Truck – Interior Sound Levels
Sound levels increase only one or two dBA for all of the strips. No comparison with the Minnesota strip is available.
6.3 Exterior and Interior Sound Levels
The following figures compare exterior and interior sound levels from no-rumble strip and rumble strip for the three vehicles and all four designs. This provides an initial opportunity to evaluate the most effective strip that can generate the highest sound level in the vehicle and the lowest sound level outside of the vehicle.
Figure 6.6 compares exterior and interior sound levels with the car and also includes previously measured levels with the Minnesota strip.
Figure 6.7.compares exterior and interior sound levels with the pickup and also includes previously measured levels with the Minnesota strip.
Figure 6.8 compares exterior and interior sound levels with the truck but without the Minnesota strip for which data were not previously measured.
30
40
50
60
70
80
90
No Strip Strip 1 Strip 2 Strip 3 Strip 4
Soun
d Le
vel (
dBA
)
TRUCK

50
Figure 6.6 Exterior and Interior Sound Levels with the Car
This figure compares measured exterior and interior sound levels with the car. As can be seen, the interior level is higher than the exterior level of all four designs tested in the study. However, with the Minnesota strip on the far right, the interior level is lower than the exterior level.
Figure 6.7 Exterior and Interior Sound Levels with the Pickup
60
65
70
75
80
85
90
Strip NO Strip 1 Strip 2 Strip 3 Strip 4 Strip MN
Soun
d Le
vel (
dBA
)ExteriorInterior
60
65
70
75
80
85
90
Strip NO Strip 1 Strip 2 Strip 3 Strip 4 Strip MN
Soun
d Le
vel (
dBA
)
ExteriorInteriorPICKUP
CAR
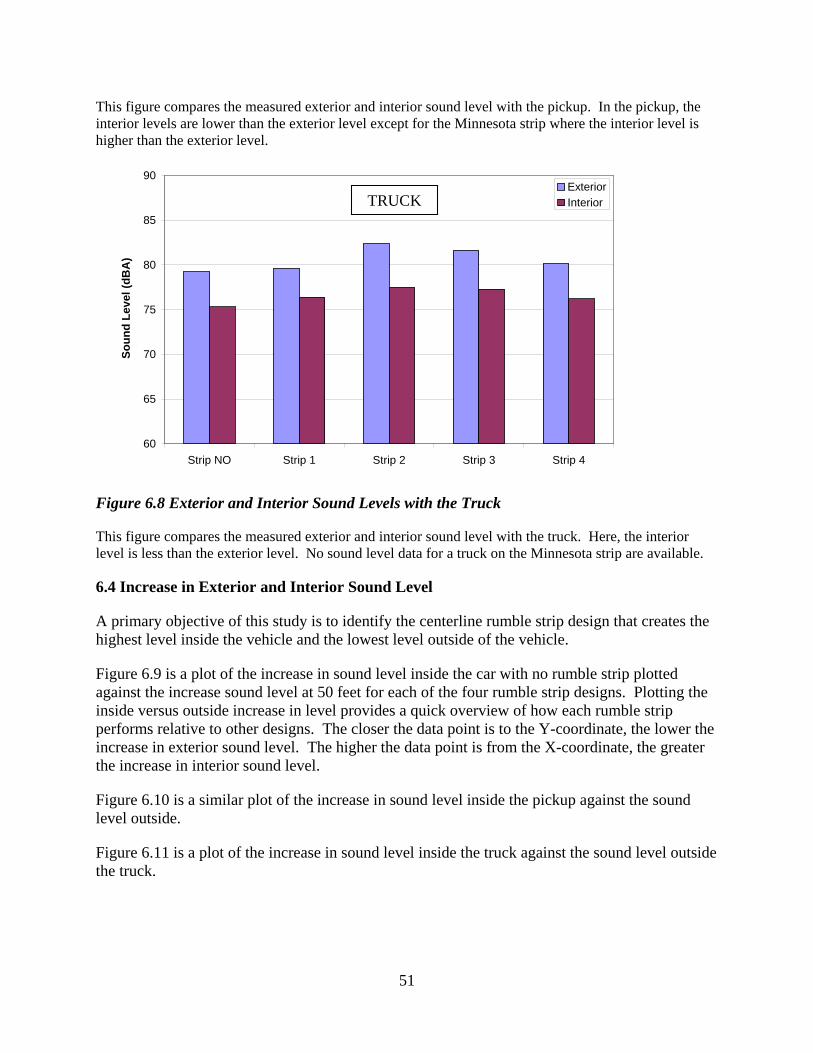
51
This figure compares the measured exterior and interior sound level with the pickup. In the pickup, the interior levels are lower than the exterior level except for the Minnesota strip where the interior level is higher than the exterior level.
Figure 6.8 Exterior and Interior Sound Levels with the Truck
This figure compares the measured exterior and interior sound level with the truck. Here, the interior level is less than the exterior level. No sound level data for a truck on the Minnesota strip are available.
6.4 Increase in Exterior and Interior Sound Level
A primary objective of this study is to identify the centerline rumble strip design that creates the highest level inside the vehicle and the lowest level outside of the vehicle.
Figure 6.9 is a plot of the increase in sound level inside the car with no rumble strip plotted against the increase sound level at 50 feet for each of the four rumble strip designs. Plotting the inside versus outside increase in level provides a quick overview of how each rumble strip performs relative to other designs. The closer the data point is to the Y-coordinate, the lower the increase in exterior sound level. The higher the data point is from the X-coordinate, the greater the increase in interior sound level.
Figure 6.10 is a similar plot of the increase in sound level inside the pickup against the sound level outside.
Figure 6.11 is a plot of the increase in sound level inside the truck against the sound level outside the truck.
60
65
70
75
80
85
90
Strip NO Strip 1 Strip 2 Strip 3 Strip 4
Soun
d Le
vel (
dBA
)
ExteriorInteriorTRUCK

52
Figure 6.9 Cartesian Plot of Interior vs Exterior Sound Level Increase in the Car
This plot of increase in interior sound level versus increase in exterior sound level for each rumble strip shows the relative benefits of each strip. For example, S1 shows an increase in interior level of 15 dBA (vertical y-axis) and an increase in exterior level of only 4.5 dBA (horizontal x-axis). The negative x-value for S4 is clearly not an accurate representation of the change in exterior sound level, but is a result of difficulty in monitoring sound level with increasing wind speeds in the final test. The ideal rumble strip for minimizing exterior sound would be a 15 dBA increase in interior level and a zero increase in exterior level.
Figure 6.10 Cartesian Plot of Interior vs Exterior Sound Level Increase in the Pickup
S1 S2
S3S4
0
5
10
15
-5 0 5 10 15 20 25
Outside Increase (dBA)
Insi
de In
ceas
e (d
BA
)
S1S2
S3S4
0
5
10
15
-5 0 5 10 15 20 25
Outside Increase (dBA)
Insi
de In
ceas
e (d
BA
)
CAR
PICKUP

53
This plot of increase in interior sound level versus increase in exterior sound level for the pickup again shows the relative benefits of each rumble strip design. In his case, the points are much closer together reflecting a small difference in sound level between strips with the pickup. However, the smaller increase in exterior sound level for the shallow strips (S1 and S4) is clearly evident, while the increase in exterior sound level is clearly shown.
Figure 6.11 Cartesian Plot of Interior vs Exterior Sound Level Increase in the Truck
This plot of increase in interior sound level versus increase in exterior sound level for the truck shows minimal increases in interior sound level and low increases in exterior sound level. Again, the negative change in exterior noise is a result of the higher no-strip level and windy conditions.
6.5 Exterior and Interior Sound Level Spectra
In addition to the overall A-weighted (dBA) data presented above, the spectral content of sound both outside and inside the car are critical to potential annoyance outside of the vehicle and awareness inside the vehicle. This section presents and discusses this issue.
Figure 6.12 compares the one-third octave band levels at 50 feet from the car pass-by on the four rumble strips with the four-test average “no-rumble strip” spectral signature.
Figure 6.13 compares the one-third octave band levels at 50 feet from the pickup pass-by on the four rumble strips with the average “no-rumble strip” spectral signature.
Figure 6.14 compares the one-third octave band levels at 50 feet from the truck pass-by on the four rumble strips with the average “no-rumble strip” spectral signature.
S1S2
S3S4
0
5
10
15
-5 0 5 10 15 20 25
Outside Increase (dBA)
Insi
de In
ceas
e (d
BA
)
TRUCK

54
Figure 6.12 Sound Level Spectra a 50 feet of Car Pass-by
This figure shows the one-third octave band spectra at 50 feet from a car pass-by on normal pavement and on each of the four rumble strip designs. The frequencies range from 31.5 Hz or cycles per second to 16,000 Hz or 16KHz. While some of the higher frequencies, which control the A-weighted sound level, vary by as much as 10 dB, variation in the 80 Hz and 160 Hz peaks is generally lower from the 14 inch wavelength tested. This “two-peak” behavior is identical to the California strip design evaluated in the previous study (1).
Figure 6.13 Sound Level Spectra a 50 feet of Pickup Pass-by
20
30
40
50
60
70
80
90
100
31.5
Hz
40H
z50
Hz
63H
z80
Hz
100H
z12
5Hz
160H
z20
0Hz
250H
z31
5Hz
400H
z50
0Hz
630H
z80
0Hz
1KH
z1.
25K
Hz
1.6K
Hz
2KH
z2.
5KH
z3.
15K
Hz
4KH
z5K
Hz
6.3K
Hz
8KH
z10
KH
z12
.55K
Hz
16K
Hz
Frequency
Soun
d Le
vel (
dB)
No StripStrip 1Strip 2Strip 3Strip 4Strip MN
20
30
40
50
60
70
80
90
100
31.5
Hz
40H
z50
Hz
63H
z80
Hz
100H
z12
5Hz
160H
z20
0Hz
250H
z31
5Hz
400H
z50
0Hz
630H
z80
0Hz
1KH
z1.
25K
Hz
1.6K
Hz
2KH
z2.
5KH
z3.
15KH
z4K
Hz
5KH
z6.
3KH
z8K
Hz
10K
Hz
12.5
5KH
z16
KH
z
Frequency
Soun
d Le
vel (
dB)
No StripStrip 1Strip 2Strip 3Strip 4Strip MN
CAR
PICKUP

55
The sound level spectra from the pickup show considerable variation between the rumble strip designs while the double peak at 80 Hz and 160 Hz are somewhat stronger than with the car.
Figure 6.14 Sound Level Spectra at 50 ft of Truck Pass-by
There is very little variation in the sound level spectra for a truck pass-by and strong 80 Hz and 160 Hz peaks show up even when no rumble strip is present, which makes detection of the strip more difficult.
Figure 6.15 compares the one-third octave band levels inside the car on the four rumble strips with the average “no-rumble strip” spectral signature.
Figure 6.16 compares the one-third octave band levels inside the pickup on the four rumble strips with the average “no-rumble strip” spectral signature.
Figure 6.17 compares the one-third octave band levels inside the truck on the four rumble strips with the average “no-rumble strip” spectral signature.
20
30
40
50
60
70
80
90
10031
.5H
z40
Hz
50H
z63
Hz
80H
z10
0Hz
125H
z16
0Hz
200H
z25
0Hz
315H
z40
0Hz
500H
z63
0Hz
800H
z1K
Hz
1.25
KH
z1.
6KH
z2K
Hz
2.5K
Hz
3.15
KH
z4K
Hz
5KH
z6.
3KH
z8K
Hz
10K
Hz
12.5
5KH
z16
KH
z
Frequency
Soun
d Le
vel (
dB)
No Strip
Strip 1
Strip 2
Strip 3
Strip 4
TRUCK

56
Figure 6.15 Sound Level Spectra a (L10) Inside the Car
These charts cover the frequency from 6.3 Hz through 4 KHz to emphasize sound level differences inside the vehicle. The 80 Hz and 160 Hz peaks are seen to be quite high in the passenger car.
Figure 6.16 Sound Level Spectra a (L10) Inside the Pickup
The 80 Hz and 160 Hz peaks are lower in the pickup and only small increases in sound level can be seen at the higher frequencies.
30
40
50
60
70
80
90
100
110
6.3H
z8H
z10
Hz
12.5
Hz
16H
z20
Hz
25H
z31
.5H
z40
Hz
50H
z63
Hz
80H
z10
0Hz
125H
z16
0Hz
200H
z25
0Hz
315H
z40
0Hz
500H
z63
0Hz
800H
z1K
Hz
1.25
KH
z1.
6KH
z2K
Hz
2.5K
Hz
3.15
KH
z4K
Hz
Frequency
Soun
d Le
vel (
dB)
No Strip
Strip 1
Strip 2
Strip 3
Strip 4
30
40
50
60
70
80
90
100
110
6.3H
z8H
z10
Hz
12.5
Hz
16H
z20
Hz
25H
z31
.5H
z40
Hz
50H
z63
Hz
80H
z10
0Hz
125H
z16
0Hz
200H
z25
0Hz
315H
z40
0Hz
500H
z63
0Hz
800H
z1K
Hz
1.25
KH
z1.
6KH
z2K
Hz
2.5K
Hz
3.15
KH
z4K
Hz
Frequency
Soun
d Le
vel (
dB)
No Strip
Strip 1
Strip 2
Strip 3
Strip 4
CAR
PICKUP

57
Figure 6.17 Sound Level Spectra a (L10) Inside the Truck
There are strong 25 Hz and 125 Hz peaks associated with the diesel engine although the 80 Hz increase from the rumble strip can be seen. However, increases over most of the frequencies are quite small.
6.6 Exterior Sound Level Decay with Distance
Following the approach taken in Reference [1] for evaluating sound level decay with distance and estimating the potential for detection, sound levels are predicted out to 3000 feet from the roadway. As noted in the survey of literature, previous studies of rumble strip noise have attempted to determine the distance at which rumble strip noise could be heard by monitoring or observation. As noted in Reference [1] this is not a very meaningful approach for determining the distance that rumble strips may be heard, since local conditions and especially the ambient sound level can have a major influence on audibility or detectability.
Before the detectability distances of rumble strip noise is addressed in Section 6.7, it is necessary to estimate the decay of rumble strip sound with distance from the roadway. For this, source levels for each vehicle type and rumble strip design were based upon the maximum measured pass-by levels at 50 feet. These sources were then used in an outdoor propagation model based in the international standard ISO 9613-1 and ISO 9613-2, which take into account distance and atmospheric absorption as well as less significant factors and shielding by barriers. For this analysis, no barrier or terrain shielding, no attenuation by trees or vegetation, or ground effect has been a
The predicted decay of sound results of these model projections are presented in Figure 6.18 through Figure 6.20.
30
40
50
60
70
80
90
100
110
6.3H
z8H
z10
Hz
12.5
Hz
16H
z20
Hz
25H
z31
.5H
z40
Hz
50H
z63
Hz
80H
z10
0Hz
125H
z16
0Hz
200H
z25
0Hz
315H
z40
0Hz
500H
z63
0Hz
800H
z1K
Hz
1.25
KH
z1.
6KH
z2K
Hz
2.5K
Hz
3.15
KH
z4K
Hz
Frequency
Soun
d Le
vel (
dB)
No Strip
Strip 1
Strip 2
Strip 3
Strip 4
TRUCK

58
Figure 6.18 Decay of Sound with Distance – Car
These curves show predicted dBA sound levels out to 3000 feet. The highest level is associated with S2 which is a deeper double strip.
Figure 6.19 Decay of Sound with Distance – Pickup
20
25
30
35
40
45
50
55
60
65
70
0 500 1000 1500 2000 2500 3000
Distance (ft)
Soiu
nd L
evel
(dB
A)
NO
S1
S2
S3
S4
MN
20
25
30
35
40
45
50
55
60
65
70
0 500 1000 1500 2000 2500 3000
Distance (ft)
Soiu
nd L
evel
(dB
A)
NOS1S2S3S4MN
CAR
PICKUP

59
The curves are similar to those for the car, with S1 and S3 higher than the other strips and about 3 dBA higher that levels from the car.
Figure 6.20 Decay of Sound with Distance – Truck
The curve for no rumble strip is about 10 dBA higher than for the pickup. The sound level estimated from S2 for the truck is about 7 dBA higher than that estimated for the pickup.
6.7 Detectability of Rumble Strip Noise
The approach shown here used follows the approach used in the earlier study and is based upon a report for the US Army Tank Automotive Command prepared by Fidell and Bishop in 1974.[5] Detectability depends upon the difference between the ambient level spectrum and the noise or intruding spectrum. For very low noise levels, the threshold of hearing can also play a role. “Detectability” level is normally lower that “audibility” level since it is associated with actively listening for a sound compared with passively hearing a sound. For example, in a restaurant, one can hear people at the next table but not pay much attention to what is being said. This can be called “passive” hearing. On the other hand, when one tries to understand carefully what is being said at the next table, this can be called “active” listening.
20
25
30
35
40
45
50
55
60
65
70
0 500 1000 1500 2000 2500 3000
Distance (ft)
Soiu
nd L
evel
(dB
A)
NOS1S2
S3S4
TRUCK

60
6.7.1 Ambient of Background Level
In order to estimate detectability, a background or ambient level must be assumed. Figure 6.22 shows a range of monitored ambient levels from different regions with the 41 dBA level monitored in Polk County, which is representative of rural areas near two-lane roadways.
Figure 6.21 Some Typical Quiet Ambient Background Spectra
The top curve represents a typical rural area with a light housing and roadway density. The middle curve is an average of background levels measured during the rumble strip testing in Polk County. The bottom curve was measured near the Boundary Area Canoe Area Wilderness in northern Minnesota, which has limited motorized traffic and aircraft over-flights. For the analysis here, the observed ambient from Polk County has been assumed.

61
6.7.2 Determining the Detectability of an “Intruding” Sound
The concept of determining detectability of an intruding noise is demonstrated in Figure 6.23.
In this figure, a typical rural ambient level is shown (top curve) along with the predicted spectrum of a passenger car traveling at 60 mph on a Minnesota rumble strip. Also shown on the curve is the standard threshold of hearing curve, which in this case is well below ambient and plays no role.
Figure 6.22 Example of Determining Detectability
This chart compares the spectrum from a car at 60 mph on a Minnesota strip at a distance of 3000 feet with the monitored ambient. Here, the intruding sound is seen to exceed the ambient curve at a number of frequencies. A signal or intruding sound is deemed detectable when the signal exceeds the ambient level at any one frequency. Both ambient and intruding noise would have to be extremely low for the hearing threshold to play a role.
6.7.3 Rumble Strip Detectability-Theoretical
The detectability of sound from the each of the test vehicles is presented here for the no-strip pass-by as well as an average of three pass-bys on each of the four strips. In the calculation, an overall increase of 7 dBA is considered just detectable. Figure 6.23 shows the theoretical detectability of a passenger car with no strip and the four strip designs. As can be seen in the figure, with a quiet ambient level, some strips can theoretically be detectable at distances greater than 3,000 feet. Thus, values in the literature ranging from several hundred feet to 1,500 feet may have been limited by higher ambient levels or other factors, or the rumble strips may have been quieter or had different frequency content that would more quickly decay atmospheric absorption. The 3,000 foot distance for detectability is not unexpected, based upon comments from residents near rural two lane highways.
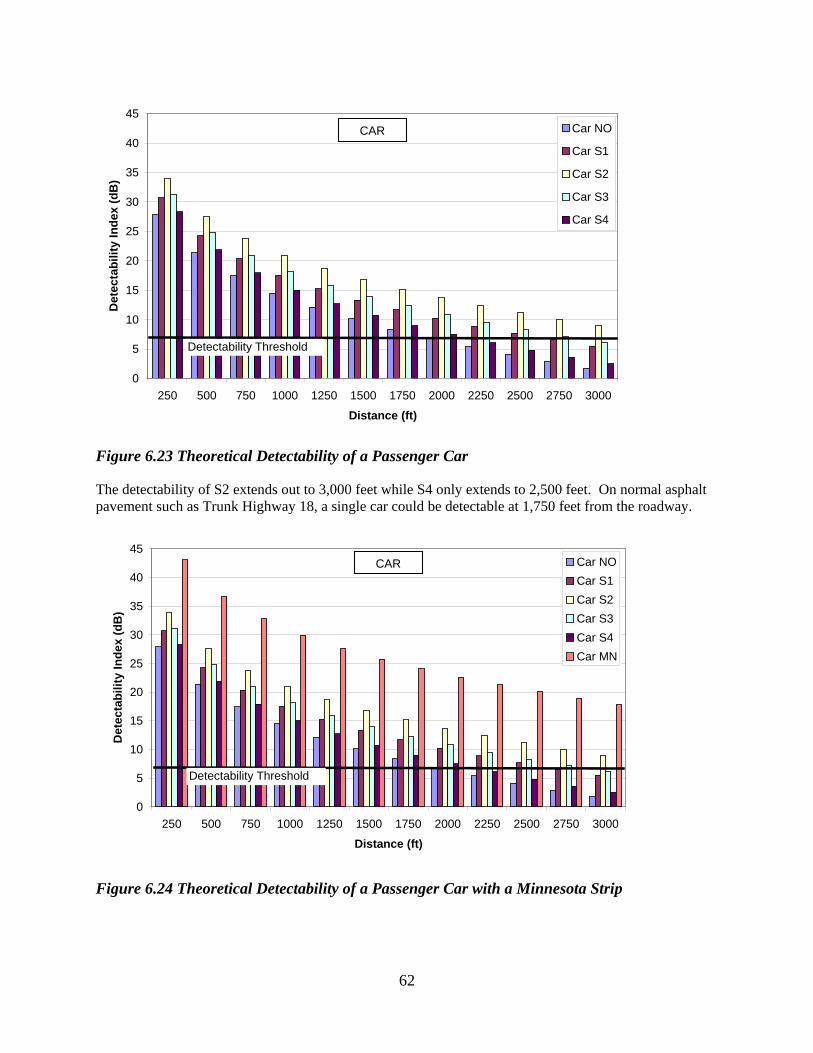
62
Figure 6.23 Theoretical Detectability of a Passenger Car
The detectability of S2 extends out to 3,000 feet while S4 only extends to 2,500 feet. On normal asphalt pavement such as Trunk Highway 18, a single car could be detectable at 1,750 feet from the roadway.
Figure 6.24 Theoretical Detectability of a Passenger Car with a Minnesota Strip
0
5
10
15
20
25
30
35
40
45
250 500 750 1000 1250 1500 1750 2000 2250 2500 2750 3000
Distance (ft)
Det
ecta
bilit
y In
dex
(dB
)Car NO
Car S1
Car S2
Car S3
Car S4
Detectability Threshold
0
5
10
15
20
25
30
35
40
45
250 500 750 1000 1250 1500 1750 2000 2250 2500 2750 3000
Distance (ft)
Det
ecta
bilit
y In
dex
(dB
)
Car NOCar S1Car S2Car S3Car S4Car MN
Detectability Threshold
CAR
CAR

63
The above chart shows the difference in detectability of the Minnesota strip compared with the four strips tested in this study. It could be theoretically detectable almost a mile away or more in a quiet rural environment.
Figure 6.25 Theoretical Detectability of a Pickup
The detectability of S2 extends pass 3000 feet while S4 only extends to 2500 feet. On normal asphalt pavement such as Trunk Highway 18, a single car could be detectable at 2250 feet from the roadway.
0
5
10
15
20
25
30
35
40
45
250 500 750 1000 1250 1500 1750 2000 2250 2500 2750 3000
Distance (ft)
Det
ecta
bilit
y In
dex
(dB
)
Pick NO
Pick S1
Pick S2
Pick S3
Pick S4
Detectability Threshold
PICKUP

64
Figure 6.26 Theoretical Detectability of a Truck
The detectability of a truck on a normal asphalt pavement extends well past 3000 feet. With S2 and S3, this distance will increase close to one mile from the roadway.
0
5
10
15
20
25
30
35
40
45
250 500 750 1000 1250 1500 1750 2000 2250 2500 2750 3000
Distance (ft)
Det
ecta
bilit
y In
dex
(dB
)Truck NO
Truck S1
Truck S2
Truck S3
Truck S4
Detectability Threshold
TRUCK

65
CHAPTER 7: STUDY CONCLUSIONS
An evaluation of motorcycles and bicycles was carried out at the MnROAD facility near Albertville, Minnesota, to determine how various rumble strip configurations affected rider performance. An overall summary of the survey data indicates a preference for rumble strip designs that were 14 inch wide with a maximum depth of 3/8 inch. Designs with two strips spaced 4 inches apart were the least desirable due to the raised section located between the two rumble strips.
Increases in exterior sound levels between the no-strip and rumble strip pass-bys were generally small, as shown in Table 7.1.
Table 7.1: Increase (dBA) over No-Strip for Rumble Strip Designs Increase (dBA) over No-Strip
Rumble Strip Exterior at 50 ft. Exterior at 75 ft. Interior
Car
Strip 1 4.5 3.3 14.9
Strip 2 6.4 8.6 15.2
Strip 3 5.9 5.2 14.7
Strip 4 2.3 2.4 12.5
Minnesota Design1 18.5 na 16.7
Pickup
Strip 1 3.0 2.2 5.7
Strip 2 5.8 6.8 5.9
Strip 3 5.8 6.1 6.8
Strip 4 2.9 2.1 4.5
Minnesota Design1 13.7 na 8.4
Truck
Strip 1 -0.4 -1.1 0.8
Strip 2 3.0 2.8 2.7
Strip 3 2.5 2.3 1.4
Strip 4 1.8 0.1 1.2
1 No-strip results from previous Minnesota rumble strip study in Polk County, MN [1] were for a speed of 45 mph. The standard Minnesota rumble strip is a non-sinusoidal design 16 inch wide and 3/8 inch deep.
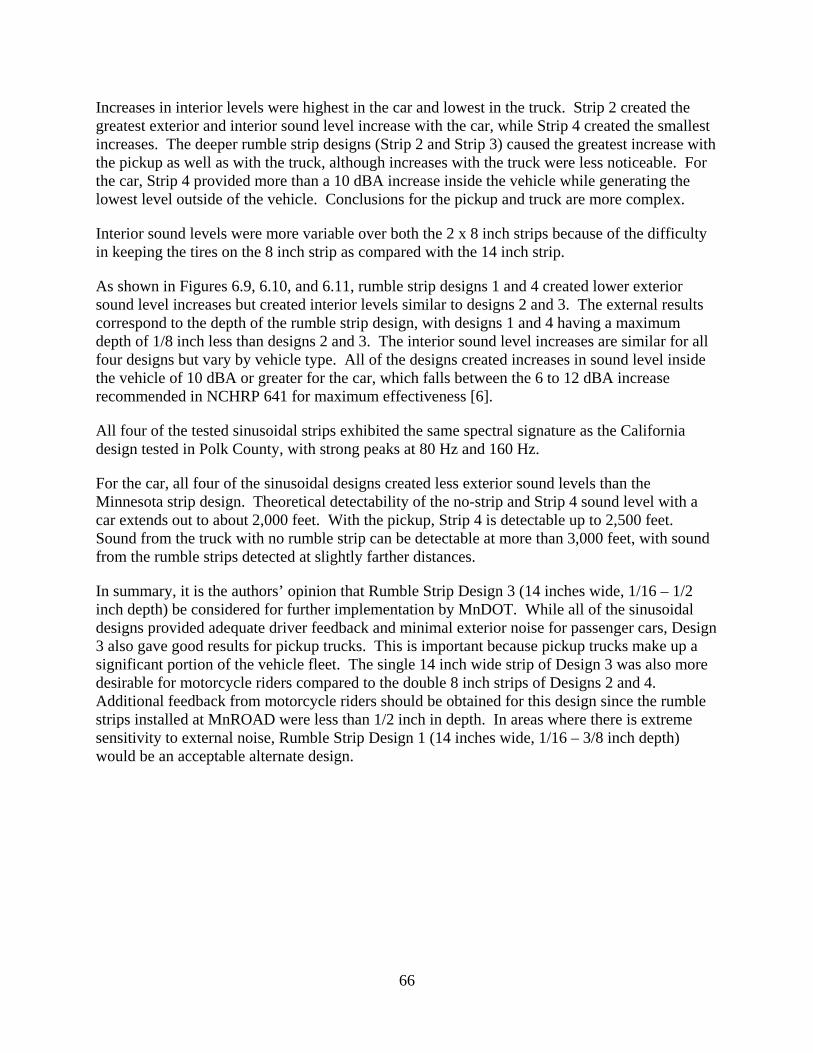
66
Increases in interior levels were highest in the car and lowest in the truck. Strip 2 created the greatest exterior and interior sound level increase with the car, while Strip 4 created the smallest increases. The deeper rumble strip designs (Strip 2 and Strip 3) caused the greatest increase with the pickup as well as with the truck, although increases with the truck were less noticeable. For the car, Strip 4 provided more than a 10 dBA increase inside the vehicle while generating the lowest level outside of the vehicle. Conclusions for the pickup and truck are more complex.
Interior sound levels were more variable over both the 2 x 8 inch strips because of the difficulty in keeping the tires on the 8 inch strip as compared with the 14 inch strip.
As shown in Figures 6.9, 6.10, and 6.11, rumble strip designs 1 and 4 created lower exterior sound level increases but created interior levels similar to designs 2 and 3. The external results correspond to the depth of the rumble strip design, with designs 1 and 4 having a maximum depth of 1/8 inch less than designs 2 and 3. The interior sound level increases are similar for all four designs but vary by vehicle type. All of the designs created increases in sound level inside the vehicle of 10 dBA or greater for the car, which falls between the 6 to 12 dBA increase recommended in NCHRP 641 for maximum effectiveness [6].
All four of the tested sinusoidal strips exhibited the same spectral signature as the California design tested in Polk County, with strong peaks at 80 Hz and 160 Hz.
For the car, all four of the sinusoidal designs created less exterior sound levels than the Minnesota strip design. Theoretical detectability of the no-strip and Strip 4 sound level with a car extends out to about 2,000 feet. With the pickup, Strip 4 is detectable up to 2,500 feet. Sound from the truck with no rumble strip can be detectable at more than 3,000 feet, with sound from the rumble strips detected at slightly farther distances.
In summary, it is the authors’ opinion that Rumble Strip Design 3 (14 inches wide, 1/16 – 1/2 inch depth) be considered for further implementation by MnDOT. While all of the sinusoidal designs provided adequate driver feedback and minimal exterior noise for passenger cars, Design 3 also gave good results for pickup trucks. This is important because pickup trucks make up a significant portion of the vehicle fleet. The single 14 inch wide strip of Design 3 was also more desirable for motorcycle riders compared to the double 8 inch strips of Designs 2 and 4. Additional feedback from motorcycle riders should be obtained for this design since the rumble strips installed at MnROAD were less than 1/2 inch in depth. In areas where there is extreme sensitivity to external noise, Rumble Strip Design 1 (14 inches wide, 1/16 – 3/8 inch depth) would be an acceptable alternate design.

67
REFERENCES
1. Minnesota Department of Transportation, Rumble Strip Noise Evaluation, Wenck Associates and David Braslau Associates, Maple Plain, MN, February 2015.
2. Donavan, P. and Rymer, B., Comparison of Vehicle Responses to Rumble Strip Inputs of Varying Design, SAE Int. J. Passeng. Cars - Mech. Syst. 8(3): 964-972, June 2015.
3. Anund, A.; Rumble strips – Effects and Consequences of Different Types of Rumble Strips Milled in the Center of 2-Lane Rural Roads; Swedish National Road and Transport Research Institute, Linköping, Sweden, October 2014.
4. Sexton, T. V., Evaluation of Current Centerline Rumble Strip Design(s) to Reduce Roadside Noise and Promote Safety; WSDOT Environmental Services Office, Madison, WI, September 2014.
5. Fidell, S. and Bishop, D, Prediction of Acoustic Detectability, U.S. Army Tank Automotive Command, Washington, D.C., August 1974
6. National Cooperative Highway Research Program, Guidance for the Design and Application of Shoulder and Centerline Rumble Strips, NCHRP Report 641, Washington, D.C., 2009.

68
GLOSSARY
AMBIENT NOISE: The total of all noise in the environment, other than the noise from the source of interest. This term is used interchangeably with background noise.
dB: A unit of sound pressure level, abbreviated as dB. Decibel means 1/10 of Bel (named after Alexander Graham Bell). The decibel uses a logarithmic scale to cover the very large range of sound pressures that can be heard by the human ear. Under the decibel unit of measure, a 10 dB increase will be perceived by most people to be a doubling in loudness, i.e., 80 dB seems twice as loud as 70 dB
dBA: The A-weighted Decibel (dBA) is the most common unit used for measuring environmental sound levels. It adjusts, or weights, the frequency components of sound to conform with the normal response of the human ear at conversational levels. dBA is an international metric that is used for assessing environmental noise exposure of all noise sources.
dBC: The C-weighted Decibel (dBC) is the method of measuring sound which takes into account the low frequency components of noise sources, such as mechanical equipment, aircraft operations, and vibration and reflects their contribution to the environment.
FREQUENCY: The number of times per second that a sound or vibration repeats itself. This is now expressed in hertz (Hz) rather than in cycles per second (cps).
HERTZ (Hz): The Hertz is a unit of measurement of frequency which is numerically equal to cycles per second. High frequencies can be thought of as having a high pitch; like a whistle; low frequency sounds are more like a rumble of a truck or airplane.
Leq: The constant equivalent sound level that, in given time period (e.g. 1 second or 1 hour) represents the same sound energy of a variable sound in the same time period.
LAeq: The equivalent sound level over a one-second period in this report with an A-weighting
LCeq: The equivalent sound level over a one-second period in this report with an C-weighting
OCTAVE: The interval between two sounds having a frequency ratio of two. There are 8 octaves on the keyboard of a standard piano.
OCTAVE BAND: The segment or “band” of the frequency spectrum separated by an octave.
OCTAVE BAND LEVEL: The integrated sound pressure level of all frequencies within a specified octave band.
ONE THIRD OCTAVE BAND: The segment or “band” of the frequency spectrum separated by one-third of an octave for a more refined evaluation of sound level characteristics

APPENDIX A

A-1
TABLE OF COMPARATIVE SOUND LEVELS
Sound Source or Location Level (dBA)
Rocket launching pad 180
Artillery at shooter ear 170
Rifle at shooter ear 160
Loud trumpet at 5 inches 150
Jet takeoff 200 ft 140
Jet aircraft workers on tarmac 130
20 ft from rock band speakers 120
Discoteque, diesel generator room 110
Subway, chain saw, stereo headphone 100
Noise appliances, lawn mower at user ear 90
Typical home stereo level, inside factory 80
Freeway at 200 ft 70
Speech at 3 ft, air conditioner at 20 ft 60
Typical urban ambient 50
Typical rural ambient (35-40), quiet office 40
Quiet rural ambient, quiet library, soft whisper 30
BWCA with no wind, concert hall 20
BWCA in winter 10
Threshold of hearing 0

APPENDIX B

B-1
LITERATURE EXCERPTS AND COMMENTS
A June 2015 paper appearing in the Society of Automotive Engineers Journal discusses a measurement program completed to assess driver input versus exterior noise generation for four vehicle types and two different rumble strip designs.[2] The vehicles included a small compact car, an immediate size car, a full sport utility vehicle, and a medium duty dump truck. The first rumble strip was a conventional design providing shorter wavelength input to the tire. The second was designed to provide a longer wavelength and more harmonic input to the tire. The measurements included exterior pass-by noise and on-board exterior noise and interior measurements of sound pressure level and vibration level at the seat track and steering column. In general, the results indicated that the longer wavelength strips produced less overall A-weighted exterior pass-by noise with little or no reduction in interior noise and vibration. Considerable variation in the response of the vehicles was found particularly for steering column vibration and interior noise where the overall differences ranged from about 9 to 17 decibels (dB). The exterior measures produced smaller ranges, from 2 to about 7½ dB; however, the rank ordering of vehicle response was different for the pass-by and exterior on-board results. It was concluded that the interior noise and steering column responses were strongly influenced by vehicle specific characteristics both in terms of isolation and modal response. The results of this study are presented in overall dBA and in ⅓ octave band levels that compare the different test vehicles and test rumble strips.
In a comprehensive October 2014 report by Anna Anund for the Swedish National Road and Transport Research Institute, interior and exterior noise levels from different rumble strip designs were evaluated.[3] Milled rumble strips are one way to attract the drivers’ attention when they involuntarily are about to leave the lane. Rumble strips provide both internal and external noise but also vibrations in the vehicle. The overall aim of this work was to elucidate the effects and consequences of the use of intermittent milled rumble strips compared to sinusoidal milled rumble strips in the center of the road. The comparison took into account; external noise, internal noise, vibrations, damage to the road surface and the price. However, due to lack of data, vibrations and price issues were not addressed. The work was based on documentation of lessons learned in Sweden, Denmark, Norway and Finland.
In Denmark, Norway and Sweden, measurements were made of maximum exterior noise levels. There were major variations in results for both intermittent rumble strips and sinusoidal rumble strips. The results showed that the intermittent rumble strips provide an increase in exterior noise of 2 to 8 dBA. The corresponding figure for the sinusoidal rumble strip is an increase of 0 to 4 dBA. Further, it is found that the sinusoidal rumble strips provide more low frequency noise (30–40 Hz) compared with intermittent rumble strips (60–160 Hz). Maximum noise levels from intermittent rumble strips were obtained at around 80–90 km/hr (50-56 mph) and at 90 km/hr (56 mph), at the threshold distance for noise for those living close to the road is 90–140 meters (30-450 ft). The report noted that it is not known at what speed the sinusoidal rumble strip provides the maximum noise level. It further stated that what is perceived as disturbing is not only related to the maximum noise level but also to the fact that the sound deviates from the continuous traffic noise level. The rumble strip sound contains more low frequency and not continuous.

B-2
The report stated that most studies have focused on passenger cars and an increase in internal noise when driving on intermittent rumble strips which varies between 13–17 dBA. For the sinusoidal rumble strip the corresponding values are 1–6 dBA. Whether the lower increase is sufficient to attract the driver's attention has not been evaluated. However, results from simulator studies show that even a low level of internal noise is helpful for drivers who are about to leave the lane due to sleepiness. The sinusoidal rumble strips provide not only noise but also vibrations. The most important component for attracting the driver’s attention is not known, but vibrations do create an important contributing effect. There are almost no studies available on the effects regarding drivers of trucks and buses.
In conclusion, there are no known arguments for not using sinusoidal rumble strips. However, further studies on the impact of drivers of heavy vehicles were recommended. Additional measurements of external noise are needed to estimate how adjacent residents respond to noise without some type of guideline for rumble strip noise. Finally there is a need to understand the main contribution in terms of noise versus vibration.
In a September 2014 report by WSDOT Environmental Services, measurements were collected from seven different rumble strip designs at nine locations in Washington State. These measurements were intended to help WSDOT determine which current designs produced the lowest external noise. Noise from vehicles passing over rumble strips is a major source of complaints from residents living adjacent to highways in Washington state. The project evaluated wayside noise levels from various centerline rumble strip designs to determine overall sound levels and 1/3 octave band frequencies. Results suggest that some designs have lower exterior noise levels and sufficient interior sound levels. However, the effects of specific design variables on exterior noise levels were inconclusive and suggest that interactions among variables contribute to exterior sound levels. The primary research objective was to identify centerline rumble strip (CLRS) designs that can perform similar to the WSDOT standard rumble strip design while reducing external rumble strip noise disturbance at adjacent properties.
To determine the acoustic performance of the tested CLRS, sound level measurements were collected at nine locations with varying CLRS designs. Exterior noise levels, including 1/3 octave band frequencies, and interior sound levels were evaluated along with measurement variability. When vehicles pass over CLRS, overall exterior sound levels are the major contributor to roadside annoyance. SR 410 had the lowest measured overall sound level at the roadside, followed by SR 6 and SR 202. Isolated frequencies can also contribute to annoyance associated with noise especially at lower frequencies that travel farther than “spikes at the high end of the audible frequency range. The SR 410 and SR 22 designs all share an 800 Hz dominant frequency, exhibiting the same general characteristics as a majority of the other measured designs.
SR 10 and SR 6 were the quietest sections and shared the same groove length (8 in) and spacing (12 in) but had different groove depths and widths. In this case, the length and spacing generated consistent exterior noise, which suggests that these dimension components may be important contributors to the variations in exterior noise levels produced by different designs. The CLRS design ranges for the lowest exterior noise levels are the following:
Depth: 0.375 inch to 0.50 inch

B-3
Width: 6 inch to 6.9 inch
Length: 8 inch
Spacing: 12 inch

APPENDIX C

C-1
SOUND MEASUEMENT TEST PROTOCOL
The final test protocol is outlined below.
Test locations
• East-west Minnesota Trunk Highway 18 east of north-south Minnesota Trunk Highway 47 on the east side of Lake Mille Lacs was used for the tests.
• The highway was asphalt paved.
• The highway along the test area was bounded by harvested farm fields, grazing areas and woods.
Interior sound level meter
• The sound level meter mounted on a tripod propped against the back seat and next to the driver
• This permitted the microphone to be in the same position for each test.
Exterior sound level meters
• One meter was placed 50 feet from the rumble strip or edge of pavement; a second meter was placed at 75 feet from the edge of pavement.
• Meters were mounted on tripods 5 feet above ground with wind screens.
Meteorology
• A handheld Kestrel wind meter was used to check wind speed.
• Temperature, wind speed and direction, and relative humidity were compiled.
• Wind speeds were generally 6 to 8 mph for the first three strips tested but increased with gusts of 12 to 15 mph for the Strip 4 tests. The pavement was dry.
Speed Measurement
• All tests were performed at 60 mph determined for the speedometer in each vehicle.
Video
• A video camera was located adjacent to the 50 foot meter.

C-2
Photos
• Photos of each vehicle exterior and interior were taken.
Test Speeds and Number
• The following test speed was used: 60 mph
• For each on-strip pass-by, three tests were performed.
Sound level meters
• All meters were calibrated and synchronized
• Meters used were Larson-Davis Model 831 Type 1 logging sound level meters with audio recording capability
Exterior meter measurements
• Measurements were started approximately 5 to 7 seconds before pass-by and continued for approximately 5 seconds after the pass-by
• One-third octave band readings were taken with simultaneous digital audio recording
• 1-second readings were taken to permit evaluation of pass-by histories and establish the maximum pass-by level.
• Data were stored and documented after each test
Interior meter measurements
• Measurements began at the start of acceleration and continued for approximately 5 seconds after.
• One-third octave band readings were taken with simultaneous digital audio recording
• 1-second readings were taken to permit evaluation of time histories
• Readings were time-matched with exterior measurements to ensure synchronization of the exterior and interior tests.
Traffic control
• No traffic control was implemented. Tests were performed when no other vehicles were present.

APPENDIX D

D-1
AUDIO RECORDINGS
(INTERIOR AND EXTERIOR AT 50 FEET)
Meter 1 Exterior 50 ft. Meter 3 Interior
1 M1-Car-NO.wav M3-Car-NO.wav
2 M1-Car-S1.wav M3-Car-S1.wav
3 M1-Car-S2.wav M3-Car-S2.wav
4 M1-Car-S3.wav M3-Car-S3.wav
5 M1-Car-S4.wav M3-Car-S4.wav
6 M1-Pick-NO.wav M3-Pick-NO.wav
7 M1-Pick-S1.wav M3-Pick-S1.wav
8 M1-Pick-S2.wav M3-Pick-S2.wav
9 M1-Pick-S3.wav M3-Pick-S3.wav
10 M1-Pick-S4.wav M3-Pick-S4.wav
11 M1-Truck-NO.wav M3-Truck-NO.wav
12 M1-Truck-S1.wav M3-Truck-S1.wav
13 M1-Truck-S2.wav M3-Truck-S2.wav
14 M1-Truck-S3.wav M3-Truck-S3.wav
15 M1-Truck-S4.wav M3-Truck-S4.wav

APPENDIX E
MOTORCYCLE SURVEY

E-1
Pre-participation Survey You are here today because we value your perspectives. MnDOT is collecting data for a study of rumble strip alternatives and their impact on motorcycle riders. Please complete this survey to the best of your ability. We welcome candid responses. Please help us better understand the experiences of motorcycle riders’ interaction with rumble strips. This survey is anonymous and voluntary. Your responses may be published in a written report or presentations; however, your identity will not. Thank you for taking your time to complete this survey. 1) Please arrange in order of 1 =-HIGHEST risk to 5=-LOWEST risk; when you ride a motorcycle, what items do you feel are the greatest threats to your safety? Roadway 1=highest risk-5=lowest risk __Sharp curves __Sand or gravel on road surface __Faded pavement markings __Rumble strips on the edge of the road __Rumble strips on the center of the road Other drivers’ behavior 1=highest risk-5=lowest risk
__Drifting over the centerline __Distracted driving __Speeding __Intoxication __Drowsiness
2) Are you familiar with rumble strips? Yes / No 3) In your view, why are rumble strips installed on the edge of roads?-
_____________________________________________________________________________________
_____________________________________________________________________________________
_____________________________________________________________________________________
4) Have you ever driven on the rumble strip itself? Yes / No 5) If yes, think about your experience with EDGE LINE RUMBLE strips. On a scale of 1 to 6, please indicate your level of agreement with the following statements. 1
Agree completely
2 Agree
3 Somewhat agree
4 Somewhat disagree
5 Disagree
6 Disagree completely
I was able to control my bike as I crossed the rumble strip
Centerline
Edge line

E-2
I had trouble steering as I crossed the rumble strip
My bike lost traction as I crossed the rumble strip
The rumble strip created enough vibration to get my attention
The sound of crossing the rumble strips was loud enough to get my attention
I felt comfortable crossing this rumble strip
Rumble strips help me stay safe on the road.
How do you think other motorcycle riders would react to these rumble strips? Other motorcycle riders may have trouble controlling their bikes when they cross this rumble strip
The vibration of this rumble strip would sufficiently alert other motorcycle riders when they drift out of their lane.
The sound of this rumble strip would sufficiently alert other motorcycle riders when they drift out of their lane.
Other motorcycle riders would feel comfortable crossing this rumble strip
6) In your view, why are rumble strips installed on the centerline of roads? _____________________________________________________________________________________
____________________________________________________________________________________
7) Have you driven on a road with rumble strips on the centerline? Yes / No 8) Have you ever driven on the centerline rumble strip itself? Yes / No 9) If yes, think about your experience with CENTERLINE RUMBLE STRIPS. On a scale of 1 to 6, please indicate your level of agreement with the following statements.

E-3
1 Agree completely
2 Agree
3 Somewhat agree
4 Somewhat disagree
5 Disagree
6 Disagree completely
I was able to control my bike as I crossed the rumble strip
I had trouble steering as I crossed the rumble strip
My bike lost traction as I crossed the rumble strip
The rumble strip created enough vibration to get my attention
The sound of crossing the rumble strips was loud enough to get my attention
I felt comfortable crossing this rumble strip
Rumble strips help me stay safe on the road.
How do you think other motorcycle riders would react to these rumble strips? Other motorcycle riders may have trouble controlling their bikes when they cross this rumble strip
The vibration of this rumble strip would sufficiently alert other motorcycle riders when they drift out of their lane.
The sound of this rumble strip would sufficiently alert other motorcycle riders when they drift out of their lane.
Other motorcycle riders would feel comfortable crossing this rumble strip

E-4
10) Have rumble strips ever alerted you when your motorcycle unintentionally drifted? Yes / No 11) Have you ever experienced a rumble strip alerting you before leaving the roadway? Yes / No 12) Have rumble strips ever alerted you when you were drowsy? Yes / No 13) Have rumble strips ever alerted you that another vehicle drifted into your lane? Yes / No 14) From the perspective of a motorcycle rider, please share any additional thoughts or experiences you may have had with rumble strips:
If you are interested in receiving a copy of the final report, please be sure to complete the Request Copy portion of your waiver. Thank you!

E-5
Post Participation Survey Thank you for participating in our field test. We would like to know more about your experience with specific rumble strips you encountered today. For each type of rumble strip tested please indicate your level of agreement or disagreement with the following statements. This section intentionally left blank.

E-6
Test Strip 1 TURQUOISE Centerline Think about your experience with 14” wide, 16” wavelength with taper sinusoidal rumble strips on the centerline. On a scale of 1 to 6, please indicate your level of agreement with the following statements.
1 Agree completely
2 Agree 3 Agree somewhat
4 Disagree somewhat
5 Disagree 6 Disagree completely
I was able to control my bike as I crossed the rumble strip
I had trouble steering as I crossed the rumble strip
My bike lost traction as I crossed the rumble strip
The rumble strip created enough vibration to get my attention
The sound of crossing the rumble strips was loud enough to get my attention
I felt comfortable crossing this rumble strip
Rumble strips help me stay safe on the road.
How do you think other motorcycle riders would react to these rumble strips? Other motorcycle riders may have trouble controlling their bikes when they cross this rumble strip
The vibration of this rumble strip would sufficiently alert other motorcycle riders when they drift out of their lane.
The sound of this rumble strip would sufficiently alert other motorcycle riders when they drift out of their lane.
Other motorcycle riders would feel comfortable crossing this rumble strip.

E-7
Think about your experience with 14” wide, 16” wavelength without taper sinusoidal rumble strips on the centerline. On a scale of 1 to 6, please indicate your level of agreement with the following statements.
1 Agree completely
2 Agree 3 Agree somewhat
4 Disagree somewhat
5 Disagree 6 Disagree completely
I was able to control my bike as I crossed the rumble strip
I had trouble steering as I crossed the rumble strip
My bike lost traction as I crossed the rumble strip
The rumble strip created enough vibration to get my attention
The sound of crossing the rumble strips was loud enough to get my attention
I felt comfortable crossing this rumble strip
Rumble strips help me stay safe on the road.
How do you think other motorcycle riders would react to these rumble strips? Other motorcycle riders may have trouble controlling their bikes when they cross this rumble strip
The vibration of this rumble strip would sufficiently alert other motorcycle riders when they drift out of their lane.
The sound of this rumble strip would sufficiently alert other motorcycle riders when they drift out of their lane.
Other motorcycle riders would feel comfortable crossing this rumble strip.

E-8
Test Strip 3 GREEN Think about your experience with two 8” wide sinusoidal rumble strips separated by 4” pavement on centerline. On a scale of 1 to 6, please indicate your level of agreement with the following statements.
1 Agree completely
2 Agree 3 Agree somewhat
4 Disagree somewhat
5 Disagree 6 Disagree completely
I was able to control my bike as I crossed the rumble strip
I had trouble steering as I crossed the rumble strip
My bike lost traction as I crossed the rumble strip
The rumble strip created enough vibration to get my attention
The sound of crossing the rumble strips was loud enough to get my attention
I felt comfortable crossing this rumble strip
Rumble strips help me stay safe on the road.
How do you think other motorcycle riders would react to these rumble strips? Other motorcycle riders may have trouble controlling their bikes when they cross this rumble strip
The vibration of this rumble strip would sufficiently alert other motorcycle riders when they drift out of their lane.
The sound of this rumble strip would sufficiently alert other motorcycle riders when they drift out of their lane.
Other motorcycle riders would feel comfortable crossing this rumble strip.

E-9
Test Strip 4 Blue Think about your experience with the Standard MnDOT Rumble Strip on the Centerline. On a scale of 1 to 6, please indicate your level of agreement with the following statements.
1 Agree completely
2 Agree 3 Agree somewhat
4 Disagree somewhat
5 Disagree 6 Disagree completely
I was able to control my bike as I crossed the rumble strip
I had trouble steering as I crossed the rumble strip
My bike lost traction as I crossed the rumble strip
The rumble strip created enough vibration to get my attention
The sound of crossing the rumble strips was loud enough to get my attention
I felt comfortable crossing this rumble strip
Rumble strips help me stay safe on the road.
How do you think other motorcycle riders would react to these rumble strips? Other motorcycle riders may have trouble controlling their bikes when they cross this rumble strip
The vibration of this rumble strip would sufficiently alert other motorcycle riders when they drift out of their lane.
The sound of this rumble strip would sufficiently alert other motorcycle riders when they drift out of their lane.
Other motorcycle riders would feel comfortable crossing this rumble strip.

E-10
Test Strip 5 RED Think about your experience with 14” wide, 14” wavelength with taper sinusoidal rumble strips on the centerline. On a scale of 1 to 6, please indicate your level of agreement with the following statements.
1 Agree completely
2 Agree 3 Agree somewhat
4 Disagree somewhat
5 Disagree 6 Disagree completely
I was able to control my bike as I crossed the rumble strip
I had trouble steering as I crossed the rumble strip
My bike lost traction as I crossed the rumble strip
The rumble strip created enough vibration to get my attention
The sound of crossing the rumble strips was loud enough to get my attention
I felt comfortable crossing this rumble strip
Rumble strips help me stay safe on the road.
How do you think other motorcycle riders would react to these rumble strips? Other motorcycle riders may have trouble controlling their bikes when they cross this rumble strip
The vibration of this rumble strip would sufficiently alert other motorcycle riders when they drift out of their lane.
The sound of this rumble strip would sufficiently alert other motorcycle riders when they drift out of their lane.
Other motorcycle riders would feel comfortable crossing this rumble strip.

E-11
Test Strip 6 PINK Think about your experience with 14” wide, 14” wavelength without taper sinusoidal rumble strips on the centerline. On a scale of 1 to 6, please indicate your level of agreement with the following statements.
1 Agree completely
2 Agree 3 Agree somewhat
4 Disagree somewhat
5 Disagree 6 Disagree completely
I was able to control my bike as I crossed the rumble strip
I had trouble steering as I crossed the rumble strip
My bike lost traction as I crossed the rumble strip
The rumble strip created enough vibration to get my attention
The sound of crossing the rumble strips was loud enough to get my attention
I felt comfortable crossing this rumble strip
Rumble strips help me stay safe on the road.
How do you think other motorcycle riders would react to these rumble strips? Other motorcycle riders may have trouble controlling their bikes when they cross this rumble strip
The vibration of this rumble strip would sufficiently alert other motorcycle riders when they drift out of their lane.
The sound of this rumble strip would sufficiently alert other motorcycle riders when they drift out of their lane.
Other motorcycle riders would feel comfortable crossing this rumble strip.
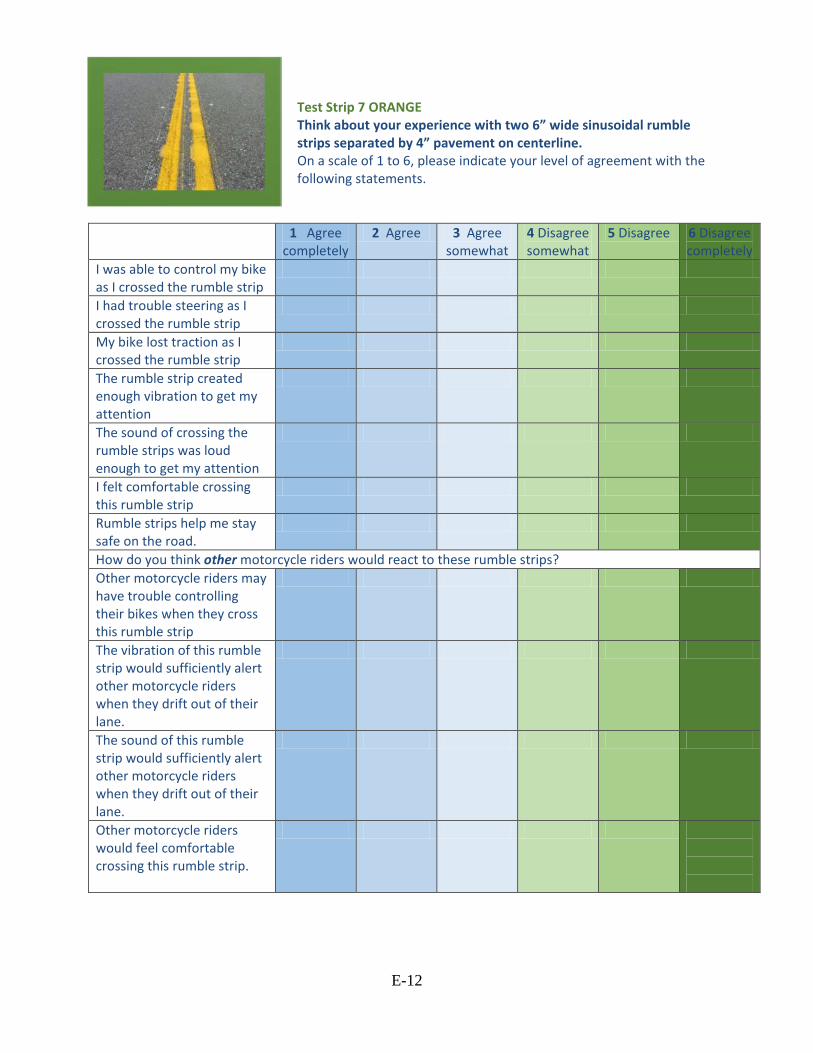
E-12
Test Strip 7 ORANGE Think about your experience with two 6” wide sinusoidal rumble strips separated by 4” pavement on centerline. On a scale of 1 to 6, please indicate your level of agreement with the following statements.
1 Agree completely
2 Agree 3 Agree somewhat
4 Disagree somewhat
5 Disagree 6 Disagree completely
I was able to control my bike as I crossed the rumble strip
I had trouble steering as I crossed the rumble strip
My bike lost traction as I crossed the rumble strip
The rumble strip created enough vibration to get my attention
The sound of crossing the rumble strips was loud enough to get my attention
I felt comfortable crossing this rumble strip
Rumble strips help me stay safe on the road.
How do you think other motorcycle riders would react to these rumble strips? Other motorcycle riders may have trouble controlling their bikes when they cross this rumble strip
The vibration of this rumble strip would sufficiently alert other motorcycle riders when they drift out of their lane.
The sound of this rumble strip would sufficiently alert other motorcycle riders when they drift out of their lane.
Other motorcycle riders would feel comfortable crossing this rumble strip.

E-13
For classification purposes please answer the following demographic questions. 1) Date of birth: ___/____/____
2) Sex: Male Female
3) What is the make and model of the motorcycle you rode today?
4) How many years have you been riding a motorcycle? ______ a. Are these consecutive years? Yes / No b. IF NO, what year did you most recently start riding motorcycles again? _______
i.e. did you ride several years ago then stopped and then began riding again in….
5) How many years have you had a motorcycle endorsement on your driver’s license? ______
6) In the past, have you taken any motorcycle training courses? Yes / No
7) From the perspective of a motorcycle rider, please share any additional thoughts or
experiences you had with the rumble strips you tested today:
If you are interested in receiving a copy of the final report, please be sure to complete the Request Copy portion of your waiver. Thank you!