singapore food service - hotel restaurant … gain publications/food service...singapore is the...
TRANSCRIPT

THIS REPORT CONTAINS ASSESSMENTS OF COMMODITY AND TRADE ISSUES MADE BY
USDA STAFF AND NOT NECESSARILY STATEMENTS OF OFFICIAL U.S. GOVERNMENT
POLICY
Date:
GAIN Report Number:
Approved By:
Prepared By:
Report Highlights:
Singapore has a vibrant, highly dynamic and competitive Hotel, Restaurant, and Institutional (HRI)
sector. Strong demand by business travelers and rising number of tourists drive the HRI sector offering
opportunities for U.S. exporters. This sector serviced some 5.5 million residents and 16.4 million
tourists and business visitors in 2016. Tourist receipts totaled $18.2 billion, of which $2.06 billion were
for food and beverage. Leading HRI prospects include U.S. seafood, prime beef cuts, dairy and
specialty fruits and wines.
Post:
Singapore
Alice Kwek, Agricultural Marketing Specialist
Joani Dong, Regional Agricultural Attaché
Malaysia, Singapore, Brunei and Papua New Guinea
Annual 2017
Food Service - Hotel Restaurant Institutional
Singapore
SN7012
11/1/2017
Required Report - public distribution

GAIN REPORT: HRI Annual 2017 Page 2
Table of Contents
SECTION I. MARKET SUMMARY .......................................................................................... 3
SECTION II. ROAD MAP FOR MARKET ENTRY ................................................................ 10
SECTION III: COMPETITION .................................................................................................. 25
SECTION IV: BEST PRODUCT PROSPECTS .......................................................................... 25
APPENDIX: POST CONTACT AND FURTHER INFORMATION ....................................... 29

GAIN REPORT: HRI Annual 2017 Page 3
SECTION I. MARKET SUMMARY
1. Singapore in overview
Singapore, with a population of 5.6 million, is a fairly wealthy country and a highly developed market
economy as a highly urbanized island. Singapore is one of the most advanced consumer markets among
the ten Association of Southeast Asian Nations (ASEAN)* member countries. The structure of the
resident population is diverse and ranges from lower income group Singaporeans living in government
subsidized apartments locally known as “Housing Development Board” (HDB) to wealthy Singaporeans
and to the higher income group expatriates. This situation underpins a Hotel, Restaurant, Institutional
(HRI) food service sector that ranges from basic cooked food stalls/casual street stalls operating in local
food centers located in residential heartlands to fine dining/super-premium restaurants operating at a
single site outlet and located in 4, 5, 6-star hotels and retail shopping malls, local-owned including those
by foreign celebrity chefs. Between these two types of operations are a sizeable mid-range group of fast
food, Quick Service Restaurant (QSR), casual dining and air-conditioned food courts in shopping malls
and Full Service Restaurant (FSR).
Singapore, ranked as the world’s number one in terms of ease of doing business, is almost entirely
dependent upon imports for all of its food requirements with virtually no local agricultural production.
It has a very small food processing industry, and its market is a captive market for a wide range of food
and drinks used in its HRI/food service channels. It imports almost 90 percent of its food requirement,
with no import tariffs or excise taxes for all food and beverages (except for alcoholic beverages and
tobacco products), but a Goods and Services Tax (GST) of 7 percent is levied for all goods and services
at the point of distribution. This situation provides U.S. products with opportunities in a diverse range
of channels, e.g., U.S. frozen chicken parts demanded by lower end cooked food stall operators as well
as U.S. premium seafood demanded by 5-star hotels and seafood restaurants.
*a political and economic organization of ten Southeast Asian countries formed on 8 August 1967, member countries include Brunei,
Cambodia, Indonesia, Laos, Malaysia, Myanmar (Burma) the Philippines, Singapore, Thailand, and Vietnam
2. The food service market
The consumer food service sector in Singapore was valued at US$6 billion in 2016. Singaporeans and
expatriates can often eat in a wide range of different food service outlets during the day (some food
stalls/coffee shops are open through the night), for example, at a local coffee shop in the morning, a
food court at lunch time and/or restaurant or casual dining at night. In any one day, consumers can eat a
Malay breakfast, Chinese lunch and an American dinner. Between meals could be coffee from
Starbucks or local chained coffee outlet such as Toast Box, or YaKun or Wang, or a bowl of local
noodles from a cooked food stall in food courts/food centers in shopping malls located in suburbs or
“heartlands” where residents live.
Singaporeans were Asia’s top spenders on dining, the average Singaporean spends US$200 a month on
eating out at hawker centers, restaurants, and cafés, Food courts are the most popular as they are found
all over the island, with at least one in every mall and several in and around housing estates. On
average, in a month, customers patronize food courts 15 times, quick-serve restaurants 7 times and fine
dining restaurants 2 to 3 times.
Singaporeans spend more on dining out because of their busier lifestyles, increase in dining options, and
word-of-mouth recommendations via social media. On average, consumers can buy a decent meal

GAIN REPORT: HRI Annual 2017 Page 4
Restaurants, 2,660,
37%
Others, 3,723, 51%
Fast Food Outlets,
470, 6%
Food Caterers, 407,
6%
Food & Beverage Services Industry Singapore 2015Total Establishments - 7,260
Restaurants Others Fast Food Outlets Food Caterers
including drinks for around US$5-US$8 when dining at food courts.
Singaporeans like good bargains, with 34% booking dining deals on coupon sites or via mobile phone
apps, and 51% checking out credit card promotions. When deciding on a dining venue, 52% checks
online reviews of eateries and 46% seeks recommendations from families, friends or colleagues. If a
meal or dish comes highly recommended, Singaporeans are willing to travel across the island to sample
the food.
3. The HRI sector
Singapore’s HRI industry is extremely competitive with the number of food service outlets and sales
growing about 3 and 4% respectively. The HRI sector services about 5.6 million residents and 16
million tourists and business visitors per annum. Within the resident population of 3.9 million are a
sizable number of expatriate families and Chinese comprise 74.3% of the total population. Tourists
stayed in Singapore for an average of around 3.4 days per visit in 2016, and about 60% of these persons
stayed in a hotel. Tourism receipts from food and beverage totaled 2.06 billion in 2016.
In 2015, there were about 7,260 establishments in the food & beverage (F&B) services industry.
Operating receipts in the F&B services industry totaled US$6,642. Restaurants and fast food outlets
recorded increases in operating surplus while food caterers and other F&B services reported declines in
2015. Restaurants were the largest contributor in terms of value added, accounting for 38% of the
industry’s total value added in 2015.
Singapore’s HRI industry is highly competitive with the number of food service outlets and sales
growing about 3 and 4% respectively. The top 3 business costs, i.e. purchases of raw materials,
remuneration and rentals of premises accounted for almost 80% of total business costs.

GAIN REPORT: HRI Annual 2017 Page 5
Key Trends/Developments in the HRI Sector:
Changing Food Landscape. Food Landscape is changing as a result of the introduction and
preference of more foreign foods. The restaurant scene is getting more vibrant. As of 2016,
Singapore is the first Southeast Asian country, or the fourth Asian territory, after Japan, Hong
Kong and Macau to be rated by the Michelin Guide long regarded as the world's foremost
authority of culinary merit. The influential guide, Michelin Guide in Singapore 2016
(https://guide.michelin.sg/2016-michelin-guide-singapore-launches) is expected to boost
patronage for the 200 recognized players in more than 35 different cuisine categories and food
establishments.
Opening of New Age Food Courts. Competition in the food courts scene is getting stiff, and to
differentiate from the masses, recently opened food courts offer gourmet choices, and/or “theme”
or “cuisine-specific” offering a more unique dining experience.
Stable Growth. There was stable growth in the food service industry in 2016. In Singapore,
eating out is common due availability of hawker centers, food courts, coffee shops and casual
dining places which provide many local dishes at affordable prices. Singaporeans are clocking
more work hours and less time is spent cooking, which means opting for “meals to go” and or
meals at casual dining cafes, food courts or opting for fast food.
In terms of full-service restaurants, local foodservice operators take the lead. Compared to
international players, major local players, Crystal Jade and Tung Lok Restaurants rank tops in
full-service restaurants in 2016 with their interesting cuisines and concepts. However,
consumers tend to have the perception that dining out in full-service restaurants is expensive and
usually reserved for special occasions such as birthdays, anniversaries, and family gatherings.
Franchising – Local/Asian and Foreign. Franchise type with casual dining chains and fast food
chains is prevalent and popular in Singapore, for example, ABR Holdings Ltd which is the
franchisee of Swensen’s. In 2016, McDonald’s sold franchise rights in Singapore and Malaysia
to Saudia’s Group, Lionhorn Pte. Ltd., which is currently the franchisee for McDonald’s in
Western and Southeast Regions of Saudi Arabia.
Korean cuisine are getting even more attention and are finding successes with consumers here
because of the influence by K-pop and K-dramas. More and more Korean eateries are springing
up in malls and food courts. Korean fried chicken franchises such as Bonchon, and Chir Chir
can be found here; as well as desserts such as Bingsus (shaved ice with toppings), Churros are
gaining popularity.
Retailers Investment in Consumer Foodservice. Malls such as Wisma Atria (Orchard Road),
Emporium Shokuhin (Marina Square), Suntec City (Marina) with dedicated sections offering
Japanese dining options to woo more customers to shop and dine at the malls. This concept is
provided stronger branding and greater business synergy through collaboration rather than
operating as a standalone restaurant.
Retailers such as Muji and Marks & Spencer have food and beverage cafés within their stores to

GAIN REPORT: HRI Annual 2017 Page 6
encourage more shoppers to linger.
Increased Operating Costs and Growing Manpower Crunch. The industry continues to struggle
with a growing manpower crunch and rising rental costs. There is a high turnover in the sector
and dependence on foreign labor.
Food Technology. Players are making greater use of technology, for example, iPads are used for
displaying menus and ordering, to lighten manpower requirements. Self-ordering kiosks/stations
have become more common and adopted by fast food chains such as McDonald’s and Popeyes’.
Smart robots are used in local “Koufu” food court to collect food trays from humans
(Singaporeans aren’t in the habit of returning trays).
Increased Interest in Healthier Meals. The local health authorities’: Healthy Dining Program has
spurred consumers’ interest to eat healthier meals, which in turn encourage players to offer more
healthy options on their menus.
Thirty party delivery service. Singaporeans are the most tech savvy, and has become the most
suitable test pad for new innovations and services in Asia Pacific. The market value of food
delivery industry in Singapore was US$61 million in 2016, or in per capita terms, Singaporeans
spent US$22 on food delivery, and the value is set to increase in the next few years as eating is a
national pastime. The option of food delivery appeals to busy employees.
Food Panda, and Deliveroo are the most popular players in food delivery. Food Panda offers
consumers the convenience of on-demand delivery with choices from fast food, fast casual
restaurants such as Burger King, Yoshinoya (Japanese), Carl’s Jr., Swensens and The Manhattan
Fish Market. Deliveroo and UberEats, are recent entrants with a different positioning, providing
delivery service for restaurants and cafés. A latest entrant on food delivery scene is PorterFetch
that delivers to night owls from 9.00 p.m. to 1.00 a.m.
Food delivery provides an extra avenue for players to sell and reach out to consumers. Although
there is still room for growth in the food delivery industry, new business models and
partnerships and differentiation should be adopted in order to stay ahead of the competition.
Singapore Government’s 23 Industry-Specific Roadmaps for the Future. The consumer
foodservice industry has been identified as one of 23 roadmaps and is the first to be rolled out in
2016. The Singapore Government aims to achieve an annual productivity growth target of 2%
for the consumer foodservice industry without any staff increase over the next five years through
adoption of technology in the restaurant area, digital kiosks and iPad ordering. SPRING
Singapore, an agency under the Ministry of Trade and Industry has been tasked to help
Singaporean enterprises grow. Companies will be provided grant support through 2018 for
adopting digital services solutions.
Market Data
Table 1 - Units, Transactions and Value Sales in Consumer Foodservice 2011-2016

GAIN REPORT: HRI Annual 2017 Page 7
2011 2012 2013 2014 2015 2016
Units 26,774.0 26,808.0 27,100.0 27,375.0 27,722.0 27,954.0
Transactions (million) 646.7 660.7 678.2 680.7 687.5 700.0
USD billion current prices 5.4 5.6 5.7 5.9 5.9 5.6
USD billion constant prices 5.4 5.3 5.4 5.5 5.5 5.6
Table 2 - Consumer Foodservice by Independent vs Chained: Units/Outlets 2016
Outlets Independent Chained Total
100% Home Delivery/Takeaway 19.0 170.0 189.0
Cafés/Bars 1,682.0 581.0 2,263.0
Full-Service Restaurants 1,268.0 527.0 1,795.0
Fast Food 40.0 1,495.0 1,535.0
Self-Service Cafeterias - 5.0 5.0
Street Stalls/Kiosks 20,154.0 2,013.0 22,167.0
Pizza Consumer Foodservice 41.0 171.0 212.0
Consumer Foodservice by Type 23,163.0 4,791.0 27,954.0
Table 3 - Global Brand Name Brand Shares in Chained Consumer Foodservice:
% Foodservice Value 2012-2016
% value Global Brand Owner 2013 2014 2015 2016
McDonald's McDonald's Corp 16.8 16.3 16.4 16.3
KFC Yum! Brands Inc 5.7 5.9 6.0 6.1
Din Tai Fung Fairy Rise Development Ltd 2.3 2.8 2.9 3.3
Subway Doctor's Associates Inc 2.6 2.7 2.7 2.8
Starbucks Starbucks Corp 2.1 2.1 2.4 2.7
7-Eleven Seven & I Holdings Co Ltd 3.0 2.6 2.5 2.5
Pizza Hut Yum! Brands Inc 2.6 2.6 2.5 2.5
Coffee Bean & Tea Leaf, The International Coffee & Tea LLC 1.6 1.7 1.8 2.1
Tung Lok Restaurants Tung Lok Restaurants (2000) Ltd 2.0 2.0 2.0 2.0
Crystal Jade Crystal Jade Culinary Concepts Holding 2.6 2.5 2.2 1.9
Old Chang Kee Ten & Han Trading Pte Ltd 1.7 1.7 1.8 1.8
Burger King Restaurant Brands International Inc - 1.7 1.6 1.7
Sakae Sushi Sakae Holdings 2.0 1.9 1.5 1.4
Soup Restaurant Soup Restaurant Group Ltd 1.2 1.2 1.2 1.2
Swensen's CoolBrands International Inc 1.1 1.2 1.2 1.2
ThaiExpress Minor International PCL 1.3 1.2 1.2 1.2
GAIN REPORT: HRI Annual 2017 Page 8
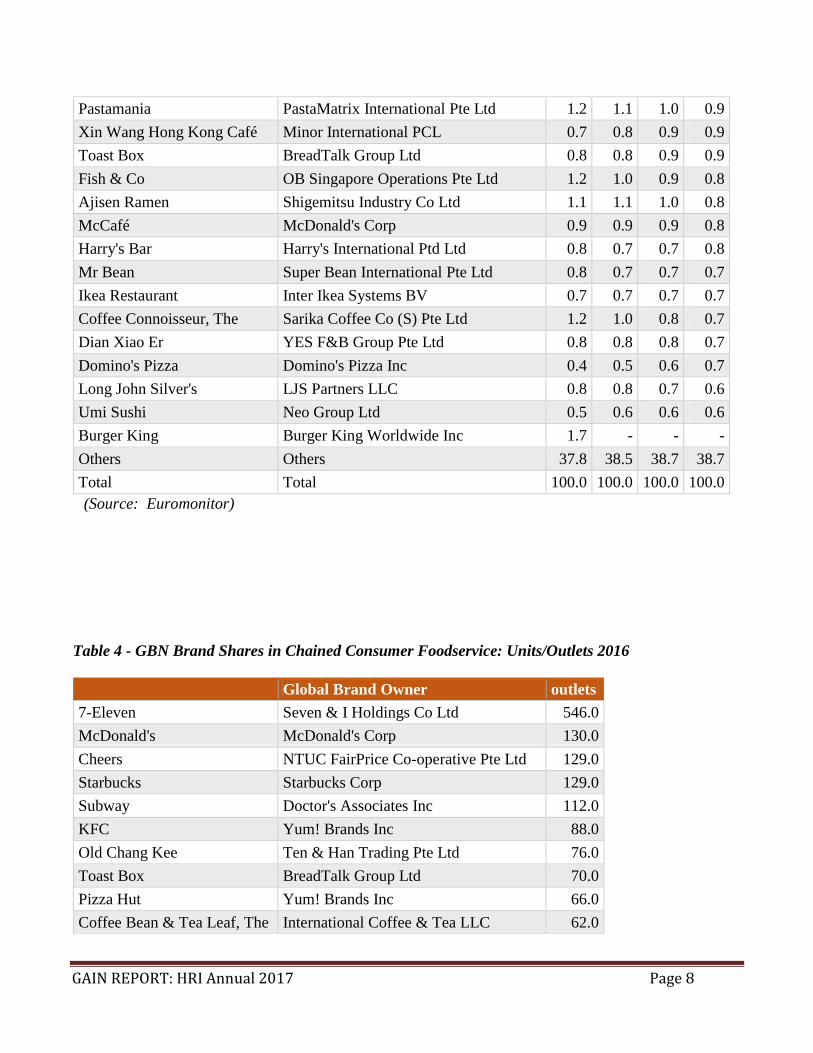
Pastamania PastaMatrix International Pte Ltd 1.2 1.1 1.0 0.9
Xin Wang Hong Kong Café Minor International PCL 0.7 0.8 0.9 0.9
Toast Box BreadTalk Group Ltd 0.8 0.8 0.9 0.9
Fish & Co OB Singapore Operations Pte Ltd 1.2 1.0 0.9 0.8
Ajisen Ramen Shigemitsu Industry Co Ltd 1.1 1.1 1.0 0.8
McCafé McDonald's Corp 0.9 0.9 0.9 0.8
Harry's Bar Harry's International Ptd Ltd 0.8 0.7 0.7 0.8
Mr Bean Super Bean International Pte Ltd 0.8 0.7 0.7 0.7
Ikea Restaurant Inter Ikea Systems BV 0.7 0.7 0.7 0.7
Coffee Connoisseur, The Sarika Coffee Co (S) Pte Ltd 1.2 1.0 0.8 0.7
Dian Xiao Er YES F&B Group Pte Ltd 0.8 0.8 0.8 0.7
Domino's Pizza Domino's Pizza Inc 0.4 0.5 0.6 0.7
Long John Silver's LJS Partners LLC 0.8 0.8 0.7 0.6
Umi Sushi Neo Group Ltd 0.5 0.6 0.6 0.6
Burger King Burger King Worldwide Inc 1.7 - - -
Others Others 37.8 38.5 38.7 38.7
Total Total 100.0 100.0 100.0 100.0
(Source: Euromonitor)
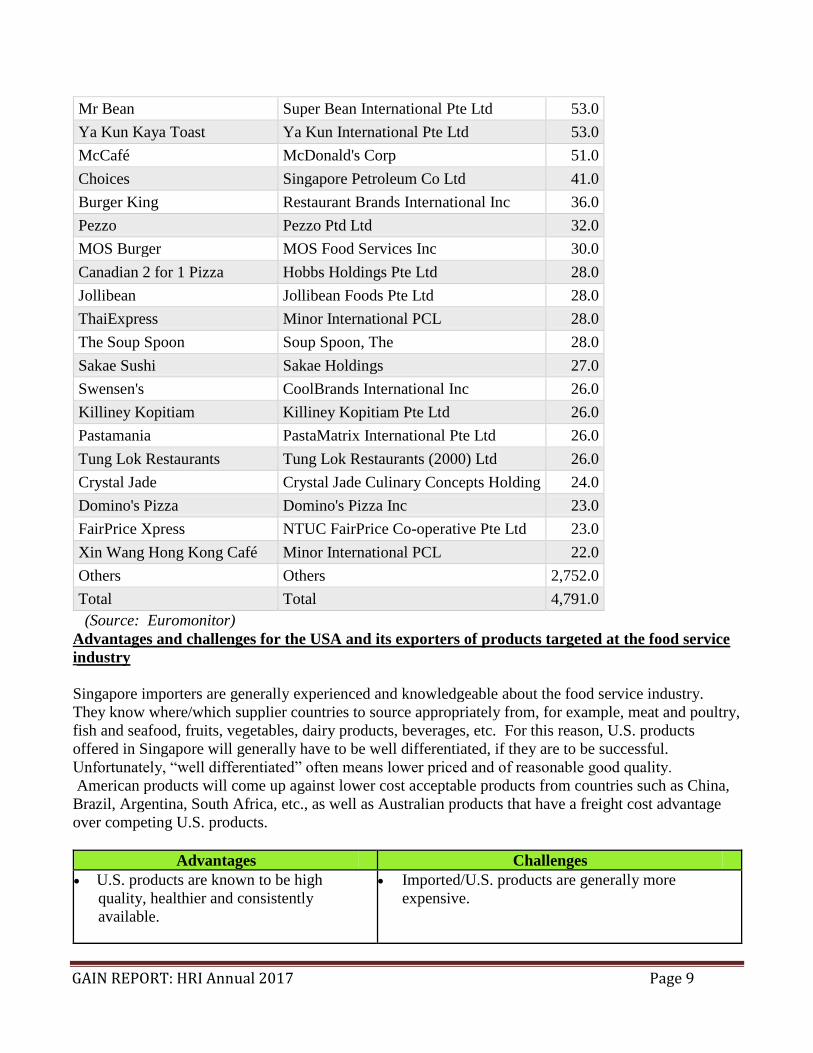
Table 4 - GBN Brand Shares in Chained Consumer Foodservice: Units/Outlets 2016
Global Brand Owner outlets
7-Eleven Seven & I Holdings Co Ltd 546.0
McDonald's McDonald's Corp 130.0
Cheers NTUC FairPrice Co-operative Pte Ltd 129.0
Starbucks Starbucks Corp 129.0
Subway Doctor's Associates Inc 112.0
KFC Yum! Brands Inc 88.0
Old Chang Kee Ten & Han Trading Pte Ltd 76.0
Toast Box BreadTalk Group Ltd 70.0
Pizza Hut Yum! Brands Inc 66.0
Coffee Bean & Tea Leaf, The International Coffee & Tea LLC 62.0
GAIN REPORT: HRI Annual 2017 Page 9
Mr Bean Super Bean International Pte Ltd 53.0
Ya Kun Kaya Toast Ya Kun International Pte Ltd 53.0
McCafé McDonald's Corp 51.0
Choices Singapore Petroleum Co Ltd 41.0
Burger King Restaurant Brands International Inc 36.0
Pezzo Pezzo Ptd Ltd 32.0
MOS Burger MOS Food Services Inc 30.0
Canadian 2 for 1 Pizza Hobbs Holdings Pte Ltd 28.0
Jollibean Jollibean Foods Pte Ltd 28.0
ThaiExpress Minor International PCL 28.0
The Soup Spoon Soup Spoon, The 28.0
Sakae Sushi Sakae Holdings 27.0
Swensen's CoolBrands International Inc 26.0
Killiney Kopitiam Killiney Kopitiam Pte Ltd 26.0
Pastamania PastaMatrix International Pte Ltd 26.0
Tung Lok Restaurants Tung Lok Restaurants (2000) Ltd 26.0
Crystal Jade Crystal Jade Culinary Concepts Holding 24.0
Domino's Pizza Domino's Pizza Inc 23.0
FairPrice Xpress NTUC FairPrice Co-operative Pte Ltd 23.0
Xin Wang Hong Kong Café Minor International PCL 22.0
Others Others 2,752.0
Total Total 4,791.0
(Source: Euromonitor)
Advantages and challenges for the USA and its exporters of products targeted at the food service
industry
Singapore importers are generally experienced and knowledgeable about the food service industry.
They know where/which supplier countries to source appropriately from, for example, meat and poultry,
fish and seafood, fruits, vegetables, dairy products, beverages, etc. For this reason, U.S. products
offered in Singapore will generally have to be well differentiated, if they are to be successful.
Unfortunately, “well differentiated” often means lower priced and of reasonable good quality.
American products will come up against lower cost acceptable products from countries such as China,
Brazil, Argentina, South Africa, etc., as well as Australian products that have a freight cost advantage
over competing U.S. products.
Advantages Challenges
U.S. products are known to be high
quality, healthier and consistently
available.
Imported/U.S. products are generally more
expensive.

GAIN REPORT: HRI Annual 2017 Page 10
Growing popularity of convenience and
fast foods – especially U.S. fast foods -
favors use of these chains’ existing
procurement systems which source food
ingredients from the States.
Singapore is a major importer of food
products; in fact, 90% of its foods are
imported from 160 countries including
beef, dairy products, fresh fruits and
vegetables.
International restaurants, cafés, fast food
outlets and hotel chains are increasing.
Singapore’s HRI sector is dynamic,
thriving and expected to continue to
grow.
Singapore is one of the wealthiest
markets in the region and has one of the
most liberal markets in the world.
There is a rising trend in Singapore on eating
“healthier” food. Fast food is often associated
with eating extra calories (contains higher fat,
sugar and salt content) and are considered as
“junk” food.
Competition remains strong, especially from
“traditional” food supplying countries of
Australia, New Zealand, China, Malaysia and
other regional countries. They are also generally
cheaper than U.S. products.
Scarce labor and also difficult/expensive to hire
workers from neighboring countries due to
government’s policy on foreign workers.
Labor and promotional/marketing costs are
generally more expensive than regional countries.
Also, the HRI sector is relatively fragmented.
Concerns about developing crisis/economy
slowdowns in Europe/China and negative impact
on Singapore’s economy.
SECTION II. ROAD MAP FOR MARKET ENTRY
A. ENTRY STRATEGY
The United States generally has a good image as a supplier of food and drinks in Singapore with a few
exceptions for importers. Some importers comment that selected U.S. exporters are inflexible, short
sighted and have problems in their product and packaging portfolio, as compared to local demand traits.
This situation exists because many U.S. exporters tend to assume that the Singapore market and supply
chain operates in a similar manner to that in the United States.
As there are often similar types of product competing for the same segment, U.S. exporters have to take
into account what Singaporean importers are interested in and its adaptability in local/international
cuisines, which include the following points:
Unique products or functionality (now including convenience aspects) that are interesting to

GAIN REPORT: HRI Annual 2017 Page 11
buyers and end users;
Specialty products that can attract a higher margin;
Good brands, i.e. usually the No. 1 to 3 in their home market;
International quality products that stand up to competition from Europe, Australia and New
Zealand, which set the benchmarks in many food service supply market segments.
Participative exporters who will support their products in the market, i.e., on-going funding for
relevant marketing activities and or buyers mission through cooperative activity between
exporter and importer.
Exporters who can routinely deal with Singapore-sized orders and packaging sizes, and are
flexible.
Exporters that do not have short term objectives and weak commitments, but can take a longer
term view of the market conditions for their brands, which can be difficult in the short term.
Exporters that are well researched and do not make incorrect assumptions about their market
opportunities.
Appropriate sized packaging
It should also be noted that halal-certified foods, ingredients and inputs are also becoming more and
more important in Singapore’s food service/HRI supplies market. Most of the fast food and Quick
Service Restaurant (QSR) chains are halal-certified.
This trend applies to Singapore’s hotels. The number of Muslim tourists and business visitors arriving
from Indonesia, Malaysia, the Indian sub-continent, the Middle East and China, indicate that between
20% and 25% of Singapore’s foreign visitor arrivals are now Muslims. Indonesia, the World’s most
populous country and a close neighbor of Singapore, has become more affluent over the past 5 years.
B. MARKET STRUCTURE
Singapore is an open, yet competitive market with importers looking to the entire world for
supplies. There are a number of factors that constrain U.S. products, including the strategies of
U.S. multi-national food and drink brands, the strategies of the international/U.S. fast food
companies, competition from old and new sources, and the longstanding price sensitivity that is
embedded in the Singapore market.
Many U.S. and other multi-national brands in Singapore’s mid-range market are sourced locally
or from within the East Asia and Oceania region, with ASEAN-based production facilities
becoming more important as the FTA’s have developed across the region. This situation has
arisen from corporate strategies that have been implemented throughout the region to produce

GAIN REPORT: HRI Annual 2017 Page 12
locally for the regional market.
Additionally, international fast food companies are no longer importing much in the way of U.S.
products for use by their operations. This arises because new sources have developed in East
Asia, and because of new licensing agreements. The latest products to switch are frozen potato
products, now entering the Singapore market from China.
Classic cases of these strategies exist within Coca-Cola, the Pepsico group, and in the supply
chain of McDonald’s and Yum! Brands. They are also reflected in the business strategies of
smaller companies, including the U.S. linked ice cream companies, such as Swensen’s. Other
companies, such as Simplot, are also changing export patterns out of the United States to
Singapore with their investments in frozen vegetable plants in China.
The major impediments to U.S. agricultural exports are strict sanitary requirements for meat,
poultry and egg imports. A good example is Singapore’s regulatory body, Agri-Food and
Veterinary Authority’s (AVA) zero tolerance for salmonella enteriditis and extremely low
tolerance for staph aureus in poultry meat to protect consumers from poor food handling and
cooking practices. AVA approves only a fraction of anti-microbial sprays on animal and poultry
carcasses used in the United States.
Distribution of Food Service/HRI Industry Supplies in Singapore
Japan-themed restaurants (left) and Soup Spoon and Krispy Kreme (right) outlets.
(Source: FAS Singapore)
Food and Beverages

GAIN REPORT: HRI Annual 2017 Page 13
The bulk of food service businesses in Singapore do not procure directly from overseas suppliers
because the size of businesses is small. Trade sources advise that some of the more sizeable
operations, for example, the airline caterers (which tender their supplies), do have limited
demand for certain higher volume products on a direct basis, for example, wine.
The other businesses that do procure on a direct basis are the major fast food chains that are
procured through a regional or corporate purchasing office based outside Singapore.
Singapore is a small market that does not operate with the same type of channels to food service/
HRI outlets that exist in the United States. There are no mega-sized food service suppliers
operating with large sized delivery trucks which exist in the United States. By U.S. standards,
most food service industry suppliers are small or very small in size.
The food service supply channels have not yet consolidated around large corporations. While
there are some larger businesses involved, for example Auric Pacific, Ben Foods (QAF Group),
Indoguna, and Singapore Food Industries, many food service suppliers are smaller family-
owned and operated businesses. The larger businesses tend to be involved in the bulk area of the
price sensitive market, with the smaller businesses operating as specialty food suppliers in the
Food Importers/Distributors
1. Specialists 2. Generic
(High End Products) (Mass Items)
For Limited High Volume
Demand Items
Wholesalers/Runners
Restaurants and Other Food Service
Operations
(Fragmented Demand)
Larger Operations
(Concentrated Demand)
1. Food Chains 2. Airline Catering

GAIN REPORT: HRI Annual 2017 Page 14
segments where quality and customer service is in high demand.
C. SUB-SECTOR PROFILES
1. Major International Chain Hotels & Resorts in Singapore The table below profiles the food and beverage outlets in the top international chain hotels operating in
Singapore. Their food products or ingredients are mainly procured through importers/distributors and
or food service suppliers. There are also lower to mid-range hotels, generally they are not major
purchasers of imported or U.S. food products.
Hotel Chains Hotel Names F&B establishments
Fairmont Raffles
Hotels
International
Swiss Hotel the Stamford International cuisine, Asian
cuisine, Italian, Western
cuisine, fine dining, cafés,
bars, and lounge
Fairmont Raffles
Hotels
International
Fairmont Singapore Share the same F&B
establishments with Swissotel
as the hotels are located next
to each other
Park Royal Hotels Parkroyal Hotels: Beach Rd. Pickering Rd,
Kitchener Rd;
Parkroyal Service apartments, Beach Road
International cuisine, fine
dining, coffee house, Asian
cuisine, deli, and bars.
Four Seasons
Hotels and Resorts
Four Seasons Singapore International cuisine, Asian
cuisine and bar.
Hilton Worldwide Hilton Singapore, Conrad Centennial Hotel International cuisine, coffee
house, Asian cuisine, and
lounge, deli, bars, and juice
bar.
Hyatt Hotels
Corporation
Grand Hyatt Singapore International cuisine, local
food, Asian cuisine, European
cuisine, coffee house, casual
dining, bar, club and cafe.
Intercontinental
Hotel Group
Intercontinental Singapore, Holiday Inn
Express Clarke Quay, Holiday Inn Spore
Orchard Center, Holiday Inn Singapore
Atrium, Holiday Inn Express Singapore
Orchard Road, and Crowne Plaza, Changi
Airport
European cuisine, Asian
cuisine, coffee house, bars and
lounges.
Marriott
International
Singapore Marriott Tang Plaza Hotel, The
Ritz Carlton Millenia Singapore
International cuisine, alfresco
grill, Asian cuisine, deli, and
lounge.
Millennium Hotels M Hotel Singapore, Grand Copthorne
Waterfront Hotel, Orchard Hotel, Copthorne
King’s Hotel, and Studio M hotel.
International cuisine, coffee
shop, bar, Asian cuisine, and
lounge.
Regent Hotels and Regent Singapore International cuisine, Asian

GAIN REPORT: HRI Annual 2017 Page 15
Resorts cuisine, European gourmet,
and cafe.
Shangri-La Hotel
and Resorts
Shangri-La Hotel Singapore, Shangri-La's
Rasa Sentosa Resort & Spa, Singapore,
Hotel Jen Orchard Gateway, and Hotel Jen
(formerly Trader Hotel)
International cuisine, Asian,
Mediterranean, fine dining,
deli, bars and lounges.
Starwood Hotels
and Resorts
The St. Regis Singapore, The Westin
Singapore, Sheraton Towers Singapore, and
W Singapore
International cuisine, Asian
cuisine, American cuisine,
European cuisine, fine dining,
bars, lounges, coffee/ tea
place.
Pan Pacific Hotels
and Resorts
Pan Pacific Singapore (Marina), Pan Pacific
Orchard, Pan Pacific Serviced Suites Beach
Road, and Pan Pacific Serviced Suites
Orchard
International cuisine, Asian
cuisine, American cuisine,
gourmet grocery and café, bar
and lounges.
Meritus Hotels
and Resorts
Mandarin Singapore Hotel, Marina
Mandarin
International /Mediterranean
cuisine, Asian cuisine, café,
lounge, and bars.
Mandarin Oriental
Hotel Group
Mandarin Oriental Singapore International cuisine, Asian
cuisine, American cuisine,
European cuisine, bar and
lounge.
(Source: Hotel websites)
2. Table on Restaurants/Fast Foods in Singapore
Company (Product
Type)
Sales
(2015/16)
Outlet Name, Type,
& Number of
Outlets
Locations
Purchasing Agents
Crystal Jade
Culinary Concept
Holdings
Founded and based
in Singapore in
1991.
The local restaurant
chain was bought
over in 2014 by
Paris-based luxury
group LVMH Moet
Hennessy Louis
Vuitton's private
n/a
The group comprises
120 restaurants, from
high-end, fine-dining
concepts to casual
Chinese cuisine, in
10 countries from
China to India, and
27 cities.
It has 47 restaurants
in Singapore.
Singapore.
Overseas:
across 18
cities in 9
regional
countries:
Indonesia,
Malaysia,
Thailand,
Hong Kong,
China,
Japan,
Vietnam and
South Korea.
Importers/
distributors

GAIN REPORT: HRI Annual 2017 Page 16
equity arm, L
Capital Asia. It
owns over 90
percent of the group.
The restaurant chain
serves mainly
Cantonese food.
Sakae Holdings Ltd.
Flag ship brand of
Apex-Pal
International Ltd.
The local restaurant
chain offers quick
service Japanese
cuisine; sushi on a
conveyor belt
(kaiten); and a la
carte, and caters to
mainly low to mid-
level markets. Does
catering services via
its Nouvelle Events
brand
Total
Revenue:
$86
million
(2016)
Over 100 outlets (40
Sakae Sushi outlets
in Singapore), China,
India, Indonesia,
Malaysia, the
Philippines,
Thailand, Vietnam,
the United States,
and Japan.
Portfolio of brands –
Sakae Sushi, Sakae
Teppanyaki, Sakae
Delivery, Sakae
Junior Club, Hei
Sushi and Hei
Delivery (halal
certified), Senjyu,
Kyo by Sakae,
Crepes & Cream,
Sakae Express,
Sachi, Sakae Shoppe
and Nouvelle Events
Singapore
Regional
countries:
Indonesia,
Japan,
Malaysia,
the
Philippines,
Thailand,
Vietnam,
and the
United
States.
Direct sourcing from
fish farms (farm to
fork) Importers/
distributors
Old Chang Kee
Brand
An established local
snacks (fast food)
chain offering local
snacks including
curry puffs, all halal
certified in 2005.
Brand owned by Ten
& Han Trading Pte.
Ltd.
The company also
operates mobile
kitchen/catering
Total
revenue:
$73.9
million
(2016)
89 Old Chang Kee
outlets are located in
Singapore, and
overseas: three in
China, two in
Malaysia, four in
Indonesia and three
in the Philippines.
Other brands include
Take 5 (local casual
food), Pie Kia (local
pies), Dip n Go
(snack food with
dips), Mushroom
café (Al fresco local
food) and Curry
Singapore
Overseas:
China,
Malaysia,
Indonesia,
Australia,
and the
Philippines
Direct/Importers/
distributors

GAIN REPORT: HRI Annual 2017 Page 17
services (brand
(O’My Darling)
Times (curry themed
restaurant).
TungLok Group
Owns and operates a
number of mainly
high end/ mid-scale
Chinese restaurants.
The local group
provides
management
consultancy for the
F&B industry as
well; offers
franchise
opportunities for its
outlets; and also
manufactures festive
food and dim sum.
Total
revenue:
$86.1
million
(2016)
$85
million
(2015)
The group owns and
manages over 83 (as
march 2015)
restaurants in
Singapore, China,
Japan, and
Indonesia. The
brands are (each one
is a unique type of
Chinese cuisine):
Dancing Crab
Lao Beijing
LingZhi Vegetarian
Tóng Lè Private Dining
TungLok Heen
TungLok Signatures
Ruyi - Chinese Fast
Food
Shin Yeh Restaurant
Slappy Cakes
TungLok Seafood
TungLok Teahouse
TungLok XiHé Peking
Duck
Singapore Seafood
Republic
Lokkee
Singapore
Overseas:
China,
Japan,
Indonesia
and
Vietnam.
Importers/distributors.
Imperial Treasure
Restaurants Group
Pte. Ltd. (Founded
in 2004)
The local group
offers Chinese
cuisine and caters to
the mainly high-end
and also mid-scale
markets.
In 2014, Navis
Capital Partners Ltd.
(Malaysian owned)
has acquired a major
stake in Imperial
Treasure Restaurant
Group (known for its
“super peking duck”.
N/A The Group has 30
restaurants mainly in
Singapore and 2 in
Shanghai.
Each brand is a
unique type of
Chinese cuisine,
such as Teochew (a
Chinese dialect
group), Cantonese
seafood, Peking
duck, steam boat
(Chinese hot pot),
noodles and congee,
hand-made noodles
and bakeries.
Singapore
Overseas:
China, Hong
Kong, South
Korea,
France and
U.K.
(Opening
2018)
Importers/
distributors

GAIN REPORT: HRI Annual 2017 Page 18
Imperial Treasure
founder Alfred
Leung remains a
shareholder and
involved in the
business. (Alfred
previously started
Singapore Crystal
Jade Concept
Holdings restaurant,
which was bought
over by L Asia
Capital, private
equity arm of Louis
Vuitton Moet
Hennessy (LVMH).
McDonald’s
Singapore – wholly
owned by
McDonald’s
Corporation, Oak
Brook, U.S.
Like other
McDonald’s
worldwide, the
Singapore outlets
primarily sell
hamburgers, cheese
burgers, french fries,
breakfast items, soft
drinks, milkshakes
and desserts.
Responding to
demand for healthier
products, the menu
has expanded to
include salads,
wraps and fruit
smoothies.
The QSR opened its
first restaurant in
Singapore in 1979.
N/A
McDonald’s
Singapore has grown
to 137 outlets across
the island.
The QSRs typically
offer counter service
and drive through
service in a few
outlets. Most outlets
are located in
shopping malls.
There are also
McCafés (Starbuck
style coffee shop)
that offer better
quality coffee and
cakes.
Singapore Importers/distributors
GAIN REPORT: HRI Annual 2017 Page 19
All outlets are halal
certified.
International Coffee
& Tea LLC –
privately owned by
Singapore’ Sassoon
family.
Known for its
Original Ice Blended
coffee and tea
drinks, hot coffee
drinks, and hot and
iced tea drinks. It
also sells
sandwiches/pasta
and a variety of
whole bean coffees,
whole leaf teas,
flavored powders,
and baked goods.
Opened the first
outlet in Singapore
in 1996. In 1998,
Singapore’s Victor
and Sunny Sassoon
and Severin
Wunderman bought
the parent company
bringing the chain
globally.
However, in 2013, a
significant equity
position was
acquired by U.S.-
based Advent
International, in
partnership with
South Korea-
based Mirae Asset
Private Equity and
N/A
The coffee chain has
16 outlets in
Singapore. The
outlets are known as
“Coffee Bean & Tea
Leaf”
The outlets are
usually located in
shopping malls.
Singapore Importers/distributors.

GAIN REPORT: HRI Annual 2017 Page 20
Taiwan-based CDIB
Capital, with the
Sassoon family
retaining a major
share.
The chain serves
halal and kosher
food.
Burger King –
Rancak Selera Sdn
Bhd – current BK
franchisee in
Malaysia – acquired
a 100% stake in
Burger King
Singapore in 2012.
The QSR opened in
1982 and primarily
sells hamburgers,
cheese burgers,
French fries, salad,
breakfast items, soft
drinks, milkshakes
and desserts.
The chain is halal
certified.
N/A More than 36 outlets
across the island,
mostly located in
shopping malls.
Singapore Approved
Importers/Distributors
Carl’s JR – CKE
Restaurants Inc.
entered into a
franchise agreement
with Aspac F&B Pte
Ltd in 2004 to open
Carl’s Jr restaurants
in both Singapore
and Malaysia.
The QSR offered
N/A There are 4 “Carl’s
Jr.” outlets across the
country.
Outlets are usually
located in shopping
malls.
Singapore
Importers/
distributors.

GAIN REPORT: HRI Annual 2017 Page 21
premium quality
charbroiled burgers,
chicken burgers,
fries and dessert.
Domino Pizza’s – its
franchise holder,
Domino’s Pizza
Singapore – is a
sister company of
Domino Pizza
Malaysia which has
been running 40
outlets in Malaysia
since 1997.
Domino Pizza
returned to
Singapore in 2010
after a 10 years
absence. It serves
halal food.
N/A There are 22
“Domino Pizza’s
“outlets across the
country.
The outlets are
located in shopping
malls/ or as stand-
alone outlets and
some are also
located in housing
estates in suburban
areas.
Singapore
Importers /
distributors.
Kentucky Fried
Chicken (KFC) –
with its HQ in KL,
Malaysia, QSR
Brands (M)
Holdings Sdn. Bhd.
operates KFC
restaurants in
Singapore – also
Malaysia and
Brunei. KFC
Singapore opened its
first outlet in 1977,
and serves fried
chicken, burgers,
N/A There are 80
“Kentucky Fried
Chicken” outlets
across the country.
The outlets are
located mainly in
shopping malls.
Singapore
Importers /
distributors.

GAIN REPORT: HRI Annual 2017 Page 22
wraps and
desserts. It serves
halal food.
Long John Silver –
Yum sold Long John
Silver's to LJS
Partners LLC, led by
a group of
franchisees and
other investors.
Long John Silver’s
opened its first outlet
in 1983 in
Singapore; and the
QSR chain offers
reasonably priced
fish, seafood and
chicken dishes. It
serves halal food.
N/A There are 19 “Long
John Silver” outlets
across the island.
Outlets are mainly in
shopping malls and
MRT network at
prime locations
Singapore
Importers /
distributors.
Pizza Hut – QSR
Brands (M)
Holdings Sdn Bhd
also operates Pizza
Hut outlets in
Singapore – and
Malaysia, too.
Aside from pizzas,
the QSR chain also
offers pasta, baked
rice, soup /salad, and
dessert. It offers
halal food.
N/A There are 28 “Pizza
Hut” outlets across
the country.
Outlets are mainly in
shopping malls.
Singapore
Importers /
distributors.
Starbucks Coffee
Singapore, a wholly
owned subsidiary of
N/A “Starbucks”
Singapore opened its
100th
outlet in the
country in February
2014.
The outlets are
Singapore
Importers /
distributors.

GAIN REPORT: HRI Annual 2017 Page 23
Starbucks Coffee
Corporation since
June 2004.
Starbucks Coffee
Singapore opened its
first outlet in 1996.
Aside from coffee
beverages, the chain
also offers tea,
chocolate beverages,
sandwiches and
pastries.
mainly located in
shopping malls and
office buildings.
Krispy Kreme –
Krispy Kreme
signed a franchise
agreement with
Singapore’s Star360
Group to open 15
stores in the
country. Star360 is
owned by Andy
Chaw – the group
has businesses in
retail and
distribution,
operating 30 retail
stores and
distributing to more
than 4,000 point of
sale in the region.
Krispy Kreme
opened its first outlet
in 2013. It
offers doughnuts and
coffee /tea
beverages.
N/A
There are currently 9
“Krispy Kreme”
outlets across the
country.
So far, the outlets are
located each at a
shopping mall,
airport and office
building.
Singapore
Importers /
distributors.
N/A
There are 2 “Chili’s”
outlets across the
Singapore
Importers /
distributors.

GAIN REPORT: HRI Annual 2017 Page 24
Chili’s (R) Grill &
Bar – Brinker
international signed
a franchise
agreement with
Grandko Restaurants
to open four new
restaurants in
Singapore. Chilli’s
is one of the
returning restaurant
franchises in
Singapore.
Chilli’s opened its
outlets in 2009 after
years of absence
from Singapore. It
is a casual dining
restaurant that offers
Tex-Mex cuisine.
country.
So far, one outlet is
located in a shopping
mall, and the other
outlet is located in a
mainly dining area
along a riverside
quay.
3. Institutional
A. In Singapore, Singapore Airport Terminal Services Limited (SATS) is the leading provider of
gateway services and food solutions in the region; and has operations at 47 airports in 14 countries.
SATS control about 80% of Changi airport’s ground handling and catering business. It caters to the
needs of various sectors including aviation; food; hospitality; and air freight and logistics services.
SATS subsidiaries include SATS Airport Services, SATS Catering, SATS Security Services, Aero
Laundry & Linen Services, Aerolog Express, Country Foods Pte Ltd. and Singapore Food Industries
(SFI).
SATS provide both inflight and commercial catering. For inflight catering, SATS provides 80,000
meals per day to its customers including Singapore Airlines, SilkAir, Etihad Airways, Cathay Pacific
and Qantas. For commercial catering, SATS provides catering for large scale markets: military,
hospitals and food retail stores; events catering: corporate, MICE events and large scale events -Asian
Youth Games (2009), 1st Youth Olympic Games (2010) and Singapore National Day; and via its
premier Le Lifestyles brand, also provides catering services for food outlets such as bars and fine dining
restaurants.
B. The “other” caterers in Singapore are typically small to medium sized private enterprises that
serve local food products although they may use imported canned fruits, frozen vegetables, and bakery
mixes. They typically cater to schools, company events, private social functions and factories.

GAIN REPORT: HRI Annual 2017 Page 25
SECTION III: COMPETITION
The USA’s competition comes from two broad types of countries; developed and developing countries
with temperate climates and related agricultural-food products. It should be noted that other developed
countries such as the United States are also facing competitive challenges from competing countries
such as China, some South American countries and South Africa.
Competition in the HRI/food service supply market is aggressive from certain low-cost countries in
some of the United States’ core target markets for example, chicken (Brazil) and fish fillets (Vietnam).
Competition from other quality countries, for example, Australia (freight advantages), New Zealand and
some European countries (for example, France and Netherlands) because of strong and longstanding
links between exporters in these countries and their loyal importers in Singapore.
European exporters also benefit from demands for provenance (original origin of products) and also
from very strong demand-pull from European executive chefs who work in 4 to 6 star hotels in
Singapore.
Competition Summary Table
U.S. exports of agricultural products to Singapore totaled $738 million in 2016.
SECTION IV: BEST PRODUCT PROSPECTS
Product
Category
Major Supply
Sources
Strengths of Key Supply
Countries
Advantages/Disadvantages of
Local Suppliers
Dairy
(Inc.
Cheese)
Net
Imports:
$689
million
1. New Zealand:
29%
2. Australia:
21%
3. Thailand: 8%
4. France: 6%
5. U.S.A.: 4%
NZ: freight advantage and
exportable supplies;
traditional supplier
Australia: freight
advantage, leads in liquid
milk; and processed
cheese. Most retailers’ in-
house brands are imported
from Australia. U.S.
exports $105 million in
2014.
Local dairy companies are strong
competitors and have brand/name
familiarity with the domestic
consumers.
The local brands include Magnolia,
Farmhouse, Daisy (F&N), Meji
(Meji Co. Ltd.) and HL and
Marigold brands (Malaysian Dairy
Industries)
Beef and
Offal
Net
Imports:
$209
million
1. Brazil: 33%
2. Australia:
32%
3. U.S.: 9%
4. New Zealand:
9%
Australia has freight
advantage and enjoys
status as traditional
supplier;
NZ also price
competitive.
Brazil competes in the
frozen beef segment.
Singapore does not produce beef.
Pork and 1. Brazil: 28% Brazil dominates the Live pigs from Indonesia are

GAIN REPORT: HRI Annual 2017 Page 26
Offal
Net
Imports:
$289
million
2. Australia:
22%
3. Netherlands:
15%
4. China: 9%
5. U.S.A.: 5%
frozen segment
while Australian pork
dominates the
fresh/chilled market due to
its close proximity and the
well-developed air-flown
supply chain.
U.S. processed pork is
popular.
imported and slaughtered; most of
the meat is sold wet/traditional
markets and supermarkets.
Poultry
Net
Imports:
$ 255
million
1. Brazil: 76%
2. U.S.A.: 12%
3. Argentina:
3%
4. Malaysia:
2%
Brazil is the most prices
competitive. Notable
Brazilian brands include
Borella, Sadia and Seara.
U.S. has been losing
market share.
Malaysian live chickens are
imported and slaughtered.
Eggs and
products
Net
Imports:
$117
million
1. Malaysia:
88%
2. China: 6%
3. Vietnam: 2%
4. U.S.A.: 1%
Malaysia has close
proximity and lower
transportation costs.
AVA’s strict import
requirements, limit U.S.
opportunities.
Three local farms produce eggs,
and are seeking various ways to
differentiate their eggs.
Fish and
seafood
Net
Imports:
$1.07
billion
1. China: 13%
2. Malaysia:
13%
3. Indonesia:
10%
4. Vietnam:10%
5. Norway: 7%
6. USA: 2%
Price competitive.
ASEAN countries and
China dominate.
Fresh/chilled/ prawns, live
crabs, frozen cuttlefish,
and squids are key
products.
90% of fish and seafood is
imported. The remainder is
supplied by the 100 sea-based
aquaculture operations.
Production is increasing.
Fresh
fruits
group
Net
Imports:
$526
million
1. U.S.A.: 16%
2. China: 13%
3. Malaysia:
12%
4. Australia:
12%
Top U.S. fresh fruits:
grapes, oranges,
strawberries and apples.
U.S. dominates sales of
these fruits when they are
in season. Very
competitive market with
supplies from different
sources.
Singapore does not grow any fruits.
Fresh
vegetables
Net
Imports:
$447
1. Malaysia:
36%
2. China: 28%
3. Australia: 9%
4. India: 5%
Top suppliers have freight
advantages in shipping
these perishables.
U.S. products are air-
flown and caters to the
Singapore neither produces fresh
vegetables or produce products that
compete with U.S. vegetables.

GAIN REPORT: HRI Annual 2017 Page 27
million
8. U.S.A.: 3%
premium market.
Dried
fruits
Net
Imports:
$17
million
1. U.S.: 48%
2. China: 20%
3. Thailand: 7%
4. Turkey: 6%
U.S. dried fruits very
popular. Some are
repacked and sold under
local brands.
Singapore is not a major producer
of edible nuts and dried fruit.
Dried Nuts
Net
Imports:
$123
million
1. Indonesia:
38%
2. U.S.A.: 17%
3. India: 8%
4. Thailand: 6%
U.S. nuts are very
popular. Some are
repacked and sold under
local brands.
Singapore is not a major producer
of edible nuts.
Non-
alcoholic
beverages
Net
Imports:
$345
million
1. Malaysia:
53%
2. U.S.A.: 7%
3. Thailand:
6%
4. Vietnam: 4%
Regional fruit juices
dominate food service
products. U.S. leads the
chilled retail-packed fruit
juices. Notable U.S.
brands include Welch’s,
Del Monte, Minute Maid
FL Citrus, Ocean Spray.
A strong sector in fruit juices, such
as Fraser & Neave, Malaysia Dairy
Industries, and Pokka Singapore.
Wine and
Beer
Net
Imports:
$639
million
1. France:
53%
2. Australia:
8%
3. Malaysia:
5%
4. Vietnam:
5%
7. U.S.A.: 3%
France dominates the
premium wine market.
Australia dominates the
retail market with its
“mass market” wines to
premium ones. The U.S.
com-petes on the “mass
market” and premium
products. For beer, Asia
Pacific Breweries (APB)
and import leader Carls-
berg (Malaysia) dominate
the domestic market.
Singapore does not produce wines.
Asia Pacific Breweries (APB),
Singapore’s biggest beer
manufacturer dominates the beer
market with well established brands
such as Tiger, Heineken, Anchor,
ABC, Baron, and Guinness stout.
APB has a diverse repertoire of
other imported beers.
(Source: Global Trade Atlas)
According to Euromonitor, the Singapore economy grew by 2% in GDP in 2016 with
unemployment rate at 2%. The economy is showing signs of stagnancy. Singaporeans are
known to be more affluent, however, its market has matured with many segments shifting from
growth markets to slow and steady growth over the past 10 years. This situation exists because
of limited capacity of some segments to take in significant volumes of additional products as a
result of rising household incomes and population growth. In some cases, this has also resulted
in more challenging competition from local supplies as demand has slowed, for example from
locally-slaughtered chicken and pigs, beer and locally produced and/or farm-raised fish and
seafood.

GAIN REPORT: HRI Annual 2017 Page 28
Although the Singapore market is in its mature stage, it does not undermine United States’
opportunities because Singapore is a market for many food products. However, competition is
made more intense, which results in the need for the United States and its exporters to take a
much more targeted, service-oriented, brand-driven and differentiated approach in developing
their target markets.
This is particularly the case in markets where the United States is faced with aggressive price
competition from ASEAN countries (multinational-owned factories and some fresh produce
from the Genting highlands in West Malaysia), and from China (now a very important and
constantly evolving “direct” competitor) and Brazil (in some segments).
Category A: Products Present in the Market with Good Sales Potential
Product
Category
2016
Market
Size
(Volume)
Metric
Tons
2016
Imports
5-Year
Avg.
Annual
Import
Growth
Key
Key
Constraints
Over Market
Development
Market
Attractiveness for
USA
Dairy
Products
333,610 $689
million
-6% Availability of
products from
New Zealand,
Australia and
France.
With better product
understanding,
opportunities exist
for development
for U.S. dairy
products.
Fresh
Fruits
443,135 $526
million
5% Strong
competition
from China,
Malaysia,
Australia and
South Africa
Strong demand for
U.S. products for
premium fruits
such as stone fruits,
summer berries and
avocados.
Dried
Fruits
4,673 $17million 0% Price sensitive
market.
Very strong
demand for U.S.
Dried fruits
Edible
Nuts
N/A $123
million
-3% Price sensitive
market.
Very strong
demand for U.S.
nuts.
Category B: Products Not Present in Significant Quantities But Have Good Sales Potential
Product
Category
2016
Market Size
(Volume)
Metric
Tons
2016
Imports
5-Year
Avg.
Annual
Import
Growth
Key
Key Constraints
Over Market
Development
Market
Attractiveness
for USA

GAIN REPORT: HRI Annual 2017 Page 29
Fish and
Seafood
193,710 $1.07
billion
0% Intense
competition from
lower cost
regional suppliers
such as China,
Malaysia,
Indonesia and
Vietnam
High fish
consumption with
fish and meat
accounting for
approximately
40% of a typical
diet.
Pork 89,698 $289
million
1% Strong
competition from
Australian air-
flown fresh
product, and
frozen Brazilian
product at the
lower segment
Major protein
food staple, good
prospects in high-
end outlets where
consumers pay
premium price for
higher quality.
Fresh
Vegetables
(seasonal
ones)
538,476 $538
million
4% Price sensitivity
for some
vegetables such
as asparagus as
well as lower
priced alternatives
from regional
markets such as
Malaysia, China,
India and
Australia.
Solid demand for
U.S. produce,
consumers will
pay premium for
fresh air-flown
produce.
Wine &
Beer
157,737,696
liters
$639
million
1.4% Diverse
competitive
market with a
massive number
of labels from
Australia, France,
Italy, Chile, South
Africa, etc.
Broad and wide
market, with
many
opportunities at
the right price
point.
(Sources: Global Trade Atlas (GTA)
APPENDIX: POST CONTACT AND FURTHER INFORMATION
Office of Agricultural Affairs
U.S. Embassy Singapore
U.S. Department of Agriculture (USDA)
Foreign Agricultural Service (FAS)
27 Napier Road
Singapore 258508
Tel: (65) 6476-9289

GAIN REPORT: HRI Annual 2017 Page 30
Fax: (65) 6476-9517
Email: [email protected]
FAS is USDA’s export promotion arm for U.S. agricultural products overseas. FAS Singapore is
one of its offices at the U.S. embassy that represents USDA overseas. For more information, please log
onto the FAS website: www.fas.usda.gov
To obtain more publically available FAS reports for Singapore or other FAS overseas offices,
log onto the FAS website above
select “data and analysis”
click on “GAIN”
click on “All reports entered after July 2, 2009”
type in time frame you’re interested in
click on the proper category/categories
select country
select post that issued the report