simultaneous determination of nitrite and nitrate in human plasma by on-capillary preconcentration...
TRANSCRIPT

Research Article
Simultaneous determination of nitriteand nitrate in human plasma by on-capillarypreconcentration with field-amplifiedsample stacking
A simple method for the determination of nitrite and nitrate in human plasma has been
developed using CZE with minimal sample preparation. Field-amplified sample stacking
(FASS) was used to achieve submicromolar detection by dilution of the plasma sample
with deionized water. In CZE, the separation of nitrite and nitrate was achieved within
10 min without adding EOF modifier. The optimal condition was achieved with 50 mM
phosphate buffer at pH 9.3. The ninefold diluted plasma samples were injected hydro-
dynamically for 40 s into a 60 cm� 75 mm id uncoated fused-silica capillary. The separation
voltage was 20 kV (negative potential) and UV detection was performed at 214 nm. The
linearity curves for nitrite and nitrate were obtained by the standard addition method. The
estimated LODs for nitrite and nitrate in ninefold diluted plasma sample were 0.05 and
0.07 mM, respectively. The LODs for nitrite and nitrate in original plasma samples were
0.45 and 0.63 mM. The intra- and inter-day precisions for both analytes were o2.6% and
the recovery ranged between 92.3 and 113.3%. It was found that nitrite was more stable
than nitrate in the plasma after the sample preparation. This proposed method was applied
to a number of human plasma samples and the measured nitrite and nitrate concentra-
tions in human plasma were consistent with the literature ranges.
Keywords:
CZE / Human plasma / Nitrate / Nitrite / Stacking DOI 10.1002/elps.201100285
1 Introduction
The endogenous gas nitric oxide (NO) plays an important
role in physiological and pathological processes in the
human body. It acts as a signal molecule in the cardiovas-
cular system [1]. Increased NO production has also been
related to many other diseases, such as shock and organ
dysfunction under pathological conditions [2, 3]. Therefore,
the amounts of NO have a critical influence on the human
health and disease, which makes it imperative to monitor
the levels of NO in clinical studies. However, direct
measurement of NO is difficult due to its short half-life. It
is known that NO can metabolize to two stable products,
namely nitrite and nitrate, which can be used as an indicator
or marker of NO generation in vivo [4].
Although the determination of nitrite and nitrate in
body fluids represents a challenge, many different analytical
techniques were employed to determine these two
compounds [5, 6]. The Griess reaction is the formerly used
method for the determination of nitrite and nitrate in
human blood. However, this colorimetric method lacks
sensitivity. Chemiluminescence is another more sensitive
technique, but it requires an expensive apparatus, which is
available in highly specialized laboratories only. Most HPLC
methods developed for biological samples require a
complicated sample preparation procedure to remove matrix
components [7]. The GC-MS methods developed for the
purpose require a derivatization reaction before analysis and
also a labeled internal standard [8].
Nowadays, CE has become one of the most attractive
techniques for biological samples due to its low sample
consumption and little sample preparation. Various CZE
methods have been employed for the determination of nitrite
and nitrate in biological fluids by using direct UV detection
at 214 nm [9–18]. In the meantime, many on-capillary
preconcentration techniques such as stacking and transient
isotachophoresis have also been developed to achieve the
satisfactory sensitivity [19–21]. Most of the CZE methods
Xu Wang1
Evi Masschelein2
Peter Hespel2
Erwin Adams1
Ann Van Schepdael1
1Laboratory for PharmaceuticalAnalysis, Faculty ofPharmaceutical Sciences, K.U.Leuven, Leuven, Belgium
2Research Centre for Exerciseand Health, Faculty ofKinesiology and RehabilitationSciences, K.U. Leuven, Leuven,Belgium
Received May 24, 2011Revised July 20, 2011Accepted August 29, 2011
Colour Online: See the article online to view Figs. 1 and 2 in colour.
Abbreviations: FASS, field-amplified sample stacking; NO,
nitric oxide
Correspondence: Professor Ann Van Schepdael, Laboratory forPharmaceutical Analysis, Faculty of Pharmaceutical Sciences,K.U. Leuven, O&N 2, PB-923, Herestraat 49, B-3000 Leuven,BelgiumE-mail: [email protected]: 132-16-323448
& 2011 WILEY-VCH Verlag GmbH & Co. KGaA, Weinheim www.electrophoresis-journal.com
Electrophoresis 2012, 33, 402–405402

dealt with a complicated BGE and EOF modifier, and few of
them focused on nitrite and nitrate in plasma with submi-
cromolar quantification. In [18], the authors describe a simple
and fast CZE method, but they state that good precision of
nitrite measurement could only be obtained in the plasma
of patients with increased nitrite levels. The reported levels of
basal nitrite in human plasma have ranged from ‘‘non-
detectable’’ to 26 mM and the reported concentrations of
nitrate in plasma ranged from 4 to 81 mM. The variations in
nitrite and nitrate levels reported in the literature could
possibly be explained by the problems arising from variable
diet, sample collection, preparation, contamination due to the
laboratory ubiquity of these ions and from lack of sensitivity
[1, 5]. Both high sensitivity and precautions taken during the
sample preparation procedure can improve the precision and
accuracy of the measurements.
The aim of the study was to develop a simple and
sensitive CZE method for the submicromolar determination
of nitrite and nitrate in human plasma with little sample
preparation for clinical routine analysis.
2 Materials and methods
2.1 Chemicals
All chemicals used were of analytical grade. Sodium nitrate
was purchased from Sigma-Aldrich (St. Louis, MO, USA).
Sodium nitrite and disodium hydrogen phosphate were
from Merck (Darmstadt, Germany). Sodium hydroxide was
from Fisher Scientific (Loughborough, UK). Ammonium
thiocyanate used as internal standard (IS) was from
AppliChem (Darmstadt, Germany).
All solutions were prepared in distilled water purified by
a Milli-Q Gradient system (Millipore, Molsheim, France).
The buffer solution was filtered through 0.2 mm regenerated
cellulose filter (Whatman, Dassel, Germany).
2.2 Instrument
All experiments were performed on an HP 3DCE system
(Agilent, Waldbronn, Germany). Separations were carried
out using an uncoated fused-silica capillary (60 cm� 75 mm
id; effective length 51.5 cm) at a voltage of �20 kV. The
temperature of the cassette was kept at 401C. Injection was
performed hydrodynamically for 40 s at 50 mbar. The UV
detection was set at 214 nm. The data were collected and
processed by Agilent ChemStation software (Hewlett-Pack-
ard, Waldbronn, Germany).
New capillaries (Composite Metal Service, Shipley, UK)
were conditioned at 451C by rinsing with 1 M NaOH
(10 min), 0.1 M NaOH (10 min) and water (10 min). At the
start of each day, the capillary was rinsed with 0.1 M NaOH
(10 min), water (10 min) and running buffer (5 min). Prior
to the injection of plasma samples, the capillary was flushed
between runs with 0.1 M NaOH (2 min), distilled water
(2 min) and running buffer (2 min). At the end of each day,
the capillary was rinsed with 1 M NaOH (10 min), 0.1 M
NaOH (10 min) and water (10 min).
The pH value of buffers was measured with a Metrohm
691 pH-meter (Metrohm, Herisau, Switzerland).
2.3 Sample preparation
The venous blood samples collected from 10 healthy male
volunteers (no dietary restriction) were drawn into lithium-
heparin tubes and plasma was separated by centrifugation
(3478� g for 10 min at 41C) within 3 min after sample
collection. Plasma was then isolated and immediately frozen
at �801C until later analysis. After thawing at room
temperature, 150 mL plasma sample was deproteinized by
spiking with 5 mL 1 M NaOH to pH 10, and then centrifuged
at 14 100� g for 10 min in a Minispin Plus microcentrifuge
(Eppendorf). Then, 100 mL supernatant was diluted nine
times with distilled water (100 mL supernatant with 800 mL
water) to achieve the sample stacking effect. The final
concentration of thiocyanate was always 10 mM both in the
calibration and sample solution. The study was approved by
the local Ethics Committee (K.U. Leuven) and the informed
consent was obtained from all subjects.
3 Results and discussion
3.1 Optimization of the CZE method
The selection of a simple BGE was important for routine
analysis. Thus, phosphate buffer was chosen as a separation
buffer. Increased resolution of nitrite and nitrate was
obtained when the buffer concentration increased from 25
to 75 mM with maximum at 50 mM. The effect of running
buffer pH on the resolution was also investigated by using
50 mM phosphate buffer at pH values ranging from 6.8 to
11. The resolution improved dramatically with the increas-
ing pH. However, the baseline became noisy at pH 11. The
effect of applied voltage on the separation was studied in the
range of 6–25 kV, showing that a high voltage not only
brought high separation speed but also improved resolution.
The use of a higher voltage was limited by a high current,
thus 20 kV was selected as a separation voltage. The
optimization of capillary temperature was studied in the
range of 15–401C, indicating that with increasing tempera-
ture, both the separation speed and resolution improved.
Thus, a capillary temperature of 401C was chosen as the
operation temperature. The effect of injection time was
investigated from 5 to 50 s at a pressure of 50 mbar. The
higher the injection time, the more sensitivity was obtained.
However, the nitrite peak was not resolved well from the
adjacent peak with an injection time of 50 s, thus an
injection time of 40 s was chosen for the sake of robustness.
The identity of this adjacent peak is unknown. The length of
capillary was raised from 50 to 70 cm, showing that the
Electrophoresis 2012, 33, 402–405 CE and CEC 403
& 2011 WILEY-VCH Verlag GmbH & Co. KGaA, Weinheim www.electrophoresis-journal.com
resolution increased slightly, but the separation time was
long when the length of the capillary increased above 60 cm.
The initial length of the sample plug is about 11% of the
capillary length.
3.2 Injection condition
Biological samples containing high salts and protein content
only allow a small injection volume, making it difficult to
reach a satisfactory sensitivity. On-capillary preconcentration
with FASS can be simply achieved by diluting the sample
with deionized water. A long plug of sample, diluted in water
with low conductivity, can be injected hydrodynamically into
the capillary filled with separation buffer of high conductivity.
After the voltage is applied, the high electric field strength is
distributed over the sample plug due to its high resistivity,
while the rest of the capillary has relatively low electric field
strength. Therefore, the ions move fast in the sample zone
and slow down in the buffer zone. Stacking effect occurs at
the boundary between the sample zone and buffer zone
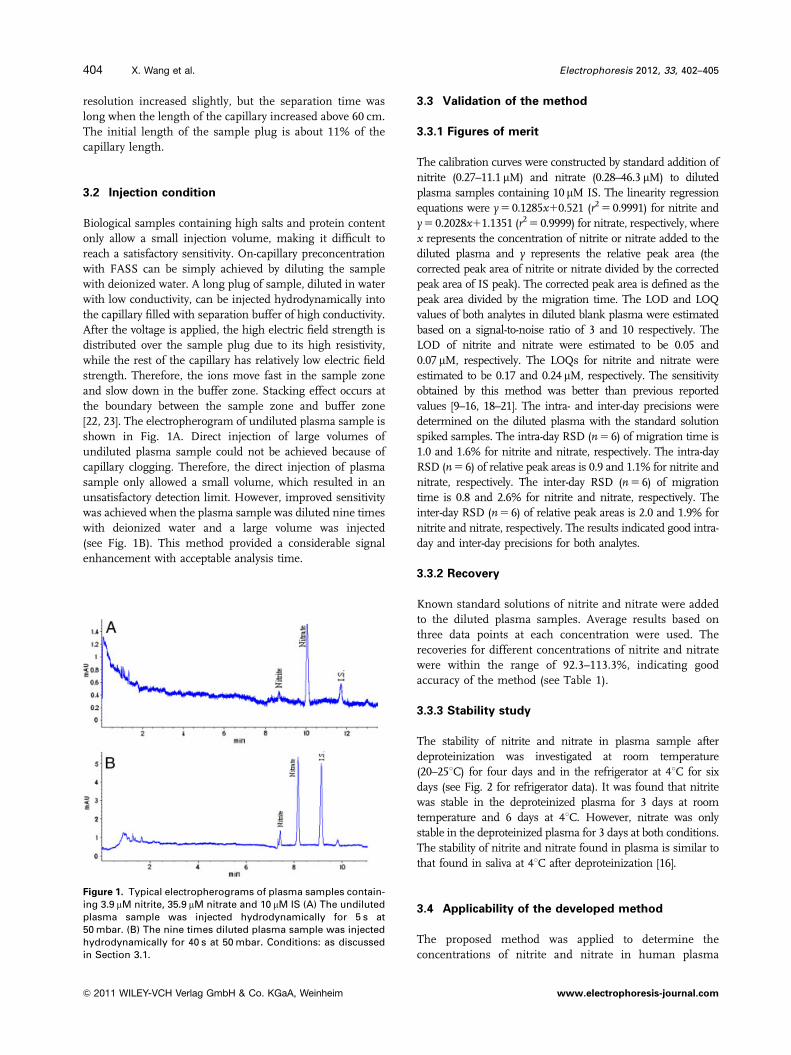
[22, 23]. The electropherogram of undiluted plasma sample is
shown in Fig. 1A. Direct injection of large volumes of
undiluted plasma sample could not be achieved because of
capillary clogging. Therefore, the direct injection of plasma
sample only allowed a small volume, which resulted in an
unsatisfactory detection limit. However, improved sensitivity
was achieved when the plasma sample was diluted nine times
with deionized water and a large volume was injected
(see Fig. 1B). This method provided a considerable signal
enhancement with acceptable analysis time.
3.3 Validation of the method
3.3.1 Figures of merit
The calibration curves were constructed by standard addition of
nitrite (0.27–11.1 mM) and nitrate (0.28–46.3 mM) to diluted
plasma samples containing 10 mM IS. The linearity regression
equations were y 5 0.1285x10.521 (r2 5 0.9991) for nitrite and
y 5 0.2028x11.1351 (r2 5 0.9999) for nitrate, respectively, where
x represents the concentration of nitrite or nitrate added to the
diluted plasma and y represents the relative peak area (the
corrected peak area of nitrite or nitrate divided by the corrected
peak area of IS peak). The corrected peak area is defined as the
peak area divided by the migration time. The LOD and LOQ
values of both analytes in diluted blank plasma were estimated
based on a signal-to-noise ratio of 3 and 10 respectively. The
LOD of nitrite and nitrate were estimated to be 0.05 and
0.07 mM, respectively. The LOQs for nitrite and nitrate were
estimated to be 0.17 and 0.24 mM, respectively. The sensitivity
obtained by this method was better than previous reported
values [9–16, 18–21]. The intra- and inter-day precisions were
determined on the diluted plasma with the standard solution
spiked samples. The intra-day RSD (n 5 6) of migration time is
1.0 and 1.6% for nitrite and nitrate, respectively. The intra-day
RSD (n 5 6) of relative peak areas is 0.9 and 1.1% for nitrite and
nitrate, respectively. The inter-day RSD (n 5 6) of migration
time is 0.8 and 2.6% for nitrite and nitrate, respectively. The
inter-day RSD (n 5 6) of relative peak areas is 2.0 and 1.9% for
nitrite and nitrate, respectively. The results indicated good intra-
day and inter-day precisions for both analytes.
3.3.2 Recovery
Known standard solutions of nitrite and nitrate were added
to the diluted plasma samples. Average results based on
three data points at each concentration were used. The
recoveries for different concentrations of nitrite and nitrate
were within the range of 92.3–113.3%, indicating good
accuracy of the method (see Table 1).
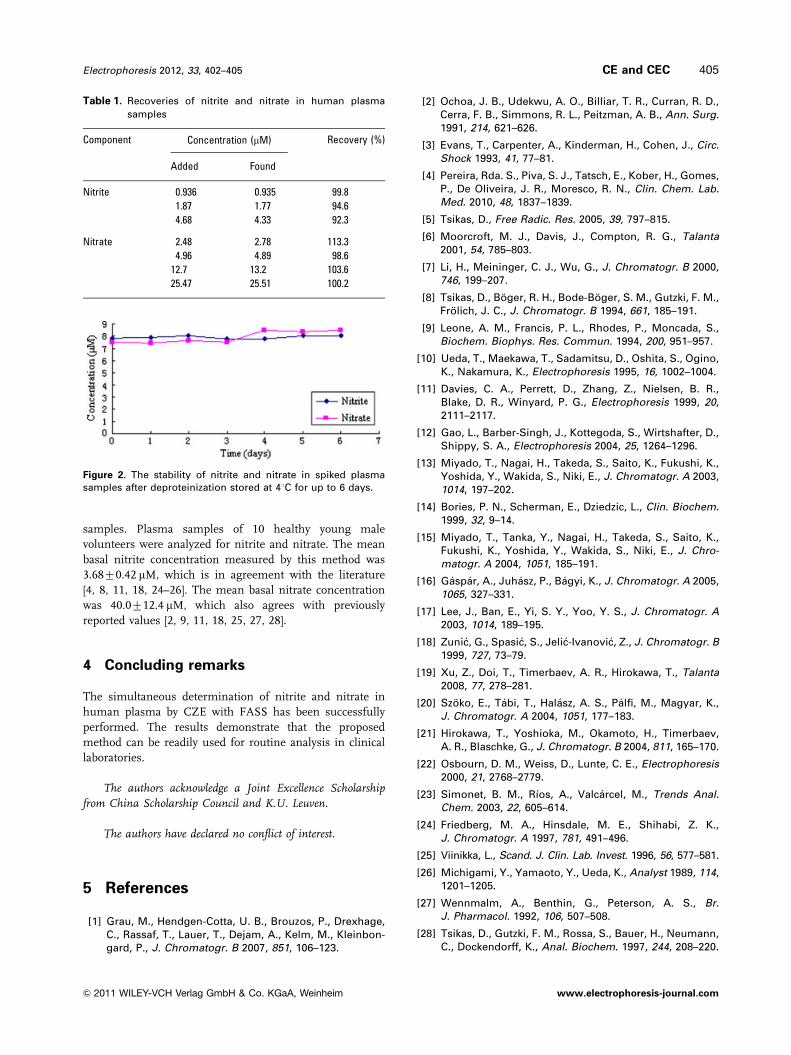
3.3.3 Stability study
The stability of nitrite and nitrate in plasma sample after
deproteinization was investigated at room temperature
(20–251C) for four days and in the refrigerator at 41C for six
days (see Fig. 2 for refrigerator data). It was found that nitrite
was stable in the deproteinized plasma for 3 days at room
temperature and 6 days at 41C. However, nitrate was only
stable in the deproteinized plasma for 3 days at both conditions.
The stability of nitrite and nitrate found in plasma is similar to
that found in saliva at 41C after deproteinization [16].
3.4 Applicability of the developed method
The proposed method was applied to determine the
concentrations of nitrite and nitrate in human plasma
Figure 1. Typical electropherograms of plasma samples contain-ing 3.9 mM nitrite, 35.9 mM nitrate and 10 mM IS (A) The undilutedplasma sample was injected hydrodynamically for 5 s at50 mbar. (B) The nine times diluted plasma sample was injectedhydrodynamically for 40 s at 50 mbar. Conditions: as discussedin Section 3.1.
Electrophoresis 2012, 33, 402–405404 X. Wang et al.
& 2011 WILEY-VCH Verlag GmbH & Co. KGaA, Weinheim www.electrophoresis-journal.com
samples. Plasma samples of 10 healthy young male
volunteers were analyzed for nitrite and nitrate. The mean
basal nitrite concentration measured by this method was
3.6870.42 mM, which is in agreement with the literature
[4, 8, 11, 18, 24–26]. The mean basal nitrate concentration
was 40.0712.4 mM, which also agrees with previously
reported values [2, 9, 11, 18, 25, 27, 28].
4 Concluding remarks
The simultaneous determination of nitrite and nitrate in
human plasma by CZE with FASS has been successfully
performed. The results demonstrate that the proposed
method can be readily used for routine analysis in clinical
laboratories.
The authors acknowledge a Joint Excellence Scholarshipfrom China Scholarship Council and K.U. Leuven.
The authors have declared no conflict of interest.
5 References
[1] Grau, M., Hendgen-Cotta, U. B., Brouzos, P., Drexhage,C., Rassaf, T., Lauer, T., Dejam, A., Kelm, M., Kleinbon-gard, P., J. Chromatogr. B 2007, 851, 106–123.
[2] Ochoa, J. B., Udekwu, A. O., Billiar, T. R., Curran, R. D.,Cerra, F. B., Simmons, R. L., Peitzman, A. B., Ann. Surg.1991, 214, 621–626.
[3] Evans, T., Carpenter, A., Kinderman, H., Cohen, J., Circ.Shock 1993, 41, 77–81.
[4] Pereira, Rda. S., Piva, S. J., Tatsch, E., Kober, H., Gomes,P., De Oliveira, J. R., Moresco, R. N., Clin. Chem. Lab.Med. 2010, 48, 1837–1839.
[5] Tsikas, D., Free Radic. Res. 2005, 39, 797–815.
[6] Moorcroft, M. J., Davis, J., Compton, R. G., Talanta2001, 54, 785–803.
[7] Li, H., Meininger, C. J., Wu, G., J. Chromatogr. B 2000,746, 199–207.
[8] Tsikas, D., Boger, R. H., Bode-Boger, S. M., Gutzki, F. M.,Frolich, J. C., J. Chromatogr. B 1994, 661, 185–191.
[9] Leone, A. M., Francis, P. L., Rhodes, P., Moncada, S.,Biochem. Biophys. Res. Commun. 1994, 200, 951–957.
[10] Ueda, T., Maekawa, T., Sadamitsu, D., Oshita, S., Ogino,K., Nakamura, K., Electrophoresis 1995, 16, 1002–1004.
[11] Davies, C. A., Perrett, D., Zhang, Z., Nielsen, B. R.,Blake, D. R., Winyard, P. G., Electrophoresis 1999, 20,2111–2117.
[12] Gao, L., Barber-Singh, J., Kottegoda, S., Wirtshafter, D.,Shippy, S. A., Electrophoresis 2004, 25, 1264–1296.
[13] Miyado, T., Nagai, H., Takeda, S., Saito, K., Fukushi, K.,Yoshida, Y., Wakida, S., Niki, E., J. Chromatogr. A 2003,1014, 197–202.
[14] Bories, P. N., Scherman, E., Dziedzic, L., Clin. Biochem.1999, 32, 9–14.
[15] Miyado, T., Tanka, Y., Nagai, H., Takeda, S., Saito, K.,Fukushi, K., Yoshida, Y., Wakida, S., Niki, E., J. Chro-matogr. A 2004, 1051, 185–191.
[16] Gaspar, A., Juhasz, P., Bagyi, K., J. Chromatogr. A 2005,1065, 327–331.
[17] Lee, J., Ban, E., Yi, S. Y., Yoo, Y. S., J. Chromatogr. A2003, 1014, 189–195.
[18] Zunic, G., Spasic, S., Jelic-Ivanovic, Z., J. Chromatogr. B1999, 727, 73–79.
[19] Xu, Z., Doi, T., Timerbaev, A. R., Hirokawa, T., Talanta2008, 77, 278–281.
[20] Szoko, E., Tabi, T., Halasz, A. S., Palfi, M., Magyar, K.,J. Chromatogr. A 2004, 1051, 177–183.
[21] Hirokawa, T., Yoshioka, M., Okamoto, H., Timerbaev,A. R., Blaschke, G., J. Chromatogr. B 2004, 811, 165–170.
[22] Osbourn, D. M., Weiss, D., Lunte, C. E., Electrophoresis2000, 21, 2768–2779.
[23] Simonet, B. M., Rıos, A., Valcarcel, M., Trends Anal.Chem. 2003, 22, 605–614.
[24] Friedberg, M. A., Hinsdale, M. E., Shihabi, Z. K.,J. Chromatogr. A 1997, 781, 491–496.
[25] Viinikka, L., Scand. J. Clin. Lab. Invest. 1996, 56, 577–581.
[26] Michigami, Y., Yamaoto, Y., Ueda, K., Analyst 1989, 114,1201–1205.
[27] Wennmalm, A., Benthin, G., Peterson, A. S., Br.J. Pharmacol. 1992, 106, 507–508.
[28] Tsikas, D., Gutzki, F. M., Rossa, S., Bauer, H., Neumann,C., Dockendorff, K., Anal. Biochem. 1997, 244, 208–220.
Table 1. Recoveries of nitrite and nitrate in human plasma
samples
Concentration (mM)Component
Added Found
Recovery (%)
Nitrite 0.936 0.935 99.8
1.87 1.77 94.6
4.68 4.33 92.3
Nitrate 2.48 2.78 113.3
4.96 4.89 98.6
12.7 13.2 103.6
25.47 25.51 100.2
Figure 2. The stability of nitrite and nitrate in spiked plasmasamples after deproteinization stored at 41C for up to 6 days.
Electrophoresis 2012, 33, 402–405 CE and CEC 405
& 2011 WILEY-VCH Verlag GmbH & Co. KGaA, Weinheim www.electrophoresis-journal.com