preconcentration of dna using hydrogel-based transport...
TRANSCRIPT

Research Proposal
Preconcentration of DNA using Hydrogel-based Transport Modulator with
Computer Modeling and Simulation
Rahul Dhopeshwarkar
Department of Chemical Engineering
Texas A&M University
November 23, 2004 (Tuesday)
10:15
Room No. 011
Chemistry Building

Research Proposal Rahul Dhopeshwarkar
1. Introduction In a natural human quest of making things easier, miniaturization of chemical and bioanalytical systems has drawn much attention of the scientists and engineers around the globe. Employing such microfluidic devices offers many physical advantages, particularly of the interest of biomedical field. However, their large-scale application is still limited primarily due to the difficulties involved in the optical detection of low concentration sample species in these microscale geometries. Sample preconcentration techniques provide an attractive solution towards lowering the optical detection limits in microfluidic channels. Though a wide range of techniques have been implemented to achieve preconcentration, there is a plenty of room to develop a robust, precise method with improved performance. Our group has recently developed a novel approach for enrichment of sample species in microchannels using hydrogel plugs. The preliminary data have demonstrated the potential of this simple technique for achieving higher enrichment factors. An in-depth quantitative understanding of the mechanism is, however, necessary to optimize the system and devise an efficient sample injection-separation scheme for medical applications. The proposed research is intended towards applying the basic concepts of electrokinetically driven flows and gaining a detailed insight of the hydrogel-based preconcentration technique by comparing experimental data to the results of computer modeling. 2. Background
Since the emergence of the field of miniaturization of chemical/biochemical analytical systems in the early nineties, much of the effort has been devoted towards the development of µTAS (micro-Total Analytical Systems) also known as ‘lab-on-a-chip’ devices. These devices are easy to use, compact, portable and capable of integrating many reactions and operations on a single chip. Very small amounts (in nanoliters) of reagents can be handled in these devices with added advantages of larger surface-to-volume ratios and faster response times.1 The fluidic manipulations in these devices generally rely on electrokinetic transport due to the inherent difficulties involved in controlling flow by mechanical means.2
The µTAS are of vital importance for their application in the field of biomedical diagnostics and analysis, for example, their application to on-chip DNA separations would lend advances in sequencing of genomes, DNA fingerprinting, and disease identification.3 As the word ‘Total’ suggests, an ideal µTAS system should be able to accept a sample in its raw form, perform analysis, and qualitatively/quantitatively describe the system in terms of an electrical signal. However, recent advances in this direction are still limited due to the restrictions in direct handling of real-world samples in these microfluidic devices imposing a major challenge to the practicality of µTAS. Greater attention is thus required towards sample pretreatment; that is, making a real-world sample appropriate for the chip-based analysis.2
In general, on-line sample pretreatment can be divided into four main categories: separation of sample from sample matrix, derivatization, biochemical sample pretreatment, and sample preconcentration. The separation step deals with the purification of real-world samples making them suitable for the chip-based manipulations. Derivatization includes labeling or complexation of the sample molecules in order to make them detectable for optical detection. Bioprocess sample treatment is necessary considering the importance of sample analysis in genomic and proteomic studies. Finally, preconcentration is related to on-chip compaction of
- 1 -

Research Proposal Rahul Dhopeshwarkar
sample for superior detection.2 The importance of the latter category is elaborated in the next paragraph.
In microfluidic analytical systems, fluorescence detection is the most popular technique, due to its high sensitivity. However, many samples do not exhibit fluorescence and derivatization methods are required to label these species with fluorescent markers. In some cases, it is not even possible to label target species. Hence, one has to regard other detection techniques such as UV-visible absorption or electrochemical methods.2 However, the detection limits of these methods are much higher than fluorescence. In particular, for UV-visible absorption, the signal strength (absorbance = molar absoptivity × length of optical path × sample concentration) depends upon optical path length dictated by the channel depth, but the microscale channel dimensions coupled with low concentrations result in poor detection sensitivity. Though expensive, one way to solve this problem is to considerably improve the detection instrumentation. A cost-effective approach to address this problem is to increase concentration of sample molecules in the detection volume using on-chip sample preconcentration methods.
Various techniques have been employed for preconcentration in microfluidic channels. Field-amplified sample stacking (FASS)4-7 is based on generating an abrupt change in the electrophoretic velocity of the sample ions near the boundary between low buffer concentration and high buffer concentration regions. Solid-phase extraction (SPE)8, 9 involves flow of sample solution over a treated surface or a bed of treated solids and preconcentration by subsequent attachment of the analyte to the immobilized phase. One has to consider the complexity of incorporating an appropriate immobilized phase inside a microchannel before using these methods. In isotachophoresis (ITP),10-12 the sample solution is placed between a leading and a trailing buffer. The sample constituents separate into sharp zones based on their electrophoretic mobility and the extent of preconcentration is defined by the concentration of the leading electrolyte. Thus, choosing proper electrolytes for a given sample sometimes poses a serious challenge. Recently, a method using laser-patterned nanoporous membranes as electrokinetic filtration media was reported to achieve spatially averaged preconcentration of 2 orders of magnitude for proteins.13 Khandurina et al.14 have reported a similar size exclusion method using a thin polysilicate membrane. Other notable preconcentration techniques include electrokinetic micellar sweeping,15, 16 isoelectric focusing (IEF),17 temperature gradient focusing (TGF),18 entropic trapping,19 and evaporation.20 However, a highly reproducible convenient technique with less microfabrication discrepancies, greater control over system variables and efficient performance is still awaited.
Our group’s previous studies demonstrated an unusual approach for trapping and concentrating DNA inside a three-dimensional MF channel by gaining a spatial control over the electrokinetic velocity of the target analyte.21 In the absence of similitude,22 it revealed the possibility of generating a balance between electrophoretic velocity of the analyte and the electroosmotic velocity using a nanoporous polyester membrane. However, this PDMS-based device was very difficult to reproducibly fabricate. Here we show that a simple hydrogel microfabrication technique can overcome this problem. Specifically, replacing the membrane with a highly cross-linked polymer matrix further enables the manipulation of fluidic transport through the gel for achieving the ultimate objective of preconcentration.
- 2 -

Research Proposal Rahul Dhopeshwarkar
3. Materials and Techniques 3.1. Hydrogel
Adopted from Khoury et al.23
The microfabricated hydrogel structures are the cornerstone of this preconcentration study. In literature, one can find many different hydrogels prepared from poly(vinyl alcohol), polyacrylamide etc. used in conjunction with the analytical techniques. However, there has been a greater interest in crosslinked 2-hydroxyethyl methacrylate (HEMA) hydrogels due to their biocompatibility and hydrophilic nature.24 These hydrogels are easy to fabricate using in situ photopolymerization techniques and hence chosen for the study. Further, pH-responsive AA-co-HEMA hydrogel microstructures swell or contract depending upon the pH of the surrounding solution. The swelling, however, can be controlled by changing cross-linker percentage thus facilitating stable elastic hydrogel structures in microfluidic channels. Preliminary electrokinetic experiments were carried out using neutral (HEMA crosslinked with EGDMA) and anionic (AA-co-HEMA crosslinked with EGDMA) hydrogel configurations.
3.2. Microfluidic Device and Hydrogel Incorporation
For preliminary experiments, a plasma bonded PDMS-glass microfluidic device was fabricated using standard rapid prototyping procedures.25 The microfluidic channels were typically 90-100 µm in width, 20-25 µm in depth, except at the center of the network (the hydrogel section) where the width was about 190-200 µm for a length of about 400 µm. Figures 1a and 1b show schematics of the microfluidic geometries used for the preconcentration of DNA and fluorescein, respectively. The primary microchannel (about 7 mm long) had two
sidechannels forming a double-T network. The sidechannels in the device used for DNA preconcentration were perpendicular to the primary microchannel while those in the fluorescein preconcen-tration device were
Figure 1. Schematics of the microfluidic geometries used for the preconcentration of (a) DNA and (b) fluorescein
- 3 -
Research Proposal Rahul Dhopeshwarkar
connected to the primary microchannel at an angle of 450. To incorporate hydrogel inside this microfluidic network, the hydrogel precursor solution was first inserted into the primary microchannel by capillary action. Next UV light (365 nm) was projected onto the hydrogel section for 200 s. Following polymerization unwanted precursor solution was flushed out by introducing 10 mM Tris-HCl buffer solution (pH = 8.3) through sidechannels.
3.3. Experimental Procedures
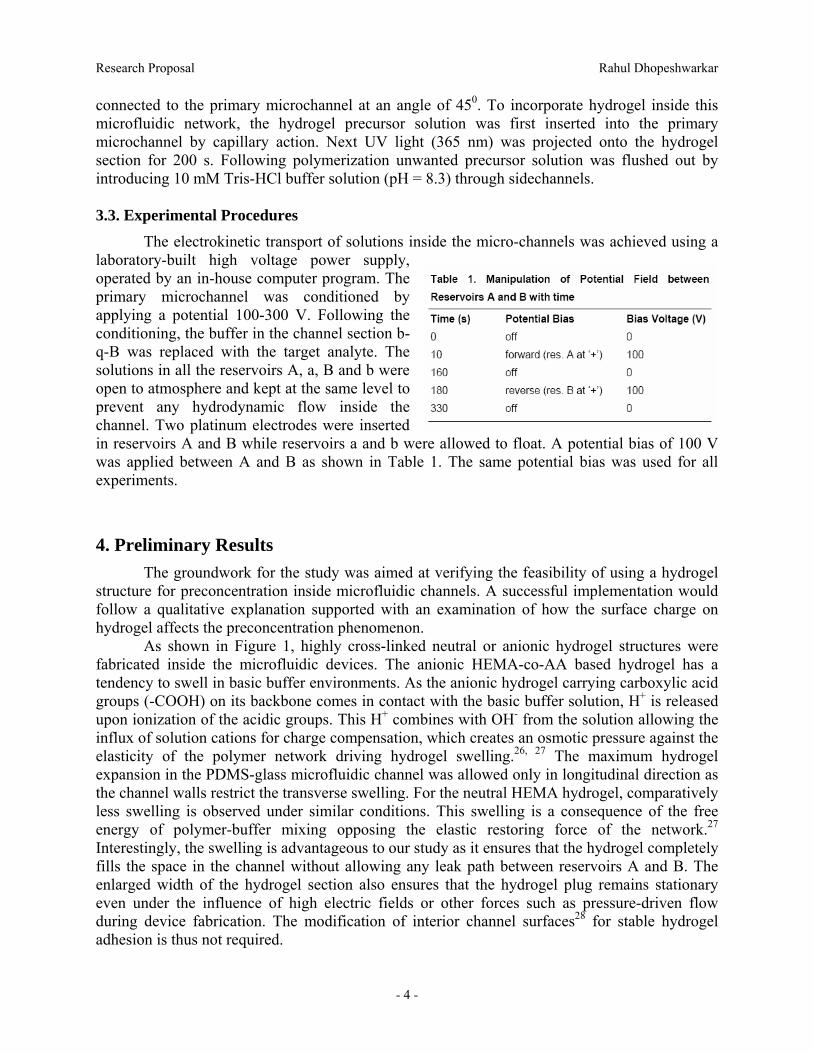
The electrokinetic transport of solutions inside the micro-channels was achieved using a laboratory-built high voltage power supply, operated by an in-house computer program. The primary microchannel was conditioned by applying a potential 100-300 V. Following the conditioning, the buffer in the channel section b-q-B was replaced with the target analyte. The solutions in all the reservoirs A, a, B and b were open to atmosphere and kept at the same level to prevent any hydrodynamic flow inside the channel. Two platinum electrodes were inserted in reservoirs A and B while reservoirs a and b were allowed to float. A potential bias of 100 V was applied between A and B as shown in Table 1. The same potential bias was used for all experiments.
4. Preliminary Results The groundwork for the study was aimed at verifying the feasibility of using a hydrogel
structure for preconcentration inside microfluidic channels. A successful implementation would follow a qualitative explanation supported with an examination of how the surface charge on hydrogel affects the preconcentration phenomenon.
As shown in Figure 1, highly cross-linked neutral or anionic hydrogel structures were fabricated inside the microfluidic devices. The anionic HEMA-co-AA based hydrogel has a tendency to swell in basic buffer environments. As the anionic hydrogel carrying carboxylic acid groups (-COOH) on its backbone comes in contact with the basic buffer solution, H+ is released upon ionization of the acidic groups. This H+ combines with OH- from the solution allowing the influx of solution cations for charge compensation, which creates an osmotic pressure against the elasticity of the polymer network driving hydrogel swelling.26, 27 The maximum hydrogel expansion in the PDMS-glass microfluidic channel was allowed only in longitudinal direction as the channel walls restrict the transverse swelling. For the neutral HEMA hydrogel, comparatively less swelling is observed under similar conditions. This swelling is a consequence of the free energy of polymer-buffer mixing opposing the elastic restoring force of the network.27 Interestingly, the swelling is advantageous to our study as it ensures that the hydrogel completely fills the space in the channel without allowing any leak path between reservoirs A and B. The enlarged width of the hydrogel section also ensures that the hydrogel plug remains stationary even under the influence of high electric fields or other forces such as pressure-driven flow during device fabrication. The modification of interior channel surfaces28 for stable hydrogel adhesion is thus not required.
- 4 -

Research Proposal Rahul Dhopeshwarkar
4.1. Preconcentration using neutral hydrogel plug Figure 2 shows the preconcentration of
DNA in the microfluidic channel incorporating a neutral hydrogel plug. The channel geometry also incorporates a separate reference channel filled with the target DNA solution for fluorescence intensity comparison. Figure 2a shows the fluorescence micrograph obtained before the application of any potential bias. After applying a forward bias (reservoir A at positive potential) at t = 10 s, negatively charged DNA migrates rapidly from reservoir B towards A (Figures 2b). The dense hydrogel acts as a barrier to this electrophoretic
movement, resulting in the preconcentration of fluorescein near the hydrogel-solution interface. This is apparent from Figure 2c,
where an enrichment factor of ∼486 was achieved near the hydrogel surface within 150 s. Some fraction of the DNA was observed to diffuse through the hydrogel. When the potential bias is reversed (Figure 2d), DNA is rapidly transported back towards reservoir B while a small amount is trapped inside the hydrogel plug. For a similar experiment using fluorescein as a target analyte (results not shown), a lower enrichment factor (∼48) was obtained and a considerable fraction of the analyte was trapped inside the hydrogel during reverse bias. During forward as well as reverse bias, a small fraction of the target analyte was lost in the field-free sidechannel connecting reservoir b.
The
Figure 2. Fluorescence micrographs obtained during DNA preconcentration in a MF channel incorporating neutral hydrogel, (a) before the application of any potential bias (at t = 0 s), after applying a forward bias of 100 V (b) for 50 s (at t = 60 s), (c) for 150 s (at t = 160 s), and (d) 50 s after the application of the reverse bias (at t = 230 s).
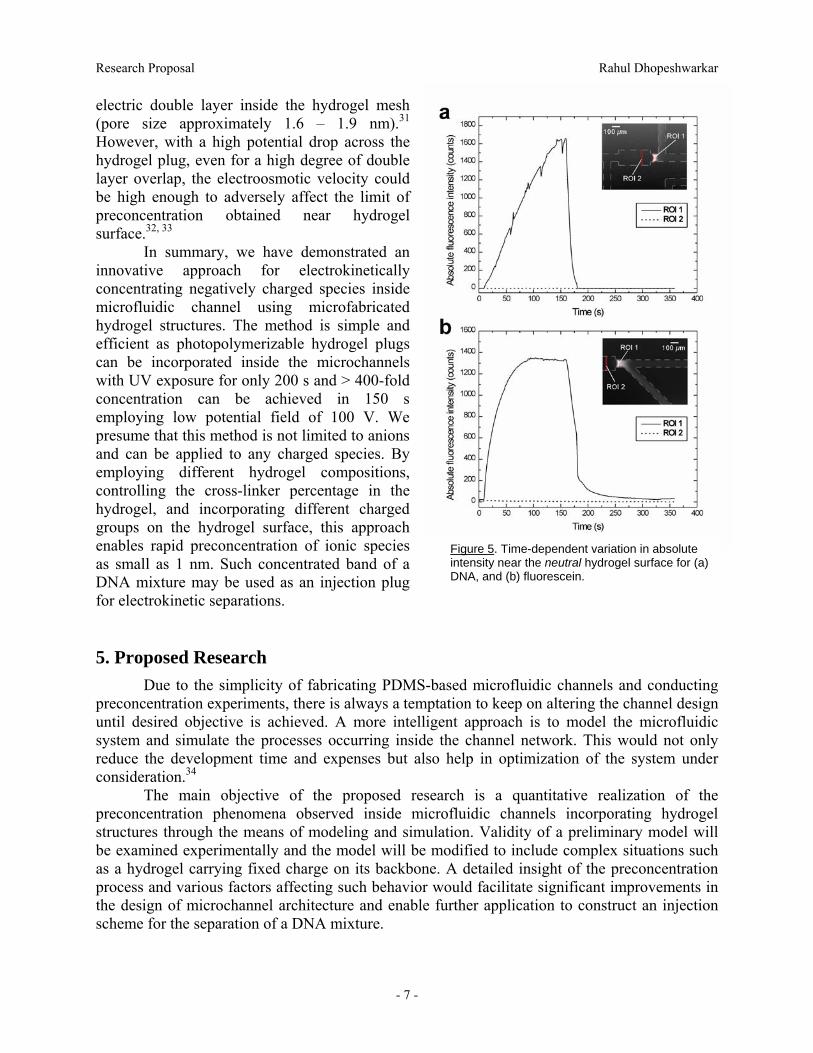
time-dependent variation in the absolute fluorescence intensity near the hydrogel surface as well as deep inside the hydrogel is shown in Figure 3a (for DNA) and Figure 3b (for fluorescein). For fluorescein, at a constant applied potential of 100 V, the fluorescence intensity at ROI 1 is observed to increase approximately linearly with time, reach a maximum value at around t = 80 s and then decrease slowly as more and more fluorescein
Figure 3. Time-dependent variation in absolute intensity near the neutral hydrogel surface for (a) DNA , and (b) fluorescein.
- 5 -
Research Proposal Rahul Dhopeshwarkar
ions started to migrate through the hydrogel. The effect was less prominent for DNA as the fluorescence intensity observed at t = 160 s may not correspond to a maximum obtainable value with the potential bias being switched off at that instant.
The dense hydrogel matrix greatly reduces the effective cross-sectional area available for the mo
4.2. Preconcentration using anionic hydrogel plug onic hydrogel is demonstrated in Figures 4
for DN
influence of fixed external potential of 100 V, the fluo
from entering the hydrogel network accordi
the ide ic
nm f
vement of analyte and fluid flow.29 This leads to a high potential drop across the hydrogel plug29, 30 and one would expect faster electrophoretic migration of the target analyte through the hydrogel. However, the non-homogeneous nature of the hydrogel results in formation of dead ends, macropores or voids and makes the polymer network extremely tortuous,24 which offers greater impedance to electrophoretic migration. Eventually, the average electrophoretic velocity inside the gel matrix is much less than that in the microchannel resulting in a concentrated band of the target analyte near the hydrogel surface. The difference in the enrichment factors obtained for DNA and fluorescein can be attributed to different ionic charges of the two species. The simultaneous preconcentration and migration of the 20mer ssDNA (MW ≈ 7.252 kDa) as well as much smaller fluorescein (MW ≈ 0.376 kDa) through the neutral hydrogel also indicates that size-exclusion is of little importance for the observed preconcentration phenomena.
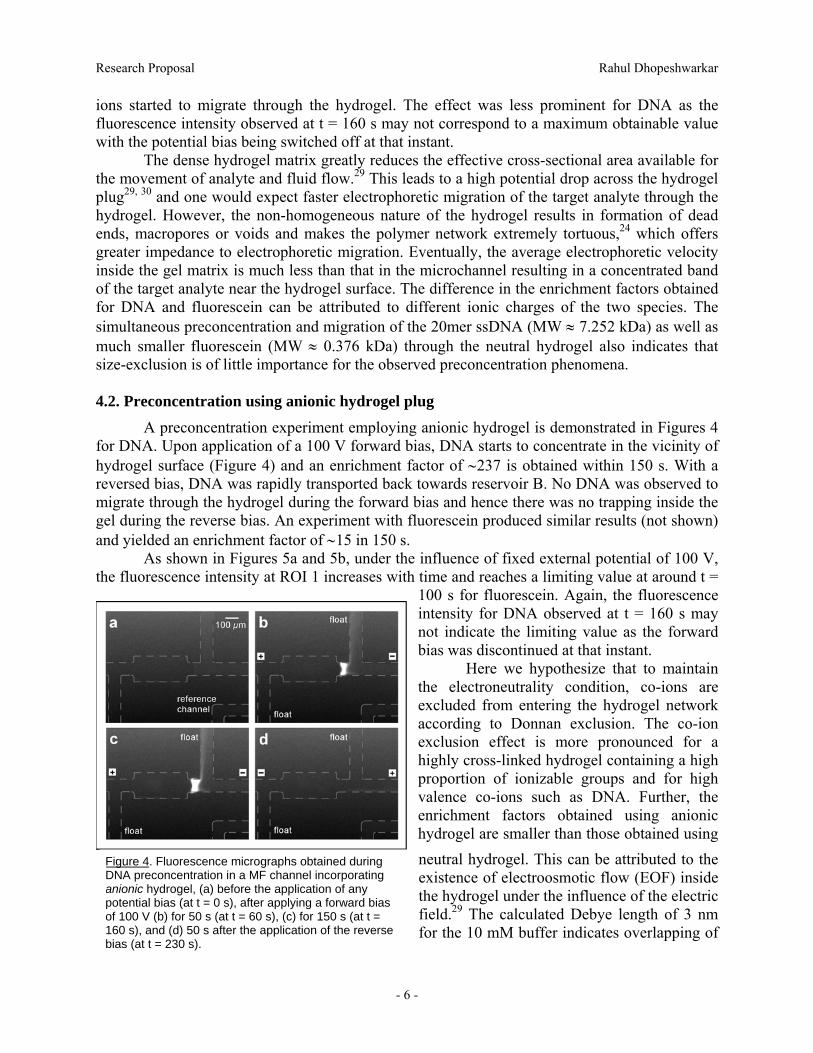
A preconcentration experiment employing aniA. Upon application of a 100 V forward bias, DNA starts to concentrate in the vicinity of
hydrogel surface (Figure 4) and an enrichment factor of ∼237 is obtained within 150 s. With a reversed bias, DNA was rapidly transported back towards reservoir B. No DNA was observed to migrate through the hydrogel during the forward bias and hence there was no trapping inside the gel during the reverse bias. An experiment with fluorescein produced similar results (not shown) and yielded an enrichment factor of ∼15 in 150 s.
As shown in Figures 5a and 5b, under the rescence intensity at ROI 1 increases with time and reaches a limiting value at around t =
100 s for fluorescein. Again, the fluorescence intensity for DNA observed at t = 160 s may not indicate the limiting value as the forward bias was discontinued at that instant.
Here we hypothesize that to maintain the electroneutrality condition, co-ions are excluded
ng to Donnan exclusion. The co-ion exclusion effect is more pronounced for a highly cross-linked hydrogel containing a high proportion of ionizable groups and for high valence co-ions such as DNA. Further, the enrichment factors obtained using anionic hydrogel are smaller than those obtained using neutral hydrogel. This can be attributed to existence of electroosmotic flow (EOF) insthe hydrogel under the influence of the electrfield.29 The calculated Debye length of 3 for the 10 mM buffer indicates overlapping o
Figure 4. Fluorescence micrographs obtained during DNA preconcentration in a MF channel incorporating anionic hydrogel, (a) before the application of any potential bias (at t = 0 s), after applying a forward bias of 100 V (b) for 50 s (at t = 60 s), (c) for 150 s (at t = 160 s), and (d) 50 s after the application of the reverse bias (at t = 230 s).
- 6 -
Research Proposal Rahul Dhopeshwarkar
electric double layer inside the hydrogel mesh (pore size approximately 1.6 – 1.9 nm). However, with a high potential drop across the hydrogel plug, even for a high degree of double layer overlap, the electroosmotic velocity could be high enough to adversely affect the limit of preconcentration obtained near hydrogel surface.
In summary, we have demonstrated an innovative approach for electrokinetically concentrating negatively
31
32, 33
charged species inside microfluidic channel using microfabricated
. Proposed Research y of fabricating PDMS-based microfluidic channels and conducting ts, there is always a temptation to keep on altering the channel design
until d
phenomena observed inside microfluidic channels incorporating hydrogel structu
hydrogel structures. The method is simple and efficient as photopolymerizable hydrogel plugs can be incorporated inside the microchannels with UV exposure for only 200 s and > 400-fold concentration can be achieved in 150 s employing low potential field of 100 V. We presume that this method is not limited to anions and can be applied to any charged species. By employing different hydrogel compositions, controlling the cross-linker percentage in the hydrogel, and incorporating different charged groups on the hydrogel surface, this approach enables rapid preconcentration of ionic species as small as 1 nm. Such concentrated band of a DNA mixture may be used as an injection plug for electrokinetic separations.
Figure 5. Time-dependent variation in absolute intensity near the neutral hydrogel surface for (aDNA, and (b) fluorescein.
)
5Due to the simplicit
preconcentration experimenesired objective is achieved. A more intelligent approach is to model the microfluidic
system and simulate the processes occurring inside the channel network. This would not only reduce the development time and expenses but also help in optimization of the system under consideration.34
The main objective of the proposed research is a quantitative realization of the preconcentration
res through the means of modeling and simulation. Validity of a preliminary model will be examined experimentally and the model will be modified to include complex situations such as a hydrogel carrying fixed charge on its backbone. A detailed insight of the preconcentration process and various factors affecting such behavior would facilitate significant improvements in the design of microchannel architecture and enable further application to construct an injection scheme for the separation of a DNA mixture.
- 7 -
Research Proposal Rahul Dhopeshwarkar
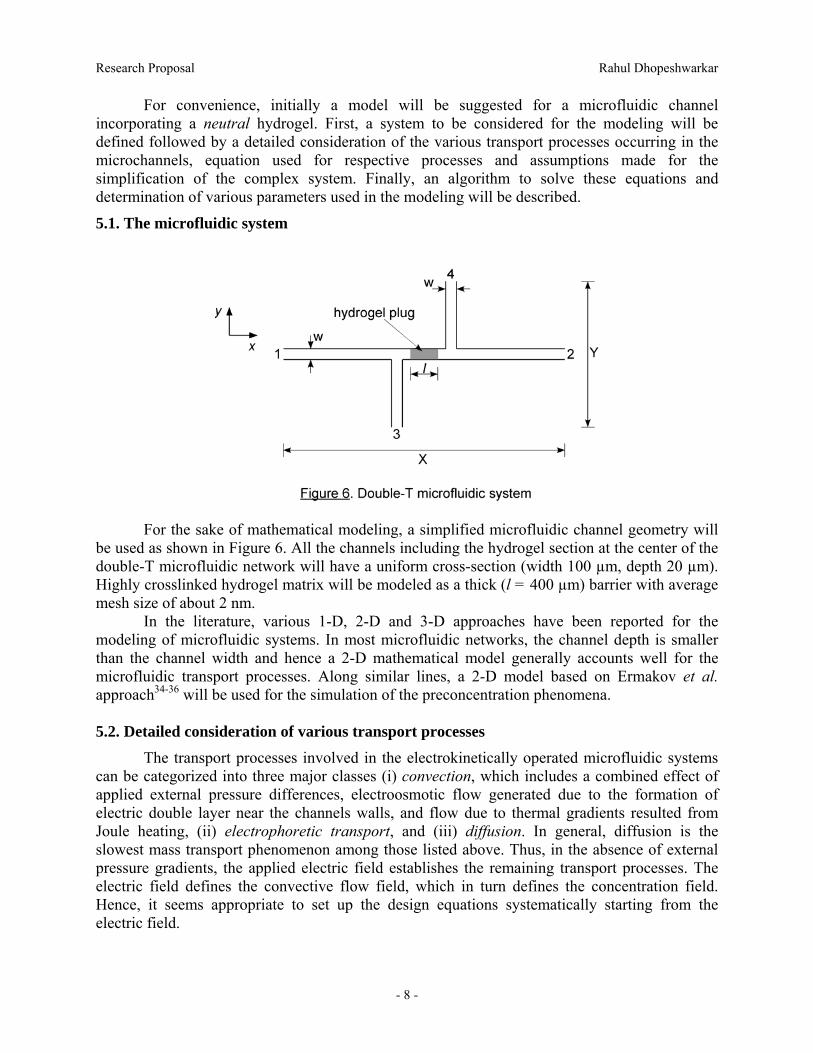
For convenience, initially a model will be suggested for a microfluidic channel incorporating a neutral hydrogel. First, a system to be considered for the modeling will be defined followed by a detailed consideration of the various transport processes occurring in the microchannels, equation used for respective processes and assumptions made for the simplification of the complex system. Finally, an algorithm to solve these equations and determination of various parameters used in the modeling will be described.
5.1. The microfluidic system
For the sake of mathematical modeling, a simplified microfluidic channel geometry will be used as shown in Figure 6. All the channels including the hydrogel section at the center of the double
systems. In most microfluidic networks, the channel depth is smaller than th
ally operated microfluidic systems hich includes a combined effect of
applied
-T microfluidic network will have a uniform cross-section (width 100 µm, depth 20 µm). Highly crosslinked hydrogel matrix will be modeled as a thick (l = 400 µm) barrier with average mesh size of about 2 nm.
In the literature, various 1-D, 2-D and 3-D approaches have been reported for the modeling of microfluidic
e channel width and hence a 2-D mathematical model generally accounts well for the microfluidic transport processes. Along similar lines, a 2-D model based on Ermakov et al. approach34-36 will be used for the simulation of the preconcentration phenomena.
5.2. Detailed consideration of various transport processes
The transport processes involved in the electrokineticcan be categorized into three major classes (i) convection, w
external pressure differences, electroosmotic flow generated due to the formation of electric double layer near the channels walls, and flow due to thermal gradients resulted from Joule heating, (ii) electrophoretic transport, and (iii) diffusion. In general, diffusion is the slowest mass transport phenomenon among those listed above. Thus, in the absence of external pressure gradients, the applied electric field establishes the remaining transport processes. The electric field defines the convective flow field, which in turn defines the concentration field. Hence, it seems appropriate to set up the design equations systematically starting from the electric field.
- 8 -

Research Proposal Rahul Dhopeshwarkar
Electric field
To impart a uniform character to the channel walls, the surface properties of PDMS and assumed identical. The microfluidic preconcentration system used in this study
requireglass will be
s a single buffer only and in most cases, the concentration of a sample analyte in the buffer is low. Hence it is reasonable to assume that the presence of sample in the buffer does not affect its conductivity (σ = σbuff = constant). This also implies that the pH value is unchanged. Further, for buffer concentrations greater than 1 mM, the electric double layer (EDL) formed near the channel walls is extremely thin (< 10 nm) compared to the channel dimensions (> 20 µm). Under such conditions, the bulk solution can be considered electroneutral (electric charge density, ρe = 0) and from the theory of electrostatics, the Poisson equation can be used to describe the applied electrical potential, Φ, as
2 0∇ Φ = (1) The boundary conditions for this Laplacian equation include the condition of insularity of channel walls and distribution of local electric field strength given by
E = −∇Φ (2) During preconcentration step, the applied electric field E is held constant implying that calculation of electric field in microchannels needs to be calculated only once under given conditions.
Convective flow field
1. Flow due to external pressure gradient: The buffer solution in all the four reservoirs is evel under atmospheric pressure. Thus, no flow conditions are imposed in maintained at a same l
the microchannels due to the external pressure. 2. At the walls of microchannels, an electric double layer is formed due to ionization of surface silanol groups. Within this electric double layer, the concentration of counterions (cations) is higher than in the bulk. Application of an electric field sets up this double layer in motion towards the opposite electrode and the bulk of the solution is driven in the same direction due to viscous drag. This is called the electroosmotic flow (EOF) whose velocity component parallel to the wall resembles a flat profile. In the absence of an external pressure gradient, the electroosmotic velocity eov for rectangular channels can be given by,
( )1eo eoyv E ϕµζ
⎛ ⎞= −
where
⎜ ⎟⎝ ⎠
(3)
0eo
ε εζµη
= is the electroosmotic mobility, ( )yϕ is the potential field across the channels
and (0)ϕ ζ= is the potential at the walls due to the existence of EDL. In the case of buffer concentrations > 1mM, the thickness ‘δ ’ of the EDL is very small comp the channels dimensions. As yared to δ>> , ( ) 0yϕ → and hence the electroosmotic velocity can be approximated as,
eov = (4) 3. Sometimes, electrokinetic fluid
eo Eµ transport in microchannels requires high electric fields and
current densities. In such cases, it is possible to encounter Joule heating effects due to the rise in buffer temperature. This results in a greater degree of axial dispersion adversely affecting the performance of electrokinetic systems, in particular, the separation systems. However, for rectangular microfluidic channels, higher surface-to-volume ratio achieves much better heat
- 9 -

Research Proposal Rahul Dhopeshwarkar
dissipation than capillary systems. Also, for buffers such as 10 mM Tris-HCl (pH = 8.3), even high field strengths of > 1.5 kV/cm result in negligible temperature gradients inside microchannels and hence the Joule heating effects can be neglected.
Thus, the convective flow can be considered as a consequence of the electroosmotic flow alone.
Assuming incompressible fluid (density, ρ = constant), the continuity and momentum balance
equations can be written for the flow in channels as,
0eov∇⋅ = (5)
( ) 2eoeo eo eo
v v v p vρ η⎡ ⎤∂
+ ⋅∇ = −∇ + ⋅∇⎢ ⎥ t∂⎣ ⎦
(6)
where p is the pressure in microchannels and η is the viscosity of the buffer. The boundary w equations include a slip velocity con eo eov Eµ= , conditions for these flo dition at the walls, i.e.,
a reasonable assumption in case of thin EDL. External pressure in all the reservoirs can be assume constant equal to pd e
r momentum transport through viscous effects and through
equati
atm and a fully dev loped flow will be assumed at all interfaces between the reservoirs and microchannels.
In addition, it is important to note that the microfluidic channel network is coupled with a highly crosslinked hydrogel structure and hence it is necessary to consider the Brinkman treatment, an extension of Darcy’s law, fo
pressure gradients in porous media. In such situations, an additional boundary condition, 1p p= , is imposed at the boundary between microchannel and the porous structure (hydrogel-
solution interface), also called as Navier-Stokes-Brinkman boundary. For a Brinkman flow in the hydrogel structure, the continuity and momentum balance
ons can be written as, ,eo gel 0v∇⋅ = (7)
,, , 0eo gel
eo gel eo gel gelv η∂ v v pρ η
κt− ⋅∇ + +∇ = (8)
ls:
∂with boundary conditions,
, 0eo gelv = no slip at the mesh wal dary:
(9)
,eo gel eov v=and at N-S-Brinkman boun (10) here ,eo gelv is the electroosmotic fl w rogel and o inside the hyd κ is the permeability of the gel w
network.
Concentration field
The concentration field inside microfluidic channels is a combined effect of the electric ctive flow field. Using the law of conservation of mass, the concentration ,
field and the convefield can be given as
( ) 2,
ieo ep i i i i
C v v C D Ct
∂+∇ + = ∇
∂ (11)
where iC is the conc iDentration of the target species ‘i’, is the diffusion coefficient of the velocity of the target species species ‘i’. The electrophoretic ‘i’ is given by , ,ep i ep iv Eµ= , where
- 10 -

Research Proposal Rahul Dhopeshwarkar
, 6ep i rµ q
π η= is its electrophoretic mobility. Equation (11) can be solved by using the initial
i i icondition at which C C= in the sample reservoir and C0 0= in all other reservoirs. Negl
ncentra atrix.
ecting any interaction between hydrogel and the sample analyte, a similar equation can be written for the co tion field in the hydrogel m
( ), 2, , , , , ,
i geleo gel ep gel i i gel i gel i gelv v C D C
tα+∇ + = ∇
∂ (12)
where
C∂
α is the void fraction of the hydrogel, is the concentration of,i gelC the target species ‘i’ in the diffusion coefficient of the species ‘i’ in Th f the
int
5.3. De
sity (ρ), buffer viscosity (
the pore, and ,i gelD is the pore. e value oconcentration obtained at the hydrogel-solution erface by solving equation (11) can be used as an initial condition for solving equation (12).
Finally, all the differential equations (1), (5)-(8), (11), and (12) will be solved using FEMLAB based computer modeling tools.
termination of various parameters used in the modeling
The quantities such as buffer den η ), and the diffusion coefficient for the sample species in buffer ( iD ) will be obtained from the literature while the quantities such as electroosmotic mobility in the microchannels ( eoµ ), electrophoretic mobilities of the sample in microchannels ( ,ep iµ ) and in gel ( , ,ep gel iµ ), and permeability of the gel network (κ ) will be determined experimentally. Knowing the values of above quantities facilitates the calculation of the remaining param rs namely the ion coefficient for the sample species in gel ( ,i gelD )
ete diffus37, 38 and the gel parti coefficient (Ktion ) for
The proposed model is based on the assumption that the dense hydrogel matrix offers a vary the hydrogel mesh size thereby unction of the amount of cross-linker
and the
able to the flow of analyte. There will be lesser flow resistance through the hyd
bone, the problem becomes much more complex as one has to consider the electrostatic interaction between the sample
i species ‘i’. 5.4. Experimental evaluation of the preliminary model
greater resistance to the flow of analyte. It is possible to varying the flow resistance. The hydrogel mesh size is a f
solvent in the precursor solution. However, for HEMA hydrogel, reduction in the cross-linker percentage from 5 to 1 results in an increase in the mesh size by 0.5 to 1.0 nm only. Further reduction in the cross-linker amount will result adversely affect the mechanical strength of the polymer structure. On the other hand, varying the amount of solvent (for example, water or ethanol) one can vary the mesh size from 1.3 nm to 14 nm without loosing the robustness of the hydrogel network.39
Controlled experiments will be carried out using a neutral hydrogel with solvent percentage varying from 0 to 40. With corresponding increase in the mesh size, the gel medium will become more perme
rogel structure resulting in a lesser degree of preconcentration near the hydrogel surface. The proposed model should account for this change quantitatively.
5.5. Modification to the model for a charged hydrogel In the case of a hydrogel carrying fixed charge on its back
- 11 -

Research Proposal Rahul Dhopeshwarkar
analyte and the charged hydrogel surface. For an anionic hydrogel, due to the electrostatic forces of repu
tion of a DNA mixture.
qualitative information bout the preconcentration technique using hydrogel-based transport modulator. A thorough
f the transport mechanisms occurring in the microfluidic
lsion and condition of neutrality, co-ions such as DNA or fluorescein are excluded from entering the gel network, according to Donnan exclusion. This imposes an additional boundary condition to equation (12) at the hydrogel- solution interface defined by the partition coefficient (Ki) of the sample analyte in hydrogel with respect to buffer solution.
The modification will be followed by experimental validation as described previously. An additional experimentation will include a study of the effect of the hydrogel charge density, which depends on the comonomer (AA in this case) concentration in the hydrogel precursor solution, on the preconcentration mechanism.
A successful model will be used to optimize the preconcentration system by varying the channel geometry and various parameters. The model will further be extended to construct a microfluidic injection scheme for efficient separa
6. Summary and Conclusions The primary objective of the proposed research is to elucidate acomputer modeling and simulation ochannels supported with controlled experimentation to validate the model will not only save time and expenses but also help us to better understand the preconcentration phenomena enabling optimization the technique and development of effective DNA separation schemes.
- 12 -

Research Proposal Rahul Dhopeshwarkar
References
. Manz, A. Chimia 1996, 50(4), 140-143. 2. Lichtenberg, J.; de Rooji, N. F.; Ve alanta 2002, 56, 233-266. 3. Ashton, R.; Padala, C.; Kane, R. S. Curr. Opin. Biotechnol. 2003, 14, 497-504.
6-497. 83.
1. 1046-1050.
1767. .
8),
7.
14. J.; Jacobson, S. C.; Waters, L. C.; Foote, R. S.; Ramsey, J. M. Anal. Chem.
509-3513.
17. A. Anal. Chim. Acta 1998, 372, 1-19.
5, 13026-13027. . Anal. Chem. 2000, 72(11),
24. S. Adv. Drug Deliv. Rev. 2002, 43, 3-12. ller, O.
horesis 2000, 21, 27-40. be, D. J.; Moore, J. S. J.
27. , 1-35. ;
7, 5440-5447. . A.; Sweedler J. V.;
30. al. Chem. 2003, 75(10),
31. 9, 23, 1183-1193.
33. .; Guttman, A.: Marcel Dekker, Inc.: New York, 2004, pp 190-193.
(15), 3512-3517.
1rpoorte, E. T
4. Chien, R.-L. Electrophoresis 2003, 24, 485. Jung, B.; Bharadwaj, R.; Santiago, J. G. Electrophoresis 2003, 24, 3476-346. Lichtenberg, J.; Verpoorte, E.; de Rooji, N. F. Electrophoresis 2001, 22, 258-277. Chien, R.-L.; Burgi, D. S. Anal. Chem. 1992, 64, 8. Broyles, B. S.; Jacobson, S. C.; Ramsey, J. M. Anal. Chem. 2003, 75(11), 2761-9. Yu, C.; Davey, M. H.; Svec, F.; Frechet, J. M. J. Anal. Chem. 2002, 73, 5088-509610. Gebauer, P.; Bocek, P. Electrophoresis 2000, 21, 3898-3904. 11. Walker, P. A. III; Morris, M. D.; Burns, M. A.; Johnson, B. N. Anal. Chem. 1998, 70(1
3766-3769. 12. Beckers, J. L.; Everaerts, F. M. J. Chromatogr. 1990, 508, 3-113. Song, S.; Singh, A. K.; Kirby, B. J. Anal. Chem. 2004, 76(15), 4589-4592.
Khandurina, 1999, 71, 1815-1819.
15. Sera, Y.; Matsubara, N.; Otsuka, K.; Terabe, S. Electrophoresis 2001, 22, 316. Quirino, J. P.; Terabe, S. Anal. Chem. 1999, 71(8), 1638-1644.
Righetti, P. G.; Bossi, 18. Ross, D.; Locascio, L. E. Anal. Chem. 2002, 74(11), 2556-2564. 19. Han, J.; Craighead, H. G. Science 2000, 288, 1026-1029. 20. Walker, G. M.; Beebe D. J. Lab Chip 2002, 2, 57-61. 21. Dai, J.; Ito, T.; Sun, L.; Crooks, R. M. J. Am. Chem. Soc. 2003, 1222. Cummings, E. B.; Griffiths, S. K.; Nilson, R. H.; Paul P. H
2526-2532. 23. Khoury, C.; Adalsteinsson, T.; Johnson, B.; Crone, W. C.; Beebe, D. J. Biomed.
Microdevices 2003, 5(1), 35-45. Hoffman, A.
25. McDonald, J. C.; Duffy, D. C.; Anderson, J. R.; Chiu, D. T.; Hongkai, W.; SchueJ. A.; Whitesides, G. M. Electrop
26. De, S. K.; Aluru, N. R.; Johnson, B.; Crone, W. C.; BeeMicroelectromech. Syst. 2002, 11(5), 544-555. Peppas, N. A.; Khare, A. R. Adv. Drug Deliv. Rev. 1993, 11
28. Revzin, A.; Russell, R. J.; Yadavalli, V. K.; Koh, W. -G.; Deister, C.; Hile, D. D.Mellott, M. B.; Pishko, M. V. Langmuir 2001, 1
29. Kuo, T. -C.; Cannon, D. M. Jr.; Chen, Y.; Tulock, J. J.; Shannon MBohn, P. W. Anal. Chem. 2003, 75(8), 1861-1867. Cannon, D. M. Jr.; Kuo, T. -C.; Bohn, P. W.; Sweedler, J. V. An2224-2230. Canal, T.; Peppas, N. A. J. Biomed. Mater. Res. 198
32. Rice, C. L.; Whitehead, R. J. Phys. Chem. 1965, 69(11), 4017-4024. Rathore, A. S
34. Ermakov, S. V.; Jacobson, S. C.; Ramsey, J. M. Anal. Chem. 1998, 70(21), 4494-4504. 35. Ermakov, S. V.; Jacobson, S. C.; Ramsey, J. M. Anal. Chem. 2000, 72
- 13 -
Research Proposal Rahul Dhopeshwarkar
36. Li, D.; Ren, L. J. Colloid Interface Sci. 2002, 254, 384-395. 37. Anderson, J. .; Quinn, J. A. Biophys. J. 1974, 14, 130. 38. Johnson, K. A.; Westermann-Clark, G. B.; Shah, D. O. Langmuir 1989, 5, 932-938. 39. Ende, M.; Peppas, N. A. J. Appl. Polym. Sci. 1996, 59, 673-685.
- 14 -