simulation of radar cross section (rcs) of a submarine ... · the main function of maritime...
TRANSCRIPT
UDT 2019 Presentation / Panel
Simulation of radar cross section (RCS) of a submarine wake at periscope depth
C. Kerbiriou 1*, E. Letouze1, R. Le Creurer1, A. Doradoux2 et M. Gouin2 1 Naval Group, Lorient, France
2 SIREHNA, Technocampus de l’Halbrane, Bouguenais, France
Abstract - Naval Group is the European leader in naval defense. Naval Group designs, builds and maintains submarines. Their stealth has a major focus in the design. Indeed, depending on the operational missions of a submarine, it may be close to the surface or at periscope depth. In these two configurations the submarine may be particularly vulnerable to radar threats. To obtain reduced levels of signatures and improve the stealth of the submarine, its design follows a signature management process for different detection cases. In the case of a submarine at periscope depth with a hoisted mast, and considering aircraft threat, its stealth corresponds to a minimization of radar cross section (RCS) levels. The origin of these signatures comes from two major sources, the submarine itself and the deformation of the free surface induced by the submarine. In this article, we are particularly interested in the signatures induced by the wake generated by a submarine mast crossing the free surface. The method developed in the present paper in order to evaluate the signature levels of the wake generated by a mast piercing the free surface is presented through the academic application case of a cylindrical mast of circular cross-section crossing the free surface (similar to a periscope mast). A two-step approach is adopted. The first step concerns the modelling of the free-surface deformation generated by the mast, with the use of numerical simulations (CFD), which are validated thanks to the literature. The second step consists in simulating the RCS signatures of this deformed free-surface according to the geometry of an operational theater and different threat sensors. The RCS simulation of the
deformed free surface is carried out with SBR (Shooting-and-Bouncing-Rays) asymptotic methods.
1 Introduction The main function of maritime surveillance radars is to detect targets above the water surface, such as a ship, a submarine at periscope depth or a surfaced submarine. Historically, maritime surveillance has always aimed at securing high-traffic transit areas. In maritime surveillance, commonly used sensors are mainly coastal radars (typically mounted on semaphores) or radars mounted on patrol ships and aircraft. The advantage of such systems is the relatively low operation cost (for coast stations) and good spatial and temporal availabilities. In this work we are interested in the wake generated by a submarine mast. We have intentionally ignored the issue of detecting the submarine itself, because this problem is already widely studied in the literature. There is one reason for which ship detection do not usually focus on wakes. The wake detection is computationally intensive. Thus it seems interesting to limit the scope of the study to the wake of the mast itself, as the signature of the ship design has already been widely studied. Indeed, several arguments can go in favor of wake detection. Firstly, wakes are often visible over great distances, several tens of kilometers. Secondly a wake provides a lot of information about a ship: first, its heading and an indication of presence, but also its speed and potentially its dimensions and the shape of its hull. Finally, build a ship in order to obtain a "stealthy" form is nowadays easy, but it is more difficult to hide its wake. If we consider a cylindrical mast, its RCS (radar cross
section) level decreases rapidly with the increasing angular configurations, which can be resulting for instance from the movements of the submarine (roll, site). Therefore, it can be considered that the absolute site of 0 ° is rarely factual. In this work, a two-step approach is adopted. The first step consists in computing the mast wake - particularly the free surface elevation – thanks to a CFD method. Then, the free-surface deformation is used to explore the RCS levels of the wake from the scene parameters: the submarine's mast and its environment. It allows the evaluation of the major contributions of the RCS of a submarine at periscope depth. Thus, this paper is constructed as follows. Firstly, the modeling of the submarine wake geometry with a CFD method is presented. Then the computation of the scattering field is described and finally some results and conclusions are drawn.
2 Computation of the mast wake with a CFD method
2.1 Background The flow around a circular cylinder is characterized by the development of complex free-surface deformations. For submarine cylindrical masts, typical Reynolds numbers are around 10� to 10� - falling into the critical to supercritical region - and thus making difficult the correct prediction of the drag coefficient [1]. Indeed, in

UDT 2019 Presentation / Panel this region, the drag coefficient is decreasing suddenly while increasing the Re number. When dealing with submarine masts, Froude numbers are around 1 to 4, leading to some characteristics patterns, depending on the Froude numbers [7]. Thus the numerical modelling of such flows is quite challenging and it has been for a long time a subject of theoretical and analytical research in the naval hydrodynamic field. Both experimental works ([7] , [9], [10]) and numerical studies have been conducted to solve this complex problem. First of all, for the case of single phase flows, in [13] the authors compared URANS and DES turbulence modelling at �� = 9.310� and �� = 5.510� without correctly reproducing the drag drop. In [14] the authors performed single phase LES simulations in the subcritical to supercritical regimes and obtained the expected drag coefficient drop. Other authors consider a cylinder piercing a free surface ([8], [15], [16]). In [8] LES simulations were conducted for different Re and Fr numbers with constant ratio Re/Fr, showing the quite correct prediction of the drag coefficient and of the free-surface deformation. [16] used a RANS modelling of the turbulence and found that RANS studies are enough accurate to capture the free surface elevation. This paper focuses on the free surface deformation induced by the cylinder. A RANS modelling approach appears to be sufficient and is thus adopted. The interesting quantities are mainly the free-surface deformation in front of the cylinder (bow wave height) and behind the cylinder (trough depth), as well as the cylinder wake.
2.3 Numerical set-up A numerical approach using the open source finite volume computational fluid dynamics (CFD) package OpenFOAM v17.12 [2] is used to simulate the incompressible flow past a vertical circular cylinder piercing the free-surface. The URANS simulations use the interFoam solver with a kω-SST turbulence modelling. Turbulence parameters are chosen according to [11]. A target of y+=0.5 is used so that no wall law is employed. The air-water interface is tracked using a Volume Of Fluid (VOF) method with interface recompression:
��
��+ ∇. ���� + ∇. [����1 − ��] = 0, (1)
where Ur is the relative velocity. The numerical domain is constructed as follows: in the horizontal plane, it contains 25D downstream, 60D upstream and 50D in the transverse direction. In the vertical direction, it contains 10 cylinder diameters below the free-surface and 5 diameters above. The mesh is generated with the inbuilt OpenFOAM meshing software blockMesh. Two operating conditions have been simulated: the case with D=0.2m and V=2.3kts (leading to Re=234000 and Fr=0.8). This case is compared to the experimental data
of [7] and the numerical results of [8]. A second case with D=0.2m and V=6kts (Re=614000 and Fr=2.21) is simulated to investigate the effect of a higher submarine speed on the free-surface deformation. 2.3.1 v=2.3 knots A first simulation is carried out with Re=234000 - Fr=0.84. This first simulation aims at validating the method. For this case, the mesh is presented on Fig 1. It consists of 12M of cells. A mesh convergence has been performed to ensure that the main surface quantities are correctly captured with this discretization.
Fig 1. Mesh of the computational domain.
The free-surface deformation on the whole domain and close to the mast is presented in Fig 2 and Fig 3. A good agreement is found with [8]. A synthetic comparison with experimental result [7] and numerical simulation [8] is given in Table 1. The bow wave in front of the cylinder is well reproduced as well as the Kelvin wake angle. The trough depth behind the cylinder is slightly overestimated in our simulation. For this case, results are in good agreement with the available data.

UDT 2019 Presentation / Panel
Fig 2. Free surface elevation (from above). Re=234000 and
Fr=0.84.
Reference Simulation
Bow wave height (/D)
0.35 (Bernoulli) 0.35[[7] 0.33 [8]
0.34
Trough depth (/D) 0.20 (anal. [17])
0.2 [7] 0.24 [8]
0.28
Kelvin wake angle
19.5 18-19
Table 1. Results for Re=234000 and Fr=0.84.
Fig 3. Free surface elevation close to the mast. Above: our
result. Below: Results from Koo et al. Re=234000 and Fr=0.84.
2.3.2 v=6 knots
Another simulation is performed with Re=614000 and Fr=2.21 to investigate the effect of a higher mast speed. The mesh contains 18 M of cells. The free-surface deformation over the whole domain and close to the mast is presented in Fig 2 and Fig 3. The bow wave in front of the cylinder is well reproduced (cf Table 2). The trough depth behind the cylinder is underestimated in our simulation, but it has been reported that it can depart from the analytical formula given in [17] for high values of Re and Fr [7]. Moreover, in the present application of wake detection with rays, the correct reproduction of the through depth is not an important parameter.
Reference Simulation
Bow wave height (/D)
2.44 (Bernoulli)
2.06
Trough depth (/D) 1.4
(anal. [17])
0.55
Kelvin wake angle < 19° 16°
Table 2. Results for Re=614000 and Fr=2.21.
2.3.2 Conclusion
The numerical simulation of a circular mast piercing the free-surface has been presented for two mast speeds. The two free-surface deformation obtained with the presented CFD method will be used in the next paragraphs for the computation of the mast signature.
Fig 4. Free surface elevation (from above). Re=614000 and
Fr=2.21.
Fig.5. Free surface elevation close to the mast. Re=614000 and
Fr=2.21.

UDT 2019 Presentation / Panel 3 Scattering field modeling
3.1 Methodology / Introduction To model the RCS of targets, useful techniques have already been developed and are known to provide realistic results. They can be based on exact methods (integral equations, method of moments...) or asymptotic methods. For now, exact methods are unfortunately not optimized to calculate the scattered field from a large tridimensional complex object or scene. That is why most simulation software are based on asymptotic methods. In this paper, in order to model the scattered field by a complex scene, a combination of geometrical optics, physical optics and of the method of equivalent currents has been used. The method of ray tracing and reflection radiation (SBR) has also been used. A dense grid of geometric optical rays representing the incident wave is projected onto the surface and followed as the rays bounce between surface irregularities. Then, in order to obtain the scattered field, the theory of physical optics is used to integrate the surface fields. This method requires the radius of curvature of the surface to be much larger than the wavelength, but the effects of multiple scattering and shading are automatically included. Agreement between the results of the SBR and the method of moments for periodic and random rough surfaces has demonstrated the feasibility and accuracy of the SBR method. The considered modelling also includes the shadowing and multi-path effects for more accuracy. This modelling can be considered as an electromagnetic tool for RCS evaluation and for the generation of radar signals in maritime environments. The new aspect in this contribution is the introduction of complex objects as the wake of a submarine in the maritime environment. This method provides a suitable approximation for a weak computational burden in comparison with exact methods [6]. Moreover, for RCS accuracy, the modelling proposed here includes the shadowing effects and multiple-bounce (up to 20).
Fig. 6. The wake of cylindrical mast The computation of the considered asymptotic methods needs a geometrical description of the target or the scene. Therefore, a triangular surface mesh of the scene is considered. To generate the target (the wake and the cylindrical mast), a software 3D CAO has been used. The asymptotic solver of the commercial software CST Microwave Studio (MWS) have been employed for the RCS simulation. In [4] the authors have shown that there
is overall excellent agreement between the measurements and the RCS calculated with the SBR method using rays for targets whose dimensions are large relative to the wavelength.
3.2 Structure profile and simulation setup - Model descriptionThe complex structure selected for RCS computation is the scaled model of a typical cylindrical mast and its wake, depicted in Figure. 6. The configuration of the submarine at periscope depth is modeled by a cylindrical mast. The mast presents a diameter of 200 mm and its length above the free-surface level is ~0.9 m. The mast wake and the corresponding bow wave height are given from the numerical simulations presented in section 2, with a mast speed of 4 knots, 2.3 knots and 6 knots. The free-surface is considered to be initially at rest.
3.3 Geometry of the problem
Today, the main threat for submarine is patrol aircrafts, which have the ability to detect a submarine at great distances. Thus, the far-field theory is applicable by the principle of respect of the Franhofer criteria. Classically, these survey radars are called "monostatic", which means that the radar receiver is placed at the same location than the radar transmitter. The radar transmits in X band, the calculations are carried out with 10 GHz in polarization HH and VV. For these case studies, we consider the RCS levels of the target without taking into account the atmospheric propagation phenomena, so we obtain the intrinsic RCS of the RCS in free-space. The geometrical aspect of the scene depends on the angle of elevation (θ) and azimuth (ϕ) as shown in Figure 2. The calculations are then performed for a grazing angle (89 °) and on the angular range in azimuth from 0 ° to 360 ° around the target with 90 ° is full starboard and 270 ° full port.
Fig. 7. Scene diagram
3.4 Method
The analysis method follows the diagram presented in Figure 8.
UDT 2019 Presentation / Panel
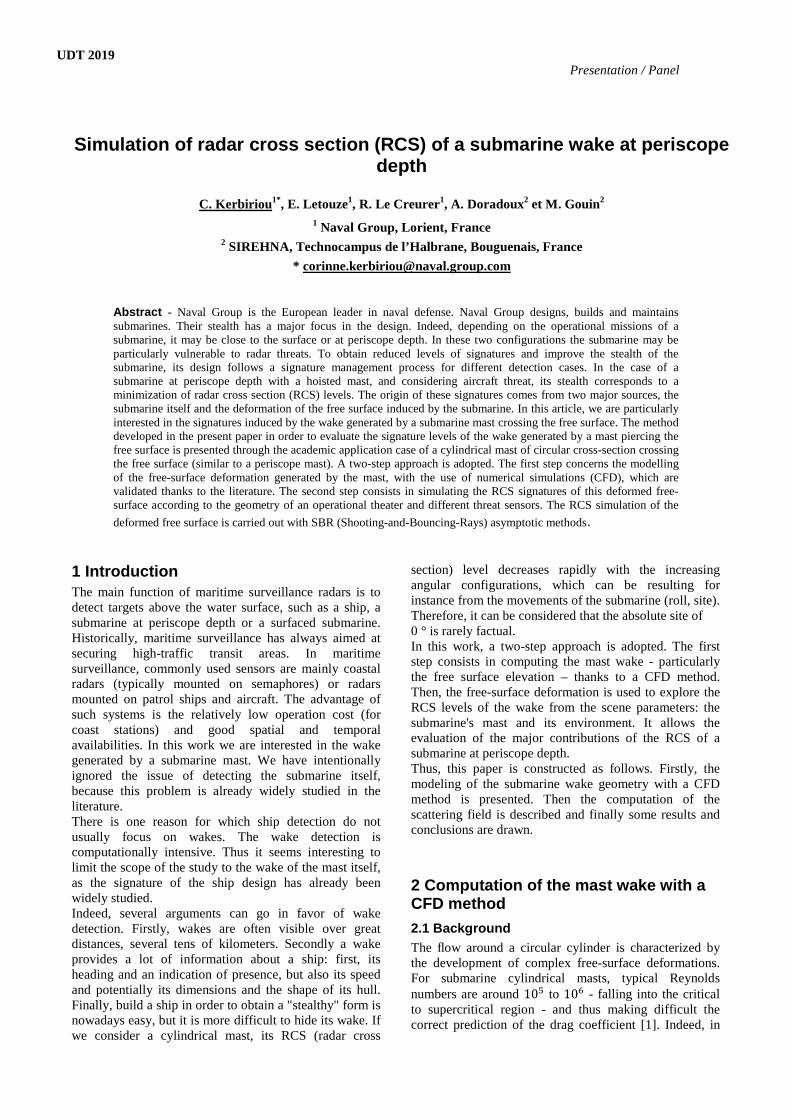
Fig. 8. : Analysis methodology’s organigram
Firstly, the calculation of the RCS is performed on the entire 3D model of the target consisting of the cylindrical mast, the bow wave and the wake as shown on Figure 9. In an envelope, the materials that constitute contributors are in PEC.
Fig. 9. The target
Fig. 10. Global RCS pol VV – RCS level ( dBsm)/azimuth(°)
The global RCS is shown in Figure 10 for a grazing angle (89 °) and a mast speed of 4 knots . The maximum levels exceed the criteria level at ~50° and ~300° in azimuth and ~180° in azimuth. In order to evaluate major contributions, the RCS of each source of indiscretion is calculated separately.
3.4.1 Azimuth [44-62.5]° and [300-314]°
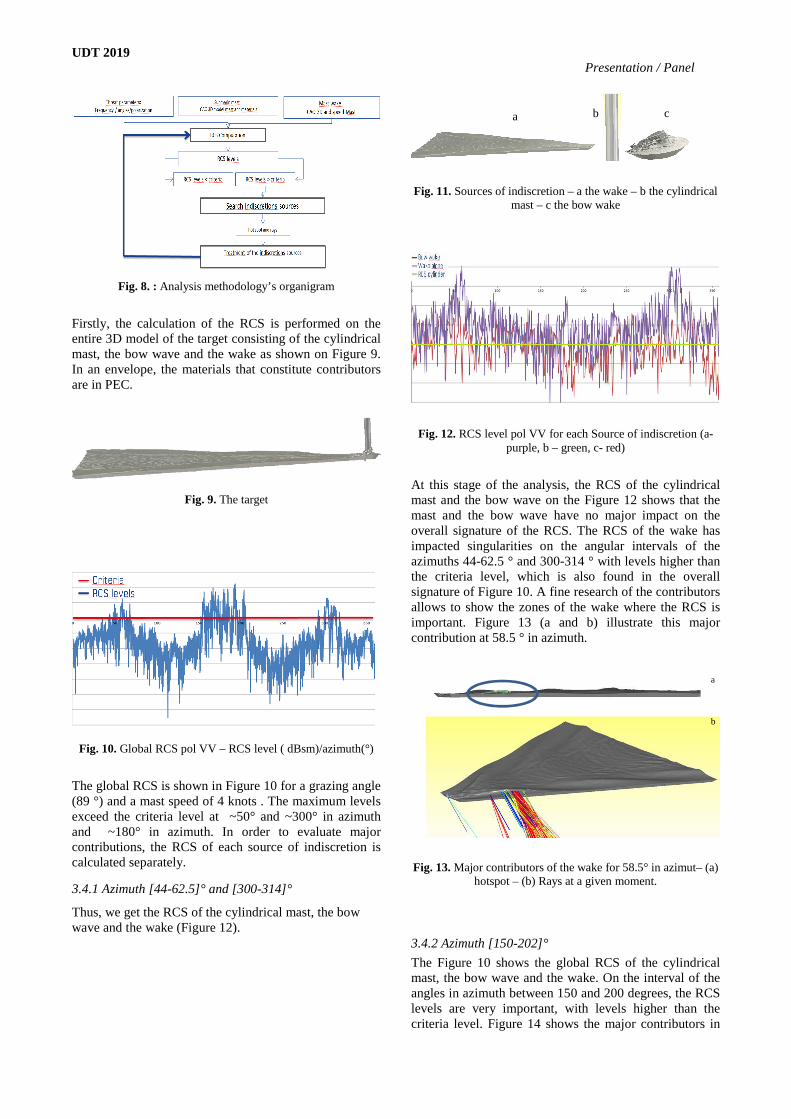
Thus, we get the RCS of the cylindrical mast, the bow wave and the wake (Figure 12).
Fig. 11. Sources of indiscretion – a the wake – b the cylindrical mast – c the bow wake
Fig. 12. RCS level pol VV for each Source of indiscretion (a-purple, b – green, c- red)
At this stage of the analysis, the RCS of the cylindrical mast and the bow wave on the Figure 12 shows that the mast and the bow wave have no major impact on the overall signature of the RCS. The RCS of the wake has impacted singularities on the angular intervals of the azimuths 44-62.5 ° and 300-314 ° with levels higher than the criteria level, which is also found in the overall signature of Figure 10. A fine research of the contributors allows to show the zones of the wake where the RCS is important. Figure 13 (a and b) illustrate this major contribution at 58.5 ° in azimuth.
Fig. 13. Major contributors of the wake for 58.5° in azimut– (a) hotspot – (b) Rays at a given moment.
3.4.2 Azimuth [150-202]°
The Figure 10 shows the global RCS of the cylindrical mast, the bow wave and the wake. On the interval of the angles in azimuth between 150 and 200 degrees, the RCS levels are very important, with levels higher than the criteria level. Figure 14 shows the major contributors in
a b c
a
b

UDT 2019 Presentation / Panel this area. This is the multi-reflection of electromagnetic waves between the cylinder and the surface of the sea that is deformed by the wake on the back. The phenomenon of mutireflexions increases the level of RCS considerably. However, the hypothesis that has been made for this simulation, is the major hypothesis where the sea is considered totally reflective. It is likely that the phenomenon of multireflections will be less important if the true dielectric parameters of the sea are considered.
Fig. 14. Major contributors of the wake for 158.5° in azimut– (b) hotspot – (a) Rays at a given moment.
4 Results Previously, we have shown that the wake could have a major impact on the overall RCS of a submarine at the periscope depth. In this part, we evaluate how the RCS of the wake evolves, according to some parameters.
4.1 Influence of dielectric parameters The scattering properties of the wake depend on both its electromagnetic characteristics and its state (geometrical aspect). The geometrical properties of the free surface can be modeled by the height as a function of the position (x; y) and time t. The electromagnetic characteristics of the sea are defined by the dielectric constant which depends on both the temperature and the salinity [3]. The dielectric characteristics of the wake are taken into account in the CST software as a layer of materials with a one meter thickness and defined by εr coated to a PEC. Calculations were made for the dielectric parameters corresponding to the Atlantic Ocean (εr = 56.9 + 33.4i),
for the Baltic Sea (εr = 41+41i) and the Dead Sea (εr = 8 + 33i) for example. Then, the RCS level is 10 dB less than the hypothesis of a totally reflective wake. There is also an average difference of 2 dB depending on the geographical area.
Fig. 15. RCS level of the wake according to sea criteria. (green : Baltic sea, red : Ocean Atlantic, blue : The dead sea)
4.2 RCS of the wake as a function of time Previous studies have assumed that the wake was static over time. The wake of the submarine with speed changes with time. The geometric characteristics changes as a function of time considering a cycle of 6 seconds. The RCS was calculated to PEC wake every 0.5 seconds for a speed of 2.3 knots. The RCS behavior as a function of time is almost identical around an average value with a standard deviation of 3 dB on one cycle
Fig. 16. RCS level of the wake according to time criteria.
Fig. 17. Means RCS level of the wake according to time criteria.
a
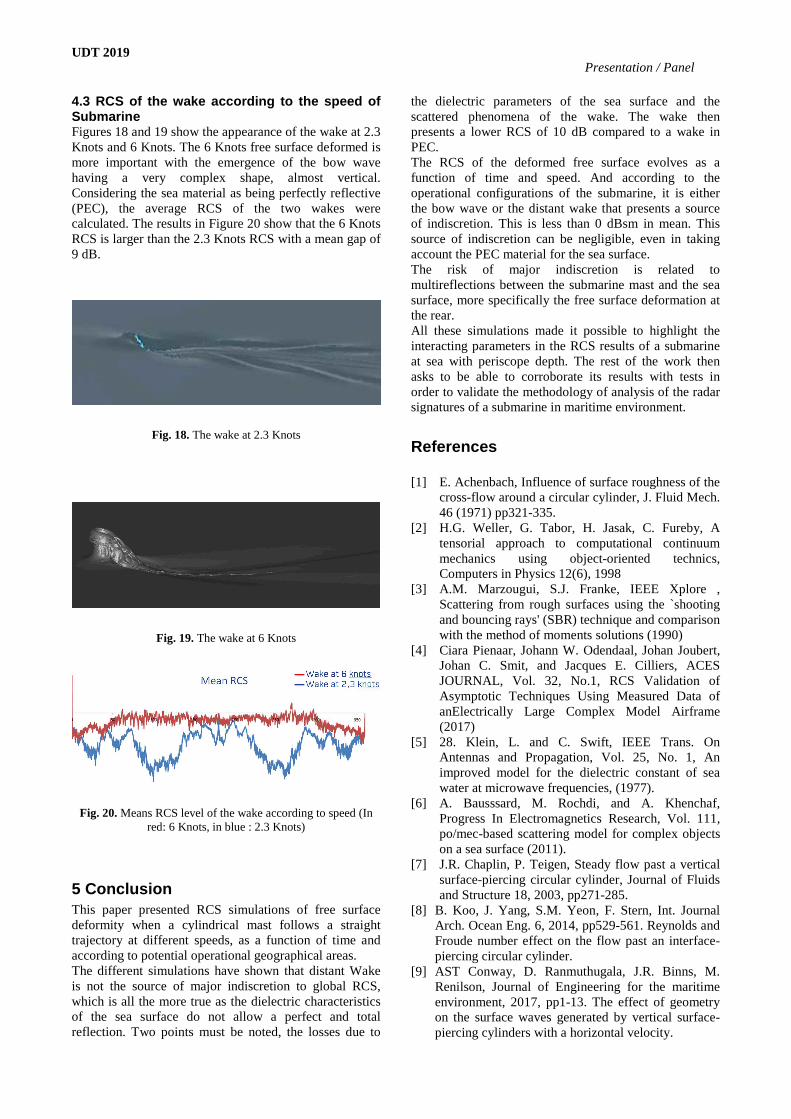
UDT 2019 Presentation / Panel 4.3 RCS of the wake according to the speed of Submarine Figures 18 and 19 show the appearance of the wake at 2.3 Knots and 6 Knots. The 6 Knots free surface deformed is more important with the emergence of the bow wave having a very complex shape, almost vertical. Considering the sea material as being perfectly reflective (PEC), the average RCS of the two wakes were calculated. The results in Figure 20 show that the 6 Knots RCS is larger than the 2.3 Knots RCS with a mean gap of 9 dB.
Fig. 18. The wake at 2.3 Knots
Fig. 19. The wake at 6 Knots
Fig. 20. Means RCS level of the wake according to speed (In red: 6 Knots, in blue : 2.3 Knots)
5 Conclusion This paper presented RCS simulations of free surface deformity when a cylindrical mast follows a straight trajectory at different speeds, as a function of time and according to potential operational geographical areas. The different simulations have shown that distant Wake is not the source of major indiscretion to global RCS, which is all the more true as the dielectric characteristics of the sea surface do not allow a perfect and total reflection. Two points must be noted, the losses due to
the dielectric parameters of the sea surface and the scattered phenomena of the wake. The wake then presents a lower RCS of 10 dB compared to a wake in PEC. The RCS of the deformed free surface evolves as a function of time and speed. And according to the operational configurations of the submarine, it is either the bow wave or the distant wake that presents a source of indiscretion. This is less than 0 dBsm in mean. This source of indiscretion can be negligible, even in taking account the PEC material for the sea surface. The risk of major indiscretion is related to multireflections between the submarine mast and the sea surface, more specifically the free surface deformation at the rear. All these simulations made it possible to highlight the interacting parameters in the RCS results of a submarine at sea with periscope depth. The rest of the work then asks to be able to corroborate its results with tests in order to validate the methodology of analysis of the radar signatures of a submarine in maritime environment.
References
[1] E. Achenbach, Influence of surface roughness of the cross-flow around a circular cylinder, J. Fluid Mech. 46 (1971) pp321-335.
[2] H.G. Weller, G. Tabor, H. Jasak, C. Fureby, A tensorial approach to computational continuum mechanics using object-oriented technics, Computers in Physics 12(6), 1998
[3] A.M. Marzougui, S.J. Franke, IEEE Xplore , Scattering from rough surfaces using the `shooting and bouncing rays' (SBR) technique and comparison with the method of moments solutions (1990)
[4] Ciara Pienaar, Johann W. Odendaal, Johan Joubert, Johan C. Smit, and Jacques E. Cilliers, ACES JOURNAL, Vol. 32, No.1, RCS Validation of Asymptotic Techniques Using Measured Data of anElectrically Large Complex Model Airframe (2017)
[5] 28. Klein, L. and C. Swift, IEEE Trans. On Antennas and Propagation, Vol. 25, No. 1, An improved model for the dielectric constant of sea water at microwave frequencies, (1977).
[6] A. Bausssard, M. Rochdi, and A. Khenchaf, Progress In Electromagnetics Research, Vol. 111, po/mec-based scattering model for complex objects on a sea surface (2011).
[7] J.R. Chaplin, P. Teigen, Steady flow past a vertical surface-piercing circular cylinder, Journal of Fluids and Structure 18, 2003, pp271-285.
[8] B. Koo, J. Yang, S.M. Yeon, F. Stern, Int. Journal Arch. Ocean Eng. 6, 2014, pp529-561. Reynolds and Froude number effect on the flow past an interface-piercing circular cylinder.
[9] AST Conway, D. Ranmuthugala, J.R. Binns, M. Renilson, Journal of Engineering for the maritime environment, 2017, pp1-13. The effect of geometry on the surface waves generated by vertical surface-piercing cylinders with a horizontal velocity.
UDT 2019 Presentation / Panel [10] M. Inoue, N. Bara, Y. Himeno, Journal of the Kansai
Society of Naval Architects, Japan 220, 1993, pp57-64 . Experimental and numerical study of viscous flow field around an advancing vertical circular cylinder piercing a free-surface.
[11] F.R. Menter, AIAA Journal, 32 (8): 1598–1605, 1994. Two-Equation Eddy-Viscosity Turbulence Models for Engineering Applications.
[12] P. Catalano, M. Wang, G. Iaccarino, P. Moin, Int. J. of Heat and Fluid Flow 24, 2003, pp 463-469. Numerical simulation of the flow around a circular cylinder at high Reynolds numbers.
[13] G. Vaz, C. Mabilat, R. van der Wal, P. Gallagher, Proceedings of OMAE2007, June 10-15, 2007, San Diego, California, USA. Viscous flow around computations on smooth cylinders: A detailed numerical study with validation".
[14] S M Yeon, J. Wang, F. Stern, Applied Ocean Research 59, 2016, pp 663-675. Large Eddy Simulation of the flow past a circular cylinder at sub to super-critical Reynolds numbers.
[15] T. Kawamura, S. Mayer, A. Garapon, L. Sorensen, Journal of Fluid Engineering, ASME, 2002. Large Eddy Simulation of a flow past a free surface piercing circular cylinder.
[16] X. Xiao, T. Tezdogan, A. Incecik, Techno-Ocean (2016), pp618-623. Numerical study on wave run-up height and depression depth around a vertical cirvular cylinder at various Froude numbers.
[17] A.D. Hay, Princeton University Report, 1947, Princeton. Flow about semi-submerged cylinders of finite length.