simulation experiments on the design of highway variable
TRANSCRIPT

Simulation Experiments on the Design of Highway VariableMessage Signs (VMS)
by
Michalis Stavrou Kilaras
B.S., Aerospace Engineering and MechanicsUniversity of Minnesota, 1994
Submitted to the Department of Mechanical Engineering in partial fulfillment ofthe requirements for the degree of
Master of Science in Mechanical Engineering
at the
MASSACHUSETTS INSTITUTE OF TECHNOLOGY
September 1996
© Massachusetts Institute of Technology 1996. All rights reserved
A uthor........................................................................ . .......... ....Department of Mechanical Engineering
July 1, 1996
Certified by....................................................... ......... ..............Thomas B. Sheridan
Ford Professor of Engineering and Applied PsychologyThesis Supervisor
A ccepted by................................................ ..............................................................Ain A. Sonin
Chairman, Departmental Committee on Graduate Studies
w i:
DEC 0 3 1996

Simulation Experiments on the Design of Highway Variable Message Signs(VMS)
by
MICHALIS STAVROU KILARAS
Submitted to the Department of Mechanical Engineering on July 2, 1996 in partial fulfillment ofthe requirements for the Degree of Master of Science in Mechanical Engineering
ABSTRACT
A number of different conceptual designs for Highway Variable Message Signs(VMS) were demonstrated and tested experimentally. This work provides guidelinesfor the design of Signs in the Highways of the 21st century. Particularly, the resultswere intended to be used in the final configuration of the VMS for the CentralArtery/Third Harbor Tunnel Project in Boston Massachusetts. This is a largetransportation project with primarily underground highway sections, that will serve theheavy traffic moving through downtown Boston or connecting to Logan Airport.
The research and evaluation of different VMS configurations was done entirelyusing simulation techniques. It was divided into two main areas: (i) SubjectiveEvaluation. (initial troubleshooting and isolation of the primary parameters to beinvestigated) and (ii) Objective evaluation (a more precise and mathematical approachused to find a relation between the viewing time and the reaction time, the length ofmessage and the display configuration of the VMS message). The results define thelength and design of a VMS message as a function of the viewing distance.
The realization of the driving simulator was done using an actual mock-up of acar, or "virtual" car which was setup in the Human-Machine Systems Laboratory ofMIT. The experimental subject sat in the car and "drove" on an animated highwayenvironment projected on the wall in front of him. The animation was generated by acomputer code in C/C++.
Thesis Supervisor : Professor Thomas B. SheridanTitle : Professor of Engineering and Applied Psychology and
Professor of Aeronautics and Astronautics

Acknowledgments
Sailing towards a new port in my life, the moments of despair and the momentsof hard work as well as the excitement of achievement, dominate my thoughts.Learning has always been for me a strive for perfection and as that, it was a long andpainful procedure. I had to work hard and discipline myself a lot in order to succeedand survive in the competitiveness of academia. However without the help of a host ofpeople, the realization of my goals wouldn't have been possible. Right now, I feel it ismy duty to thank all these people and show them all the respect I have for them.
First of all I would like to thank my parents whose guidance and support hasalways been a lighthouse in my life. After becoming refugees in the Turkish invasion ofCyprus (my country) they deprived themselves everything to make sure that I wasdeprived nothing. Their courage and strength has always been for me a benchmark ofbehavior.
My residence at MIT as a graduate student was one of the most excitingexperiences in my life, not just because of the enormous knowledge that I received, butmore importantly because of my association with great people. My advisor, ProfessorThomas Sheridan with his encouragement and knowledge gave me his invaluableadvice which guided me through my project. Many thanks, also, to all the fellowmembers of the Human-Machine Systems Laboratory at MIT with whom I workedunder the same roof and their friendship was both fun and rewarding. Especially Iwould like to thank Mark Ottensmeyer, the computer guru in our lab, whose help withsoftware problems in my project was more than I would expect from a normal friend. Iwould also like to acknowledge the other members of my lab: Helias Marinakos, whowas one of my closest friends, Suyeong Kim, Thomas Chao, Nicholas Patrick, BernardoAumond, Jacob Einhorn, Jianjuen Hu, Yasuo Ishihara, James Thomson, MichaelTimmons, Steven Villareal, Jie Ren, David Schloerb, Shinsuk Park, Ed Lanzilotta andShumei Askey.
During my stay in the United States as a college student, I feel that I wasfortunate enough to meet the right people at the right place and the right time. As suchwere two of my closest friends: Michael Kestoras and Chris Christodoulou. Theirinfluence on me and their advice was all the best I could get and I really appreciate that.Michael Kestoras was my first roommate in college and a friend who supported memore than a father. Chris Christodoulou was the first friend that I made here in theU.S. and one that always offered me his sincere help. I will really miss hiscompanionship and long discussions we had in his office at MIT.
Finally I would like to express my respect and my admiration to my firstroommate here at MIT, Jeongho Park. The strength he showed during the death of hisfather was a great inspiration to me. I will never forget his companionship during mostof my extra time at MIT which was both fun and honest.

Table of Contents
A b stract ......................................................................................................................... 2
A cknow ledgm ents ................................................... ...................................................... 3
T able of C on ten ts................................................... ........................................................ 4
L ist of Figures......................................................................... ......................................... 5
L ist of T ab les........................................................................... ........................................ 6
1. Introduction
1.1 Overview of the CA/T Project..............................................7
1.2 Research in the Human Machine Systems Lab of MIT in support of the
C A /T Project......................................................... .............................................. 11
1.3 The Organization of the Thesis.............................................. 13
2. Subjective Evaluation: Searching for the critical parameters in the design
of VMS
2.1 Design and implementation issues..........................................14
2.2 Analytic Hierarchy Process (AHP)..................................... ...... 15
2.3 E xperim en ts....................................................... ............................................ 20
2.4 C onclusion ........................................................ ............................................. 26
3. Objective Measures Evaluation I: Reaction Time as a function of Message
Length
3.1 Preliminary Experiments.............................................. ...................... 27
3.2 Reaction Time (RT) vs. Message Length................................ ...... 31
3.3 Results-A nalysis................................................... ......................................... 34
3.4 C onclusion s....................................................... ............................................ 41
3.5 Recommendations..........................................41
4. Objective Measures Evaluation II: The importance of message
configuration or presentation format
4.1 Background Inform ation........................................... ................................... 43
4.2 Experim ents....................................................... ............................................ 48
4
4.3 Results-A nalysis...................................................... 51
4.4 Comments by the subjects on the general layout of the VMS signs............64
4.5 C onclusions....................................................... ............................................ 65
5. Recommendations for study..................................................66
R eferences ................................................................................................................... 67
A p p en d ices.................................................................................. ................................... 69
List of Figures
Chapter 1
Figure 1.1 CA/T project map overview......................................... ..............
Figure 1.2 IPC S.............................................................................. ......................... 9
Figure 1.3 OCC-CA/T project Feedback Control System..................................10
Chapter 2
Figure 2.1 A H P scale................................................... ......................................... 16
Figure 2.2 Display Preference Vector .......................................... ....... 19
Figure 2.3 V irtual C ar .................................................. ........................................ 20
Figure 2.4 Speed pie-chart.....................................................22
Figu re 2.5............................................................. ................................................. 23
Figure 2.6 Message Configuration ................................................... 25
Chapter 3
Figure 3.1 Results for Static Messages at 100ft.................................. .... 28
Figure 3.2 Results for Static Messages at 595ft ....................................... ... 29
Figure 3.3 Experimental setup...................................................... 32
Figure 3.4 Experimental Display............................................... 34
F ig u re 3 .5 ................................................................................................................... 35
Figu re 3.6........................................................................................................... . ..36
Figu re 3.7............................................................. ................................................. 36
Figure 3.8 Mean RT - Static Displays............................................ 37

Figure 3.9 Mean RT - Dynamic Displays................................ ......... 38
Figure 3.10 Mean RT - Dynamic Displays with Tracking Task.........................38
Chapter 4
Figure 4.1 View able Distance..................................................................................44
Figure 4.2 VM S layout designs I............................... ........................................ 46
Figure 4.3 VMS layout designs II...................................................47
Figure 4.4 V irtual C ar.............................................. ............................................ 48
Figure 4.5 Virtual Car Dashboard..............................................49
Figure 4.6 Experimental Procedure.............................................50
Figure 4.7 Non-scrolling, 35mph.................................................53
Figure 4.8 Non-scrolling, 45mph.................................................54
Figure 4.9 Non-scrolling, 55mph.................................................55
Figure 4.10 Non-scrolling 35mph, message configuration..................... .... 58
Figure 4.11 Non-scrolling 45mph, message configuration..................... .... 59
Figure 4.12 Non-scrolling 55mph, message configuration..................60
Figure 4.13 Slow-scrolling, 55mph...............................................62
Figure 4.14 Fast-scrolling, 55mph................................................. 63
List of Tables
Chapter 2
T ab le 2 .1 ...................................................................................................................... 17
T ab le 2 .2 ...................................................................................................................... 21
Chapter 3
T ab le 3 .1......................................................................................................................31
Chapter 4
T ab le 4 .1 ...................................................................................................................... 4 5
T ab le 4 .2 ...................................................................................................................... 5 1
T ab le 4 .3......................................................................................................................57

Chapter 1
Introduction
1.1 Overview of the CA/r Project
The city of Boston in Massachusetts, preparing to meet the challenges of the 21st
century and become a hub of international trading for all New England, is currently
building a very ambitious transportation project: The Central Artery and Third Harbor
Tunnel highway project. This project will help alleviate the traffic congestion which
clogs the Central Artery. Running through the heart of Boston, the Central Artery was
designed in the 1950s with a maximum capacity of 75,000 cars per day. However, the
traffic flow through this part of Boston is currently 190,000 cars per day. This results in
considerable traffic delays and will eventually affect negatively the economy of the
region.
The new Central Artery, currently under construction, will be an 8-10 lane
underground expressway which will increase the traffic flow to an estimated 250,000
vehicles daily. The new 7.5 mile Central Artery/Third Harbor Tunnel Project will
provide for the replacement of the elevated Central Artery (1-93) and will include a
tunnel beneath the inner harbor to improve access to Logan Airport. The Third Harbor
Tunnel segment will be a four lane, two-way (two lanes for each way) controlled access
toll highway of approximately 4 miles in length. It will connect the Massachusetts
Turnpike (1-90), Southeast Expressway (1-93), and South Station with Logan Airport and
Route 1A. For a better understanding of the configuration of the Project, the reader
should consult Figure 1.1. In total, the CA/T network will comprise 107 lane-miles of
roadway, 33 lane miles of which will be underground sections.

For maximum efficiency of the Project in terms of minimizing congestion delays
and traffic accidents, a number of different Smart Highway Technologies will be
deployed. Among these, there will be 400 closed circuit TV cameras monitoring the
whole Highway, 130 Electronic Variable Message Signs and 30 infrared truck
overheight detectors.
THE CENTRAL ARTERY TUNNEL (CA/T)
OPERATIONSCONTROL
- CENTER
(OCC)
Figure 1.1
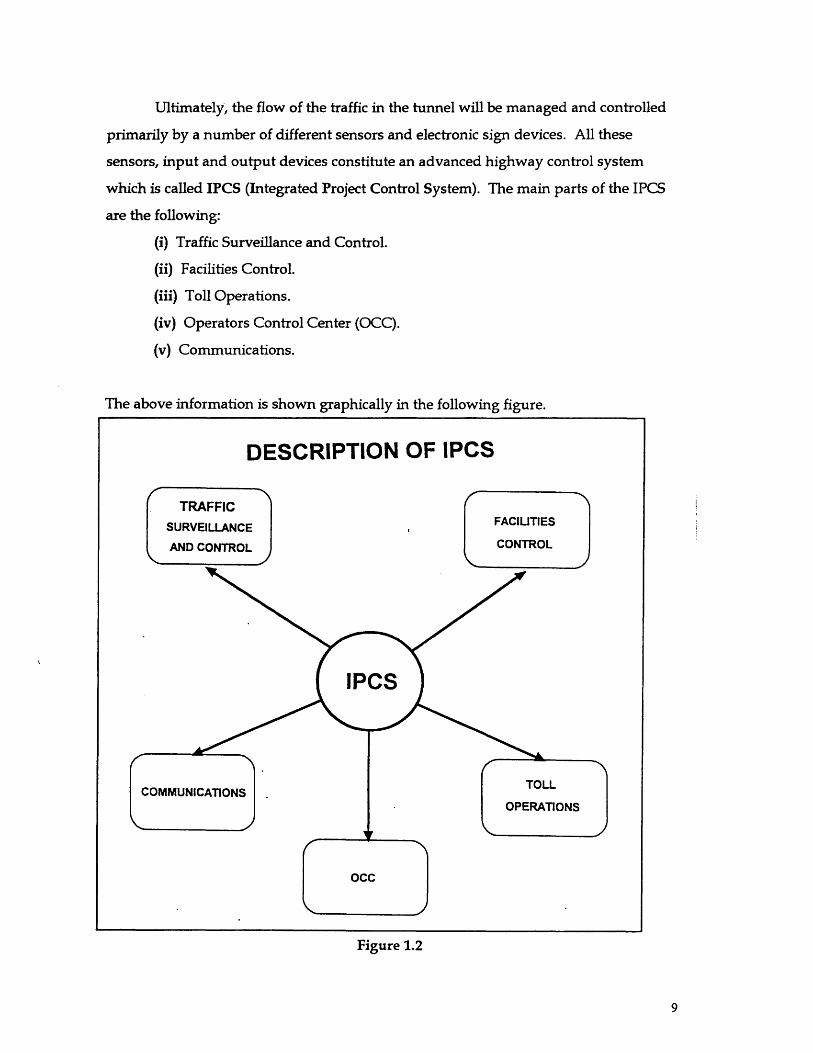
Ultimately, the flow of the traffic in the tunnel will be managed and controlled
primarily by a number of different sensors and electronic sign devices. All these
sensors, input and output devices constitute an advanced highway control system
which is called IPCS (Integrated Project Control System). The main parts of the IPCS
are the following:
(i) Traffic Surveillance and Control.
(ii) Facilities Control.
(iii) Toll Operations.
(iv) Operators Control Center (OCC).
(v) Communications.
The above information is shown graphically in the following figure.
Figure 1.2
DESCRIPTION OF IPCS

The Operators Control Center (OCC) is the part of the IPCS where there is
considerable real time interaction between the human (Operator) and the System. The
Operator is an integral part of the IPCS and plays an important role in the
determination of the output of the system. The operators in the OCC change the status
of different electronic devices in the system which eventually control the traffic flow.
These devices are the following: Line Use Signs (LUS), Variable Speed Limit Signs
(VSLS), Variable Message Signs (VMS), Highway Advisory Radio (HAR) and Block Out
Signal (BOS). So the state of these devices constitutes the input to the IPCS and
ultimately the input to the Highway System.
As a result of the above input the traffic flow characteristics will change. This
traffic flow basically represents the output of the system. The change in the traffic flow
will eventually affect the signals generated by the different sensors in the system. These
sensors are the Loop detectors, the Video-Camera devices, the CO detectors, the Fire
detectors etc.
The role of the OCC as a vital control part of the traffic flow in the highway is
depicted in the following figure. Note that the U stands for the Input and S for the
Sensors. Also YTF represents the changing characteristics of the Traffic Flow:
Figure 1.3
1.2 Research in the Human Machine Systems Lab of MIT in support of the
CA/f Project.
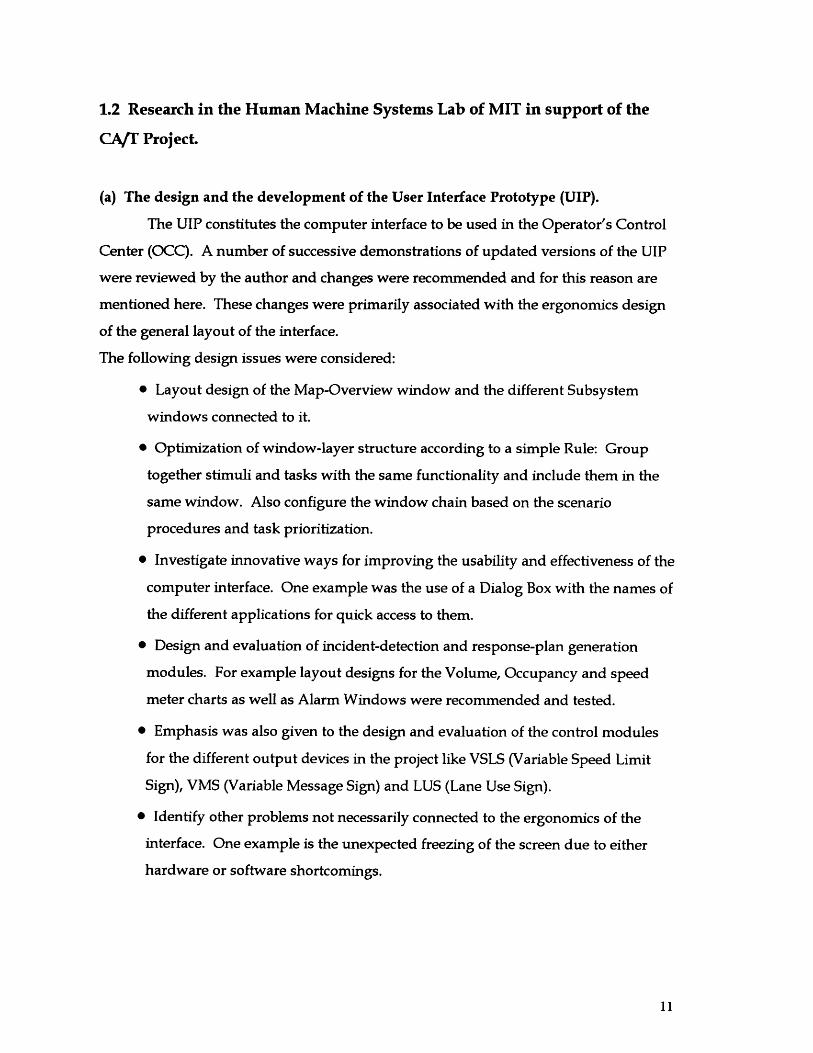
(a) The design and the development of the User Interface Prototype (UIP).
The UIP constitutes the computer interface to be used in the Operator's Control
Center (OCC). A number of successive demonstrations of updated versions of the UIP
were reviewed by the author and changes were recommended and for this reason are
mentioned here. These changes were primarily associated with the ergonomics design
of the general layout of the interface.
The following design issues were considered:
* Layout design of the Map-Overview window and the different Subsystem
windows connected to it.
* Optimization of window-layer structure according to a simple Rule: Group
together stimuli and tasks with the same functionality and include them in the
same window. Also configure the window chain based on the scenario
procedures and task prioritization.
* Investigate innovative ways for improving the usability and effectiveness of the
computer interface. One example was the use of a Dialog Box with the names of
the different applications for quick access to them.
* Design and evaluation of incident-detection and response-plan generation
modules. For example layout designs for the Volume, Occupancy and speed
meter charts as well as Alarm Windows were recommended and tested.
* Emphasis was also given to the design and evaluation of the control modules
for the different output devices in the project like VSLS (Variable Speed Limit
Sign), VMS (Variable Message Sign) and LUS (Lane Use Sign).
* Identify other problems not necessarily connected to the ergonomics of the
interface. One example is the unexpected freezing of the screen due to either
hardware or software shortcomings.

* Test the usability of the computer interface based on real scenario procedures.
This was primarily done by measuring the time interval between incident
detection (Alarm window pops up) and Response Plan generation.
(b) Design and evaluation of different configurations for the Electronic Variable
Message Signs (VMS).
A computer simulation was programmed on the SGI machines of the
HMSL/MIT. This computer animation simulates the driving-through the tunnel effect.
Both subjective and objective measures were used for the evaluation of the different
VMS design alternatives. The main variables in the experiments were the following:
speed, length of message, configuration of message. More details on experiments and
results of the VMS signs will be discussed in the chapters that follow.
Finally a similar simulation for the tunnel was set up to be used as a driver-compliance
measure tool.
The thesis which follows is based entirely on (b) and not at all on (a).

1.3 The Organization of the Thesis
The chapters follow the chronological structure of my research work. The first
chapter is dedicated in providing some important and fundamental background
material for the project that sponsored my work, and it was ultimately the motivation
for everything that was done. The next three chapters (Chapter 2, 3 and 4), describe in
the necessary detail the research and the results. Chapter 2 starts with the description
of a procedure that evaluated subjectively different VMS designs and isolated the most
important parameters affecting these designs. Chapter 3, describes experiments to
answer the question of "how fast can the driver read and recognize a VMS with a
message of a certain length". Finally, Chapter 4, attacks the subject of the required
viewing time by the driver as a function of both the message length and presentation
format. In the last chapter, Chapter 5, some ideas for future directions in the same
research framework are discussed.
Chapter 2
Subjective Evaluation: Searching for the critical parameters in the design of
VMS.
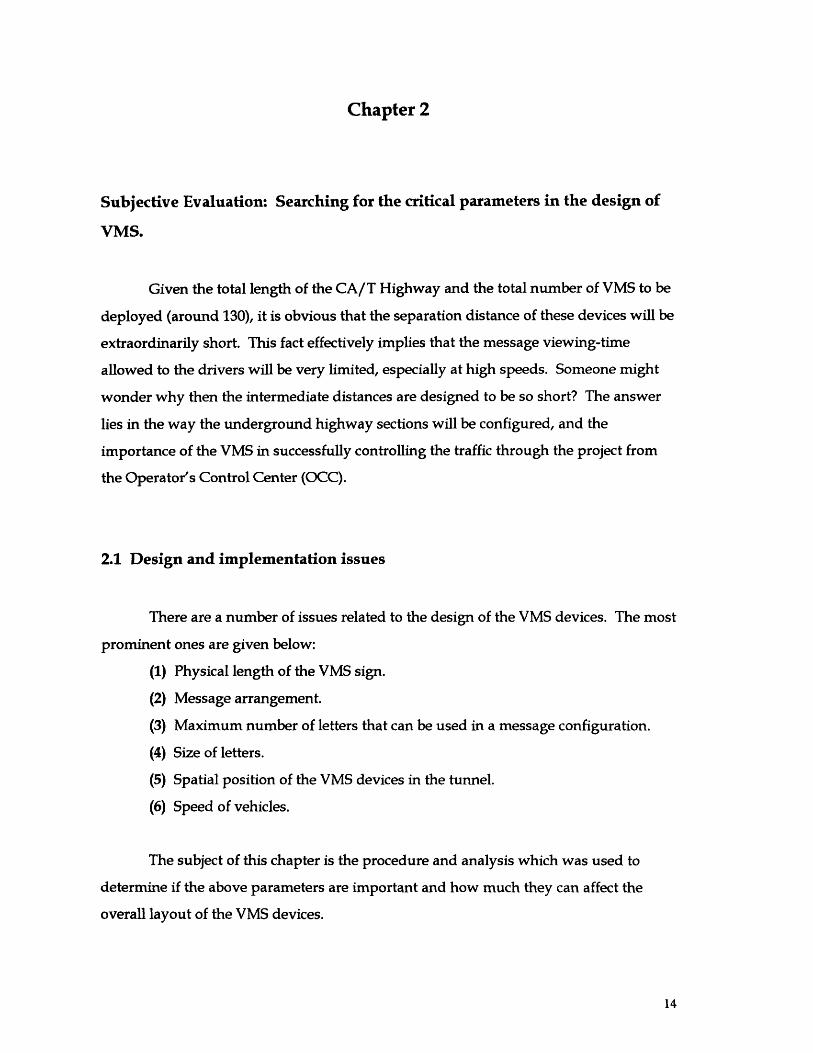
Given the total length of the CA/T Highway and the total number of VMS to be
deployed (around 130), it is obvious that the separation distance of these devices will be
extraordinarily short. This fact effectively implies that the message viewing-time
allowed to the drivers will be very limited, especially at high speeds. Someone might
wonder why then the intermediate distances are designed to be so short? The answer
lies in the way the underground highway sections will be configured, and the
importance of the VMS in successfully controlling the traffic through the project from
the Operator's Control Center (OCC).
2.1 Design and implementation issues
There are a number of issues related to the design of the VMS devices. The most
prominent ones are given below:
(1) Physical length of the VMS sign.
(2) Message arrangement.
(3) Maximum number of letters that can be used in a message configuration.
(4) Size of letters.
(5) Spatial position of the VMS devices in the tunnel.
(6) Speed of vehicles.
The subject of this chapter is the procedure and analysis which was used to
determine if the above parameters are important and how much they can affect the
overall layout of the VMS devices.
The procedure primarily involved the subjective evaluation of a number of
different displays based on their relative readability. Subjective evaluation was chosen
because it is quick, low cost and reliable enough if it is used in the right way. The
purpose was to define the most important parameters and not to give a mathematical
solution to the problem.
The method that was used was the Analytic Hierarchy Process (AHP). The
main reason for this, was the way the experiments were designed, which is a
comparison between multiple display options. The second reason is the tested
reliability of this method, not only in Human Factors studies, but also in a number of
different other fields. AHP has the advantage of producing statistically reliable results
from a relatively small number of human subjects.
The following sections start with a short preview of the Analytic Hierarchy
Process (AHP). I believe that this is important in understanding and appreciating the
design of the experiments, which are described thereafter.
2.2 Analytic Hierarchy Process (AHP)
AHP is a tool for obtaining subjective preferences of people operating a
machine. It provides a means of evaluating multiple design options using weighted
ranking scales.
Methodology
Successive pairs of different display designs are projected in front of the
subjects. All the design options are grouped into pairs. Both configurations of each
pair are displayed to the subjects successively. Then the subjects have to compare the
two configurations of each pair and use the following scale to identify the difficulty (or
easiness) of reading one display against the other.

Absolutely Mucheasier easier
I I I IEasier Slightly
easierSame
I I I i I I -I 121Slightlyeasier
Easier4 4
Much Absolutelyeasier easier ,
Figure 2.1
The left portion of the above scale is reserved for the display shown first as
indicated by the number 1, and the right portion, for the second display. So if the
second (2) display is rated easier to read than display 1, the subject has to put an X in
the box labeled "Easier" on the right. In the case the readability of the signs is judged
to be the same, the subject has to put an X in the middle box labeled "Same".
The grouping in pairs of the displays is based on a simple mathematical rule:
Find all the possible combinations of displays in groups of two. So given n design
alternatives to compare, the number(Np) of possible pairs is:
n!N =C" =p 2 2.(n - 2)!
Example:
Four (4) design alternatives are to be compared. Then six (6) paired comparisons will
take place:
N = C4 = 6

Judgment Matrix and Eigenvector Weightings
The data of each subject from the paired comparisons are placed in the judgment
Matrix (M). For n alternative display designs, M is an nxn matrix. The entry in M that
corresponds to the ith row and the jth column (mij), represents the dominance of
display design i over the display alternative j. The scale that was used is the following:
mij Explanation
1 Both i and j alternatives are of equal strength
3 Alternative i is slightly easier to read than alternative j
5 Alternative i is easier to read than alternative j
7 Alternative i is much easier to read than alternative j
9 Alternative i is absolutely easier to read than alternative j
Table 2.1
Scale values 2,4,6,8,10 are used to represent ratings in between.
So for example assume we have the following 4x4 M matrix (4 display-alternatives to
be compared):
1
YM12ml'2
i13
14
m1l21
iN24
m13
m23
1
n114
m24
m 34
The entries of the above matrix obey the AHP axiom of ratio scales which states
that if A is x times more dominant than B, then B is 1/x the dominance of A.
So for each subject we get a matrix M. Then we use this matrix to calculate the
eigenvector w that corresponds to the maximum eigenvalue X.,.
M= La... w
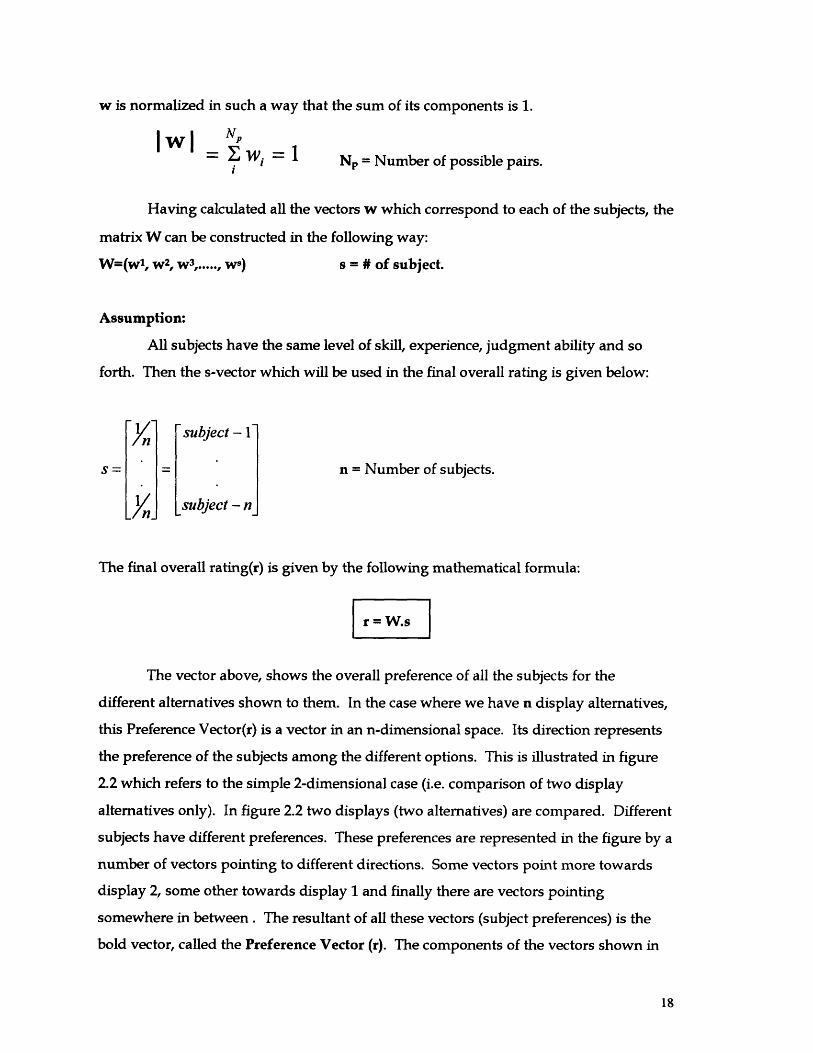
w is normalized in such a way that the sum of its components is 1.IwlNSWi N = Number of possible pairs.
Having calculated all the vectors w which correspond to each of the subjects, the
matrix W can be constructed in the following way:
W=(wl, 2 w 3, ..... , ws) s = # of subject.
Assumption:
All subjects have the same level of skill, experience, judgment ability and so
forth. Then the s-vector which will be used in the final overall rating is given below:
subject - 1
s = = n = Number of subjects.
subject - nj
'The final overall rating(r) is given by the following mathematical formula:
r = W.sThe vector above, shows the overall preference of all the subjects for the
different alternatives shown to them. In the case where we have n display alternatives,
this Preference Vector(r) is a vector in an n-dimensional space. Its direction represents
the preference of the subjects among the different options. This is illustrated in figure
2.2 which refers to the simple 2-dimensional case (i.e. comparison of two display
alternatives only). In figure 2.2 two displays (two alternatives) are compared. Different
subjects have different preferences. These preferences are represented in the figure by a
number of vectors pointing to different directions. Some vectors point more towards
display 2, some other towards display 1 and finally there are vectors pointing
somewhere in between. The resultant of all these vectors (subject preferences) is the
bold vector, called the Preference Vector (r). The components of the vectors shown in

the X and Y axis, correspond to the relative preference of the subjects among display 2
and display 1 respectively. So the sum of X and Y is equal to one (X+Y=1). Note also
that X and Y are as follows:
X = V.cos(theta) Y = V.sin(theta)
V = Vector length, theta = Vector angle with the x-axis.
(cos(theta) + sin(theta))=> V = 1 (theta = 0, 90 deg.) => prefer either
display 1 or display 2.
=> V = 1.4 (theta = 45 deg.) => equal
preference for display 1 and 2.
Figure 2.2
So: V

2.3 Experiments
Procedure
Five (5) experimental subjects sat in a fixed-base "car" and "drove" on an
animated highway environment projected on the wall in front of them. They were
shown successive VMS configurations in pairs. Then they judged these designs based
on the scale given in the previous section (See Figure 2.1).
Apparatus
A driving simulator was used in the experiments. This is the passenger
compartment and controls of an actual car which was setup in the Human-Machine
Systems Laboratory of MIT. The animation was generated by a computer code in
C/C++. The setup is shown graphically in figure 2.3:
Tunnel Celling Projection Screen
Figure 2.3

Experimental Design
Three parameters were investigated. They are shown below in the order that
were investigated during the experiments:
(1) Speed.
(2) Number of letter spaces in the message (Length of message).
(3) Message configuration or presentation format.
PART 1: (SPEED)
Four messages, taken from the database of the Massachusetts Highway
Department were used. These are given below:
# Message Number of letter spaces
1 RIGHT LANE CLOSED MERGE LEFT 29
2 ONE LANE CLOSED IN TUNNEL 25
3 CAUTION STAY RIGHT 18
4 REDUCE SPEED 12
Table 2.2
In this part of the experiment, the importance of the speed was studied. Each of
the subjects drove the "virtual" car at five (5) different speeds and he/she "drove" past
message #1 (the longest one) shown in the table above. The speeds used were: 30mph,
40mph, 45mph, 50mph and 60mph.
Notes
(1) In this experiment the longest message was used because it represents the most
difficult task.
(2) The speeds used span the most widely adopted speed-limit range in the Highways
of the U.S.

Results and Analysis
Given the data of the subjects and using the Analytic Hierarchy process, the
following Preference chart was created.
Speed Preference60
50
40
30
20
10
0± _1
45
mph
i60
Figure 2.4
In the above chart and in similar charts that will follow, the percentages
represent the relative preference of the subjects for the varying parameter values (in this
case, speed). Note that 100% means only one value is preferred and 0% means no
preference for a particular value.
As can be seen from the above figure, the message was easiest to read at 30mph
and the highest difficulty was encountered at 60mph. Even-though this is intuitive, the
' ' ' '
.. . . . . . . . .. .. . .. . . .. .. .
...................................................
............. ...................................... -
............ ....................................
--------------
................... ..................
%.·

amazing thing about AHP is the mathematical interpretation of the relative easiness by
which the subjects were able to read the messages. Relative easiness is an indication of
how easy the subjects were able to recognize one message relative to another one. This
is illustrated in the previous chart, by the relative height of the five columns which
correspond to the five speeds used.
PART 2: (LENGTH OF MESSAGE)
This part of the experiment included the study of the message length. The
speed at which the subjects "drove" the simulator was fixed at 60mph. The messages
used were the ones indicated in table 2.2 shown above. Again the preference ratings of
all five (5) subjects were analyzed revealing the following preference chart:
_ F % I Preference of Message length70
60
50
40
30
20
10
i-i- '1
1 2
message#
Figure 2.5
--1 1 I I i I 1 I 1 j L 1 I I I 1 I I
. ......................................................................
.............. ---------------------
.L . . .. .. ... .. ... .. ... .. ... .. ... ..I i i i i i i- -------------------lrr
mesaev

Not surprising, Figure 2.5 shows clearly that message 4, the shortest was the
most preferable and hence the easiest to read. Again the Analytic Hierarchy Process
(AHP) provided good distinction.
PART 3: (CONFIGURATION-PRESENTATION FORMAT)
As a follow-up to the previous parts of the experiment, message #2 shown in
table 2.2 was presented to the subjects in five (5) different ways:
(1) Format 1: Message on a single line.
(2) Format 2: Message on two lines; second line below the top one. The top line
includes three words and the bottom line two words.
(3) Format 3: Similar arrangement as Format 2, with the only difference that top line
has two words and bottom line has three words.
(4) Format 4: The two lines of Format 2 shown on two separate VMS devices. One
device passing after the other and separated with a distance of 495ft (the actual
separation distance of the VMS in the CA/T Project).
(5) Format 5: Message format 2 in a similar arrangement as format 4.
The above Message configurations are shown in the Figure 2.6.
Using the Analytic Hierarchy Method again, we got the results shown in the
following chart. It is obvious that formats 4 and 5 were the most desirable.
_ Preference of Message configuration50 ,
L40 V
30
% 1
20
10
L L
1 2 3 4Message Configuration
r
tnu

Message Configurations
ONE LANE CLOSED IN TUNNEL
ONE LANE CLOSEDIN TUNNEL
ONE LANECLOSED IN TUNNEL
ONE LANE CLOSED
IN TUNNEL
ONE LANE
CLOSED IN TUNNEL
Figure 2.6
2.4 Conclusion
The results of the experiments described above demonstrate that vehicle speed,
length of message and message configuration play an important role in the reading of
VMS signs.
At high speeds the messages should be as brief as possible. However this
should not be a reason for sacrificing clarity of the text used. On the other hand the

available reading time for a long message should not be a lot longer than the viewing
time of each message defined by the speed limit. Viewing time is the time it takes for a
vehicle to travel the separation distance of the VMS at a certain speed.
The length of the messages is also critical in the design of VMS. As a result, long
messages should be avoided as much as possible. In those cases where the use of long
messages is unavoidable, then the following ideas might be helpful:
(1) Display message on successive VMS devices.
(2) Split the message between two successive VMS devices.
(3) Use commonly used abbreviations of different words to reduce the physical
length of the sign.
Finally the presentation format of the message is also very important. The
experiments showed preference for splitting long messages between two VMS devices.
Though might not be always practical.

Chapter 3
Objective Measures Evaluation I: Reaction Time as a function of Message
Length.
The subjective evaluation of different VMS configurations as described in the
previous chapter, was used to define the critical parameters involved. Based on
experiment, a new approach was implemented in order to investigate the time needed
to read and conceive the message, as a function of the message length.
3.1 Preliminary Experiments
At the beginning of the experiments, a first version of my computer code was
used to troubleshoot the process. The experimental procedure was a very simple one.
Procedure
The subjects sat in front of a computer screen. A static VMS sign suddenly
appeared on the screen. The subjects had to read it as fast as possible. Then they
clicked the mouse button and the message went off the screen. For verification
purposes, they had to tell what they read, and then continue with the rest of the
experiment in the same way.
The computer recorded the time to read each message, and the number of letter
spaces (message length) which corresponded to the message. The time taken to read
the message (Reaction Time) was the time interval between the appearance of the
message on the screen and the time the subjects clicked the mouse button and the
message disappeared.

Two different groups of messages were used. One group was set to appear at a
distance of 100ft and the other at a distance of 595ft. The equivalent distance was
dictated by the size of the VMS device appearing on the screen. The size of the devices
was calculated using the subtended visual angle corresponding to the particular
distance.
The messages used, had a length ranging from five (5) letter spaces to twenty-
one (21) letter spaces. A total of eighty (80) messages were used. A number of them
were related to traffic signs and the rest of them were random phrases. These messages
were retrieved from a data base and displayed to the subjects in a random way. A total
of four subjects were used.
Results
The results are shown in Figures: 3.1 and 3.2. It is important to note again that
the messages were static, i.e the speed parameter was not involved in these
experiments. Also, the letter height was equal to eighteen (18) inches.
VMS-Reading reaction times
0.8
0.7
0.6
0.5
0.4
0.3
0.2
0.1
4 6 8 10 12 14# of letters
16 18 20 22
Figure 3.1
+
Distance=1 OOft
+
|I
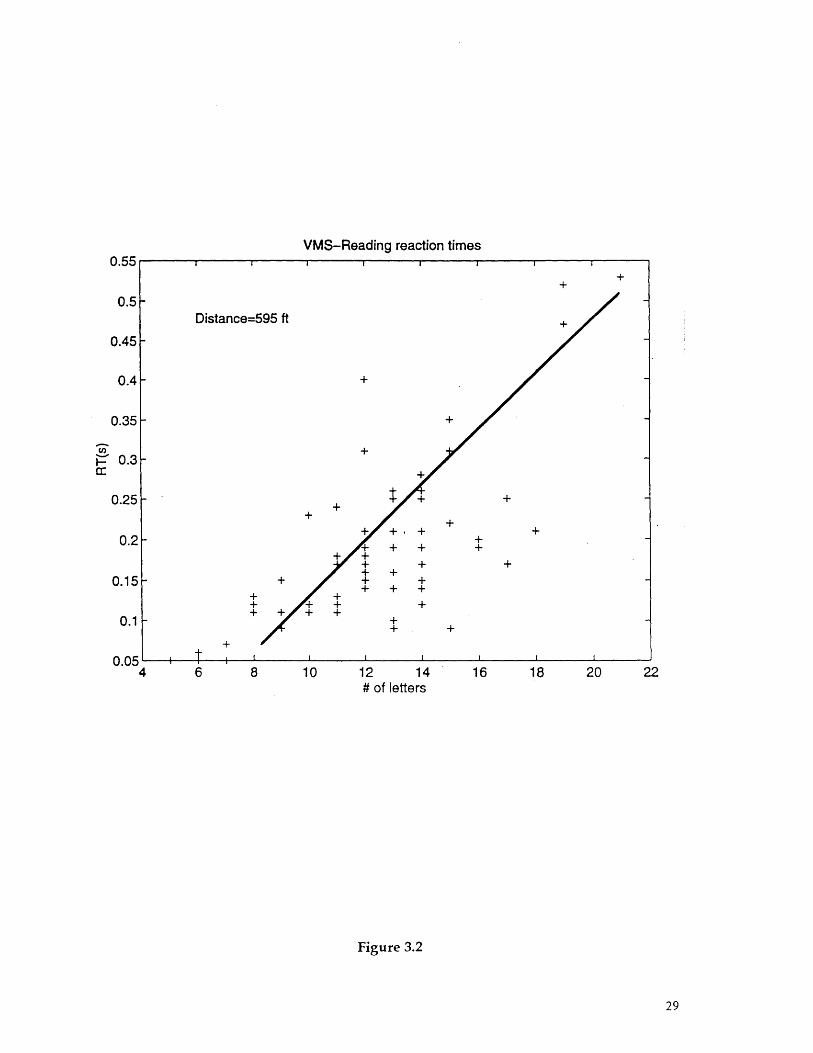
VMS-Reading reaction timesI I I I
+
4 6 8 10 12 14# of letters
16 18 20
Figure 3.2
U0.5
0.5
0.45
0.4
0.35
0.3
0.25
0.2
0.15
0.1
n n•
Distance--
+++
4-,.
'.JI t l I I I I I I
r\ rr

A first look at the previous plots reveals the fact that human-generated data do
not produce nice trendlines. It was obvious that reaction times (RT) or reading times of
the messages increase as the messages get longer. It is not clear at all if this relation is
linear, but I fitted a straight line to the data to point out the general trend.
One last thing to note is that the maximum reaction time for the messages at
100ft was higher (almost double) than the corresponding maximum value for the
messages at 595ft. The most logical explanation to this is the familiarity with the
messages at 100ft. So when the subjects performed the same experiment with the same
message database at 595ft, they were able to recognize the messages faster.
Consequently the reaction times (RT) were shorter. This observation was very helpful
in the design of the more formal experiments that followed: different messages were
used for different parts of the experiment.

3.2 Reaction time (RT) vs. Message Length
Three experiments were used for formal investigation regarding the reaction time (RT)
as a function of the message. The following table shows the experiments and the
number of subjects involved in each:
Table 3.1
For this purpose, a new code in C language/Graphics Library (GL) of Silicon Graphics@
terminals was developed. A complete set of the codes used in running the type 3
experiment is available on a computer disk. The codes for the other two types of
experiments are similar.
Procedure
(1) The subject sits in front of a computer terminal.
(2) The subject clicks the mouse.
(3) A message appears on the screen.
(4) The subject has to read the message as fast as possible.
(5) The subject clicks the mouse again and the message goes off the screen.
# Type of experiment Number of subjects
1 Static Displays 10
2 Dynamic (moving) Displays 10
3 Dynamic Displays with Tracking 10
Task

The following figure shows the general set up of the experiment:
Subject
Figure 3.3
In type 1 experiment, the static VMS devices appeared at 495ft (equivalent size).
In type 2 experiment, VMS devices initially appeared at a distance of 495ft from the
subject and then started moving towards the subject at 55mph. In this way, the effect of
driving through the tunnel was simulated. Again the speed was chosen to be 55mph,
since this is the speed limit that will be used in the CA/T project in Boston. Besides, it

represents a good first estimate of the average speed on highways and it is also a high
enough speed to cause trouble to the drivers when reading the VMS signs.
In the type 3 experiment, the subjects had to concentrate on a tracking task on the
screen and at the same time read the VMS signs moving in a similar way as in the type
2 experiment.
The tracking task was a very simple one: A target box comprised of a large
black square and a smaller white square in the middle was moving randomly in a space
confined in the lower 1/3 of the screen. The motion of the target box was not known
and was difficult to predict by the subjects.
The task of the subjects was to keep the mouse pointer inside the small white
square of the target box. Thus they had to follow the target box. The main purpose of
the tracking task was to simulate the workload of a vehicle driver. It is understandable
that there is no way we can duplicate the workload of every driver since this is different
among different people, different cars and different time as well as space locations. So
the tracking of the target box was the primary task of the subjects. Their secondary task
was to read and perceive the VMS messages as fast as possible.
The performance of the subjects was recorded by the computer in terms of the
distance of the mouse pointer from the center of the target box at each moment. This
performance was later used as an indicator of acceptability of the data. Also the
computer was recording the reaction time to read and perceive the messages by the
subjects. The reaction time (RT) was defined as the time-interval between the two
mouse clicks by the subjects: The first click activated the appearance of a message on
the screen and the second click led to the disappearance of the message from the screen.
The figure in the next page shows the setup of the experimental display:

Setup of Experimental Display
"l Randomly moving "target" box
Mouse pointer
IVMS I Mouse-controlled Message Field
Figure 3.4
3.3 Results-Analysis
3.3.1 Individual results
As I indicate in table 3.1, 10 subjects took part in these experiments. For
demonstration purposes, subject 3 gave the results in the Figures 3.5 through 3.7. The
small crosses represent the one-word messages and the open circles represent multiple
word messages. The general trend is that for messages up to 20 letters long the reaction
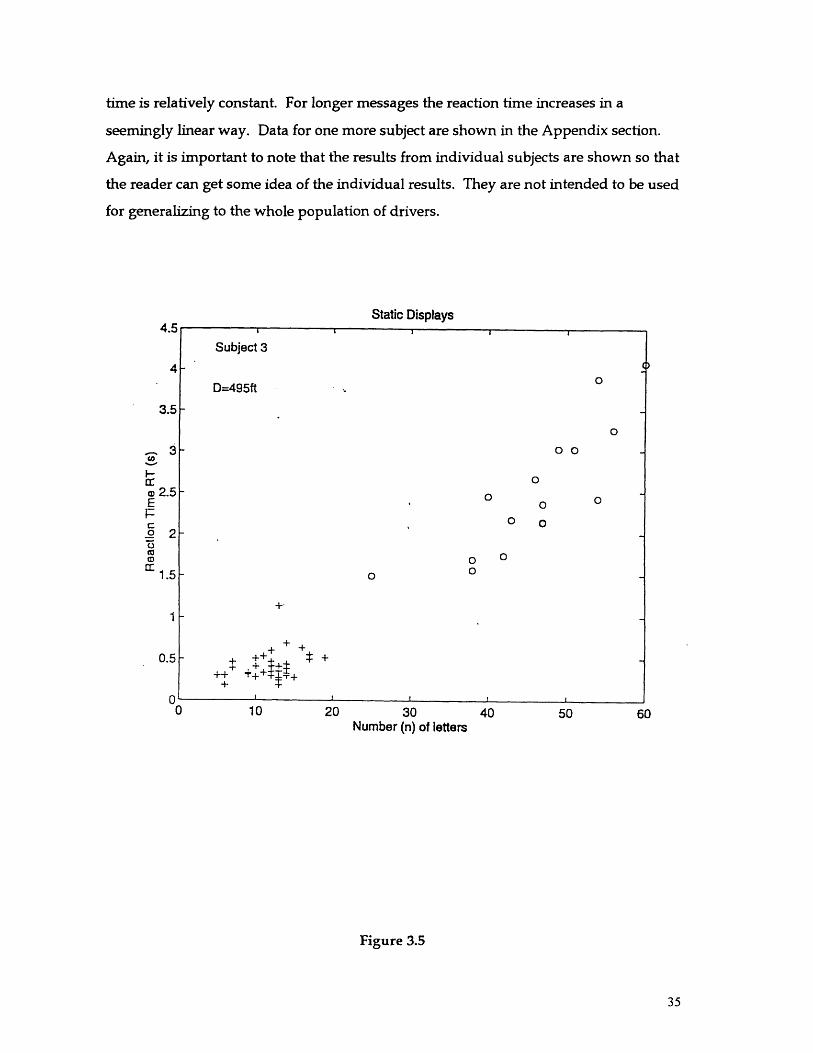
time is relatively constant. For longer messages the reaction time increases in a
seemingly linear way. Data for one more subject are shown in the Appendix section.
Again, it is important to note that the results from individual subjects are shown so that
the reader can get some idea of the individual results. They are not intended to be used
for generalizing to the whole population of drivers.
Static Displays
3.5
a:
aI-
1.5
1
0.5
30Number (n) of letters
Figure 3.5
Subject 3
D=495ft
o
Soo
o
o
0 o
0o
0 0
+
++-!+ ! ,+
= m A L [ f• I
&
j
j
j

Dynamic Displays
10 .20 30 40 50Number (n) of letters
60 70
Figure 3.6
Dynamic Displays with Tracking Task
Number (n) of letters
Figure 3.7
4
3.5
3
l.-
S2.5E
2
1.5
1
05:
Subject 3 0 0
V=55mph
0+
00 0 0+ + 0
0
+ I
I
K.0
0
c-0E
n0
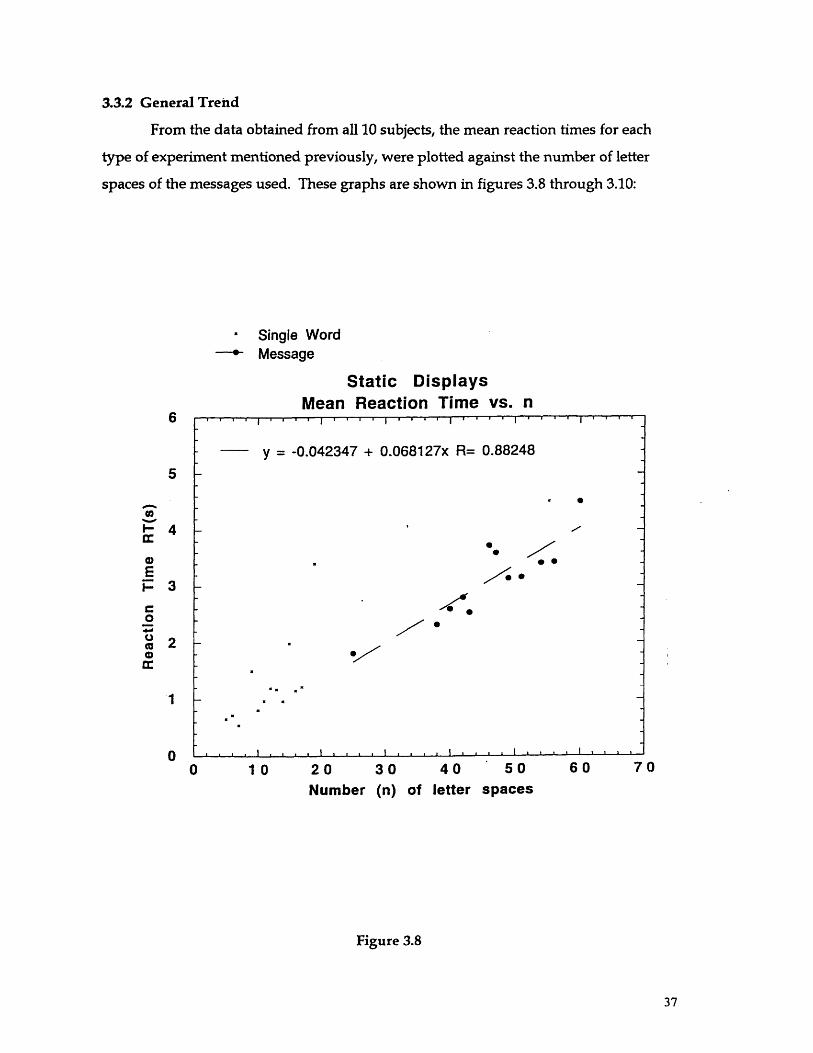
3.3.2 General Trend
From the data obtained from all 10 subjects, the mean reaction times for each
type of experiment mentioned previously, were plotted against the number of letter
spaces of the messages used. These graphs are shown in figures 3.8 through 3.10:
a Single Word--- Message
Static DisplaysMean Reaction Time vs. n
y = -0.042347 + 0.068127x R= 0.88248
.. d.
='w •S
. . . , , , I , , 1 , , I , , 1 . . .O S
10 20 30 40 50
Number (n) of letter spaces60 70
Figure 3.8

Single WordMessage
Dynamic DisplaysMean Reaction Time vs. n
y = 1.2195 + 0.042958x R= 0.85122
-0
-S
5
i-
, 4E
032Or
IT"
0 10 20 30 40 50 60 70 80
Number (n) of letter spaces
Figure 3.9
Single WordMessage
Dynamic Displays with Tracking TaskMean Reaction Time vs. n
5
an
4E
o 3
a
2I "
0 10 20 30 40 50 60 70 80Number (n) of letter spaces
Figure 3.10
l
, • I , , 1 , , 1 , j I i • I J i I I , I,0
y = 0.55933 + 0.068595x R= 0.9491
Zoo
-S
-
. .. I . . . . . . I . . . I , , I • t I •
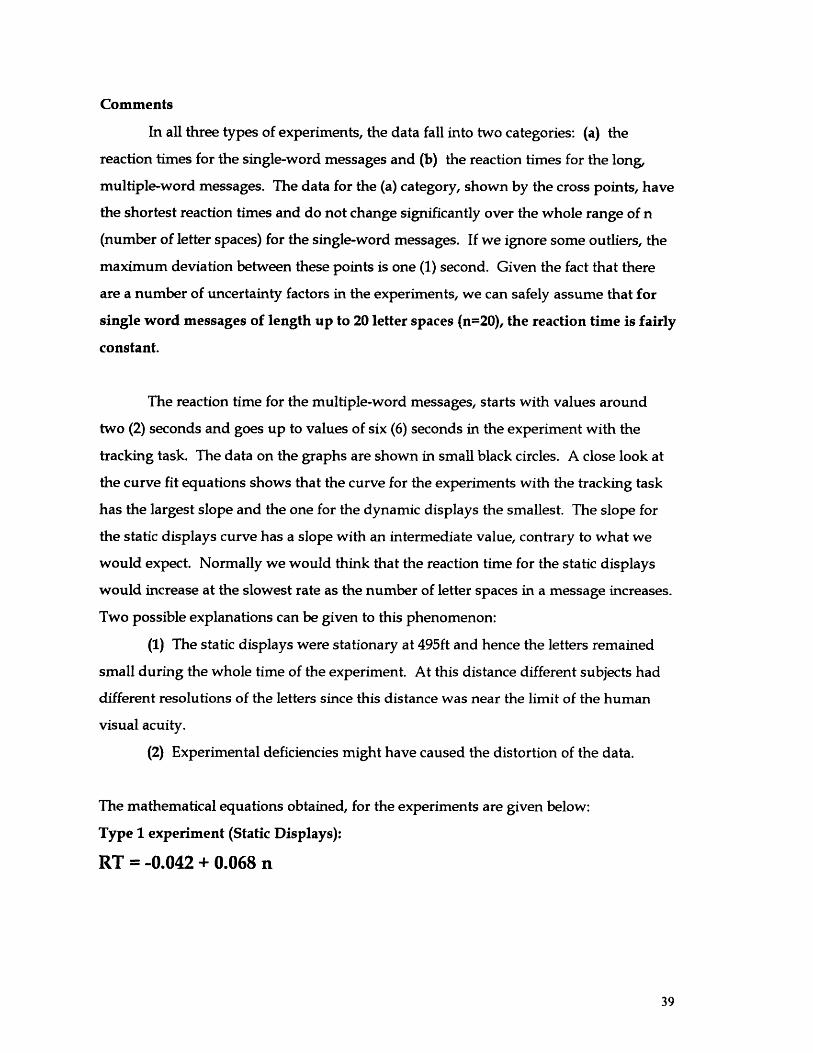
Comments
In all three types of experiments, the data fall into two categories: (a) the
reaction times for the single-word messages and (b) the reaction times for the long,
multiple-word messages. The data for the (a) category, shown by the cross points, have
the shortest reaction times and do not change significantly over the whole range of n
(number of letter spaces) for the single-word messages. If we ignore some outliers, the
maximum deviation between these points is one (1) second. Given the fact that there
are a number of uncertainty factors in the experiments, we can safely assume that for
single word messages of length up to 20 letter spaces (n=20), the reaction time is fairly
constant.
The reaction time for the multiple-word messages, starts with values around
two (2) seconds and goes up to values of six (6) seconds in the experiment with the
tracking task. The data on the graphs are shown in small black circles. A close look at
the curve fit equations shows that the curve for the experiments with the tracking task
has the largest slope and the one for the dynamic displays the smallest. The slope for
the static displays curve has a slope with an intermediate value, contrary to what we
would expect. Normally we would think that the reaction time for the static displays
would increase at the slowest rate as the number of letter spaces in a message increases.
Two possible explanations can be given to this phenomenon:
(1) The static displays were stationary at 495ft and hence the letters remained
small during the whole time of the experiment. At this distance different subjects had
different resolutions of the letters since this distance was near the limit of the human
visual acuity.
(2) Experimental deficiencies might have caused the distortion of the data.
The mathematical equations obtained, for the experiments are given below:
Type 1 experiment (Static Displays):
RT = -0.042 + 0.068 n

Type 2 experiment (Dynamic Displays):
RT = 1.220 + 0.043 n
Type 3 experiment (Dynamic Displays with Tracking task):
RT = 0.560 + 0.068 n
The equation for static displays as shown above, it has a negative constant (-
0.043). This means that the reaction time is equal to zero for n equal to 0.621. However,
n is the number of letter spaces in the messages and so it can only be an integer. Also,
given the fact that the above negative constant is very small we can assume it is equal to
zero.
As mentioned above, in this experiment the maximum distance of the signs
away from the subject's eye was 495ft. This corresponds to the separation distance of
the VMS devices in a real situation. In this case the sign is not visible along the whole
distance of 495ft. It is only visible along a distance of 455ft if we assume that the
windshield of the vehicles causes an obstruction equivalent to 40ft. Now, if the vehicles
are traveling with 55mph, the viewing time of the VMS sign is somewhere around 5.6
seconds. This means that for a message on a device to be fully readable by the drivers
during one pass, the reaction time should be less than or equal to 5.6 seconds.
The plot for the experiment with the tracking task shows that for long messages
the reaction time goes up to values close to six (6) seconds. If we assume that the
tracking task generates a similar workload as driving, this suggests that more attention
should be paid to messages with long reaction times.

3.4 Conclusions
(1) A linear relation can be assumed in predicting the Reaction Time or reading time of
messages on VMS as a function of their length(n).
(2) Driving plays a role in increasing the time needed for the drivers to read and
perceive the messages on VMS devices. So measurements of the time needed to read
static or dynamic displays without accounting for the workload associated with driving
the vehicle can be misleading.
(3) Long messages with n>60 letters should be avoided.
(4) Abbreviations might help reduce the length of the messages, but should be avoided
for clarity purposes. A lot of people facing them for the first time might not be able to
guess their meaning.
(5) The experiments show that messages up to 20 letters long can be treated the same in
terms of predicting their reading (reaction) times.
3.5 Recommendations
(1) Build and demonstrate "virtual" car simulating the driving conditions in the
highways and particularly the underground tunnel of the Central Artery Project. This
simulator might eventually be used as a driver's compliance measure tool.
(2) Look for any differences in the data across different types of people (e.g. Native,
Non-native English speakers).
Chapter 4
Objective Measures Evaluation II: The importance of message configuration
or presentation format.
In the previous chapter, the relation between the reaction time and the VMS
message length in terms of the number (n) of letter spaces, was studied through
experiment and analysis. By reaction time was meant the time needed for the driver (or
the subject in our experiments) to see, then register the image of the message in his/her
mind and finally understand its meaning. In other words, the reaction time was the
required viewing time; it started the moment the driver saw the message and stopped
when he was able to respond physically to what the message said. The experiments of
the previous chapter were not set up in a simulated driving environment, but instead
the subjects had to sit in front of a computer screen, read the messages and perform a
"tracking" task on the same screen was intended to simulate the driver's workload.
The experiments carried out later and described in this chapter, were based on
the experience gained from before. The subjects in these experiments actually drove a
"virtual" car on an animated highway environment, and hence the driver's workload
was simulated in a more realistic way. The purpose of this experiment was two-fold:
(1) Find the reaction time or the required time to recognize and read one VMS device
while moving towards (and under) the sign.
(2) Investigate the role of the message configuration or presentation in recognizing a
message.

4.1 Background Information
4.1.1 Available and Required viewing time
Critical factors in the design of the VMS devices are the available viewing time
to the driver and the required viewing time for the same task. Obviously one prefers
that the required time be shorter than the available viewing time.
Controlling factors for the available viewing time:
(1) Separation distance between the VMS signs.
(2) The speed of the vehicle on the highway.
Controlling factors for the required viewing time:
(1) Spatial position of VMS devices in the tunnel/highway. In the experiments
described in this chapter, the position of the VMS signs was just below the roof
of the tunnel at a height of approximately 20 feet.
(2) A fifty (50) foot visibility distance for every inch of character height
appearing on the VMS devices. This is a widely used standard, mentioned in
most of human engineering guide books.
(3) A forty (40) foot windshield visibility restriction. This is defined as the
horizontal distance from the face of the sign identified by the Manual of Uniform
Traffic Control Devices (MUTCD) at which signs or traffic signals cannot be
read (because the upward viewing angle is too great).
(4) The conditions on the highway. This can mean a lot of things like the
number of vehicles on the road, the design of the highway itself, environmental
conditions etc. These factors are not predictable and cannot be accurately
simulated. Our driving simulation used had a number of vehicles appearing
randomly in the tunnel. This arrangement was the same for all subjects for
practical reasons in analyzing and combining their results.
(5) The configuration of the message on the face of the VMS device. This means
the way the text was arranged: single-line text, two-line text, three-line text or a

scrolling single-line text. This was also an independent variable of the
experiments in this chapter. The results will make it clear how important is the
text format and if it has any importance at all. One other variable affecting the
required viewing time, in the case of the scrolling messages, was the number of
times the message moves across the VMS face during one pass of the vehicle.
4.1.2 Viewable Distance (VD)
The viewable distance on the highway is given by the following mathematical formula:
VD = SD - WRD
where: VD = Viewable Distance
SD.= Separation Distance of the VMS devices
WRD = Windshield Restriction Distance
As mentioned above, the WRD was assumed to be equal to forty (40) feet.
The viewable distance is shown graphically in the following figure:
Figure 4.1
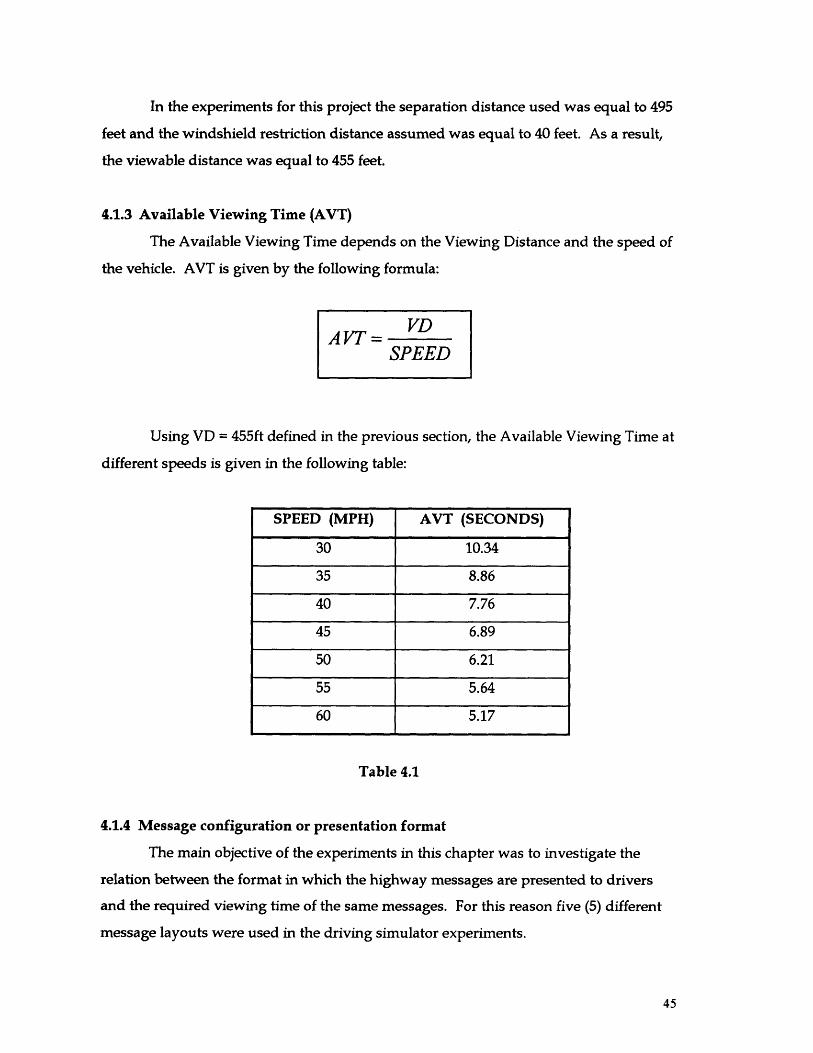
In the experiments for this project the separation distance used was equal to 495
feet and the windshield restriction distance assumed was equal to 40 feet. As a result,
the viewable distance was equal to 455 feet.
4.1.3 Available Viewing Time (AVT)
The Available Viewing Time depends on the Viewing Distance and the speed of
the vehicle. AVT is given by the following formula:
AVT= VDSPEED
Using VD = 455ft defined in the previous section,
different speeds is given in the following table:
the Available Viewing Time at
Table 4.1
4.1.4 Message configuration or presentation format
The main objective of the experiments in this chapter was to investigate the
relation between the format in which the highway messages are presented to drivers
and the required viewing time of the same messages. For this reason five (5) different
message layouts were used in the driving simulator experiments.
SPEED (MPH) AVT (SECONDS)
30 10.34
35 8.86
40 7.76
45 6.89
50 6.21
55 5.64
60 5.17
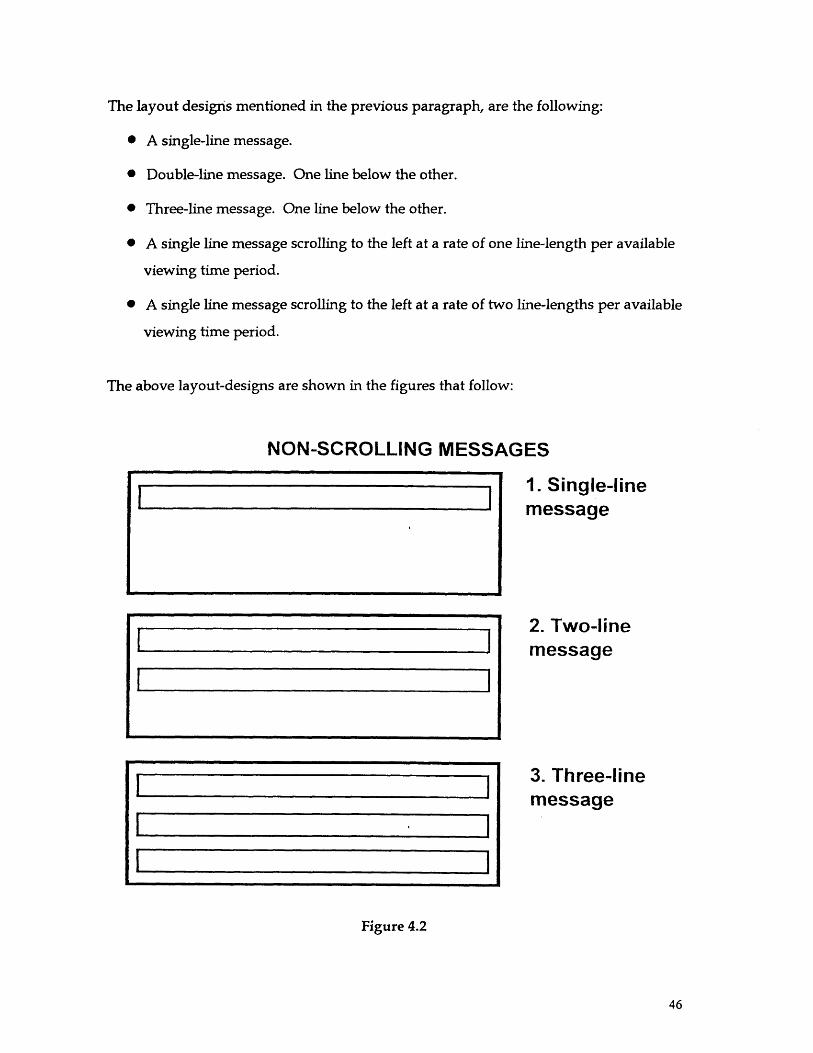
The layout designs mentioned in the previous paragraph, are the following:
* A single-line message.
* Double-line message. One line below the other.
* Three-line message. One line below the other.
* A single line message scrolling to the left at a rate of one line-length per available
viewing time period.
* A single line message scrolling to the left at a rate of two line-lengths per available
viewing time period.
The above layout-designs are shown in the figures that follow:
NON-SCROLLING MESSAGES
1. Single-linemessage
2. Two-linemessage
3. Three-linemessage
Figure 4.2
I I
I I
I 1
I I
I · I
I I

SCROLLING MESSAGES1. Ratel = D/AVT
AVT = Availableviewing time.
2. Rate2 = 2*Ratel
Figure 4.3
As shown in the previous figures, the equivalent letter height was equal to 15
inches and the separation between the lines of text was equal to 5 inches. A 3:5 width
ratio was used, because this is the most commonly used and in general, is reasonably
well supported by research.
I *=** o4111111

4.2 Experiments
4.2.1 Apparatus
The main components of the experimental apparatus was the "virtual" car
which is shown in the following figure:
Figure 4.4
The animation projected on the wall shown in the previous picture, was created
on a Silicon Graphics@ computer. The code in C/GL(Graphics Library) written for this
purpose is available on a computer disk. Also pictures of the animation itself are
shown in Appendix.

Two response outputs were available to the subjects. The first one was the
rotation of the steering wheel and the other one a switch connected mechanically to the
brake pedal. By depressing the brake pedal, the subject was able to control the
disappearance of the messages from the screen, and generate a signal to the computer
to record the reaction time. The general layout of the dashboard of the "virtual" car
with the switch is given in figure 4.5:
switch
Open Close
Figure 4.5
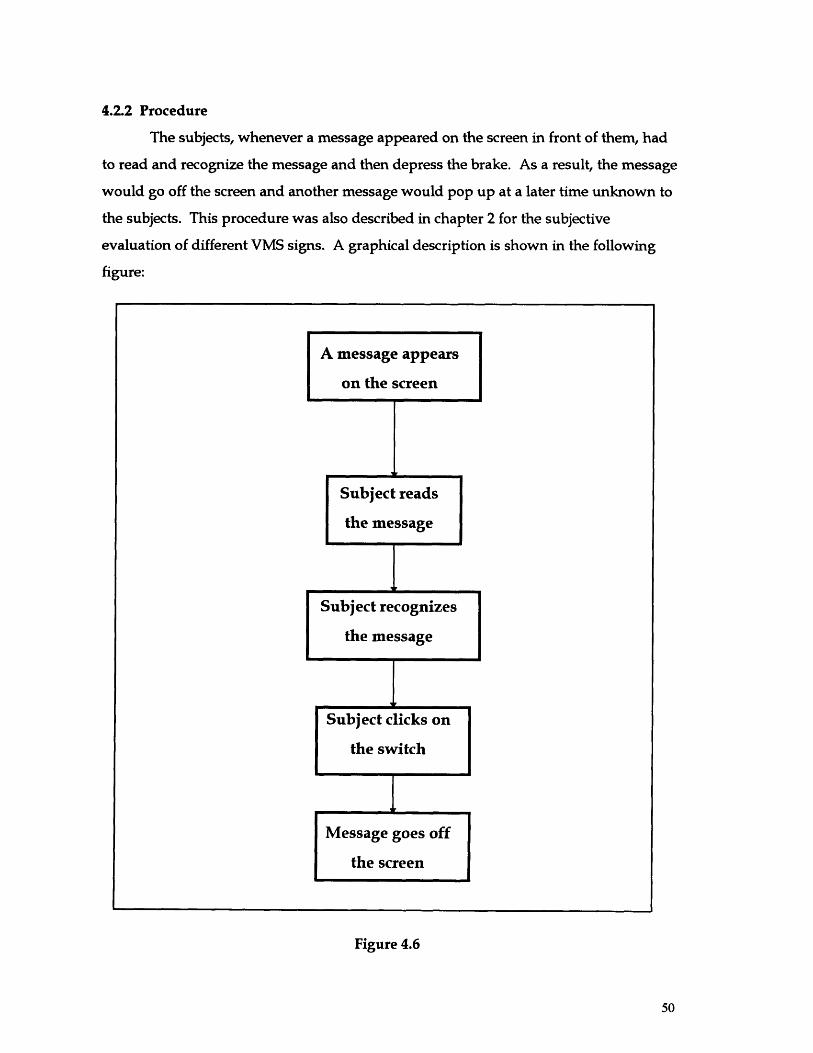
4.2.2 Procedure
The subjects, whenever a message appeared on the screen in front of them, had
to read and recognize the message and then depress the brake. As a result, the message
would go off the screen and another message would pop up at a later time unknown to
the subjects. This procedure was also described in chapter 2 for the subjective
evaluation of different VMS signs. A graphical description is shown in the following
figure:
Figure 4.6

4.3 Results-Analysis
A summary of the experiments that were done is shown in the following table:
Table 4.2
4.3.1 Non-Scrolling VMS signs
As mentioned at the beginning of this chapter, the main purpose of the driving
simulator experiments, was to investigate the relation between the Required Viewing
Time (RVT) and the message text format. However, as a first step, all the data (for all
the speed cases) were plotted irrespective of the text format of the messages. Three
plots were generated - one for each speed tested - which are shown in the following
figures. In this way we were able to see any connection in the trend of the Reaction
Time vs. Number (n) of letter spaces for these experiments and the previous ones.
The Figures 4.7, 4.8, and 4.9 show the RVT trends for 35mph, 45mph and 55mph
respectively. It is interesting to notice that the data for the 35mph plot correlate best
with number of letters. Also for this same speed, the highest Required Viewing Time
recorded was close to 6.3 seconds. Generally the values of the RVT when speed was
equal to 35mph, are higher compared to those for the 45mph and 55mph cases.
Looking at the equations of the straight lines fitted to the above data, it is seen
that their slopes have values ranging from 0.06 to approximately 0.07. These values can
otherwise be characterized as the extra time in seconds needed to read a message which
is longer by one letter space. These values are very similar to the slope of the straight-
line fit in the experiments of the previous chapter. The value of the slope in those
Speed Non-Scrolling Scrolling
35 mph X45 mph X
55 mph X X
experiments was equal to 0.068 as indicated in Figure 3.11. As a reminder, note that we
refer to the experiments for reading of dynamic displays (v=55mph) while performing a
tracking task. The above result might lead to either of the following two conclusions:
(1) The workload imposed to the experimental subjects by the tracking task was
perfectly simulating the workload of the subjects in the driving simulator experiments.
(2) The rate of change of the Required Viewing Time (RVT) as a function of the
number (n) of letter spaces is independent of the task being performed while reading
the message. However, it is important to note that both tasks must have the same
workload. So, for example, if a subject is reading messages while performing either of
two tasks with the same workload, the RVT corresponding to each task will be
increasing in the same way as a function of the number of letter spaces (n). This result
is intuitive and logical.
The Figures 4.7 through 4.9 mentioned above are given in the subsequent three pages.

nsv35
6.5
6
E
em
=e5,-em>I..
5.5
5
4.5
4
3.5
3
Non-scrolling, V=35mph
20
Number (n) of letter spaces
Figure 4.7
I ( I i 1 i i
- o
-I I !1 i
40
0o
----
r r i I I I I 1 I 1 r 1 1 r I
Y-.... ... ... ...
·

S v45RTNon-scrolling, V=45mph
y = 2.3168 + 0.068032x R= 0.774 86 o o,o o
O
...
...
.
- - Q .........
80
6 : o :o-- - --. ..- I
:0 0
oo o so
0
I I If . I
10 15 20 25 30 35 40 45
Number (n) of letter spaces
Figure 4.8
5.5
5
4.5
4.
3.5
C)E
- Oa>
>L_
0*
3
2.5
I I I I I a i IG
i
I I I I

Non-scrolling, V=55mph
=y =2.4128 + 0.059338x R= 0.77494
0S:0 0 o
.............. ... .......... .. ............................
00 : 0
- :0 : 0
... .. ........... .. 0: ..............................
0 : : :I III
20 30 60
Number (n) of letter spaces
Figure 4.9
E
suI--
CrL..0*3
5.5
5
4.5.
4
3.5
3
2.5
A

The importance of the text format in reading the VMS signs
The next step was to separate the data for the Required Viewing Times
according to the text format of the messages presented to the subjects. The data were
separated into the following four categories:
* One-line message.
* Two-line message.
* Two-line message with numbering of the lines.
* Three-line message.
The results for all three speeds used (35mph, 45mph and 55mph) are shown in Figures
4.10, 4.11 and 4.12 respectively.
Given the fact that human variability was prominent in all the experiments, the
data obtained look very scattered. However, in an effort to distinguish trends, linear
curve fits were deployed. The result was surprising: All three speed cases gave similar
trends.
The following figures show that in general the one-line configuration was the
most preferable since it resulted in the lowest required viewing time. On the other
hand, the least preferable with the highest required viewing time was the two-line-with-
numbering configuration. In between, we have the two other configurations. The
three-line one, except for the case of 45mph, has higher reaction times than the two-line
configuration. For the 45mph case, the three-line configuration has the highest reaction
times at low n and at high n.
Also it is worth noticing that in all three speed cases, the Required Viewing
Times for all types of messages, are below the Available Viewing Time value that
corresponds to the each of the speeds. The Available Viewing Time threshold is
indicated on the plots with a solid horizontal line (See following figures).

A summary of the Available Viewing Times is given in the following table:
Speed (mph) Available Viewing Time (sec)
35 8.86
45 6.89
55 5.64
Table 4.3

---.-- 1 line
-- - - 2 lines2 linesw/n
3 lines
AVT
0EF-
LM0)
CrPI.
Non-scrolling, V=35mph
Available Viewing Time = 8.86 sec
LI -.
Of
....... .
,.I . . .
Number (n) of letter spaces
Figure 4.10
1r
40
C1 [
.... .. .. ...
,
· ·

----- 1 line
2 lines
2 linesw/n
3 lines
AVT
E
Cr
Non-scrolling, V=45mphI '. '. I
Available Viewing Time = 6.89 sec I1-J
oLA
O
0
9
i
1-I.Aj
..........
30
Number (n) of letter spaces
Figure 4.11
i i - i A & i | I | i | |
I I I I I I
. . . . . . . . . ... . . . .
· · · · · · · · · · · · · · ·.4
I

-. *-- 1 line
- - 2 lines
2 lines-- w/n T
%e 3iLines
AVT
Non-scrolling, V=55mph6
5.5
5
4:.5
4
3.5
L_
Cra,
3
2.5
Available Viewing Time = 5.64 sec
. O
.. .:..M EA
F . iii 6O
. .1
j-Ji1
I
....... ............................. . ....... ... ......... .................... ....
C 4CC
o "
' i i
A,
20Number (n) of letter spaces
Figure 4.12

4.3.2 Scrolling VMS signs
In order to study alternative solutions to the use of static, long VMS messages,
scrolling VMS signs were also investigated. Two scrolling modes were used: a fast and
a slow one. Section 4.1.4 of this chapter elaborates more on the details about these two
scrolling modes. One speed equal to 55mph was used.
The results are shown in figures 4.13 and 4.14. In the slow scrolling case, the
RVT trend almost coincides with the Available Viewing Time (AVT) threshold, which is
equal to 5.64 sec. In the fast scrolling case, again the trend is close to the AVT
horizontal-line threshold, but it downslides as n gets bigger. Generally, from these
results, it is obvious that the scrolling messages is not a good choice. The almost
constant RVT throughout the whole range of n values implies a high time penalty for
short messages; i.e. messages with low n.

-Scroll slow
Slow Scrolling, V=55mph
y =5.
14
5665 + -0.0021911 X R= Q•10282
0
. .
... ........ ..... -...................... ........... .. r3..o......... n : o
S 0o00 0
0...........0
O
o 0.
0 L.
I I
20 25
Number (n) of letter spaces
Figure 4.13
%a)
C)E
L-.
C)W)
I . . . .I
.r,
i
S............. ......................
A
.............................

- - Scroll fast
Fast Scrolling, V=55mph
y .4..6973. + ;-0.03776.6X R=0.283.81 ......
7......
..........-4
0
00
0 : O O 0
I OO
25
Number (n) of letter spaces
Figure 4.14
-1
0)E
cm
6-
C.
I I I I 1 I I I I I . .I I I . . . . .
I . . i .i
I I

4.4 Comments by the subjects on the general layout of the VMS signs.
At the end of the experiments, the subjects were asked to express in writing
their ideas and suggestions about the designs of the VMS devices used in the driving
simulator. The following is a summary of their comments-suggestions:
(1) The most popular suggestion was that the fixed-text messages are preferable to the
scrolling messages. The reasons identified were:
* The rate at which the message moves defines, in a way, the speed by which it is
recognized. So if, for example, it is scrolling very slowly, it increases the
required viewing time. If it is scrolling too fast, it requires the subject to put
extra effort in concentrating to recognize its meaning.
* Experience becomes a less important factor in the learning process for the
scrolling messages. On the contrary, in the case of the fixed-text messages,
experience helps the drivers identify words faster.
(2) Long messages scrolling are difficult to read, especially in the fast mode. The fast
mode corresponds to the moving rate equal to two times the message length per
Available Viewing Time(AVT). In this case, the subjects had to put extra effort in
reading the message, causing their attention to be diverted away from their primary
task of driving of the car. As a result, in two cases, the subjects had accidents.
(3) The subjects were not satisfied with the slow-scrolling messages either. Two
reasons were cited for this:
* For most subjects the scrolling rate was a lot lower than their required viewing
time i.e. the time needed to read and recognize the message.
* The subjects would wait unnecessarily long before they would push on the
switch to deactivate the projection of the message on the screen. So, they clicked on the
switch well after the last word of the message has scrolled into the face area of the VMS
device. In this way the recorded reaction times were much bigger than the actual ones.

(4) The messages with the numbering of the text lines were confusing. The subjects
claimed that numbering of the lines of the same message was not only unnecessary, but
also confusing. (This has sometimes been conceived as a way to separate two different
messages).
(5) A number of abbreviations used in the messages were criticized by many subjects.
Three examples are given:
* Abbreviation VEH for VEHICLE was frequently confused with USE.
* Abbreviations LT for LEFT and RT for RIGHT were not recognized by many
subjects the first time and even in some cases the second time they saw them.
* AHD (AHEAD) was confused with the word AND.
(6) In some cases the subjects confused some words which were not abbreviated with
other words. For example:
* The word SOUTH was confused with the word CAUTION.
* The word OVERHEIGHT with the word OVERNIGHT.
* The word AHEAD with ON ROAD.
4.5 Conclusions
The previous results give some general guidelines in the design of VMS signs. The
mathematical models describing the relation between the Required Viewing Time and
the number of letter spaces in the messages can be useful in many situations, for
example, when deciding about the separation of VMS devices on highways and what
messages should be used on these devices.
The experiments showed that messages should not be long. Messages in one-line
configuration are preferable to any other configuration with a higher number of lines.
Finally, the scrolling messages are substantially inferior to non-scrolling messages, and
therefore they should be avoided.

Chapter 5
Recommendations for study
* In the experiments mentioned in the previous chapters, a number of ten (10)
subjects were used, all of them are graduate students at MIT and relatively young
(22-34 years of age). It is obvious that this sample of people is not representative
of the real population driving in the highways. A more realistic sample would
include people of a wider range of ages (for example 18-70 years old), and a more
diverse professional and intellectual background. Equally important would be a
diverse ethnic background, which means people with different native languages
or cultures.
* Secondly, the driving simulator should be refined. This would mean different
things, of which the most important are given below:
(1) The simulator in its current status contains only the Third Harbor Tunnel
section of the CA/T project. Initially, all other underground highway and later the rest
of the highway project should be included in the simulator.
(2) The flow of vehicles in the tunnel is based on a very simple random logic. A
more sophisticated probabilistic model, based on actual traffic data from the CA/T
highway should be incorporated in the code. Ultimately, this model will have the
ability to be adjusted by updated real time traffic data from the highway under
construction.
(3) The simulator should be updated with a more realistic animation. This will
improve the quality of the virtual environment and ultimately the subjects' results.
* Parallel to our work with the driving simulator, a Microsimnulation of the traffic
flow in the CA/T project, was developed by a group of scientists from Lincoln
Laboratory and the Center for Transportation Studies at MIT. The purpose of this
Microsimulation is to evaluate the Integrated Project Control System (IPCS). The
framework for the evaluation consists of a set of traffic scenarios and performance
measures. The scenarios are defined as combinations of three primary categories
of parameters: (a) demand, (b) incidents, and (c) driver behavior. The
parameters in demand category determine the number and composition of the
traffic on the highway. Incidents are a number of different conditions that disrupt
the normal traffic flow. Finally, the behavioral parameters capture the behavior of
the driver-vehicle system under different circumstances. Realistic estimates of
most of these parameters are not available at the moment.
So the Driver Simulator developed in the Human Machine System Lab
can be used for estimating the required behavioral parameters and thus helping in
the creation of a more realistic model for the Microsimulation. Very important is
the study of the driver's compliance to different signs and other signals which are
part of the IPCS and play an important role in controlling the traffic in the CA/T
project.
Bibliography:
[1] Human Factors in Engineering and Design, Seventh Edition, Mark S. Sanders and
Ernest J. McCormick, McGraw-Hill Inc., New York, New York, 1993.
[2] Telerobotics, Automation, and Human Supervisory Control, Thomas B. Sheridan, MIT
Press, Cambridge, Massachusetts, 1992.
[3] IPCS Design Refinements for the Central Artery/Tunnel Project, MIT IVHS Research
Program: The Center for Transportation Studies, Lincoln Laboratory, The Human-
Machine System Laboratory, and the Intelligent Engineering Systems Laboratory,
September 1993.
[4] System Design Document for the Central Artery/Third Harbor Tunnel Integrated Project
Control System, DeLeuw, Cather & Company in association with Leers, Weinzapfel,
Associates, IBI Group and T.T. Wiley Associates, P.C. Prudential Center, Boston,
Massachusetts, 1993.
[5] Memorandum: Evaluation of Viewing Time Versus Speed and Distance. Project:
Gateway Variable Message Signs/ SA #11004.24, M. Regan, Sasaki Associates, Inc.
[6] Human Factors in the Design of Displays for Traffic Operations Control Center, Thomas
C. Chao. M.S. Thesis, Department of Mechanical Engineering, MIT, August 1994.
[7] Graphics Library Programming Guide Volumes I and II, Silicon Graphics@ Computer
Systems.
[8] C by Dissection, The Essentials of C Programming, Second Edition, Al Kelley & Ira
Pohl.
[9] C++ Primer, 2nd Edition, Stanley B. Lippman, AT&T Bell Laboratories.

[10] Probability and Statistics for Engineering and the Sciences, Second Edition, Jay L.
Devore.
[11] Modern Control Engineering, Second Edition, Katsuhiko Ogata, University of
Minnesota.

APPENDIX
Reaction Time as a function of Message length
Chapter 3Subject 4 experimental data

Static Displays
Subject 4
D=495ft
O 0
+ ++
+ + ++t
30Number (n) of letters
6
5
C4,!-.
a)Et-
0-3Cr
2
40 60J I L lI
-
-
I

Dynamic Displays
30 40Number (n)
50of letters
6
5
2
Subject 4
V=55mph
+
4 -t+ -t +
+ +
+-
70I ( I I I I I I
E
E
-

Dynamic Displays with Tracking Task
Subject 4
V=55mph
+ ++
-t-+4-4-
-+ -r
+4IF + + +
+t÷
20 30Number
40(n)
50of letters
5
Ei=4
a,
3
2
+ +
-
t:'- J
,
-

Driving Simulator

:::i':'Li:-:::~:~l.i :.' '. · i:·i.:·'. ~::::'r-:.·-:::: ::·j -::;:
-~::::il-·:::i:-i-: : : : :: ::~ ::,.::::::::i:: i:ii:i::-:;i'i-:liic;;' ::'~~I:: -~:::.··: i:iiiiiil-::: -..:...:... ::. .:-;: j-~ii: · ··; ...;. :ii::~i::;::j:;-i: ::i: ii:-::: :j-;i:ii: r:-:-i 'i·::::iii~':l : -:il:': :-:i:i':i'''''ii':i-i- ::
: sl;::i~:l~~.:i~.l·i _ ,:~:d:: :::.i·:-l--ii:i:l:l.~ii:~·I .i::::: : ::::;::l:i::i·Zij·:-~,: ::i,::-.·i:~::~-:--I,::ii_:::::i::~:~,: .··i:'··:
.- 1:·1.::-.:..`:il :;:;:: :: : :-~~.:-,~ :-1.1,:'::.
::::·l-i,:l:··i`i:';:::l:::::::-iii::; i.li'l'`ii
:.::-._. ~j:i~.i.'~l:::::. ::. :::.i-:i-l-::-l'-ll:il-~i.-I~I~-i:::il
: .: '::::::'i:.i. ~ : ~.~:~.·:: ·-·::··: ·:·- :
i:l-l:l·-l: :.::j · .: : : : ' ::.:::j·II:::: ::::: . : .::::i: :.
.;'. :~`-.i,:i:::l .:·I·: .'::.:..--_
:_' ..- · : ::· : : :::.::i::l:::li:.:i::·: ~;I·:·: · i·: · ::.::.:·-
·.i: ....... .. ;. ..
::'::lj:)i:'::::: ii:::-·:: : '::::::l:'i:j::-:: ;:i-:
::i::-. ~:·::iI:1 ;::~-~::i::l :i:·.:: :.'.:.:ii.i-.:':.i :~.1::::::I:1::::·:·i::i i:::~:i:' ·:::- ~: · :..:,:::::i::--:-:ii:
:I~~~t;~:l'i.-- i -'i :I:-:. ;.---.-: :.;:~::·1: ::::
: i:::::::I':;:::l :::::li.' :i:"'i:
.,-. :i::::.i·:::i;:l·--: ··:::::::;. :·:i:;-:: ·:i: :-;.::
~·::'·:
_::.::c.:..·.. .-:·:: : :::· ·:I I :.jlli-:.l:;:~:::: :ij.l
i. -- l-':i-'l;,i::::::·- :. -:~i :liil::.;;i P:.. .~::: ::i~ ·-. .:
li:ilrli::i::;-ili I:::~i~::l-:: :,: r .:i- I.::-i- I:':l-i~i: ::: ~i ::-'~
:::··-;i ·;···:::;·:.·':-~::-- `":: :;.:;.: .·.....;, ·-':.`;: :·.i:~:::i:':i::'"'·''·i-:;':k-i·:':li:::':::::::~i:il:l ::-::':i::':':-;.I;;::I:i:
:li: ;i~l:l:ii'::'l·P': ;:':::''~::": :;'' :i;: ':i'''-~" :: i:::::` ;:-':.:' I::::: r.. ;..
:;ii.l-;:;1:::ll~:1 -~ - j:; jj::l·:: :::l_:_::_:j: I:: jr- ::~:·: ~:ji~
.·::l,·-:i..r· :il::i: i::::::::.' ~ ...::.i..; :.'rl:·.::irl-i' ;..;.....-.,.-. : : .
: /i::':i::::~:$:j:::-ii;: i il·.;l:l~i: I.i. .i : ' : ` ''
;::;.:':·:::::.'~ ~:i :·-::··:-·-: ,i'l:::::'.;'·:i'::I:i-:::
:·..::-:-::: : : :'i"`:ffi:::::.liii·~~i:'.:.:;:' ·::·::-''"·:.:::·':::::::·"::':·:i'~::'
j__ii:: i: .:: ::: i:: :-'·::: i i:i':ii::-.~::
::i::: . : ::.i::l: :i:
:.II:::.~~:~ :i:~lil.::~-::i.:~li_,:,:~;:~i i -:i:I_.:~~i:i :-::ii::;,:i':si- ii .-:.__- :.:..-. j Ilili··i.:l.l j,-·::-~.l::i:,-,~:·:i~ iii::i;·: :.:::iiiiii:i:i:i ::,,:·i:iY: j':l::-ii: i;':~ ;::ilii:i:ii:~i:i:i::.:i;;l;:'i ' ::r: i:: i. i.::~i:::l:::.mr :::::ii:.i::j~-r I::;j.i: ::i-.l'·:-i:: ~l":·.::':i: ·:-:: i :~.:-1;::~:i-;::l-: :'6:;..;~:::i:I i-:l:;i:~;i:::·:;:' i::::l· :fli:::::i:irl' 1: :':'i'i:'11':::i~:' :'~;l~i·ii·i:j:: i:::i;:i: ...::::::;i:i:::i..;,;.:i:i::;.:., ~::::I:·,_.':: ~_ji::i:~i:i:::ii:iiI::. ...i.i::;- i;::::.I;;:::.~':..·~:il:.::l·::: .:l:i:ii.::
;:: ~:·,: :: l.::;i::, .:: : ... :. · ·:::::: : :::i':: I:::::'''i'.il::: .' ·:ICii:-:: :.:.'i'::i'::iilI : ::-:::. .- ::i ::i:::::··l'iii::::_:l:''i:·::i': -iiil;:.':~.l:::~.:;; i· r -:-i;:i: ::·:i:::ii::: ::::lii::::·:::.i~. ::.::.1: .i::::::;:;'·:i :-:-._.;.,. ::: :':' -':- : ~i'::::::: : · : ·: i:::-:: · ·i:.:-i·i- ~
r : : : .·:· i·::::::~ ·.:::::1
:"' ii·,::::'ji::ii.::.:::i:~· ili:-::::::l::":':::.::::::.~::::::..-: ::..:..:·:::.: i-:;::::::::
·:::: .-: ··~-·· : :i:·;-;i:::;;:i.:ji:--·1; ~~ · ·: li.:·- -·;:.: I· i:::ji:::lil.:.'::::: : -.-:..:::: '·:: ::.::.;.::-.:::::
i:;;i:'l::i.;:.:-i-: :;:~::1:;:li:; :::::I.:;-:::~- ::::·:::::::.:-.:ji.i ,:;._lii:i~,::j:::i
:iil'-:: ::~~~:- ·:::I :·i::_~ :::::.: -:.: . il:·..·: ::.·-I: ~~f
: ::.I::; I-::.:~:::::i-.: ;.-- :~1.::1 · ·ii"- ~ ;':;'''~:..:::::, I·.l.::-·;:i:: .:I:·:::.:: :. :' I:..:.::
· :::: : ·:::i :i:· ::: :: :;.j- ::;lii'i: ·::::.:::::;: ':::-l:--il:;-
::::i::I ii:' ::;·::::: 1:111: a:· · ·
rru
ttJ :-.:-:: i·I r
r~ I:·1::: : :j:; I~
rf-I'Lt iS:·r
i..:::I:
i:i:'::::· I::I.:::::::I i:::~-I~I ·::::: ·:·-::I·-'·-:·
_.. :i:::5:~:-i-.:;:.::··':.`-::::::;':::i::
::·:.;i:.:: :: :..1::.:i:_::,:i·· j~:: ~~ ::,:::~:~;.1.:1; I,.l'::.~.:ll.i'::i ;..::i
::: ::.: i::. :.: .::i:':::::'::·: ·::-:- : ::.::....: .. ::::;:,.:::.-:,,,,,·;::.:.-.:.-,;;::I: :I:-i::.--:..;-.;:~r;;l,.i..:::.::l:l
::-J:il::ii::.'.::· :I : : :::~,i-:·-::..:-:j:r;.~.j_;..:..:i:::i ::ji::: ::i:::i··:·:jjjij:ii: i::-_·:··:·: ; :·:::::·::;: :'`::':~;':'::; :::':',:.,i:i.::;~ : . ·iG::;: ·i·:-:i:l·::::i:-:j;:~:.~,; ,·::·:I: : .: : ::::.::'::i:::·:: ;·::; ii li:·i::i::.::': :I'i-:
S·::·:i:~;r :·::i:-il:i.:·''::;:i-r·j':·'::.:i::.:·· :a;-I·::.:::::: ·:::::~i::I:i;:;i-:-i:-ll:"~:: .-;:;I·-,:_Ei;:':_.:i::'l: ::.:'·::·-:.·::::::::;: :1.
· ·:·::··: '.' ;.' ·:·:::·-;
:::; -' '· ·:'· '··:·;;·:::;·::;·;i:

:·,·::- · ·:::·--r · ·I··· :·· -···:·:?·: I·:::-·:I:·)-·: :; :: - ·. T'·IS:::~':~S';i 12;:9:·1.I4
~~r~~a~i ~i::::S;::~':'i::'::'~ .:.;:::- ij;-·~ii..i:i..j:ig:::·l,·
;·r:.i-; ·: ej·i·j:::: ·.;::-:-ji-:::, .,.,: ·::i::::.-::- ~r:l-- · : .;.~i-4 ~ ;~-: ~::::4
:"i~'i~ l~ :il a~· 4iiii:.:-~i li::.:i:~lii:.:I:... :':::· ·:·:::::·'d:- _ -.' :I..~i::-ii~'" :"'~a;: ·
i~~i::,. ~ ~ "t:: : .i:· ,:i`:iii:::.:::~·t,.iii::i :::::i..::i: : :':::':. ii-.::i ::~li~·:~_4,··~l·Pt 1·
........·..... ..;::: ·::i.i '~': : ~i':-:'::'.:::::1:::UU;:
:,~~~l:··i~~~~:::: ~ ~ ~ ~ ~ ~ ~?l--.<f44 Ai·.' :-i~i~~-;:d:;;'i::i: '·
::·-i~~~:~:.~~4·~::~~';:: <Ij- '-4':~·~'~'':~:i~·-: j;:::i''~ ~:~~
::::.·i ~-: -ir:tw * ir:',..::'i~i:S:::lr~iU t4 -4- ,Ai·':~:i:~ --i::'':i:: ~:~i":iii:'i- ··-:·
:::-;rlll-:-.5:xi:. ~~~~~~ ~- 1244r-i .:::::l:::..:·. ·.. i:. :;. :i:::::::''i.::::i I:::' '':,:·i~.:.,;·.r:·.:;:. · :.::.:r: · :·,I:;;:; · :;::;i :·-: ;- :::.::.~,'.-:~,.4' 4::
:'"--I' :-: -;- :::i:::^;:: ' li-':;.-;-:·Q ~ :?:~~~: I 1~ I- I:: -I:':: ';:i:-' II': -'4'-:· - . -.i·i :-::
I- ·:'-:i- -i::: -::i -'i:' -I: .:'::: · ^::::'- ' :
::-~:,:i.·: · ·,:: I :-::-::·:::-: ,:.i:·:;::.:·-:::·:----"4.:
I.":::::i·r:::j-:i ::::;:i.::~.
·--:-:-· r,·r::::: ·I·; ··:::rr: i:;i:: : ::':i'i:':ii· :-.'i:i
:::::"-'::":;
Bi": i:· ·::::;·
;-- :::····::···-·::·:;"1: :~::···:;:i ··.:,::::.:::·::fi::·:::---:',: ;··:·:: .::::::::