simple models of antibiotic cycling · simple models of antibiotic cycling timothy c. reluga...
TRANSCRIPT

Simple Models of Antibiotic Cycling
Timothy C. RelugaDepartment of Applied MathematicsUniversity of Washington, Box 352420
Seattle, WA [email protected]
December 30, 2004Running title: Antibiotic cycling
Key words: heterogeneous environments, resistance management
1
Abstract
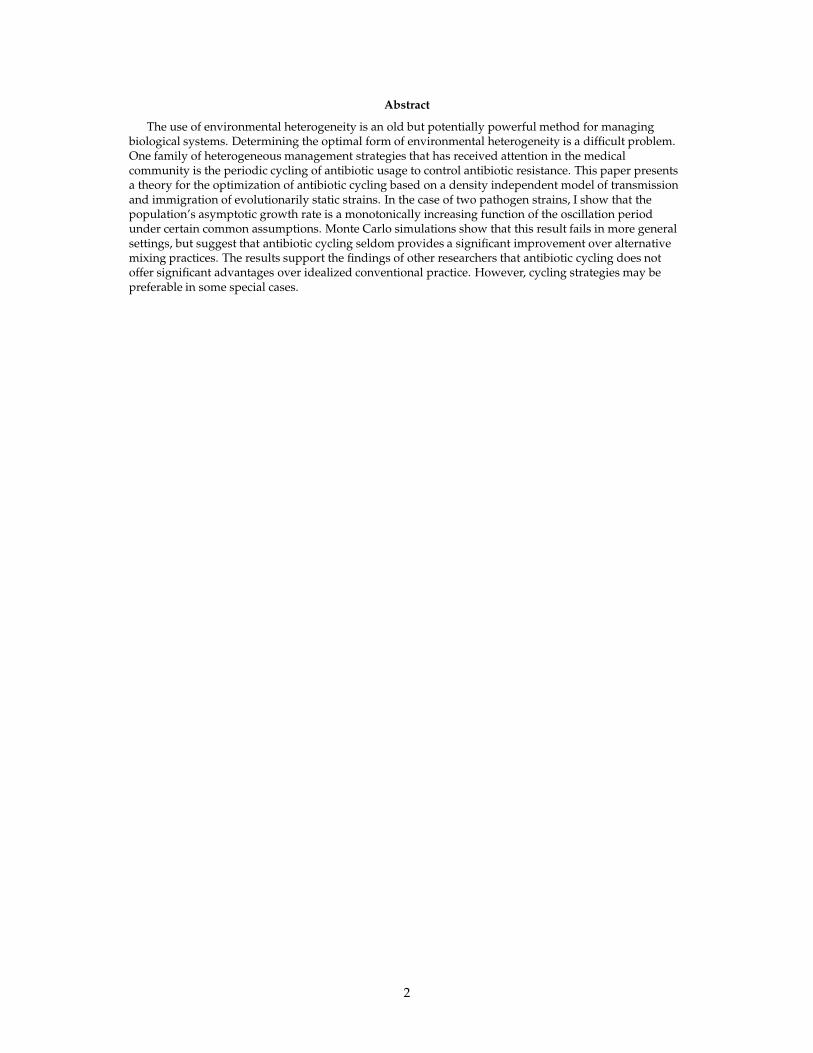
The use of environmental heterogeneity is an old but potentially powerful method for managingbiological systems. Determining the optimal form of environmental heterogeneity is a difficult problem.One family of heterogeneous management strategies that has received attention in the medicalcommunity is the periodic cycling of antibiotic usage to control antibiotic resistance. This paper presentsa theory for the optimization of antibiotic cycling based on a density independent model of transmissionand immigration of evolutionarily static strains. In the case of two pathogen strains, I show that thepopulation’s asymptotic growth rate is a monotonically increasing function of the oscillation periodunder certain common assumptions. Monte Carlo simulations show that this result fails in more generalsettings, but suggest that antibiotic cycling seldom provides a significant improvement over alternativemixing practices. The results support the findings of other researchers that antibiotic cycling does notoffer significant advantages over idealized conventional practice. However, cycling strategies may bepreferable in some special cases.
2

1 IntroductionThe spatial and temporal fluctuations of a population’s environment are collectively referred to asenvironmental heterogeneity. Environmental heterogeneity complicates our understanding of biologicalsystems. Ecologists have worked hard to untangle the interactions between environmental heterogeneityand ecological processes (Shorrocks & Swingland, 1990; Kolasa & Pickett, 1991; Hutchings et al., 2000).Heterogeneity can effect population demography (Henson & Cushing, 1997; Coale, 1972), populationviability (Beissinger, 1995), life history strategy (Brommer et al., 2000), and evolution (McPeek & Holt,1992; Hutson et al., 2001; Frank & Slatkin, 1990). Environmental heterogeneity also attracts the interest ofpopulation geneticists as a possible factor in polymorphism maintenance (Kirzhner et al., 1998; Hedrick,1986; Felsenstein, 1976).
Environmental heterogeneity may play an important role in managing the evolution of antibioticresistance. While the emergence of drug resistance is a general problem in medicine, antibiotic resistancein hospital-acquired infections deserves special attention. The incidence of resistance in hospital-acquiredinfections is much higher than observed in community-acquired infections (Monnet et al., 1998).Antibiotic-resistant infections have been shown to increase mortality rates (Raymond et al., 2003) andreduce treatment efficacy in hospitals (Niederman, 2001). The heavy use of antimicrobial agents inhospitals imposes strong selective pressures on resident bacterial flora and has lead to the emergence ofmethicillin-resistant Staphylococcus aureus, vancomycin-resistant Enterococcus, and other difficult-to-treatbacterial infections (Gaynes, 1997). Faced with the growing prevalence of antibiotic resistance, the medicalcommunity is reevaluating approaches to antibiotic usage.
The conventional approach to antibiotic usage in hospitals is a decentralized policy. Patients areprescribed antibiotics at the physician’s discretion, and no efforts are made to coordinate treatment amongpatients. It is not uncommon for two patients with the same diagnosis to receive different treatments, andno temporal or spatial restrictions are placed on the availability of treatments. This decentralizedapproach to antibiotic usage is popularly referred to as a mixing strategy because of the variety oftreatments in use at any one time. Mixing should not be confused with combination treatments, whereindividual patients may receive two or more treatments simultaneously. Throughout this paper, it isassumed that a given patient is never treated with more than one antibiotic. Ideally, treatment patterns inmixing strategies are free of spatial and other correlations. These correlations are certainly present inpractice. There are several measures under consideration for decreasing treatment correlation effects(Fridkin, 2003), but the analysis of these effects falls outside the scope of this paper.
Cycling strategies have been proposed as alternatives to mixing strategies (Kollef et al., 1997; Kollef,2003; Hodges & White, 2001). Antibiotic cycling strategies periodically rotate treatments in and out ofusage, and place minor restrictions upon which treatments are available for use at a given time. Whilemixing strategies are characterized by spatial heterogeneity in patient treatments, cycling strategies arecharacterized by temporal heterogeneity.
Do mixing strategies and cycling strategies affect management problems differently? Both thecycling and mixing strategies introduce heterogeneity into the environment of pest organisms. Ifenvironmental heterogeneity limits the efficiency of reproduction, both strategies seem likely to limit theabundance of pest species. Beyond this point, my intuition fails. It is unclear if cycling strategies or mixingstrategies offer more effective management. The problem of determining the optimal environmentalheterogeneity will be referred to as the “cycling problem” in this paper.
Existing theoretical work on the cycling problem argues that mixing strategies outperform all otherstrategies, but only provides empirical evidence to this effect. Bonhoeffer et al. (1997) and Bergstrom et al.(2004) use numerical simulation with random samplings of the feasible parameter space as grounds forpreferring mixing strategies. While some medical studies suggest that cycling strategies are not harmful(Dominguez et al., 2000) and may improve on mixing strategies (Gruson et al., 2003), consensus opinionappears to favor mixing strategies.
We seldom need reasons to be wary of consensus, but in this case there are two. First, the work Salo& Tahvonen (2002) provides a preliminary example where cyclic solutions describe the optimal usage of arenewable resource. Second, the dynamics of a periodically forced system can, in general, depend in acomplex way on the pattern of forcing. An important classical example is the second-order linear
3

0.5 1 1.5 2 2.5 3 3.5
2
4
6
8
10
12
14
16
Amplitude of Forcing (q)
Per
iod
of F
orci
ng (
T)
Figure 1: Lagrange stable regions of the Meissner equation, Eq. (1.1), as a function of the forcing amplitude qand the forcing period T = t1 + t2 with equal phase periods (t1 = t2). Asymptotically unbounded solutionscan only exist in the unshaded region.
non-autonomous differential equation known as the Meissner equation (Richards, 1983; Arscott, 1964),
d2xdt2 + {1 + qu(t)− q [1 − u(t)]} x = 0, (1.1)
where u(t) =
{
0 if 0 ≤ t mod (t1 + t2) < t1,1 if t1 ≤ t mod (t1 + t2) < t1 + t2,
. (1.2)
The system is forced with amplitude q for a positive phase with period t1 and a negative phase withperiod t2, for a total period T = t1 + t2. The notation “a mod b” stands for the remainder of a divided by b.Mechanically, the Meissner equation describes a frictionless mass-spring system where the fixed end of thespring oscillates according to a square wave. Eq. (1.1) resembles the biologically motivated models I willdiscuss in this paper. The interaction strengths are set by the underlying biology, but the phase periods t1and t2 may vary with the management strategy.
When t1 = t2, the q × T parameter space is divided into Lagrange stable regions, where the solutionis asymptotically bounded, and resonate regions, where solutions can grow exponentially (see Fig. 1). Forsmall amplitudes q, solutions are only unstable for resonance horns with periods near the integermultiples of π . If we fix the forcing amplitude at q = 1/2, we observe that the stability of solutions is anoscillatory function of the phase periods t1 and t2 (see Fig. 2). The Meissner equation shows that aperiodically forced system can be sensitive to the pattern of forcing it experiences.
In this paper, I will approach the cycling problem using an immigration–selection model ofevolutionarily static strains of infection, with density-independent growth and the objective of minimizingthe population’s asymptotic growth rate. Minimization of population growth is similar to the
4

0 2 4 6 8 100
1
2
3
4
5
6
7
8
9
10
t1
t2
Figure 2: Lagrange stable regions of the Meissner equation, Eq. (1.1), as a function of the phase periods t1and t2, when the amplitude q = 1/2. Asymptotically unbounded solutions can only exist in the shadedregion.
5

minimization of mean fitness in a nonlinear quasi-species equation (Eigen, 1971; Nowak, 1992), butcomputationally more convenient. The study of density-independent models provides insight into thepotential complexity of solutions to the general cycling problem. For general density-independentimmigration–selection models, solutions to the cycling problem must be obtained on a case-by-case basis.There are, however, special cases where we can construct exact or approximate general principles forsolution of the cycling problem. In the special case of two types with autonomous, symmetric immigrationrates, faster cycling results in slower growth rates. I will also show that for immigration–selection models,spatial heterogeneity in the form of mixing strategies is similar to infinitely rapid environmental cycling.Thus, there is at least one class of models where cycling strategies are always outperformed by mixingstrategies. Numerical simulations show that, for more general problems, the specific form of this resultfails. These results suggest that, in general, it is rare to find a globally optimal cycling strategy thatsignificantly outperforms an optimal mixing strategy.
The models in this paper rely on the theory of first order systems of linear differential equations,and I make use of Floquet theory, matrix algebra, and standard numerical methods in my analysis. Themodels are presented in the context of antibiotic resistance management, but are also applicable in generalpest management settings.
In Section 2, I present a numerical investigation of cycling in a simplification of theLipsitch–Bergstrom model. In Section 3, I construct two general immigration–selection matrix models. InSection 4, I analyze the case of antibiotic cycling between two drugs with two strains of infection, andconstructively demonstrate that the asymptotic growth rate is an increasing function of the cycling period.In this special case, mixing strategies will always perform better than the equivalent cycling strategies, andI further demonstrate the existence of an optimal mixing strategy. In Sections 5 and 6, I discuss theextension of the immigration–selection model to an arbitrary number of strains. Section 5 shows that, inthe absence of immigration, the asymptotic growth rate is independent of the cycling period. Section 6presents another mixing optimality result for multiple strains with a 2-phase strategy when immigration issymmetric. Numerical counterexamples to mixing optimality under general conditions are presented inSection 7 for the cases of autonomous, asymmetric immigration and non-autonomous, symmetricimmigration. I conclude with a summary of the results and a discussion of the effects of managementstrategy on the evolution of drug resistance.
2 A Reduced Lipsitch–Bergstrom ModelLipsitch & Bergstrom (2002) have developed a useful model for the study of antibiotic resistance in anintensive care unit. The Lipsitch–Bergstrom model is a system of coupled differential equations thatdescribes admittance and discharge of hospital patients while there is ongoing competition among awild-type bacteria and two strains of antibiotic-resistant bacteria treatable with alternate antibiotics.Specifically, the general Lipsitch–Bergstrom model is a mass–action chemostat equation
S = µ (mS − S) + γ1 I1 + γ2 I2 + γ12 I12 − (β1 I1 + β2 I2 + β12I12) S, (2.1)
I12 = µ (m12 − I12)− γ12 I12 + [β12S +σ (β12 −β1) I1 +σ (β12 −β2) I2] I12, (2.2)
I1 = µ (m1 − I1)− γ1 I1 + [β1S +σ (β1 −β2) I2 +σ (β1 −β12) I12] I1, (2.3)
I2 = µ (m2 − I2)− γ2 I2 + [β2S +σ (β2 −β1) I1 +σ (β2 −β12) I12] I2. (2.4)
The state variables I j represent the abundance of colonized patients treatable with antibiotics 1 (I1), 2 (I2),or both antibiotics 1 and 2 (I12), and the state variable S represents the abundance of uncolonized patients.Parameters m j ≥ 0 are the relative abundance of uncolonized individuals ( j = S ) or colonizedindividuals treatable with antibiotics j ∈ {12, 1, 2} in community being serviced by the hospital such thatmS + m12 + m1 + m2 = 1. The parameter µ ≥ 0 is the “dilution rate”, representing the rate at whichindividuals are admitted and discharged from the hospital. Parameters β j ≥ 0 are colonization rates ofstrains treatable with antibiotics j ∈ {12, 1, 2}. Parameters γ j are the rates at which individuals are clearedfrom infected state I j to the susceptible state S either spontaneously or by treatment. In theLipsitch–Bergstrom model, it is assumed that γ12 ≥ γ1 ≥ 0 and γ12 ≥ γ2 ≥ 0. The parameter σ ∈ [0, 1] isthe probability that one strain can displace another.
6

To facilitate the analytical analysis of the cycling problem, we assume the following: (1) allcolonized patients receive one of two antibiotics, 1 or 2, both of which are effective against the wild-typebacteria so that the level of universally treatable patients I12 is constant, (2) neither antibiotic is generallypreferable to the other, and (3) the two strains of resistant bacteria are the same except for their resistanceto opposite antibiotics. Under these assumptions, the dynamic equations for the expected abundance ofpatients colonized with bacteria resistant to antibiotic 1 (I1) and bacteria resistant to antibiotic 2 (I2) fromthe Lipsitch–Bergstrom model reduce to a Lotka–Volterra model with immigration,
dI1dt
= m + I1 (1 − I1 − I2)− γu(t)I1, (2.5)
dI2dt
= m + I2 (1 − I1 − I2)− γ [1 − u(t)] I2, (2.6)
where m is the admittance rate of colonized patients, u(t) is the fraction of patients treated with antibiotic2, 1 − u(t) is the fraction of patients treated with antibiotic 1, and γ is the clearance rate when patientsreceive effective treatment. One potential goal of management may be to minimize the asymptotic averageinfection level
J = limT→∞
1T
T∫
0
I1(t) + I2(t)dt. (2.7)
Equations closely related to Eqs. (2.5)-(2.7) were first studied by Rowthorn & Brown (2003) as an optimalcontrol problem. Rowthorn & Brown were only able to provide a partial solution because the equationsfail to satisfy certain sufficient convexity conditions (Arrow & Kurz, 1970). The same difficulty wouldarises here if we employed an optimal-control approach, but some enlightenment can be found bynumerically investigating the performance of periodic 2-phase bang-bang control strategies. Bang-bangcontrols are controls that only take on extreme values. In our case, the controls may only take values 0 or1. Let u(t) be defined by Eq. (1.2). Numerical experiments indicate that optimal management occurs in thelimit as T = t1 + t2 → 0, with t1 = t2 (see Figures 3 and 4). This strategy of infinitely rapid cycling appearsto be equivalent to a mixed control strategy with u(t) = 1/2. Biologically, the mixing strategy should beinterpreted as treating half the new cases with one of the drug and half with the other drug, not as eachpatient being treated with a combination of the two drugs. All mixing strategies should be interpretedsimilarly.
The above results are consistent with the findings of Rowthorn & Brown and with studies ofLipsitch & Bergstrom (2002). However, the asymptotic average infection level J generally depends uponthe system’s initial condition, and I have been unable to prove the existence of a unique, globallyattracting periodic solution for arbitrary control strategies in Eqs. (2.5)-(2.6). Thus, although no difficultieswith non-uniqueness were observed in my numerical experiments, the results have not been rigorouslyconfirmed.
3 Matrix ModelsThe complexity associated with even the reduced Lipsitch–Bergstrom model make it difficult to intuitivelyunderstand when and why mixing strategies appear preferable to cycling strategies. To illuminate thisquestion, we turn to the simplest non-trivial scenario, that of a linear immigration–selection models. Thissection derives two forms of an immigration–selection model I will use in this paper.
When populations are small enough to grow independent of resource and interaction constraints,their growth may be approximately described by a Bellman–Harris branching process (Athreya & Ney,1972). If an appropriate time scale is used and event rates are age-independent, the branching process willbe a Poisson process. Standard techniques (Athreya & Ney, 1972) show that under these assumptions, therates of change in the expected abundances Ii of individuals of type i satisfy the linear equation
Ii = ∑j
qi jI j, (3.1)
7

B
=3γ A
=0.5γ
=2γ
=1γ
=0γ
m=0.1
m=0.5
m=1
m=0.001
20 30 40 50 10 0 0
0.5
1
1.5
2
Cycling Period
20 10 30 40 50 0 0
0.2
0.4
0.6
0.8
1.0A
vera
ge In
fect
ion
leve
l
Figure 3: The asymptotic average infection level, described by Eq. (2.7), as a function of the total cyclingperiod T = t1 + t2,t1 = t2, for the Rowthorn–Brown model with a 2-phase management strategy: (A) animmigration rate m = 1/10, 000 for several clearance rates γ, and (B) a clearance rate γ = 1, for severalimmigration rates m. As the cycling period increases, the asymptotic average infection level increases.
8

0.01
0.1
1
10
100
0.01 0.1 1 10 100
t1
0.8
0.9
1.0
1.05
1.1
1.1
t2
Figure 4: A contour plot of the asymptotic average infection level in the Rowthorn–Brown model as afunction of the treatment phase periods t1 and t2, for clearance rate γ = 1 and immigration rate m = 0.1.Optimal 2-phase management obtains an asymptotic average infection level of J = 0.76.
9

where the sum is carried out over all types, and the transition rates qi j are the expected changes in thenumber of individuals of type i per individual of type j, per unit of time. In matrix notation,
dIdt
= QI, (3.2)
where the transition rate matrix Q = [qi j].In the case of bacterial colonization and infection of hospital patients, the matrix Q incorporates the
effects of transmission, clearance, and immigration. The structure of Q depends on the relationshipsamong these events. If transmission, clearance, and immigration are independent, let
Q = M + F − D, (3.3)
where F is a non-negative diagonal matrix of transmission rates, D is a non-negative diagonal matrix ofclearance rates, and M is a Markov process generator matrix of immigration rates with non-positivediagonal entries and non-negative off-diagonal entries so that all the columns of M sum to zero. Models ofthe form (3.3) will be referred to as transmission-independent immigration models.
Alternatively, immigration events may be strongly correlated with transmission events, whileclearance remains an independent process. In this case, let
Q = MF − D, (3.4)
where F and D are as defined for Eq. (3.3) but M is a diagonally-dominate stochastic matrix of immigrationprobabilities. Models of the form (3.4) will be referred to as transmission-dependent immigration 1
models. In both cases, Q is quasi-nonnegative, admitting negative entries only along the main diagonal.The rates qi j also depend upon the details of the interactions between organisms and the antibiotics.
Each drug k may have a different rate matrix Qk resulting from different transmission rates, clearancerates, and immigration patterns in the drug’s presence. When different fractions uk of the infectedpopulation are treated with each drug k, the changes in the expected abundances satisfy
dIdt
=
[
∑k
uk(t)Qk
]
I (3.5)
where ∑ uk = 1, uk ≥ 0. Different management strategies correspond to different choices of uk(t). In thispaper, I will be concerned with cycling strategies, where uk ∈ {1, 0}. Our objective in choosing amanagement strategy will be to minimize the spread of infection by minimizing the average asymptoticgrowth rate of the infection abundances.
4 Two Strains with Transmission-Dependent ImmigrationWe begin with a simple case. Consider the case of two strains of infection with strongly correlatedimmigration and transmission and two drug treatments. If we stipulate immigration to be symmetric, andindependent of antibiotic in use, the abundances satisfy
dIdt
= [u(t)Q2 + (1 − u(t)) Q1] I (4.1)
where
Q1 = MF1 − D1, Q2 = MF2 − D2, (4.2)
F1 =
[
r1 + r1 00 r1 − r1
]
, F2 =
[
r2 + r2 00 r2 − r2
]
, (4.3)
D1 =
[
d1 + d1 00 d1 − d1
]
, D2 =
[
d2 + d2 00 d2 − d2
]
, (4.4)
M =
[
1 − m mm 1 − m
]
, (4.5)
1The special form of immigration I adopt here may alternatively be interpreted as mutation in both Eqs. 3.3 and 3.4.
10

u(t) represents the proportion of infections being treated with drug 2 at time t, and 1 − u(t) represents theproportion of infections being treated with drug 1 at time t. ri may be interpreted as the meantransmission rate of the strains while subject to drug i, and ri describes the difference in transmissionbetween strains. Similarly, di describes the mean clearance rate by drug i and di describes the difference inclearance rates between strains. Let us also assume that both strains have positive transmission rates andclearance rates (ri > |ri| > 0 and di > |di| > 0). m represents the probability that an immigration event ofthe alternative strain occurs, rather than a transmission event.
Each choice of u(t) describes a management strategy. An equally weighted mixing strategy, forinstance, corresponds to u(t) = 1/2. There are uncountably many choices for u(t). One simple family ofcycling strategies is the family of 2-phase strategies, where u(t) takes the form described by Eq. (1.2).During the first phase of the cycle, which has duration t1, all infections are treated with drug 1. During thesecond phase of the cycle, which has duration t2, all infections are treated with drug 2. The parameterT = t1 + t2 represents the total period of one cycle, and will be focus of much of our analysis. It will alsobe convenient to define t1 = t1/T and t2 = t2/T as the phase fractions of treatments 1 and 2 respectively.
The abundances after completion of one cycle of a 2-phase cycling strategy, given initial abundancesI(0), may be represented in terms of the matrix exponential (Moler & Loan, 2003) as
et2 Q2 et1 Q1 I(0). (4.6)
The matrixΨ = et2 Q2 et1 Q1 (4.7)
is referred to as the monodromy matrix in Floquet theory (Yakubovich & Starzhinskii, 1975). Themonodromy matrix Ψ completely describes the aperiodic component of the underlying linear equation.Using the monodromy matrix, for instance, the population abundances after n cycles will be
Ψn I(0). (4.8)
The average asymptotic growth rate in the number of infections may be defined in terms of themonodromy matrix Ψ as
f =1T
ln [ρ (Ψ)] , (4.9)
where the spectral radius ρ(Ψ) represents the magnitude of the largest eigenvalue of the monodromymatrix(Horn & Johnson, 1985). Intuitively, the average asymptotic growth rate is the rate at which asimple population must grow to “keep up with” the structured population’s growth.
To construct f , we need a closed-form representation for the spectral radius ρ(Ψ). The Lagrangeinterpolation formula for the matrix exponential (Moler & Loan, 2003) is especially convenient. Given anN × N matrix Q with N distinct eigenvalues λ1, λ2, . . . λN ,
eQt =N
∑n=1
eλntLn(Q), where Ln(Q) = ∏i 6=n
(
Q − λiEλn − λi
)
, (4.10)
where E represents the identity matrix. When Q is a 2 × 2 matrix,
eQt =1φ
eσ t sinh(φt) (Q −σE) + eσ t cosh(φt)E, (4.11)
where σ = (λ1 + λ2)/2, and φ2 = σ2 − λ1λ2, λ1 6= λ2. The eigenvalues λ1 and λ2 are calculated using thequadratic formula. Eq. (4.11) gives a closed form representation for the matrix exponential in terms of Q.By applying Eq. (4.11) to Eq. (4.7), we can obtain an explicit, though cumbersome, representation for Ψ.The characteristic equation of Ψ,
det [Ψ − ρE] = 0, (4.12)
is then a quadratic polynomial in ρ, and can be solved explicitly.As our primary example, consider the case of d1 = d2 = 0. With some manipulation, we can show
that the spectral radius
ρ = z exp{
t1[
(1 − m) r1 − d1]
+ t2[
(1 − m) r2 − d2]}
, (4.13)
11

where z is the largest real root of
z2 − 2Bz + 1 = 0, (4.14)
B =m2r2r1 + r2r1 (1 − 2m)
φ2φ1sinh (φ1t1) sinh (φ2t2) + cosh (φ1t1) cosh (φ2t2) , (4.15)
φ21 = m2r2
1 + (1 − 2m)r21, (4.16)
φ22 = m2r2
2 + (1 − 2m)r22. (4.17)
Using the quadratic formula to solve for z and applying Eq. (4.13) to Eq. (4.9),
f ={
t1[
(1 − m) r1 − d1]
+ t2[
(1 − m) r2 − d2]}
+1T
arccosh [B] . (4.18)
The closed form representation for f given by Eqs. (4.15)-(4.18) is a complete description of the asymptoticgrowth, and implies the following:
Theorem 1. If d1 = d2 = 0 and 0 ≤ m ≤ 1/2, then f , as give by Eq. (4.18), is a monotonic increasing function ofthe cycling period T.
A proof of Theorem 1 is given in Appendix A. From Theorem 1, we see that f obtains its minimumin the limit as T → 0. Faster cycling will always lead to slower asymptotic growth.
One of the central difficulties in dealing with the matrix exponential when compared with the scalarexponential function is that for general matrices Qa and Qb,
eQb eQa 6= eQb+Qa . (4.19)
But, according to the Lie product formula (Horn & Johnson, 1985),
limT→0
(
eTQb eTQa)n/T
= en(Qb+Qa) . (4.20)
In our case, the limit in Eq. (4.20) should be interpreted as progressively decreasing the cycle time T, whilekeeping the total observation time nT fixed. Applied to the system described by Eq. (4.2),
limT→0,nT fixed
Ψn(T) = enT(t2MF2+t1 MF1−t2D2−t1D1) . (4.21)
The reader can observe that Eq. (4.21) is equivalent to growing the population for a time nT under a newtreatment with transmission and clearance rates
Fnew = t2F2 + t1F1 and Dnew = t2D2 + t1D1. (4.22)
In essence, this new treatment is a mixture of the 2 original treatments with a fraction t1 of the populationsubject to drug 1 and the remaining fraction t2 of the population subject to drug 2. Thus, the cyclingstrategy converges to a mixing strategy in the limit of infinitely fast cycling. In general, rapid cycling isclosely approximated by a mixing strategy with the same phase-fractions. For cases where Theorem 1applies, we conclude that a cycling strategy never limits population growth as well as a mixing strategywith the same phase fractions.
Having demonstrated the optimality of mixing over cycling in the case of d1 = d2 = 0, wedetermine a globally optimal mixing strategy. The asymptotic growth rate under mixing is
fmix = limT→0
f (T) (4.23)
= (1 − m)(r1t1 + r2 t2) +
√
m2(
r1 t1 + r2 t2)2
+ (1 − 2m)(
r1 t1 + r2 t2)2. (4.24)
Using the relation t2 = 1 − t1, we can show
d2 fmix
dt21
=m2(1 − 2m)(r1r2 − r2r1)
2[
√
m2(
r1 t1 + r2 t2)2
+ (1 − 2m)(
r1 t1 + r2 t2)2]3 . (4.25)
12

Eq. (4.25) is non-negative as long as m < 1/2, implying fmix is convex in t1 (equivalently, t2). It followsthat there is a unique locally optimal mixing strategy which is also globally optimal. In the special caser1 = r2, r1 = −r2, the optimal phase fractions are t1 = t2 = 1/2. For r1 6= r2, the optimal phase fractionscan be calculated using convex minimization techniques.
An alternative scenario may be that clearance rates differ among infection strains under each cyclephase, but reproductive rates are constant across both cycle phases (d1 6= d2, r1 = r2, r1 = r2). In this case,minimization of the asymptotic average growth rate over all 2-phase cycling strategies again leads to aunique optimal mixing strategy.
However, there are cases where a 2-phase cycling strategy can offer an improvement on a mixingstrategy: cases where d1 = (1 − m)r1 and d2 = (1 − m)r2 are concave in T rather than convex for anypositive phase fractions t1 and t2.
5 Multiple Strains without ImmigrationIn the absence of immigration, the cycling problem is relatively easy to solve. When we expose N differentstrains to a K-phase cycling strategy, with phase periods tk, the monodromy matrix
Ψ =K
∏k=1
etk(Fk−Dk) = eT ∑Kk=1 tk(Fk−Dk), (5.1)
where tk = tk/T and T = ∑Kk=1 tk. The simplification in Eq. (5.1) is possible because diagonal matrices
commute. Here, Ψ will be a diagonal matrix, and the diagonal entries of Ψ will be the eigenvalues. Itfollows directly from Eq. (4.9) that
f = max
{
diag Q : Q =K
∑k=1
tk (Fk − Dk)
}
. (5.2)
Thus, the asymptotic growth rate is independent of the cycle period T. Minimizing f is a convexprogramming problem in the phase fractions tk, with linear constraints, and can be constructively solvedusing numerical methods. This solution should also be a good general approximation when immigrationis slow.
6 Multiple Strains with Transmission-Independent ImmigrationAs mentioned in Section 3, there are two potential approaches for incorporating immigration. We nowconsider the case, described by Eq. (3.3), where transmission, clearance, and immigration are independentevents. In a 2-treatment model, abundances satisfy Eq. (4.1) but with Q1 = M1 + F1 − D1 andQ2 = M2 + F2 − D2. When a 2-phase cycling strategy is applied,
Ψ = et2TQ2et1TQ1 , (6.1)
where T, t1, and t2 retain their previous definitions. If M1 and M2 are symmetric, we can prove that theaverage asymptotic growth rate f is an increasing function of the cycling period T using a general result ofCohen et al. (1982) (see Appendix B).
Theorem 2. If the monodromy matrix Ψ is given by Eq. (6.1), Mi is symmetric, and Fi and Di are diagonalnon-negative for i = 1, 2, then the average asymptotic growth rate f = 1
T log {ρ[Ψ(T)]} of a 2-phase on-off cyclingstrategy described by phase periods t1 and t2 is a monotone increasing function of T = t1 + t2.
This result does not extend to cases of asymmetric immigration or multi-phase cycling strategies,however, and suggests that there may be an important difference between 2-phase and multiple-phasemanagement strategies.
13

7 Multiple Strains with Transmission-Dependent ImmigrationWhen we consider models with multiple infectious strains and multiple drug treatments, classicalmathematical analysis is less profitable. Instead, I will analysis some specific examples of multiple strainmodels with transmission-dependent immigration numerically.
The examples shown in Figs. 5, 6, and 7 and described in Appendix C illustrate some cases wherethe asymptotic growth rates are not monotone increasing functions of the cycle period. For a given set ofphase fractions, increasing the cycling period may either improve or degrade the effectiveness of amanagement strategy. This is not especially surprising, in light of the Meissner equation, but we are leftwith an unanswered question for these general cases: Will the best cycling strategy improve on the bestmixing strategy for resistance management?
In a strict sense, the answer is elementary. Mixing strategies are a strict subset of cycling strategies,so optimal cycling can never be worse than optimal mixing. But from a practical standpoint, the questionappears more difficult. For Examples 1-3, described in Appendix C, numerical calculations indicate thatthe globally optimal management strategies are mixing strategies. But, a sample size of 3 is small. Toprovide some intuition, the space of transmission-dependent immigration models was randomly sampled,and a numerical optimization algorithm was used to compare cycling and mixing strategies. N × Nimmigration matrices, M, were selected from the ensemble
{
(1 − m)E + mN2
∑j=1
u jPj
}
(7.1)
where m is uniformly distributed on the interval (0, 1/2), E is the identity matrix, u is uniformlydistributed over the N2-dimensional simplex, and Pj is a random N × N permutation matrix. Matrixdimensions ranged from 2 × 2 to 10 × 10 with up to 4 different environments. The Birkhoff–von Neumanntheorem, that every doubly-stochastic matrix may be represented as convex combination of N(N − 2) + 2or fewer permutation matrices (Horn & Johnson, 1985; Marcus & Minc, 1964), ensures that the full set alldoubly-stochastic matrices are reachable. Independent log-normal and uniform simplex distributionswere used to generate random transmission and clearance rates. Matrix exponentiation was performedusing Matlab’s implementation of the matrix exponential.
The simulations I have performed suggest the following patterns. First, both cycling and mixingstrategies can significantly improve management results over the use of a single drug. Non-optimalmixing or cycling strategies can also significantly degrade performance. Second, near-optimal cyclingstrategies often do not improve on near-optimal mixing strategies. In cases where near-optimal cyclingstrategies do improve on near-optimal mixing strategies, this improvement appears to be small. Figure 8shows one such example, where 3 antibiotics are cycled to treat three strains of infection. Optimal mixingobtained f = 3.9, while optimal cycling obtained f = 3.8. These numerical experiments should be viewedcautiously, but suggest that optimized cycling strategies generally provide only a small improvementrelative to optimized mixing strategies.
8 DiscussionThe biology of management strategies for antibiotic usage includes complications that I have notaddressed. In particular, new strains of drug resistance can evolve under the selective pressures oftreatment. The implications of a management strategy for the evolution of new strains of resistance is animportant consideration.
One path by which new drug-resistant strains can evolve is through horizontal gene transfer,sometimes resulting in the appearance of multi-drug resistance. It would be desirable to minimize theprobability of horizontal gene transfer at the same time we maximize antibiotic efficacy, such that theantibiotic will be of use to future patients as well as current patients. Both current and future patients willbenefit from cycling strategies that reduce horizontal gene transfer while increasing treatment efficacy. Weshould work to identify these situations. Complications arise when the benefits to current and futurepatients do not coincide. Consider a situation where a certain mixing strategy is optimal in the sense of
14

0.75
0.8
0.85
0.9
0.95
1
10 10 10 10 10−1 0 1 2 3
10−1
100
101
102
103
0.75
0.8
0.85
0.9
0.95
1
1.05
1.1
Ave
rage
Asy
mpt
otic
Gro
wth
Rat
e
10−1
100
101
102
103
0.9
1
1.1
1.2
1.3
1.4
1.5
Cycling Period (T)
Example 3
Example 2
Example 1
Figure 5: Three examples of the behavior of the average asymptotic growth rate f as a function of the cyclingperiod T. Example 1 corresponds to the matrices in Eq. (C.1), example 2 corresponds to the matrices fromEq. (C.2), and example 3 corresponds to the matrices from Eqs. (C.3)-(C.5). f was calculated for each withthe corresponding fractional exposure times described in the appendix. Examples 2 and 3 show that f neednot be a monotone function of the cycling period.
15

−1.5 −1 −0.5 0 0.5 1 1.5 2
−1.5
−1
−0.5
0
0.5
1
1.5
2
Log10 t1
Log 1
0 t 2
0.76
0.76
0.76
0.76
0.76
0.8
0.8
0.8
0.8
0.8
0.8
0.9
0.9
0.9
0.9
0.9
0.97
0.97
0.97
0.97
Figure 6: A contour plot of the asymptotic growth rate as a function the phase periods for Example 1, withphases given in Eq. (C.1).
16

−1.5 −1 −0.5 0 0.5 1 1.5 2
−1.5
−1
−0.5
0
0.5
1
1.5
2
Log10 t1
Log 1
0 t 2
0.8
0.8
0.8
0.8
0.8
0.8
0.9
0.9
0.9
0.9
0.9
0.9
1
1
1
1
1
1.03
Figure 7: A contour plot of the asymptotic growth rate as a function of the phase periods for Example 2,with phases given in Eq. (C.2).
17

0 2 4 6 8 10 12 14 16 18
0.4
0.45
0.5
0.55
0.6
0.65
0.7
0.75
0.8
0.85
0.9
Cycle Period
Ave
rage
Asy
mpt
otic
Gro
wth
Rat
e
Figure 8: The average asymptotic growth rate as a function of cycling period for Example 4 along t1 = 0.27,t2 = 0.46, t3 = 0.27 . Simulations suggest that a cycling period of T ≈ 2.5 is globally optimal.
18
minimizing growth and transmission. If we introduce a cycling strategy that uses the same phasefractions, the correlation in abundances of different strains may decrease, leading to a decrease in theprobability of horizontal gene transfer. However the overall efficacy of treatment will also decrease,compared to the optimal mixing strategy. Determining an optimal cycling strategy requires evaluating atrade-off between current treatment efficacy and future treatment efficacy. Determination of this trade-offis perhaps more of an ethical conundrum than of a scientific question: What health costs are we willing toimpose on currently ill patients for the benefit of future patients?
Drug resistance can also evolve gradually, as a response to selective pressure from an antibiotic. Inthis respect, antibiotics are sometimes considered a non-renewable resource (Laxminarayan & Brown,2001). There are many factors that control the rate of evolution of drug resistance. These include the size ofthe population experiencing selection, mutation rates, the strength of selection, and the shape of theadaptive landscape on which selection is occurring. These factors are influenced by spatial and temporalenvironmental heterogeneity. The work presented here indirectly suggests that longer cycle periods willcorrespond to smoother adaptive landscapes and faster evolution of resistance. But the problem ofminimizing the evolution rate is more appropriately addressed with different methods.
The methods I have used are not necessarily well suited for addressing questions of the evolution ofnovel strains of infection. Instead, I have focused on determining drug management strategies, andoptimal environmental heterogeneity in general, based on the fitness of pre-existing strains of infection. Ifthe fitness of a strain of infection is independent of the drug treatment adopted, no benefits can beachieved by modifying policies for managing drug usage in a hospital. When fitness does depend on theantibiotic treatment, rational management policies may improve treatment efficacy. Treatment efficacymay depend on management strategy through the cost and availability of drugs, the prevalence of drugresistance outside hospitals, spatial and temporal environmental heterogeneity, and other factors.Optimizing management strategy with respect to temporal heterogeneity is what I’ve referred to as the“cycling problem”.
In this paper, I have presented a linear theory for the cycling problem, along with numericalexamples and solution in several special cases. The results support the preference of conventional mixingstrategies over cycling strategies as a method for the introduction of environmental heterogeneity intomanagement policies. Cycling and mixing strategies are equivalent management strategies unless there isimmigration, mutation, or some other form of interaction among strains of infection. In most cases,interactions bias the dynamics in favor of mixing strategies, but cycling may improve on mixing wheninteractions are strongly asymmetric. Under global optimization constraints, cycling was only rarelyobserved to improve on mixing. Many open questions remain. It seems possible, for instance, that cyclingstrategies may be preferred in cases where there are significant seasonal dynamics. In addition,externalities such as limited drug availability in developing nations may make cycling an attractiveresistance management strategy.
More work on matrix models and alternative approaches is necessary to fully understand the effectsof environmental heterogeneity in biological systems management. The problem of eigenvalueoptimization has received recent attention in applied mathematics (Burke et al., 2001) and may be of usehere. One potentially fruitful approach may be the application of bilinear optimal control theory (Mohler,1970, 1973). Another direction of future work may include alternative forms of immigration that describethe population dynamics in a hospital more accurately. Preliminary work on this front suggests resultssimilar to those presented here. Other future work may include periodically forced competition modelsand further work on existing optimal-control models. In closing, careful use of environmentalheterogeneity remains a promising option in biological systems management, but one which will only berealized by a close interaction between theory, experiment, and practice.
AcknowledgmentsThe author would like to thank G. Brown for helpful discussion, M. Kot and three anonymous reviewersfor helpful comments on the manuscript, and C. Bergstrom for encouraging this research and contributinga preliminary version of the results of Section 5. This work was supported in part by NSF VIGRE grantDMS-9810726.
19

ReferencesARROW, K. J. & KURZ, M. (1970). Public Investment, the Rate of Return, and Optimal Fiscal Policy. Baltimore,
MD: Johns Hopkins Press.
ARSCOTT, F. M. (1964). Periodic Differential Equations: An Introduction to Mathieu, Lame, and Allied Functions.New York, NY: Macmillan.
ATHREYA, K. B. & NEY, P. E. (1972). Branching Processes. New York, NY: Springer-Verlag.
BEISSINGER, S. R. (1995). Modeling extinction in periodic environments - Everglades water levels andsnail kite population viability. Ecological Applications 5(3), 618–631.
BERGSTROM, C., LO, M., & LIPSITCH, M. (2004). Ecological theory suggests that antimicrobial cyclingwill not reduce antimicrobial resistance in hospitals. Proceedings of the National Academy of Sciences of theUnited States of America 101(36), 13285-13290.
BONHOEFFER, S., LIPSITCH, M. & LEVIN, B. R. (1997). Evaluating treatment protocols to preventantibiotic resistance. Proceedings of the National Academy of Sciences of the United States of America 94(22),12106–12111.
BROMMER, J., KOKKO, H. & PIETIAINEN, H. (2000). Reproductive effort and reproductive values inperiodic environments. American Naturalist 155(4), 454–472.
BURKE, J., LEWIS, A. & OVERTON, M. (2001). Optimizing matrix stability. Proceedings of the AmericanMathematical Society 129, 1635–1642.
COALE, A. J. (1972). The Growth and Structure of Human Populations. Princeton, NJ: Princeton UniversityPress.
COHEN, J. E., FRIEDLAND, S., KATO, T. & KELLY, F. P. (1982). Eigenvalue inequalities for products ofmatrix exponentials. Linear Algebra and Its Applications 45, 55–95.
DOMINGUEZ, E. A., SMITH, T. L., REED, E., SANDERS, C. C. & SANDERS, W. E. (2000). A pilot study ofantibiotic cycling in a hematology-oncology unit. Infection Control and Hospital Epidemiology 21(1), S4–S8.
EIGEN, M. (1971). Selforganization of matter and the evolution of biological macromolecules.Naturwissenschaften 58, 465–523.
FELSENSTEIN, J. (1976). Theoretical population genetics of variable selection and migration. AnnualReview of Genetics 10, 253–280.
FRANK, S. A. & SLATKIN, M. (1990). Evolution in a variable environment. The American Naturalist 136(2),244–260.
FRIDKIN, S. K. (2003). Routine cycling of antimicrobial agents as an infection-control measure. ClinicalInfectious Diseases 36(11), 1438–1444.
GAYNES, R. (1997). The impact of antimicrobial use on the emergence of antimicrobial-resistant bacteria inhospitals. Infectious disease clinics of North America 11, 757– 65.
GRUSON, D., HILBERT, G., VARGAS, F., VALENTINO, R., BUI, N., PEREYRE, S., BEBEAR, C., BEBEAR,C. M. & GBIKPI-BENISSAN, G. (2003). Strategy of antibiotic rotation: Long-term effect on incidence andsusceptibilities of gram-negative bacilli responsible for ventilator-associated pneumonia. Critical CareMedicine 31(7), 1908–1914.
HEDRICK, P. W. (1986). Genetic-polymorphism in heterogeneous environments - a decade later. AnnualReview of Ecology and Systematics 17, 535–566.
HENSON, S. M. & CUSHING, J. M. (1997). The effect of periodic habitat fluctuations on a nonlinear insectpopulation model. Journal of Mathematical Biology 36(2), 201–226.
20

HODGES, B. M. & WHITE, R. L. (2001). Antimicrobial cycling: the future or a fad? Annals ofPharmacotherapy 35(10), 1224–1232.
HORN, R. A. & JOHNSON, C. R. (1985). Matrix Analysis. Cambridge, UK: Cambridge University Press.
HUTCHINGS, M. J., JOHN, E. A. & STEWART, A. J. (eds.) (2000). The Ecological Consequences ofEnvironmental Heterogeneity. Malden, MA: Blackwell Science.
HUTSON, V., MISCHAIKOW, K. & POLACIK, P. (2001). The evolution of dispersal rates in a heterogeneoustime-periodic environment. Journal of Mathematical Biology 43(6), 501–533.
KIRZHNER, V. M., KOROL, A. B. & NEVO, E. (1998). Complex limiting behaviour of multilocus geneticsystems in cyclical environments. Journal of Theoretical Biology 190(3), 215–225.
KOLASA, J. & PICKETT, S. T. (eds.) (1991). Ecological Heterogeneity, vol. 86 of Ecological Studies. New York,NY: Springer-Verlag.
KOLLEF, M. H. (2003). Antibiotic heterogeneity: Should we use it? Critical Care Medicine 31(7), 2074–2076.
KOLLEF, M. H., VLASNIK, J., SHARPLESS, L., PASQUE, C., MURPHY, D. & FRASER, V. (1997). Scheduledchange of antibiotic classes - a strategy to decrease the incidence of ventilator-associated pneumonia.American Journal of Respiratory and Critical Care Medicine 156(4), 1040–1048.
LAXMINARAYAN, R. & BROWN, G. M. (2001). Economics of antibiotic resistance: A theory of optimal use.Journal of Environmental Economics and Management 42(2), 183–206.
LIPSITCH, M. & BERGSTROM, C. T. (2002). Modeling of antbiotic resistance in the ICU – U.S. slant. In:Infection Control in the ICU Environment (WEINSTEIN, R. A. & BONTEN, M., eds.). Kluwer, Dordrecht.
MARCUS, M. & MINC, H. (1964). A Survey of Matrix Theory and Matrix Inequalities. Boston, MA: Allyn andBacon.
MCPEEK, M. A. & HOLT, R. D. (1992). The evolution of dispersal in spatially and temporally varyingenvironments. American Naturalist 140(6), 1010–1027.
MOHLER, R. R. (1970). Natural bilinear control processes. IEEE Transactions on Systems, Man, andCybernetics SSC-6, 192–197.
MOHLER, R. R. (1973). Bilinear Control Processes: With Applications to Engineering, Ecology, and Medicine.New York, NY: Adademic Press.
MOLER, C. & LOAN, C. V. (2003). Nineteen dubious ways to compute the exponential of a matrix,twenty-five years later. SIAM Review 45(1), 3–49.
MONNET, D. L., ARCHIBALD, L. K., PHILLIPS, L., TENOVER, F. C., MCGOWAN, J. E. & GAYNES, R. P.(1998). Antimicrobial use and resistance in eight us hospitals: Complexities of analysis and modeling.Infection Control and Hospital Epidemiology 19(6), 388–394.
NIEDERMAN, M. S. (2001). Impact of antibiotic resistance on clinical outcomes and the cost of care. CriticalCare Medicine 29(4), N114-N120 Suppl. S.
NOWAK, M. A. (1992). What is a quasi-species? Trends in Ecology and Evolution 7(4), 118–121.
RAYMOND, D. P., PELLETIER, S. J., CRABTREE, T. D., EVANS, H. L., PRUETT, T. L. & SAWYER, R. G.(2003). Impact of antibiotic-resistant gram-negative bacilli infections on outcome in hospitalizedpatients. Critical Care Medicine 31(4), 1035–1041.
RICHARDS, J. A. (1983). Analysis of Periodically Time-Varying Systems. Berlin, Germany: Springer-Verlag.
ROWTHORN, R. & BROWN, G. M. (2003). Using antibiotics when resistance is renewable. In: BattlingResistance to Antibiotics and Pesticides: an Economic Approach (LAXMINARAYAN, R., ed.). Washington, DC:Resources for the Future, pp. 17–41.
21

SALO, S. & TAHVONEN, O. (2002). On equilibrium cycles and normal forests in optimal harvesting of treevintages. Journal of Environmental Economics and Management 44(1), 1–22.
SHORROCKS, B. & SWINGLAND, I. R. (eds.) (1990). Living in a Patchy Environment. Oxford, UK: OxfordUniversity Press.
YAKUBOVICH, V. A. & STARZHINSKII, V. M. (1975). Linear Differential Equations with Periodic Coefficients,vol. 1. New York, NY: John Wiley and Sons.
A Proof of Theorem 1Lemma 1. If G(x) is convex for x ≥ 0 and G(0) ≤ 0, then G(x)/x is increasing for all x > 0.
This Lemma is closely related to the fact that the average rate of change of a convex function over aninterval is an increasing function of the righthand end point.
Proof. Let 0 < x1 < x2. By the definition of convexity of G(x),
G(x1) ≤
(
1 −x1x2
)
G(0) +x1x2
G(x2). (A.1)
Dividing by x1,G(x1)
x1. ≤
x2 − x1x1x2
G(0) +G(x2)
x2(A.2)
Since x2−x1x1x2
> 0 and G(0) ≤ 0,x2 − x1
x1x2G(0) ≤ 0, (A.3)
so Eq. (A.2) also impliesG(x1)
x1≤
G(x2)
x2(A.4)
for all 0 < x1 < x2. Thus, G(x)/x must be an increasing function for all x > 0.
Lemma 2. If φ1 > 0, φ2 > 0, and −1 ≤ a ≤ 1, then arccosh B(T; a), withB(T; a) = a sinh(φ1T) sinh(φ2T) + cosh(φ1T) cosh(φ2T), is convex in T, with minimum value 0 at T = 0.
Proof. First, B(T;−1) = cosh (φ1T −φ2T) and a1 > a2 implies B(T; a1) > B(T; a2) for all T. So B(T, a) ≥ 1for all a ≥ −1. Now,
(
B2 − 1)3/2 d2
dT2 arccosh B =
(1 − a2)[
B(φ2 sinh φ1T −φ1 sinh φ2T)2 + 2(B − 1)φ1φ2 sinh φ1T sinh φ2T]
. (A.5)
The second derivative is non-negative as long as a2 ≤ 1, T ≥ 0. This implies convexity. SinceB(T; a) = B(−T; a), the minimum value is at T = 0 and is 0.
Lemma 3. If 0 ≤ m ≤ 1/2, then
−1 ≤m2r1 r2 + r1r2(1 − 2m)
φ1φ2≤ 1, (A.6)
where φ1 and φ2 are given by Eqs. (4.16) and (4.17).
22

Proof. If m = 0, or m = 1/2, Eq. (A.6) is true by inspection. If 0 < m < 1/2,
0 ≤m2
1 − 2m
(
r1r1
−r2r2
)2, (A.7)
0 ≤m2
1 − 2m
(
r21
r21− 2
r1r2r1r2
+r2
2r2
2
)
, (A.8)
2r1r2r1r2
m2
1 − 2m≤
m2
1 − 2m
(
r21
r21
+r2
2r2
2
)
, (A.9)
(
m2
1 − 2m
)2
+ 2r1r2r1r2
m2
1 − 2m+
r21r2
2r2
1 r22≤
(
m2
1 − 2m
)2
+m2
1 − 2m
(
r21
r21
+r2
2r2
2
)
+r2
1r22
r21r2
2, (A.10)
(
m2
1 − 2m+
r1r2r1 r2
)2
≤
(
m2
1 − 2m+
r21
r21
)(
m2
1 − 2m+
r22
r22
)
(A.11)
Since 1 − 2m and r21r2
2 are positive,
[
m2r1 r2 + r1r2(1 − 2m)]2
≤[
m2r21 + r2
1(1 − 2m)] [
m2r22 + r2
2(1 − 2m)]
, (A.12)[
m2r1 r2 + r1r2(1 − 2m)]2
φ21φ
22
≤ 1. (A.13)
The result follows when we take the square root of both sides.
Proof of Theorem 1. By Lemmas 2 and 3,
G(T) =[
(1 − m)r1 + d2]
t1T +[
(1 − m)r2 − d2]
t2T + arccosh [B]
is convex in T. Also G(0) = 0. Thus, by Lemma 1, f = G(T)/T is a monotone increasing function of T.
B Proof of Theorem 2Proof. Mi, Di and Fi are symmetric, so both Q1 = M1 + F1 − D1 and Q2 = M2 + F2 − D2 are symmetricreal matrices, and hence, Hermitian. Then, by Corollary 9 from Cohen et al. (1982),
G(T) = log ρ[
et2Q2 et1Q1]
must be convex in the pair (t1, t2). It follows directly that G(T) is convexity in T = t1 + t2. Since G(0) = 0,we may apply Lemma 1, and conclude that G(T)/T is a monotone increasing function of T.
C Multi-Strain ExamplesThe following time-dependent immigration examples were used to generate Figs. 5 and 8.
For Example 1 in Fig. 5 and Fig. 6,
Q1 =14
[
2 30 3
]
, Q2 =14
[
3 03 2
]
, (C.1)
with t1 = t2 = 1/2, the asymptotic fitness f is monotonically decreasing in T. Of course, choice of equaltreatment periods is especially bad in this scenario, since the asymptotic limit f = 3/4 is recovered bymixing when t1 = 0, t2 = 1, or t1 = 1, t2 = 0.
23

For Example 2 in Fig. 5 and also Fig. 7,
Q1 =14
1 0 11 0 00 0 1
, Q2 =14
1 0 01 1 00 1 0
(C.2)
with t1 = t2 = 1/2. The maximum growth rate occurs at an intermediate value of T before approaching itsminimum as T → ∞.
For Example 3, appearing in Fig. 5, has phases
Q1 =
[
0.51 0.490.49 0.51
] [
1.95 00 0.05
]
, (C.3)
Q2 =
[
0.95 0.050.05 0.95
] [
1.9 00 0.1
]
, (C.4)
Q3 =
[ 23
13
13
23
] [
0.05 00 1.95
]
, (C.5)
with phase fractions t1 = 1/6, t2 = 1/3, and t3 = 1/2. In this example, the asymptotic growth rate has alocal minimum near T = 4, but the global minimum appears to occur in the limit of small period T, whent1 = 0.49, t2 = 0, and t3 = 0.51.
Example 4, appearing in Fig. 8, has phases
Q1 =
−1.0286 0.0067 0.0916 0 00.0141 −0.2820 0 0.0285 0.1764
0 0.0169 −0.4551 0 0.13260.0187 0 0.0363 −0.0476 0.15810.0167 0 0 0.0558 2.0608
, (C.6)
Q2 =
−0.7692 0.2367 0 0 0.06930.1944 0.6765 0.1024 0 0
0 0 0.0230 0.0180 00 0.2279 0.1890 −0.9240 00 0 0.0796 0 0.8763
, (C.7)
Q3 =
−0.4988 0.0081 0.3172 0 0.00530 0.0088 0.0964 0.1788 0.00650 0.0217 1.6094 0.1209 0
0.0258 0 0.1180 1.2440 00.0074 0.0066 0 0 −2.2760
. (C.8)
Assuming phases occur in the given order, the globally optimal management strategy in this exampleappears to be a cycling strategy with phase periods t1 ≈ 0.67, t2 ≈ 1.15, t3 ≈ 0.69. The optimal mixingstrategy has approximately the same phase fractions as the globally optimal strategy.
24