simple and rapid spectrophotometric determination of propranolol
TRANSCRIPT
RESEARCH ARTICLE
Simple and Rapid Spectrophotometric Determination of Propranolol
Hydrochloride as Base Form in Pharmaceutical Formulation through
Charge Transfer Complexation
Chemical Sciences
Journal, Vol. 2012:
CSJ-71
http://astonjournals.com/csj
1 Chemical Sciences Journal, Vol. 2012: CSJ-71
Simple and Rapid Spectrophotometric Determination of Propranolol Hydrochloride as Base Form in Pharmaceutical Formulation through
Charge Transfer Complexation
KN Prashanth, K Basavaiah* Department of Chemistry, University of Mysore, Manasagangotri, Mysore, India.
*Correspondence to: Kanakapura Basavaiah, [email protected]
Accepted: Sep 14, 2012; Published: Sep 30, 2012
Abstract Two simple and selective spectrophotometric methods are described for the determination of propranolol hydrochloride (PPH) as base form (PPL) in bulk drug, and in tablets and capsules. The methods are based on the molecular charge-transfer complexation of propranolol base (PPL) with either 2,4,6-trinitrophenol (picric acid; PA) or 2,4-dinitrophenol (DNP). The yellow colored radical anions formed on dissociation, are quantitated at 425 nm (PA method) or 415 nm (DNP method). The assay conditions were optimized. Beer's law is obeyed in the concentration ranges 2.4-42.0 µg ml-1 in PA method and 9.0-126.0 µg ml-
1in DNP method, with respective molar absorptivity values of 4.97 × 10
3 and 1.66 × 10
3 l mol
-1 cm
-1. The reaction stoichiometry
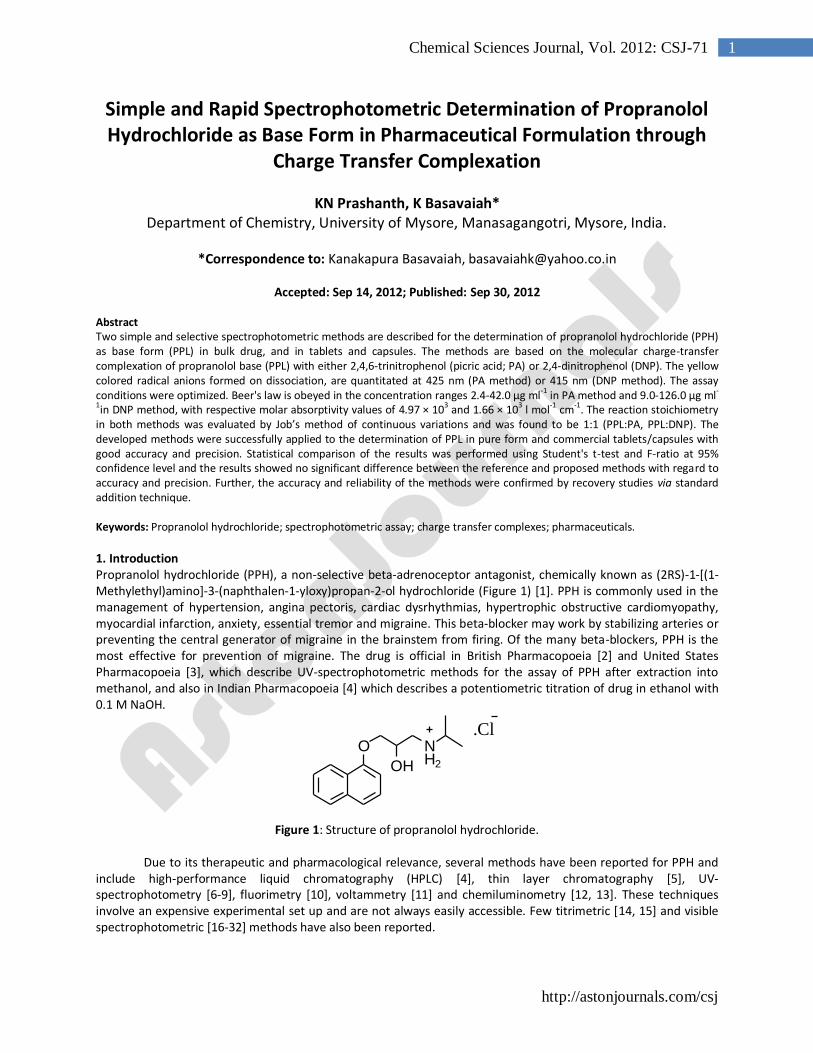
in both methods was evaluated by Job’s method of continuous variations and was found to be 1:1 (PPL:PA, PPL:DNP). The developed methods were successfully applied to the determination of PPL in pure form and commercial tablets/capsules with good accuracy and precision. Statistical comparison of the results was performed using Student's t-test and F-ratio at 95% confidence level and the results showed no significant difference between the reference and proposed methods with regard to accuracy and precision. Further, the accuracy and reliability of the methods were confirmed by recovery studies via standard addition technique. Keywords: Propranolol hydrochloride; spectrophotometric assay; charge transfer complexes; pharmaceuticals. 1. Introduction Propranolol hydrochloride (PPH), a non-selective beta-adrenoceptor antagonist, chemically known as (2RS)-1-[(1-Methylethyl)amino]-3-(naphthalen-1-yloxy)propan-2-ol hydrochloride (Figure 1) [1]. PPH is commonly used in the management of hypertension, angina pectoris, cardiac dysrhythmias, hypertrophic obstructive cardiomyopathy, myocardial infarction, anxiety, essential tremor and migraine. This beta-blocker may work by stabilizing arteries or preventing the central generator of migraine in the brainstem from firing. Of the many beta-blockers, PPH is the most effective for prevention of migraine. The drug is official in British Pharmacopoeia [2] and United States Pharmacopoeia [3], which describe UV-spectrophotometric methods for the assay of PPH after extraction into methanol, and also in Indian Pharmacopoeia [4] which describes a potentiometric titration of drug in ethanol with 0.1 M NaOH.
O NH2OH
.Cl
Figure 1: Structure of propranolol hydrochloride.
Due to its therapeutic and pharmacological relevance, several methods have been reported for PPH and include high-performance liquid chromatography (HPLC) [4], thin layer chromatography [5], UV-spectrophotometry [6-9], fluorimetry [10], voltammetry [11] and chemiluminometry [12, 13]. These techniques involve an expensive experimental set up and are not always easily accessible. Few titrimetric [14, 15] and visible spectrophotometric [16-32] methods have also been reported.
http://astonjournals.com/csj
2 Research Article
Visible spectrophotometry, because of its simplicity and cost-effectiveness, sensitivity and selectivity and fair accuracy and precision is routinely used in many industrial quality control laboratories. Several visible spectrophotometric methods based on different reaction schemes are found in the literature for PPH.
Idowu et al. [16] reported a method for the assay of PPH using diazotized 4-amino-3,5-dinitrobenzoic acid (ADBA) as the chromogenic derivatizing reagent. Bhandari et al. [17] reported a method based on the reaction of PPH with 1-chloro-2,4-dinitrobenzene, forming a complex, which absorb maximally at 314.6 nm. In a method reported by Golcuet al. [18], PPH was reacted with copper (II) or cobalt (II) and the colored complexes were measured at 548 or 614 nm. El-Rieset al. [19] proposed two spectrophotometric methods based on the charge-transfer complex reaction of PPH with π-acceptors, tetracyanoethylene (TCNE), or chloranilic acid (CLA) to give highly colored complex species which are quantitated spectrophotometrically at 415 or 510 nm. Salem [20] used similar reactions for the spectrophotometric determination of PPH which are based on the reaction of PPH as n-electron donor with the sigma-acceptor iodine and π-acceptors such as 7,7,8,8-tetracyaniquinodimethane, 2,3-dichloro-5,6-dicyano-1,4-benzoquinone, tetracyanoethylene, bromanil and chloranil. The resulting CT complexes were measured at 365, 840, 420, 470, 450 and 440 nm, respectively. Hussain et al. [21] reported a method based on the redox reaction of PPH with cerium (IV) in H2SO4 medium on heating and the developed color was measured at 478 nm. El-Emam et al. [22] reported a method based on oxidative-coupling reaction in which a mixture of an acidic solution of MBTH and PPH was treated with cerium (IV) and the resulting orange color peaking at 496 nm was measured.
In addition to direct methods described above, several indirect methods based on a variety of reaction chemistries are also found in the literature. A spectrophotometric method proposed by Basavaiah et al. [23] makes use of the reaction between chloride of PPH and mercury(II) thiocyanate in which thiocyanate ions displaced complexed with iron(III) for subsequent measurement at 460 nm. In a spectrophotometric method reported by Basavaiah et al. [24], the unreacted cerium(IV) sulphate was treated with iron(II) and the iron(III) was complexed with thiocyanate and measured at 480 nm. Similar method reported by Basavaiah et al. [25] is based on the oxidation of PPH by a known excess of CAT in acid medium followed by determination of the unreacted oxidant by reacting with metal and sulphanilic acid. The same authors reported another spectrophotometric method in which the unreacted oxidant metavanadate was determined by reacting with diphenylamine, and the absorbance measured at 560 nm [26]. A method reported by Basavaiah et al. [27] involves the addition of a known excess of bromate-bromide mixture to an acidified solution of the drug and determination of the unreacted bromine by its bleaching action on methyl orange acid color and the absorbance measured at 510 nm. El-Didamony [28] reported three methods based on oxidation-bromination reaction of PPH by bromine, generated in situ by the action of acid on a bromate-bromide mixture, followed by determination of unreacted bromine by three different reaction schemes. In one method the residual bromine was determined by indigo carmine dye. In the other two methods, the residual bromine was determined by treating with a known excess of iron(II) and the resulting iron(III) was complexed with thiocyanate or the residual iron(II) with 1,10-phenanthroline. Gowda et al. [29] reported two procedures, similar to the above, in which PPH was oxidized by a known excess of NBS in H2SO4 medium followed by the reaction of unreacted oxidant with promethazine hydrochloride (PH) or methdilazine hydrochloride (MDH) to yield red colored products with absorption maximum at 515 or 513 nm. Two methods described by Al-Attas et al. [30] based on the oxidation of PPH by a known excess of N-bromosuccinimide (NBS), in an acidic medium followed by the reaction of excess oxidant with amaranth dye. Sastry et al. [31] devised one more method by treating PPH with a known excess of NBS in HCl medium, and after 10 min, the unreacted oxidant was determined by reacting with celestine blue and measuring the absorbance at 540 nm.
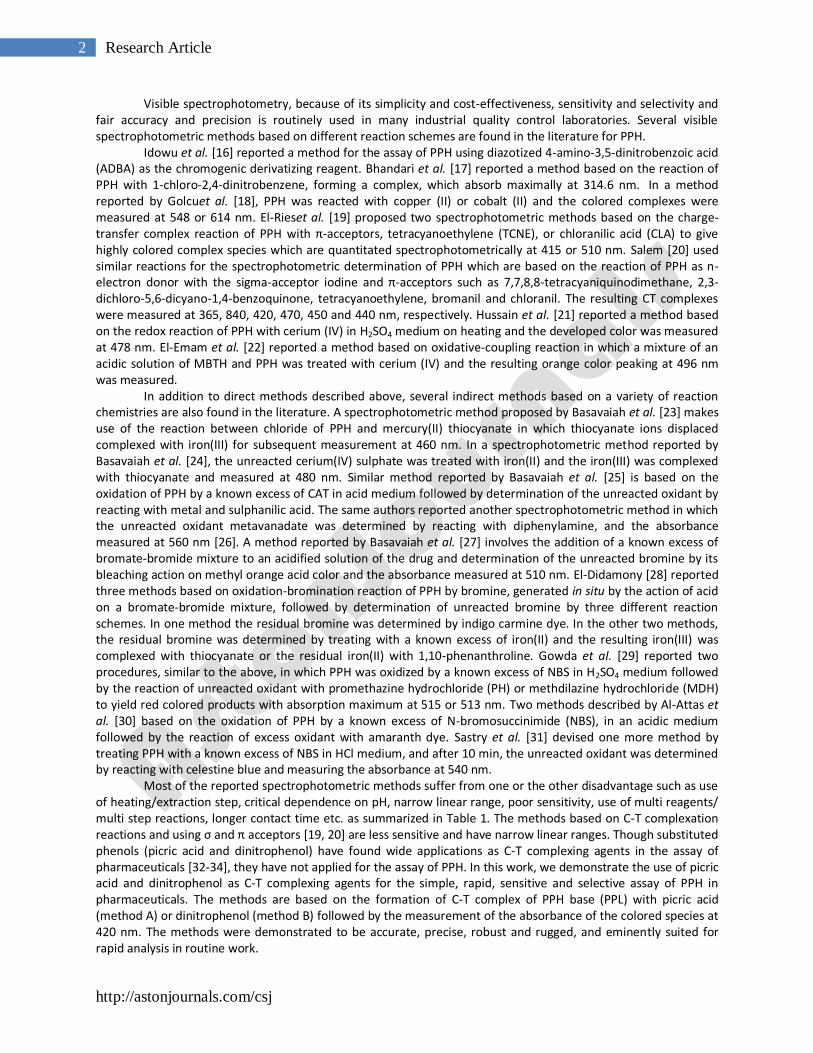
Most of the reported spectrophotometric methods suffer from one or the other disadvantage such as use of heating/extraction step, critical dependence on pH, narrow linear range, poor sensitivity, use of multi reagents/ multi step reactions, longer contact time etc. as summarized in Table 1. The methods based on C-T complexation reactions and using σ and π acceptors [19, 20] are less sensitive and have narrow linear ranges. Though substituted phenols (picric acid and dinitrophenol) have found wide applications as C-T complexing agents in the assay of pharmaceuticals [32-34], they have not applied for the assay of PPH. In this work, we demonstrate the use of picric acid and dinitrophenol as C-T complexing agents for the simple, rapid, sensitive and selective assay of PPH in pharmaceuticals. The methods are based on the formation of C-T complex of PPH base (PPL) with picric acid (method A) or dinitrophenol (method B) followed by the measurement of the absorbance of the colored species at 420 nm. The methods were demonstrated to be accurate, precise, robust and rugged, and eminently suited for rapid analysis in routine work.
http://astonjournals.com/csj
3 Chemical Sciences Journal, Vol. 2012: CSJ-71
Table 1: Comparison of the proposed and the existing visible spectrophotometric methods.
2. Methods 2.1 Instrument A Systronics model 106 digital spectrophotometer (Systronics, Ahmedabad, Gujarat, India) provided with 1 cm matched quartz cells was used for all absorbance measurements.
Reagent/s λmax nm
Beer’s law range, µg ml
-1
(ε in l mol-1
cm-1
)
Remarks Ref.
4-amino-3,5-dinitrobenzoic acid
470 1.0-8.0 Heating required 16
1-chloro-2,4-dinitrobenzene
314.6 - - 17
Copper(II) or Cobalt(II) 548/614 2x10⁻⁵-1×10⁻² M - 18
Tetracyanoethylene, chloranilic acid
415 510
- Use of large quantity of organic solvents 19
σ and π-acceptors
-
4-120
Use large quantity of organic solvents; less sensitive
20
Cerium(IV) 478 15-350 Involves boiling for 25 min; less sensitive 21
Cerium(IV)-MBTH 496 1-10 Uses an expensive chemical 22
Mercury(II) thiocyanate-iron(III)
460 10-50 (2.63×10³)
- 23
Cerium (IV)-iron (II) sulphate-thiacyanate.
480 0.0-5.0
(3.6×10⁴) Multi-step reaction 24
Chloramine-T-metol and sulphanilic acid.
520 0.0-3.0
(7.1×10³) Less sensitive, multi-step reaction,
critical pH 25
Sodium metavanadate-diphenylamine.
560 0.0-4.0 (5.33×10⁴)
Multi-step reaction 26
Bromate-bromide-methyl orange
510 0.5-3.5
(6.66×10⁴) Multi-step reaction 27
Bromate-bromide a)Indigo carmine
b)Fe(III)+thiocyanate c)Fe(III)+1,10-
phenanthroline
610 480 510
1.0-13.0 4.0-12.0 2.0-9.0
Multi-step reaction 28
a)NBS-PH
b)NBS-MDH
515
513
0.5-12.5 (1.36x10⁴) 0.3-16.0
(2.55x10⁴)
Multi-step reaction
29
a)N-bromosuccinimide- amaranth
0.2-6.4 Multi-step reaction 30
NBS-Celestine blue 540 0.4-3.0 Multi-step reaction 31
a) PA
b) DNP
415
425
2.4-42.0 (4.97×10
3)
9.0-126.0
(1.66×10³)
Simple, rapid, sensitive, selective and use a single reagent. Single step reaction and no heating/extraction step involved.
Proposed methods
http://astonjournals.com/csj
4 Research Article
2.2 Materials Pharmaceutical grade PPH certified to be 99.80% pure was received from Cipla India Ltd., Mumbai, India. The following pharmaceutical preparations were purchased from commercial sources in the local market and subjected to analysis: Monoprolol-20 (20 mg PPH per tablet) from Cosmo Life Sciences Ltd., India; Ciplar – 40(40 mg PPH per tablet) from Cipla India Ltd., India and Betacap-40 (40 mg PPH per capsule) from Sun Pharma Ltd., India. 2.3 Reagents and chemicals All reagents used were of analytical reagent grade and HPLC grade organic solvents were used throughout the investigation. Solutions of 0.1% each of picric acid (S.D. Fine Chem., Mumbai, India) and dinitrophenol (S.D. Fine Chem., Mumbai, India) in dichloromethane were prepared separately. A stock standard solution containing 180 µg ml-1 PPL was prepared as follows: pure propranolol hydrochloride (20.5 mg) dissolved in 20 ml water in a 125 ml separating funnel, 5 ml of liquid ammonia was added followed by 20 ml of dichloromethane. The content was shaken for 15 minutes. The lower organic layer was collected in a beaker containing anhydrous sodium sulphate. The water-free organic layer was transferred into a 100 ml calibrated flask and diluted to the volume with the same solvent to get 180 µg ml-1with respect to PPL (hydrochloride free propranolol). This solution was used as such in method B and diluted appropriately with dichloromethane to get working concentrations of 60 µg ml-1 for use in method A. Recommended procedures 2.3.1 Method A (using picric acid, PA) Different aliquots (0.2–3.5ml) of a standard PPL solution (60 µg ml-1) were transferred into a series of 5 ml calibrated flasks using a micro burette and the total volume was adjusted to 3.5 ml with dichloromethane. To each flask was added 1 ml of 0.1 % PA solution and after 5 min made up to mark with the same solvent. The absorbance of the resulting yellow colored chromogen was measured against the reagent blank at 420 nm. 2.3.2 Method B (using dinitrophenol, DNP) Into a series of 5 ml calibrated flasks, 0.2–3.5 ml of 180 µg ml-1of standard PPL solution were added using a micro burette and the total volume was made up to 3.5ml with dichloromethane. To each flask was added 1 ml of 0.1 % DNP solution and the volumes were made up to the mark with the same solvent after 5 min. The absorbance of the resulting yellow colored product was measured against the reagent blank at 420 nm. In either case, the calibration graph was obtained for the absorbance vs concentration of PPL and the concentration of the unknown was read from the calibration or computed from the regression equation. 2.3.3 Procedure for formulations Ten tablets or content of ten capsules were weighed accurately and ground into a fine powder. A portion of the powder equivalent to 20.5 mg of PPH was accurately weighed and transferred into 125 ml separating funnel. The procedure of conversion of PPH to PPL base was followed as done for pure PPH. The resulting solution of 180 µg ml
-1 PPL was used as such (method B) or diluted to get working concentration 60 µg ml
-1 PPL (method A), and
suitable aliquots were analyzed following the procedures described above. 2.3.4 Procedure for the analysis of placebo blank and synthetic mixture A placebo blank of the composition: talc (100 mg), starch (50 mg), acacia (50 mg), methyl cellulose (100 mg), sodium citrate (50 mg), magnesium stearate (100 mg), and sodium alginate (50 mg) was prepared and 40 mg was extracted with dichloromethane and solution was made as described under preparation of standard drug. A convenient aliquot of solution was subjected to analysis by both the methods following the recommended procedures. To the 20 mg of the placebo blank described above, 20.5 mg of PPH was added and homogenized. The solution of the synthetic mixture equivalent to 180 μg ml
- 1 of PPL was prepared as described under procedure for
formulations. The resulting solution was assayed (n = 5) by the proposed methods after appropriate dilution in method A.
http://astonjournals.com/csj
5 Chemical Sciences Journal, Vol. 2012: CSJ-71
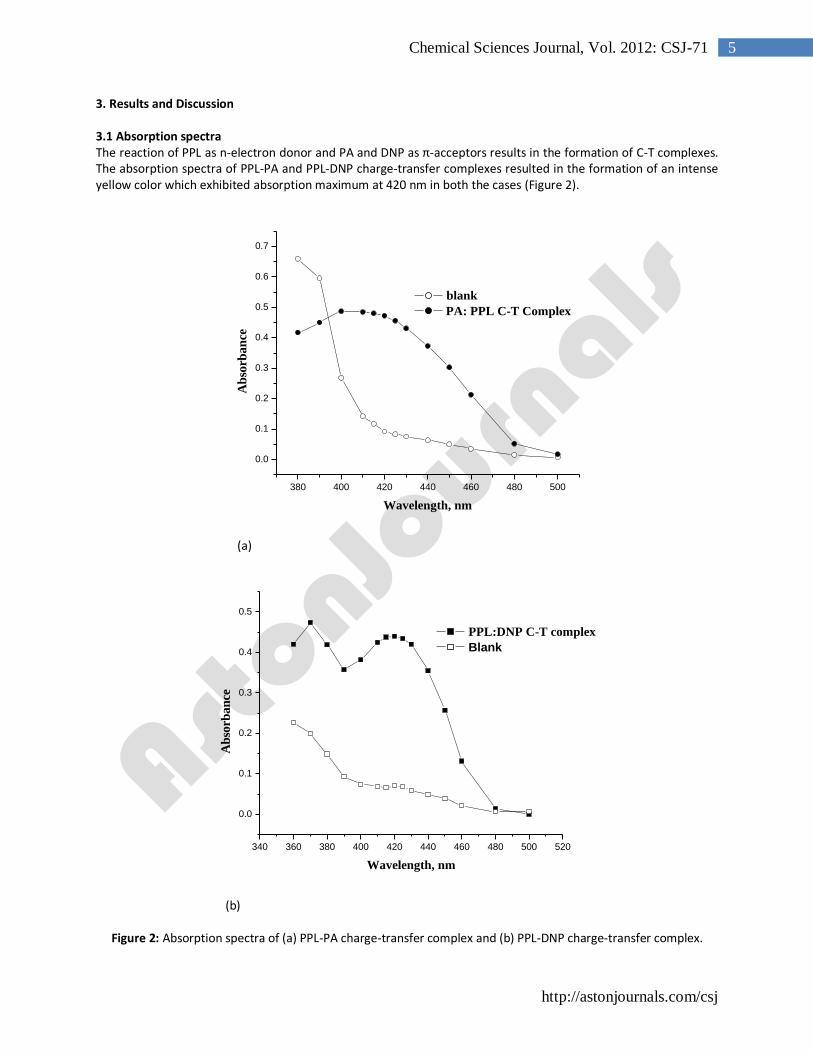
3. Results and Discussion 3.1 Absorption spectra The reaction of PPL as n-electron donor and PA and DNP as π-acceptors results in the formation of C-T complexes. The absorption spectra of PPL-PA and PPL-DNP charge-transfer complexes resulted in the formation of an intense yellow color which exhibited absorption maximum at 420 nm in both the cases (Figure 2).
(a)
(b)
Figure 2: Absorption spectra of (a) PPL-PA charge-transfer complex and (b) PPL-DNP charge-transfer complex.
380 400 420 440 460 480 500
0.0
0.1
0.2
0.3
0.4
0.5
0.6
0.7A
bso
rban
ce
Wavelength, nm
blank
PA: PPL C-T Complex
340 360 380 400 420 440 460 480 500 520
0.0
0.1
0.2
0.3
0.4
0.5
Ab
sorb
an
ce
Wavelength, nm
PPL:DNP C-T complex
Blank
http://astonjournals.com/csj
6 Research Article
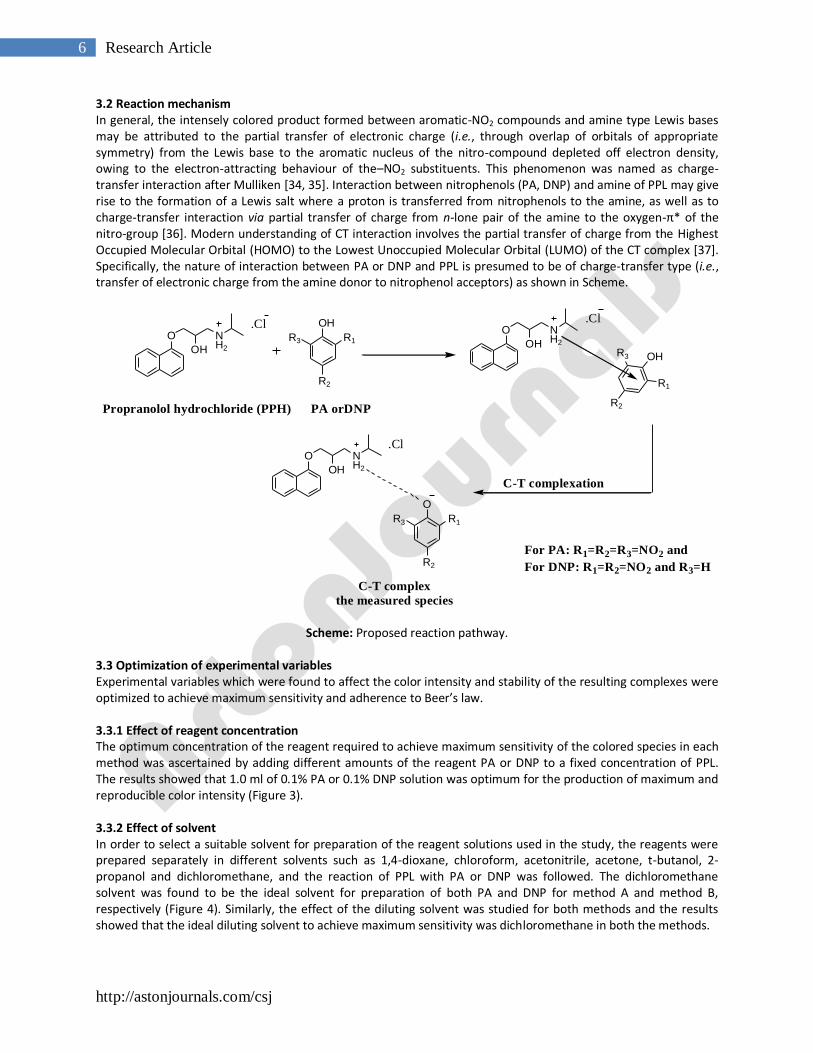
3.2 Reaction mechanism In general, the intensely colored product formed between aromatic-NO2 compounds and amine type Lewis bases may be attributed to the partial transfer of electronic charge (i.e., through overlap of orbitals of appropriate symmetry) from the Lewis base to the aromatic nucleus of the nitro-compound depleted off electron density, owing to the electron-attracting behaviour of the–NO2 substituents. This phenomenon was named as charge-transfer interaction after Mulliken [34, 35]. Interaction between nitrophenols (PA, DNP) and amine of PPL may give rise to the formation of a Lewis salt where a proton is transferred from nitrophenols to the amine, as well as to charge-transfer interaction via partial transfer of charge from n-lone pair of the amine to the oxygen-π* of the nitro-group [36]. Modern understanding of CT interaction involves the partial transfer of charge from the Highest Occupied Molecular Orbital (HOMO) to the Lowest Unoccupied Molecular Orbital (LUMO) of the CT complex [37]. Specifically, the nature of interaction between PA or DNP and PPL is presumed to be of charge-transfer type (i.e., transfer of electronic charge from the amine donor to nitrophenol acceptors) as shown in Scheme.
PA orDNP
O NH2OH
.ClO N
H2OH
.Cl
Propranolol hydrochloride (PPH)
R3 R1
R2
OH
R3
R1
R2
OH
C-T complexation
O NH2OH
.Cl
R3 R1
R2
O
C-T complex
the measured species
For PA: R1=R2=R3=NO2 and
For DNP: R1=R2=NO2 and R3=H
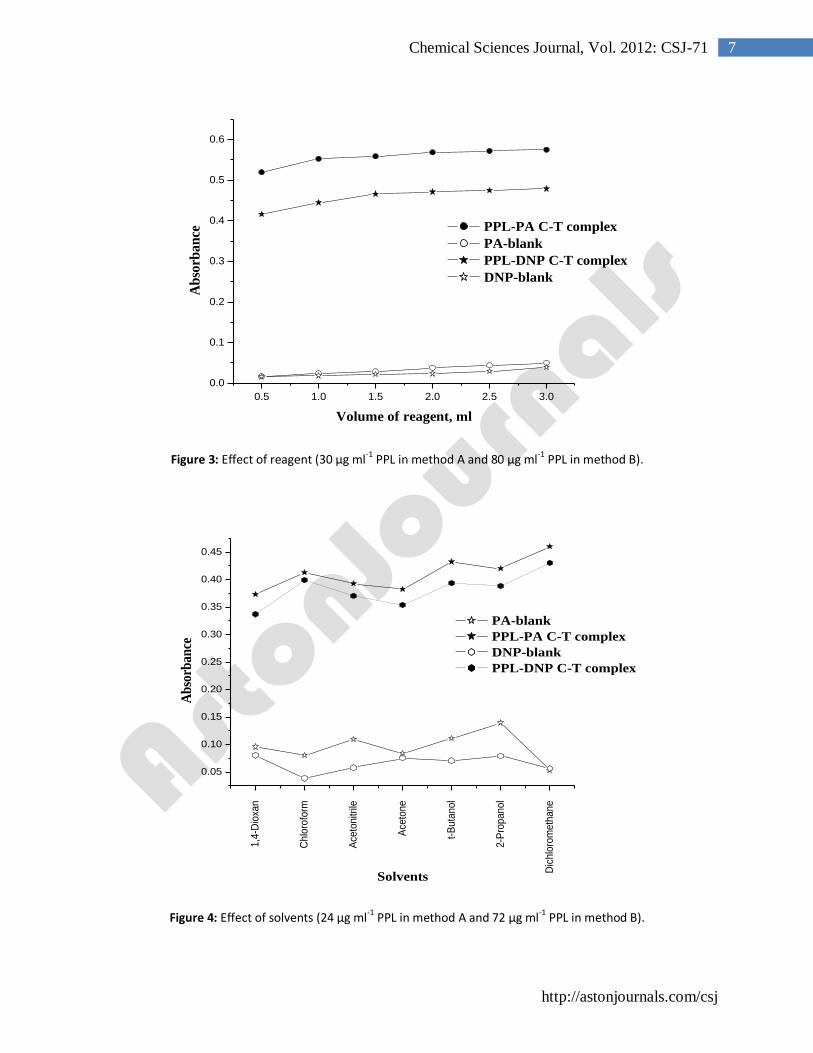
Scheme: Proposed reaction pathway. 3.3 Optimization of experimental variables Experimental variables which were found to affect the color intensity and stability of the resulting complexes were optimized to achieve maximum sensitivity and adherence to Beer’s law. 3.3.1 Effect of reagent concentration The optimum concentration of the reagent required to achieve maximum sensitivity of the colored species in each method was ascertained by adding different amounts of the reagent PA or DNP to a fixed concentration of PPL. The results showed that 1.0 ml of 0.1% PA or 0.1% DNP solution was optimum for the production of maximum and reproducible color intensity (Figure 3). 3.3.2 Effect of solvent In order to select a suitable solvent for preparation of the reagent solutions used in the study, the reagents were prepared separately in different solvents such as 1,4-dioxane, chloroform, acetonitrile, acetone, t-butanol, 2-propanol and dichloromethane, and the reaction of PPL with PA or DNP was followed. The dichloromethane solvent was found to be the ideal solvent for preparation of both PA and DNP for method A and method B, respectively (Figure 4). Similarly, the effect of the diluting solvent was studied for both methods and the results showed that the ideal diluting solvent to achieve maximum sensitivity was dichloromethane in both the methods.
http://astonjournals.com/csj
7 Chemical Sciences Journal, Vol. 2012: CSJ-71
Figure 3: Effect of reagent (30 µg ml-1 PPL in method A and 80 µg ml-1 PPL in method B).
Figure 4: Effect of solvents (24 µg ml
-1 PPL in method A and 72 µg ml
-1 PPL in method B).
0.5 1.0 1.5 2.0 2.5 3.0
0.0
0.1
0.2
0.3
0.4
0.5
0.6
PPL-PA C-T complex
PA-blank
PPL-DNP C-T complex
DNP-blank
Ab
sorb
an
ce
Volume of reagent, ml
1,4
-Dio
xan
Ch
loro
form
Ace
tonitr
ile
Ace
tone
t-B
uta
nol
2-P
ropanol
Dic
hlo
rom
eth
ane
0.05
0.10
0.15
0.20
0.25
0.30
0.35
0.40
0.45
Ab
sorb
ance
Solvents
PA-blank
PPL-PA C-T complex
DNP-blank
PPL-DNP C-T complex
http://astonjournals.com/csj
8 Research Article
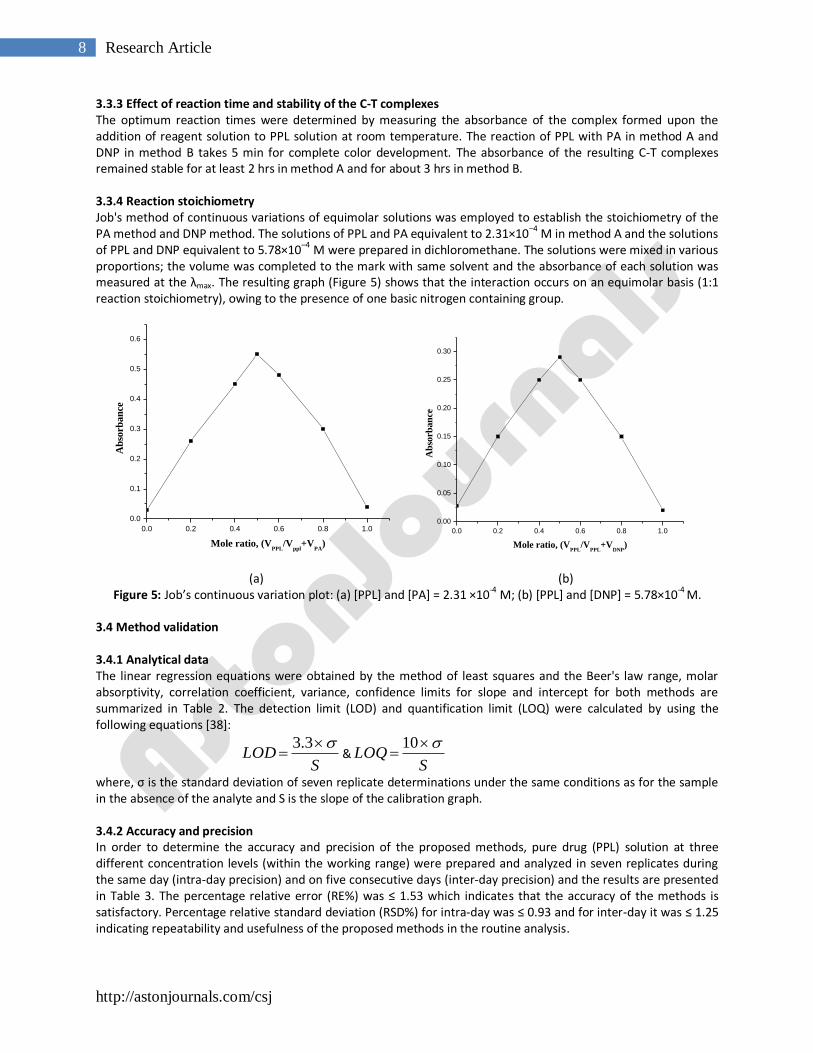
3.3.3 Effect of reaction time and stability of the C-T complexes The optimum reaction times were determined by measuring the absorbance of the complex formed upon the addition of reagent solution to PPL solution at room temperature. The reaction of PPL with PA in method A and DNP in method B takes 5 min for complete color development. The absorbance of the resulting C-T complexes remained stable for at least 2 hrs in method A and for about 3 hrs in method B. 3.3.4 Reaction stoichiometry Job's method of continuous variations of equimolar solutions was employed to establish the stoichiometry of the PA method and DNP method. The solutions of PPL and PA equivalent to 2.31×10
–4 M in method A and the solutions
of PPL and DNP equivalent to 5.78×10⁻⁴
M were prepared in dichloromethane. The solutions were mixed in various proportions; the volume was completed to the mark with same solvent and the absorbance of each solution was measured at the λmax. The resulting graph (Figure 5) shows that the interaction occurs on an equimolar basis (1:1 reaction stoichiometry), owing to the presence of one basic nitrogen containing group.
(a) (b)
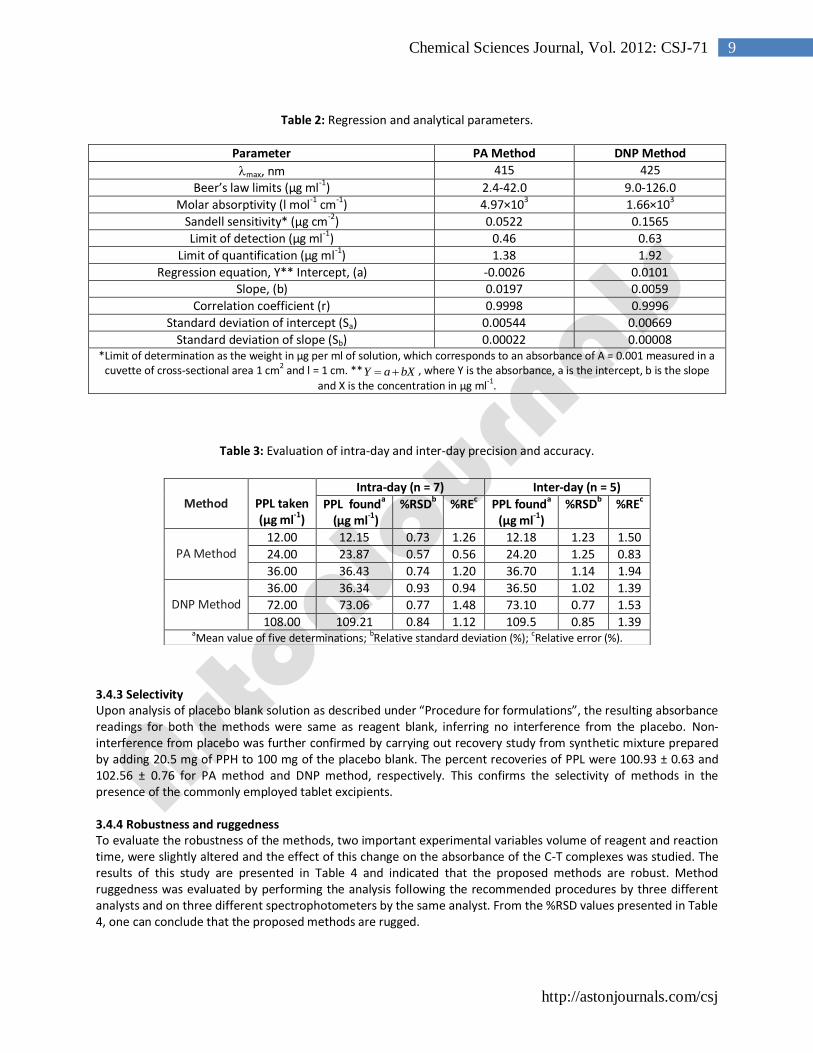
Figure 5: Job’s continuous variation plot: (a) [PPL] and [PA] = 2.31 ×10⁻⁴ M; (b) [PPL] and [DNP] = 5.78×10⁻⁴ M. 3.4 Method validation 3.4.1 Analytical data The linear regression equations were obtained by the method of least squares and the Beer's law range, molar absorptivity, correlation coefficient, variance, confidence limits for slope and intercept for both methods are summarized in Table 2. The detection limit (LOD) and quantification limit (LOQ) were calculated by using the following equations [38]:
SLOD
3.3&
SLOQ
10
where, σ is the standard deviation of seven replicate determinations under the same conditions as for the sample in the absence of the analyte and S is the slope of the calibration graph. 3.4.2 Accuracy and precision In order to determine the accuracy and precision of the proposed methods, pure drug (PPL) solution at three different concentration levels (within the working range) were prepared and analyzed in seven replicates during the same day (intra-day precision) and on five consecutive days (inter-day precision) and the results are presented in Table 3. The percentage relative error (RE%) was ≤ 1.53 which indicates that the accuracy of the methods is satisfactory. Percentage relative standard deviation (RSD%) for intra-day was ≤ 0.93 and for inter-day it was ≤ 1.25 indicating repeatability and usefulness of the proposed methods in the routine analysis.
0.0 0.2 0.4 0.6 0.8 1.0
0.0
0.1
0.2
0.3
0.4
0.5
0.6
Ab
sorb
an
ce
Mole ratio, (VPPL
/Vppl
+VPA
)
0.0 0.2 0.4 0.6 0.8 1.0
0.00
0.05
0.10
0.15
0.20
0.25
0.30
Ab
sorb
an
ce
Mole ratio, (VPPL
/VPPL
+VDNP
)
http://astonjournals.com/csj
9 Chemical Sciences Journal, Vol. 2012: CSJ-71
Table 2: Regression and analytical parameters.
Parameter PA Method DNP Method
max, nm 415 425
Beer’s law limits (µg ml-1
) 2.4-42.0 9.0-126.0
Molar absorptivity (l mol-1 cm-1) 4.97×10³ 1.66×10³
Sandell sensitivity* (µg cm-2) 0.0522 0.1565
Limit of detection (µg ml-1) 0.46 0.63
Limit of quantification (µg ml-1) 1.38 1.92
Regression equation, Y** Intercept, (a) -0.0026 0.0101 Slope, (b) 0.0197 0.0059
Correlation coefficient (r) 0.9998 0.9996
Standard deviation of intercept (Sa) 0.00544 0.00669
Standard deviation of slope (Sb) 0.00022 0.00008 *Limit of determination as the weight in µg per ml of solution, which corresponds to an absorbance of A = 0.001 measured in a
cuvette of cross-sectional area 1 cm2 and l = 1 cm. ** bXaY , where Y is the absorbance, a is the intercept, b is the slope
and X is the concentration in µg ml-1.
Table 3: Evaluation of intra-day and inter-day precision and accuracy.
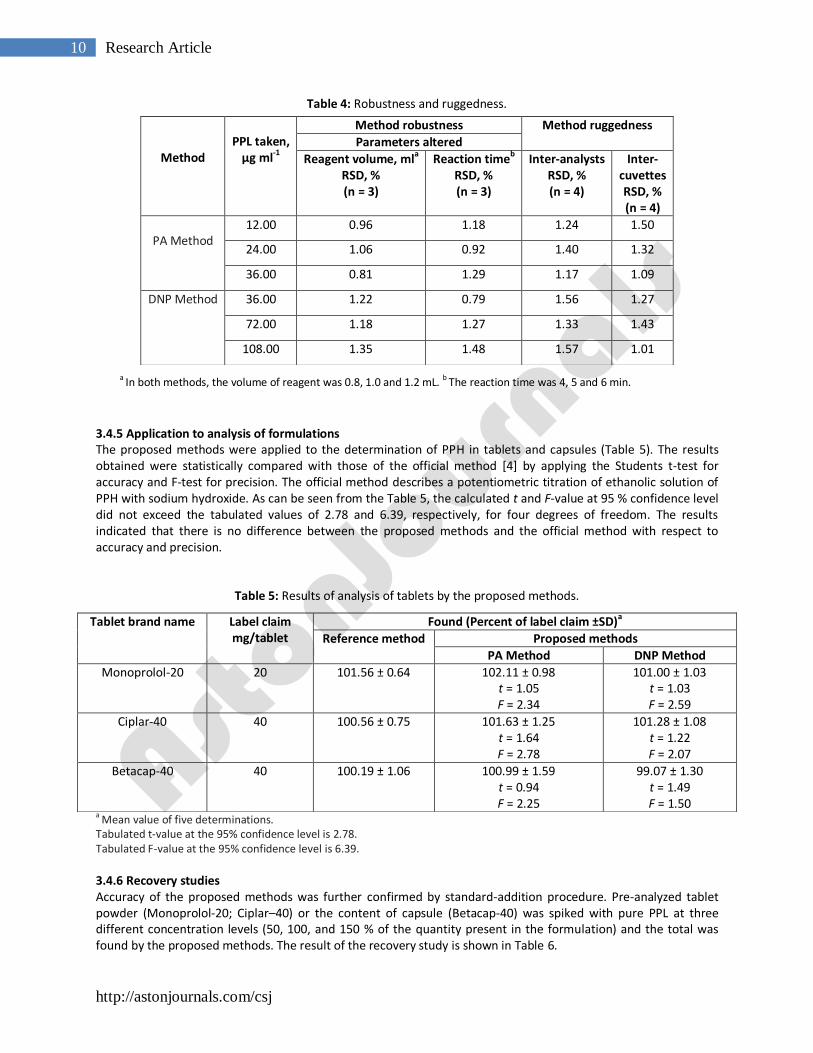
3.4.3 Selectivity Upon analysis of placebo blank solution as described under “Procedure for formulations”, the resulting absorbance readings for both the methods were same as reagent blank, inferring no interference from the placebo. Non-interference from placebo was further confirmed by carrying out recovery study from synthetic mixture prepared by adding 20.5 mg of PPH to 100 mg of the placebo blank. The percent recoveries of PPL were 100.93 ± 0.63 and 102.56 ± 0.76 for PA method and DNP method, respectively. This confirms the selectivity of methods in the presence of the commonly employed tablet excipients. 3.4.4 Robustness and ruggedness To evaluate the robustness of the methods, two important experimental variables volume of reagent and reaction time, were slightly altered and the effect of this change on the absorbance of the C-T complexes was studied. The results of this study are presented in Table 4 and indicated that the proposed methods are robust. Method ruggedness was evaluated by performing the analysis following the recommended procedures by three different analysts and on three different spectrophotometers by the same analyst. From the %RSD values presented in Table 4, one can conclude that the proposed methods are rugged.
Method
PPL taken (µg ml-1)
Intra-day (n = 7) Inter-day (n = 5)
PPL founda
(µg ml-1) %RSDb %REc PPL founda
(µg ml-1) %RSDb
%REc
PA Method
12.00 12.15 0.73 1.26 12.18 1.23 1.50
24.00 23.87 0.57 0.56 24.20 1.25 0.83
36.00 36.43 0.74 1.20 36.70 1.14 1.94
DNP Method
36.00 36.34 0.93 0.94 36.50 1.02 1.39
72.00 73.06 0.77 1.48 73.10 0.77 1.53
108.00 109.21 0.84 1.12 109.5 0.85 1.39 aMean value of five determinations; bRelative standard deviation (%); cRelative error (%).
http://astonjournals.com/csj
10 Research Article
Table 4: Robustness and ruggedness.
a In both methods, the volume of reagent was 0.8, 1.0 and 1.2 mL. b The reaction time was 4, 5 and 6 min.
3.4.5 Application to analysis of formulations The proposed methods were applied to the determination of PPH in tablets and capsules (Table 5). The results obtained were statistically compared with those of the official method [4] by applying the Students t-test for accuracy and F-test for precision. The official method describes a potentiometric titration of ethanolic solution of PPH with sodium hydroxide. As can be seen from the Table 5, the calculated t and F-value at 95 % confidence level did not exceed the tabulated values of 2.78 and 6.39, respectively, for four degrees of freedom. The results indicated that there is no difference between the proposed methods and the official method with respect to accuracy and precision.
Table 5: Results of analysis of tablets by the proposed methods.
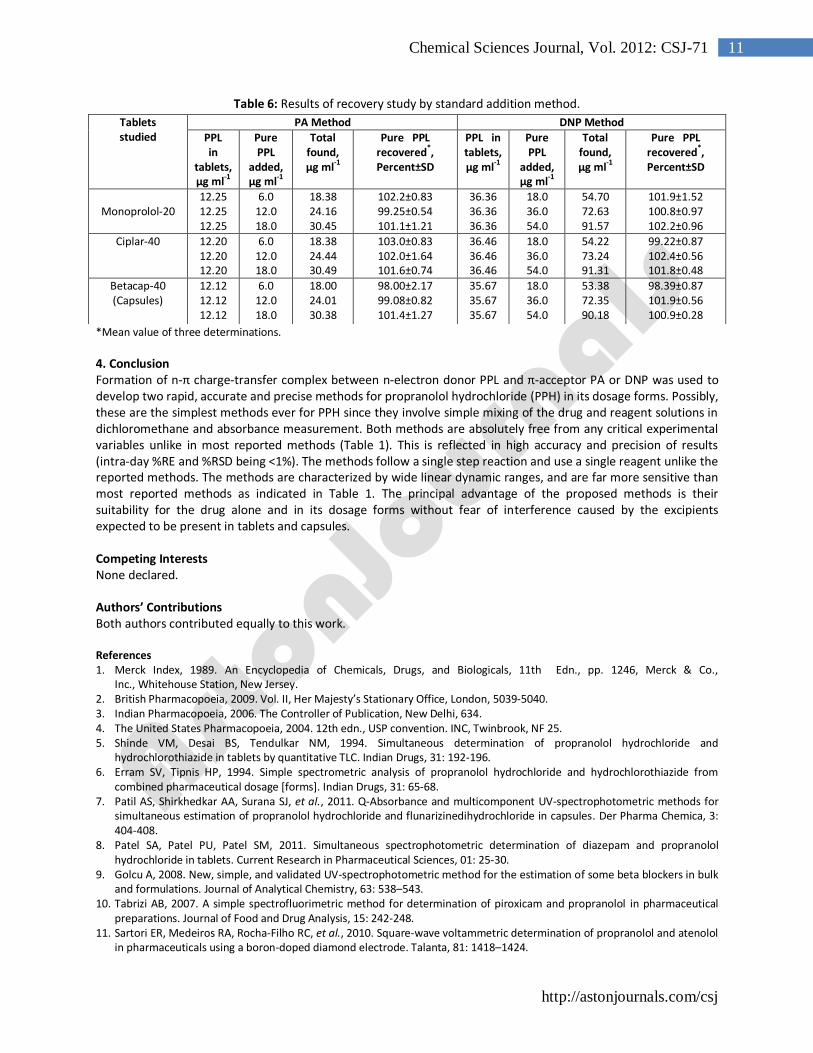
a Mean value of five determinations. Tabulated t-value at the 95% confidence level is 2.78. Tabulated F-value at the 95% confidence level is 6.39. 3.4.6 Recovery studies Accuracy of the proposed methods was further confirmed by standard-addition procedure. Pre-analyzed tablet powder (Monoprolol-20; Ciplar–40) or the content of capsule (Betacap-40) was spiked with pure PPL at three different concentration levels (50, 100, and 150 % of the quantity present in the formulation) and the total was found by the proposed methods. The result of the recovery study is shown in Table 6.
Method
PPL taken,
µg ml-1
Method robustness Method ruggedness
Parameters altered
Reagent volume, mla
RSD, % (n = 3)
Reaction timeb
RSD, % (n = 3)
Inter-analysts RSD, % (n = 4)
Inter- cuvettes RSD, % (n = 4)
PA Method
12.00 0.96 1.18 1.24 1.50
24.00 1.06 0.92 1.40 1.32
36.00 0.81 1.29 1.17 1.09
DNP Method 36.00 1.22 0.79 1.56 1.27
72.00 1.18 1.27 1.33 1.43
108.00 1.35 1.48 1.57 1.01
Tablet brand name Label claim mg/tablet
Found (Percent of label claim ±SD)a
Reference method Proposed methods
PA Method DNP Method
Monoprolol-20 20
101.56 ± 0.64 102.11 ± 0.98 t = 1.05 F = 2.34
101.00 ± 1.03 t = 1.03 F = 2.59
Ciplar-40 40
100.56 ± 0.75 101.63 ± 1.25 t = 1.64 F = 2.78
101.28 ± 1.08 t = 1.22 F = 2.07
Betacap-40 40
100.19 ± 1.06 100.99 ± 1.59 t = 0.94 F = 2.25
99.07 ± 1.30 t = 1.49 F = 1.50
http://astonjournals.com/csj
11 Chemical Sciences Journal, Vol. 2012: CSJ-71
Table 6: Results of recovery study by standard addition method.
*Mean value of three determinations.
4. Conclusion Formation of n-π charge-transfer complex between n-electron donor PPL and π-acceptor PA or DNP was used to develop two rapid, accurate and precise methods for propranolol hydrochloride (PPH) in its dosage forms. Possibly, these are the simplest methods ever for PPH since they involve simple mixing of the drug and reagent solutions in dichloromethane and absorbance measurement. Both methods are absolutely free from any critical experimental variables unlike in most reported methods (Table 1). This is reflected in high accuracy and precision of results (intra-day %RE and %RSD being <1%). The methods follow a single step reaction and use a single reagent unlike the reported methods. The methods are characterized by wide linear dynamic ranges, and are far more sensitive than most reported methods as indicated in Table 1. The principal advantage of the proposed methods is their suitability for the drug alone and in its dosage forms without fear of interference caused by the excipients expected to be present in tablets and capsules. Competing Interests None declared. Authors’ Contributions Both authors contributed equally to this work. References 1. Merck Index, 1989. An Encyclopedia of Chemicals, Drugs, and Biologicals, 11th Edn., pp. 1246, Merck & Co.,
Inc., Whitehouse Station, New Jersey. 2. British Pharmacopoeia, 2009. Vol. II, Her Majesty’s Stationary Office, London, 5039-5040. 3. Indian Pharmacopoeia, 2006. The Controller of Publication, New Delhi, 634. 4. The United States Pharmacopoeia, 2004. 12th edn., USP convention. INC, Twinbrook, NF 25. 5. Shinde VM, Desai BS, Tendulkar NM, 1994. Simultaneous determination of propranolol hydrochloride and
hydrochlorothiazide in tablets by quantitative TLC. Indian Drugs, 31: 192-196. 6. Erram SV, Tipnis HP, 1994. Simple spectrometric analysis of propranolol hydrochloride and hydrochlorothiazide from
combined pharmaceutical dosage [forms]. Indian Drugs, 31: 65-68. 7. Patil AS, Shirkhedkar AA, Surana SJ, et al., 2011. Q-Absorbance and multicomponent UV-spectrophotometric methods for
simultaneous estimation of propranolol hydrochloride and flunarizinedihydrochloride in capsules. Der Pharma Chemica, 3: 404-408.
8. Patel SA, Patel PU, Patel SM, 2011. Simultaneous spectrophotometric determination of diazepam and propranolol hydrochloride in tablets. Current Research in Pharmaceutical Sciences, 01: 25-30.
9. Golcu A, 2008. New, simple, and validated UV-spectrophotometric method for the estimation of some beta blockers in bulk and formulations. Journal of Analytical Chemistry, 63: 538–543.
10. Tabrizi AB, 2007. A simple spectrofluorimetric method for determination of piroxicam and propranolol in pharmaceutical preparations. Journal of Food and Drug Analysis, 15: 242-248.
11. Sartori ER, Medeiros RA, Rocha-Filho RC, et al., 2010. Square-wave voltammetric determination of propranolol and atenolol in pharmaceuticals using a boron-doped diamond electrode. Talanta, 81: 1418–1424.
Tablets studied
PA Method DNP Method
PPL in
tablets, µg ml-1
Pure PPL
added, µg ml-1
Total found, µg ml
-1
Pure PPL recovered*, Percent±SD
PPL in tablets, µg ml
-1
Pure PPL
added, µg ml-1
Total found, µg ml
-1
Pure PPL recovered*, Percent±SD
Monoprolol-20
12.25 12.25 12.25
6.0 12.0 18.0
18.38 24.16 30.45
102.2±0.83 99.25±0.54 101.1±1.21
36.36 36.36 36.36
18.0 36.0 54.0
54.70 72.63 91.57
101.9±1.52 100.8±0.97 102.2±0.96
Ciplar-40 12.20 12.20 12.20
6.0 12.0 18.0
18.38 24.44 30.49
103.0±0.83 102.0±1.64 101.6±0.74
36.46 36.46 36.46
18.0 36.0 54.0
54.22 73.24 91.31
99.22±0.87 102.4±0.56 101.8±0.48
Betacap-40 (Capsules)
12.12 12.12 12.12
6.0 12.0 18.0
18.00 24.01 30.38
98.00±2.17 99.08±0.82 101.4±1.27
35.67 35.67 35.67
18.0 36.0 54.0
53.38 72.35 90.18
98.39±0.87 101.9±0.56 100.9±0.28
http://astonjournals.com/csj
12 Research Article
12. Marques KL, Santos JLM, Lima JLFC, 2005. Chemiluminometric determination of propranolol in an automated multicommutated flow system. Journal of Pharmaceutical and Biomedical Analysis, 39: 886–891.
13. Qi H, Wang C, Zou R, et al., 2011. Electrogenerated chemiluminescence sensor for the determination of propranolol hydrochloride. Analytical Methods, 3: 446-451.
14. Issa YM, Amin AS, 1995. Conductometric titration of pindolol and propranolol using ammonium reineckate and potassium tetracyanonickelate. Microchimica Acta, 116: 85-91.
15. Idowu OS, Adegoke OA, Olaniyi AA, 2004. Colorimetric assay of propranolol tablets by derivatization: Novel application of diazotized 4-amino-3,5-dinitrobenzoic acid (ADBA). Journal of AOAC International, 87: 573-578.
16. Bhandari A, Kumar B, Patel R, 2008. Spectrophotometric estimation of propranolol in tablet dosage form. Asian Journal of Chemistry, 20: 802-804.
17. Golcu A, Yucesoy C, Sesin S, 2004. Spectrophotometric determination of some beta-blockers in dosage forms based on
complex formation with Cu(II) and Co(II). IL Farmaco, 59: 487-492. 18. El-Ries MA, Abou-Attia FM, Ibrahim SA, 2000. AAS and spectrophotometric determination of propranolol HCl and
metoprolol tartrate. Journal of Pharmaceutical and Biomedical Analysis, 24: 179-187. 19. Salem H, 2001. Spectrophotometric study of the charge transfer complexes of some beta-adrenergic blocking drugs. Journal
of Pharmaceutical Sciences, 28: 319-337. 20. Hussain S, Krishnamurthy ASR, Sekar R, et al., 1995. Ceric(VI) oxidation studies of propranolol and its application to
pharmaceutical preparations. Indian Drugs, 32: 574-577. 21. El-Emam AA, Belal FF, Montsufa MA, et al., 2003. Spectrophotometric determination of propranolol in formulations via
oxidative coupling with 3-methylbenzothiazoline-2-one hydrazone. IL Farmaco, 58: 1179-1186. 22. Basavaiah K, Chandrashekar U, Charan VS, 2003. Application of precipitation and complexation reactions for the analysis of
propranolol hydrochloride. Indian Journal of Pharmaceutical Sciences, 65: 161-166. 23. Basavaiah K, Chandrashekar U, Prameela HC, 2003. Cerimetric determination of propranolol in bulk drug form and in
tablets. Turkish Journal of Chemistry, 27: 591-599. 24. Basavaiah K, Chandrashekar U, Prameela HC, et al., 2004. Titrimetric and spectrophotometric determination of propranolol
hydrochloride using chloramine-T. Indian drugs, 41: 303-305. 25. Basavaiah K, Chandrashekar U, Prameela HC, 2003. Indirect titrimetric and spectrophotometric determination of
propranolol hydrochloride using sodium metavanadate. Bulgarian Chemistry and Industry, 74: 79-84. 26. Basavaiah K, Chandrashekar U, Prameela HC, et al., 2003. Quantitative determination of propranolol with bromate and
methyl orange. Acta Ciencia Indica - Chemistry, XXIX: 25-30. 27. El-Didamony AM, 2010. A sensitive spectrophotometric method for the determination of propranolol HCl based on
oxidation bromination reactions. Drug Testing and Analysis, 2: 122-129. 28. Gowda BG, Seetharamappa J, Melwanki MB, 2002. Indirect spectrophotometric determination of propranolol hydrochloride
and piroxicam in pure and pharmaceutical formulations. Analytical Sciences, 18: 671-674. 29. Al-Attas AS, 2006. Utility of redox reaction for spectrophotometric determination of propranolol and isoxsuprine
hydrochlorides in pure and dosage forms. Asian Journal of Chemistry, 18: 3033-3039. 30. Sastry CSP, Srinivas KR, Krishna Prasad MM, 1996. Spectrophotometric determination of drugs in pharmaceutical
formulations with N-bromosuccinimide and celestine blue. Microchimica Acta, 122: 77. 31. Prashanth KN, Basavaiah K, 2012. Simple, sensitive and selective spectrophotometric methods for the determination of
atenolol in pharmaceuticals through charge transfer complex formation reaction. Acta Poloniae Pharmaceutica - Drug Research, 69: 213-223.
32. Rajendraprasad N, Basavaiah K, Vinay KB, 2011. Optimized and validated spectrophotometric methods for the determination of hydroxyzine hydrochloride in pharmaceuticals and urine using iodine and picric acid. Journal of Serbian Chemical Society, 76: 1551-1560.
33. Onah JO, Ajima U, 2011. Spectrophotometric determination of tenofovirdisoproxilfumarate after complexation with ammonium molybdate and picric acid. International Journal of Drug Development & Research, 3: 199-203.
34. Mulliken RS, 1952. Molecular compounds and their spectra. Journal of American Chemical Society, 74: 811-824. 35. Buncel E, Norris AR, Russell KE, 1968. The interaction of aromatic nitro-compounds with bases. Quarterly Reviews, Chemical
Society, 22: 123-146. 36. M Hasani, M Irandoust, M Shamsipur, 2006. Spectroscopic and conductometric studies of molecular complex formation
between 2,4,6-trinitrophenol and diaza-18-crown-6, tetraaza-14-crown-4 and cryptand C222 in 1,2-dichloroethane solution. Spectrochimica Acta Part A: Molecular and Biomolecular Spectroscopy, 63: 377-382.
37. Ercag E, Uzer A, Apak R, 2009. Selective spectrophotometric determination of TNT using a dicyclohexylamine-based colorimetric sensor. Talanta, 78: 772–780.
38. International Conference on Harmonization of Technical Requirements for Registration of Pharmaceuticals for Human Use, 1996. ICH Harmonized Tripartite Guideline, Validation of Analytical Procedures: Text and Methodology Q2(R 1), Complementary Guideline on Methodology, dated 06 November 1996, incorporated in November 2005, London.