silicon valley competitiveness and innovation project ...svcip.com/files/svcip_2017.pdf · silicon...
TRANSCRIPT

Silicon Valley Competitiveness and Innovation Project - 2017 Report
A Dashboard and Policy Scorecard for a Shared Agenda of Prosperity and Opportunity
svcip.com

About the SVCIP partners
The Silicon Valley Leadership Group, founded in 1978 by David Packard of Hewlett-Packard, represents nearly 400 of Silicon Valley's most respected employers on issues, programs and campaigns that affect the economic health and quality of life in Silicon Valley. The Leadership Group focuses on key issues of importance including energy, transportation, education, housing, health care, taxation, economic vitality and the environment. Leadership Group members collectively provide nearly one of every three private sector jobs in Silicon Valley and have more than $3 trillion in annual revenue.
Silicon Valley Community Foundation advances innovative philanthropic solutions to challenging problems. As the largest community foundation in the world, we engage donors and corporations from Silicon Valley, across the country and around the globe to make our region and world better for all. Our passion for helping people and organizations achieve their philanthropic dreams has created a global philanthropic enterprise committed to the belief that possibilities start here.
Past and Present Advisors
Greg BeckerSilicon Valley Bank Advisory Group Chair
Shellye Archambeau MetricStream
P.K. AgarwalNortheastern University - Silicon Valley
Brian BrennanSilicon Valley Leadership Group
Neil ChaseBay Area News Group
Lisa DowneyMorgan Family Foundation
Rosanne FoustSan Mateo County Economic Development Association
Tom FrielSilicon Valley Community Foundation Board Member
Remy GoldsmithSilicon Valley Community Foundation
Josh Green Mohr Davidow Ventures
Carl GuardinoSilicon Valley Leadership Group
Marci Harris POPVOX
Andrew LeeEsper
Mayor Sam LiccardoCity of San José
Mike Malone Author
Thomas Mohr San Mateo County Community College District
Jonathan NelsonHackers & Founders
Eduardo Rallo Pacific Community Ventures
Brian Simmons San Mateo County Office of Education
Kim WaleshSan José Dept of Economic Development
Erica WoodSilicon Valley Community Foundation
Report Developed and Prepared by
Collaborative Economics (COECON) is a strategic advisory and consulting firm that works with clients to create breakthrough solutions for regions and communities. COECON has extensive experience helping states and regions develop innovation strategies. www.coecon.com
Principal Researchers and AuthorsJohn Melville, CEOJanine Kaiser, Senior ConsultantElizabeth Brown, Senior Consultant
Report design by Audra Keefe, Orange Bike Design
2
3
Dear Friends,
Silicon Valley’s success as the world’s leading innovation region did not occur by accident. Nor will it continue—much less grow—without deliberate and thoughtful actions that promote innovation and opportunities for our employers, employees and our communities. Responding to this challenge, the Silicon Valley Leadership Group and Silicon Valley Community Foundation joined together three years ago to create the Silicon Valley Competitiveness and Innovation Project (SVCIP), a multi-year effort to assess the region’s economic health and advance a shared policy agenda so that our innovation advantage remains strong and all residents can share in our success. The 2017 report shows strong job growth and economic output that exceed those of other innovation regions. Silicon Valley continues to attract people from around the world: 2,000 people move here each month. However, warning signs indicate that our continued success is not a given. Venture capital investments have fallen for the first time in several years. Housing costs and commute times are among the highest in the nation. And gaps in educational achievement persist, resulting in fewer students graduating with the knowledge and skills they need to participate in our innovation economy. As we enter a period of uncertainty with the new federal administration, it is critical that we join together to ensure that our region’s continuing success is not left up to chance. This will require intentional public policy action at the federal, state and local levels. We are proud of several local tax measures approved by voters last November that will bring increased public funding for transportation improvements, affordable housing and other community services to enhance the region’s quality of life. But as this report’s data tell us, there is much more to be done. Now more than ever, we must work together to ensure that Silicon Valley’s economic engine remains strong, recognizing the vital role it plays in driving U.S. growth and competitiveness. We invite you to visit our website at svcip.com for important updates on our data and progress.
Sincerely,
A Letter from the SVCIP Partners
Carl GuardinoPresident and CEOSilicon Valley Leadership Group
Emmett D. Carson, Ph.D.CEO and PresidentSilicon Valley Community Foundation
February 2017

4
Strong and Gaining Ground
Needs attention,
losing ground to other regions
Critical need for attention,
and/or trending
down
Change from SVCIP 2016
INN
OVA
TION
ASS
ETS
Talent
STEM Talent Pool ● Change in Educational Attainment ●
STEM Degrees Conferred ●
International Talent ●
Talent Migration ●
New Entrepreneurs ●
Risk Capitaland R&D
Venture Capital ●
Very Early Stage Funding ● Universities’ R&D Expenditures ●
INN
OVA
TION
PR
OC
ESSE
S
Idea Generation Patents ●
Commercialization Follow-On Investment by Stage ●
Business Innovation
Company Pre-Exit Valuations ●
Initial Public Offerings ●
Mergers and Acquisitions ●
OUT
CO
MES
& P
ROSP
ERITY
Business Competitiveness
Labor Productivity ● Output in Innovation Industries ●
Quality of LifeHome and Rent Values ●
Traffic Congestion ●
Access to Opportunity
Preschool Enrollment ●
3rd Grade English and 8th Grade Math Proficiency ● 11th Grade English and Mathematics Proficiency ●
Jobs Jobs in Innovation Industries ●
SVCIP Indicator Dashboard2017 Report
Some improvement
Remained the same
Conditions worsened
5
About this Report ...................................................................................................................................................................................................2
A Letter from the SVCIP Partners ....................................................................................................................................................................3
SVCIP Indicator Dashboard ................................................................................................................................................................................4
Executive Summary ...............................................................................................................................................................................................6
International Comparisons At A Glance .......................................................................................................................................................8
Innovation Industries Overview .......................................................................................................................................................................9
Innovation Assets: Talent ..................................................................................................................................................................................11
Innovation Assets: Risk Capital and R&D Funding ...............................................................................................................................15
Innovation Processes: Idea Generation and Commercialization ....................................................................................................18
Innovation Processes: Business Innovation ..............................................................................................................................................19
Outcomes and Prosperity: Business Competitiveness .........................................................................................................................21
Outcomes and Prosperity: Quality of Life .................................................................................................................................................22
Outcomes and Prosperity: Access to Opportunity ...............................................................................................................................25
Policy Scorecard ...................................................................................................................................................................................................28
Policy Scorecard Progress ................................................................................................................................................................................29
Appendix .................................................................................................................................................................................................................30
Contents

Executive Summary
In 2015, the Silicon Valley Leadership Group and Silicon Valley Community Foundation joined together to develop the Silicon Valley Competitiveness and Innovation Project (SVCIP) to proactively identify a data-driven, overarching economic strategy to enhance and reinforce the Silicon Valley region’s competitive advantages in innovation, and ensure that Silicon Valley residents have access to the job opportunities and prosperity linked to growth in key industries. Guided by an advisory council and a series of discussions with legislators, business and civic leaders, the SVCIP team developed an Indicator Dashboard and public policy agenda to evaluate and promote the health of Silicon Valley’s innovation ecosystem.
The 2017 Report includes a "check up" on the Indicator Dashboard using the most recent data available from 2015 and 2016 as well as progress on the public policy agenda. It also includes new indicators on entrepreneurship and college readiness of the region's high-school students. Data for each of the indicators is compared to key innovation regions in the U.S., including the New York City metro area, Boston, Southern California, Seattle and Austin, and also to global innovation regions in a few key areas. The Silicon Valley region is defined as Santa Clara, San Mateo and San Francisco counties.
Key findings:
Silicon Valley’s innovation industries continue to set the pace nationally, with 8% growth in 2015. Austin's innovation industry growth was close at 7%, but Silicon Valley's growth was double or more than the rate of other regions including New York City (4%), Boston (3%), Seattle (2%), and Southern California (2%). The Valley also continues to have the highest proportion of workers in innovation industries (26%) among U.S. innovation regions.
Innovation industries continue to drive the Silicon Valley economy. The cumulative output (gross domestic product) of the region’s software, internet and information services, information and communications technology manufacturing, specialized innovation services, and other innovation-intensive sectors rose almost 150% in the last decade compared to just under 60% for the rest of the Valley’s economy.
Venture capital investment in Silicon Valley is down for the first time since 2012―and substantially so. Coming off its 2015 peak, venture capital investment dropped four out of the five quarters, ending in Q3 2016.
Silicon Valley’s innovation industries created jobs at a faster rate than other U.S. innovation regions.
Output from Silicon Valley's innovation industries doubled since 2010.
Venture capital investment fell 46% between Q3 2015 and Q3 2016.
6svcip.com

Early stage investment grows, while the climate for later stage investment worsens. Very early stage funding (i.e., angel, seed and seed venture capital) was up 22% while Series A investment was down 3% between Q3 2015 and Q3 2016. Only about a quarter of 2014 Silicon Valley start-ups with Series A venture capital investment secured next-stage Series B venture capital funding, compared to 40% of 2012 start-ups. Later stage company median valuation dropped 37%, and IPO valuations dropped more than 70% between 2015 and 2016.
Silicon Valley’s talent advantage remains strong, but there are reasons for concern. The Valley has higher worker productivity, a larger percentage of Science, Technology, Engineering, and Mathematics (STEM) oriented workers in the overall workforce, and the largest share of foreign-born STEM workers compared to other innovation regions. Yet, the Valley is also experiencing a net domestic out-migration, lagging behind the leading innovation regions in STEM degrees conferred per capita, and is producing fewer entrepreneurs. Silicon Valley is leaving large numbers of young people behind, without the skills to participate in the region’s innovation industries. Although Hispanic and Latino students comprised the largest ethnic group of Silicon Valley 11th grade test-takers in 2016 (37%), 80% did not meet state standards in mathematics and about half failed to do so in English language arts.
Silicon Valley’s housing and traffic situation is worsening compared to other innovation regions. Last year among innovation regions, only Seattle's housing and rental prices grew faster than Silicon Valley's. Commute times have lengthened by more than 15% since 2010, compared to 5-11% in other innovation regions.
While Silicon Valley’s innovation industries and foreign talent base remain strong by any measure, the region’s ability to sustain its post-recession growth may be eroding. Venture capital investment is off by about 50% from a year ago, along with drops in later-stage funding and valuations. Talented people worldwide still come to Silicon Valley, but rising housing costs, longer commute times, and growing opportunities in other innovation regions are drawing more residents away. Too many of the region’s youth are leaving high school without the math and English skills to enter opportunities for STEM-based higher education and careers, and the number of STEM graduates per capita is lower than some innovation regions. These trends, along with major changes on the national scene, create a level of uncertainty for Silicon Valley that is arguably the highest since the recession. In light of past contributions the region has made to U.S. economic recovery and growth, it is a national imperative that Silicon Valley remains a leader in the Innovation Economy.
It is even more important during a period of growing uncertainty that stakeholders within Silicon Valley work together. SVCIP has identified a number of public policy areas critical to the region’s continuing success, including STEM education and high-quality Pre-K education, R&D, high-skill immigration, housing and transportation, and business regulation. As the Policy Scorecard at the end of this report shows, there were successes both locally and on the state level to improve education, housing, and transportation in 2016—with much more work to do. The years ahead will require continuing attention to the Valley’s innovation assets if the region is to navigate successfully through uncertain times.
Executive Summary - Key Findings
Later stage investments, company valuation and Initial Public Offerings (IPOs) dropped between 2015 and 2016.
Already high housing and rental costs continue to rise at rates that are close to or above those of other innovation regions.
More than half (53%) of Silicon Valley’s 11th grade students failed to meet state standards in mathematics and a third (33%) failed to meet standards in English Language Arts.
Silicon Valley’s concentration of STEM workers was three times the national average, twice that of Boston, and more than one and a half times that of Austin and Seattle.
7 svcip.com

8
International Comparisons At A Glance
The Global Startup Ecosystem Ranking2015GlobalInnovation Region* Ranking Growth Index
Silicon Valley 1 2.1
New York City 2 1.8
Los Angeles 3 1.8
Boston 4 2.7
Tel Aviv 5 2.9
London 6 3.3
Chicago 7 2.8
Seattle 8 2.1
Berlin 9 10
Singapore 10 1.9
Global City-Region Rankings on Selected Innovation IndicatorsWith San José and San Francisco Metropolitan Areas Delineated
Measure San José Metropolitan Area
San Francisco Metropolitan Area
Gross Domestic Product (GDP) per capita, 2015
#1 #4
Gross Domestic Product (GDP) per worker, 2015
#1 #3
University Research Impact, 2010-2013
#1 #2
Patents per capita, 2008-2012
#1 #3
Venture capital per capita, 2006-2015
#1 #2
Higher education attainment, 2015
#4 #6
Internet Speed, Mbps, 2014
#26 #27
*China, Taiwan, Japan, and South Korea are not included in this ranking, based on data availability. Compass estimates that Beijing ranks in the top five innovation regions, and Shanghai ranks in the top 15.
Data Source: Compass. The Global Startup Ecosystem Ranking 2015.
Analysis: Collaborative Economics
Source: Redefining Global Cities, The Brookings Institution, 2016.
Analysis: Collaborative Economics
The Compass’ Global Startup Ecosystem Ranking of 2015 found Silicon Valley to be the world’s leading innovation region based on a composite measure incorporating venture capital investment, start-up company exit valuations, talent pool, and entrepreneurial supports and networks. At the same time, other regions like Berlin, London, Tel Aviv, Chicago, and Boston scored higher on the Compass Report’s Growth Index, meaning they are gaining ground on Silicon Valley in these areas.
The Brookings Institution has released a comprehensive analysis in late 2016 of the 123 largest metropolitan areas in the world. On a variety of indicators, the San José and San Francisco metropolitan areas rank among the top regions in the world. Silicon Valley clearly produces new ideas that others value. It has the largest share of publications in the top 10% of cited papers (University Research Impact, 2010-2013), and generates the most patents per capita. It is the most productive region, and attracts the largest venture capital investment per capita of any metropolitan area in the world. It has among the highest percentage of people with bachelors’ degrees or higher, only exceeded by Singapore, London, and Washington D.C.
Despite being the birthplace of many founding internet technologies, one of the measures on which the region performs poorly is average internet download speed. Silicon Valley is actually well behind several regions across Asia (e.g., Singapore, Tokyo, Osaka, Nagoya, Seoul, Hong Kong), Europe (e.g., Paris, Stockholm, Amsterdam, Barcelona, Copenhagen, Zürich), and the United States (e.g., innovation regions Austin, Seattle, Boston, New York City, and Los Angeles, as well as other US communities including Baltimore, Philadelphia, Kansas City, St. Louis, and Riverside).
svcip.com

9
Innovation Industries Overview
Silicon Valley Growth in OutputInnovation Industries and All Other Industries Silicon Valley, 1995=100
Data Source: Moody’s Analytics, Bureau of Labor StatisticsAnalysis: Collaborative Economics
50
100
150
200
250
300
1995 2015
All Other Silicon Valley Industries +39%
Innovation Industries +147%
Inde
x 19
95=
100
Silicon Valley EmploymentDetailed Innovation Industries and All Other Industries, 2015
Data Source: Bureau of Labor Statistics, Quarterly Census of Employment and WagesAnalysis: Collaborative Economics
InnovationIndustries
26%
All Other Industries
74%
Biotechnology & Pharmaceuticals < 1%Other High-Tech Production & Manufacturing < 1%Medical Devices < 1%Other Media < 1%Aerospace < 1%
ICT Product &Component
Manufacturing7%
Software9%
SpecializedInnovation
Services5% Internet &
InformationServices4%
As in the first two years of this report, Innovation Industries continue to drive Silicon Valley’s growth. Between 1995 and 2015, output in Innovation Industries increased by almost 150%, while output in all other Silicon Valley industries increased by less than 40%. A decade ago output for both sets of industries was rising at a comparable rate. By 2010, Innovation Industry output significantly accelerated and this trend has continued through 2015.
Twenty-six percent of Silicon Valley jobs were in Innovation Industries in 2015, rising from 25% in 2014. Software continues to represent the largest share of innovation industry jobs, followed by ICT (Information and Communications Technology) product and component manufacturing jobs, specialized innovation services jobs and information and internet services jobs.
1 Note that Specialized Innovation Services in this indicator are comprised of management, scientific and technical consulting and development services.
svcip.com

10
Silicon Valley Competitiveness and Innovation Project - 2017 Report svcip.comIn
nova
tion
Indu
strie
s O
verv
iew
Seattle
Austin
New York City
Boston
Silicon Valley
SouthernCalifornia
+8%
479,295
Growth in TotalInnovation Industries
Total Innovation Jobs
+7%
101,685Growth
Total InnovationJobs
+2%
261,612Growth
Total InnovationJobs
+2%
553,876Growth
Total InnovationJobs
+4%
511,574Growth
Total InnovationJobs
+3%
302,871Growth
Total InnovationJobs
Growth in topinnovationindustries,2014-2015
+17%+10%+6%+5%
+25%+11%+8%+4%
+17%+7%+5%+4%
+7%+7%+6%+4%
+22%+4%+3%
+19%+6%+4%
Internet & Information
Software
ICT Product & ComponentManufacturing
Biotech & Pharmaceutical
Other High-Tech Production& Manufacturing
Medical Devices
Specialized Innovation Svcs
Other Media
Aerospace
Growth, 2014-2015
Employment Growth in Top Innovation Industries2014-2015
Data Source: Bureau of Labor Statistics, Quarterly Census of Employment and Wages Analysis: Collaborative Economics
Employment in Innovation Industries by RegionPer 10,000 Workers in Overall EconomyInnovation Regions, 2015
Data Source: Bureau of Labor Statistics, Quarterly Census of Employment and Wages Analysis: Collaborative Economics
New YorkCity
SouthernCalifornia
Austin Boston Seattle SiliconValley
Num
ber o
f In
nova
tion
Indu
strie
s Em
ploy
ees
per 1
0,00
0 To
tal E
mpl
oyee
s in
the
Regi
on
0
500
1000
1500
2000
2500
3000
Other High-Tech Production/ManufacturingOther MediaMedical DevicesBiotechnology & PharmaceuticalsInternet & Information ServicesAerospaceICT Product & Component ManufacturingSpecialized Innovation ServicesSoftware
Among innovation regions, Silicon Valley has the highest proportion of workers in Innovation Industries. Moreover, the Valley’s share of workers in Innovation Industries is growing faster than that of other innovation regions, rising eight percent between 2014 and 2015. Most innovation regions grew at less than half the rate of Silicon Valley in 2015. Also in 2015, Silicon Valley surpassed Austin’s Innovation Industry growth rate for the first time in several years.
While Software is still the largest of Silicon Valley’s Innovation Industries, Internet and Information Services jobs grew at a faster rate in 2015 (17%) than that of Software (10%).

11
Silicon Valley has an overall large number of STEM workers compared to other innovation regions. In 2015, the region had 336,820 STEM workers, behind much bigger population centers such as New York City (463,780) and Southern California (412,780), but well ahead of Boston (226,570), Seattle (196,480), and Austin (93,600).
Silicon Valley also has a much higher concentration of STEM talent than other innovation regions—that is, the proportion of STEM workers in the overall workforce relative to the national average. The Valley is almost three times more concentrated in STEM workers than the nation as a whole, nearly twice as concentrated as the Boston region, and over one and one half times more concentrated than both Seattle and Austin. Concentration is an indicator of specialization and comparative advantage important to regional economic competitiveness.
Between 2005 and 2015, the region’s concentration of STEM talent grew 22%, increasing the size of the available labor force for employers. Of the comparison regions, only Seattle’s concentration increased at a faster rate. Austin’s pool grew at half the rate of the Valley. And, strikingly, Boston, Southern California, and the New York City region all lost ground, as their concentration of STEM workers actually declined relative to that of the U.S.
STEM Talent Pool for Innovation Industries Concentration*, Change in Concentration 2005-2015, and Employment
3.5
3.0
2.5
2.0
1.5
1.0
0.5
0.0
Change in Employment Concentration (2005 - 2015)
2015
Em
ploy
men
t Con
cent
ratio
n (1
.0 is
sam
e as
U.S
.)
S. California
Boston
New YorkCity
SiliconValley
SeattleAustin
-15% -5% 5% 15% 25% 35% 45% 55% 65%
*Concentration is calculated as (Regional STEM Emp/Regional Total Emp)/(National STEM Emp/National Total Emp)**Size of bubble reflects the number of High-Tech STEM Employees in 2015Data Source: Bureau of Labor StatisticsAnalysis: Collaborative Economics
Science, Technology, Engineering, and Math (STEM) talent is a key competitive asset in innovation regions as STEM skills are critical in researching, developing, improving, and scaling innovative technologies, business and processes.
Innovation Assets: Talent
svcip.com
12
Silicon Valley Competitiveness and Innovation Project - 2017 Report svcip.com
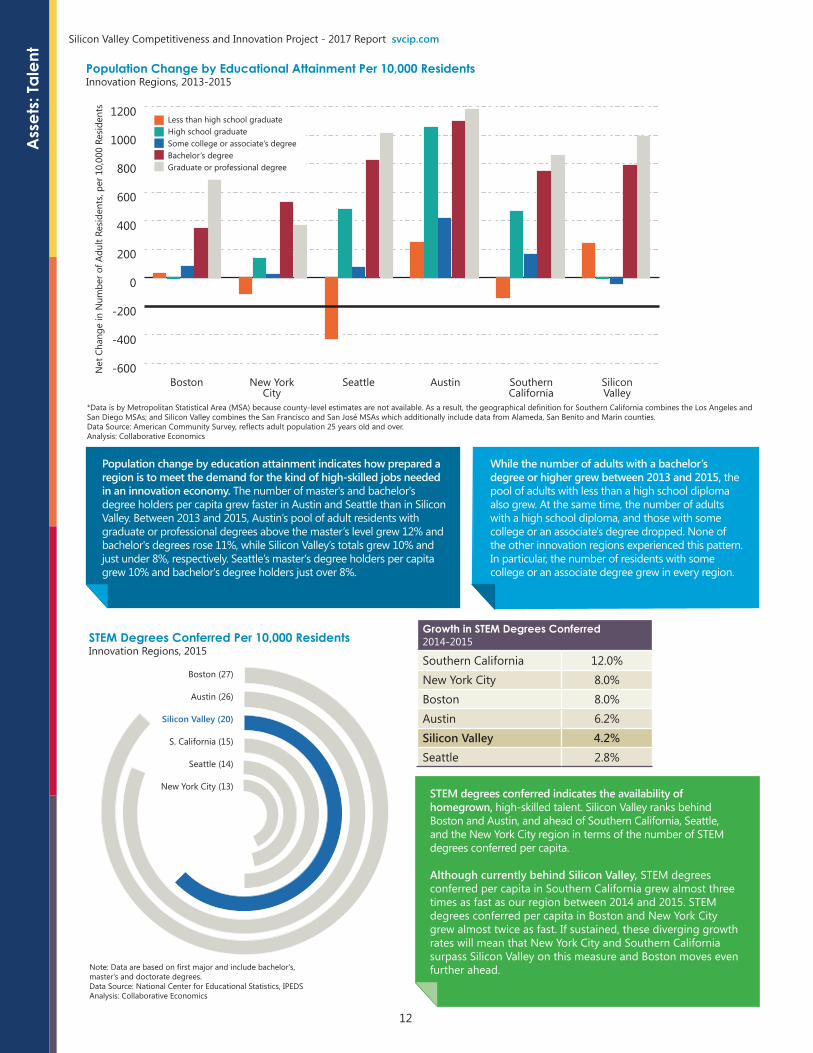
STEM degrees conferred indicates the availability of homegrown, high-skilled talent. Silicon Valley ranks behind Boston and Austin, and ahead of Southern California, Seattle, and the New York City region in terms of the number of STEM degrees conferred per capita.
Although currently behind Silicon Valley, STEM degrees conferred per capita in Southern California grew almost three times as fast as our region between 2014 and 2015. STEM degrees conferred per capita in Boston and New York City grew almost twice as fast. If sustained, these diverging growth rates will mean that New York City and Southern California surpass Silicon Valley on this measure and Boston moves even further ahead.
Population change by education attainment indicates how prepared a region is to meet the demand for the kind of high-skilled jobs needed in an innovation economy. The number of master's and bachelor's degree holders per capita grew faster in Austin and Seattle than in Silicon Valley. Between 2013 and 2015, Austin’s pool of adult residents with graduate or professional degrees above the master’s level grew 12% and bachelor's degrees rose 11%, while Silicon Valley’s totals grew 10% and just under 8%, respectively. Seattle’s master's degree holders per capita grew 10% and bachelor's degree holders just over 8%.
While the number of adults with a bachelor’s degree or higher grew between 2013 and 2015, the pool of adults with less than a high school diploma also grew. At the same time, the number of adults with a high school diploma, and those with some college or an associate's degree dropped. None of the other innovation regions experienced this pattern. In particular, the number of residents with some college or an associate degree grew in every region.
Population Change by Educational Attainment Per 10,000 ResidentsInnovation Regions, 2013-2015
-600
-400
-200
0
200
400
600
800
1000
1200
New YorkCity
Boston SouthernCalifornia
Seattle SiliconValley
Austin
Net
Cha
nge
in N
umbe
r of A
dult
Resi
dent
s, pe
r 10,
000
Resi
dent
s
Less than high school graduateHigh school graduateSome college or associate’s degreeBachelor’s degreeGraduate or professional degree
*Data is by Metropolitan Statistical Area (MSA) because county-level estimates are not available. As a result, the geographical definition for Southern California combines the Los Angeles and San Diego MSAs; and Silicon Valley combines the San Francisco and San José MSAs which additionally include data from Alameda, San Benito and Marin counties.Data Source: American Community Survey, reflects adult population 25 years old and over. Analysis: Collaborative Economics
Boston (27)
Austin (26)
Silicon Valley (20)
S. California (15)
Seattle (14)
New York City (13)
STEM Degrees Conferred Per 10,000 ResidentsInnovation Regions, 2015
Growth in STEM Degrees Conferred2014-2015
Southern California 12.0%New York City 8.0%Boston 8.0%Austin 6.2%Silicon Valley 4.2%Seattle 2.8%
Note: Data are based on first major and include bachelor's, master's and doctorate degrees. Data Source: National Center for Educational Statistics, IPEDSAnalysis: Collaborative Economics
Ass
ets:
Tale
nt

13
Silicon Valley Competitiveness and Innovation Project - 2017 Report svcip.com Assets: Talent
By a substantial margin, Austin and Seattle led other innovation regions in the growth of new residents per month from in-migration. Most of Austin’s increase came from domestic migration (82%), while Seattle’s growth was more balanced between domestic (42%) and foreign migration (58%).
Net foreign migration exceeded net domestic migration in all innovation regions except Austin.
Silicon Valley also had a substantial increase per month due to net in-migration, with foreign in-migration vastly outpacing domestic out-migration. While an average of 832 individuals left Silicon Valley for the rest of the United States every month in 2015, Boston (1,205), Southern California (6,712), and New York City (13,051) all experienced much larger domestic out-migration per month. Each of these regions balanced those losses with larger gains in foreign in-migration.
Seattle
Austin
New York City
Boston
Silicon Valley
SouthernCalifornia
+1,962
+806
+3,125
+3,393
+1,597
Average changein residentsper month
+1,318+1,806
+2,773+620
-1,205+2,802
-13,051+13,143
-832+2,793
-6,712+7,518
Averagechange inresidents
per month
From within U.S.
From abroad
Average change in residents
92
Migration FlowsAverage Net New Residents Per Month Innovation Regions, 2015
Data Source: U.S. Census Bureau Population Estimates Analysis: Collaborative Economics
Except for Seattle, Silicon Valley relies much more on STEM workers who were born either in another country or state other than California (82%) compared to other innovation regions (ranging from 69% to 72%). Over half of Silicon Valley’s STEM workers (57%) with a bachelor’s degree or above are foreign-born, which is by far the highest among the innovation regions. Only 18% of Silicon Valley’s STEM workers were born in-state, the lowest among innovation regions.
International TalentForeign and U.S. Born Share of Population in STEM Professions, with a Bachelor’s Degree or Higher, 2015
Foreign Born Share
In-State Born Share
Out-Of-State Domestic Born
Share
Silicon Valley 57% 18% 25%New York City 43% 29% 28%Boston 33% 30% 37%Southern California 42% 31% 27%Austin 29% 28% 43%Seattle 36% 19% 45%
Data Source: U.S. Census Bureau, PUMSAnalysis: Collaborative Economics

14
Silicon Valley Competitiveness and Innovation Project - 2017 Report svcip.comA
sset
s: Ta
lent
Share of New Entrepreneurs Who are FemaleInnovation Regions, 2013-1015
2013 2014 2015
Seattle 46% 47% 51%Silicon Valley 46% 45% 42%NYC 44% 40% 41%Austin 40% 40% 39%U.S. Average 39% 39% 39%Boston 32% 34% 36%Southern California 35% 33% 33%
Data Source: Fairlie, Robert W. Kauffman Index of Entrepreneurial Activity Current Population SurveyAnalysis: Collaborative Economics
Data Source: Fairlie, Robert W. Kauffman Index of Entrepreneurial Activity, Current Population SurveyAnalysis: Collaborative Economics
Average Monthly Growth in New Entrepreneurs Per 100,000 PopulationInnovation Regions, 2006-2015
0
100
200
300
400
500
600
700
New York City, 393
Boston, 337
Silicon Valley, 411
Seattle, 344
Austin, 602
S. California, 459
Rate
of N
ew E
ntre
pren
eurs
per
Mon
th p
er 1
00,0
00
2006 2007 2008 2009 2010 2011 2012 2013 2014 2015
Growth in new entrepreneurs is a proxy for how desirable Silicon Valley is for business. It also indicates the flow of new business ideas to a region. While Silicon Valley’s average number of new entrepreneurs grew between 2006 and 2013, it declined most recently over the 2013-2015 period. In contrast, Austin’s production of new entrepreneurs increased: by 2015 that region was adding a monthly average of 602 new entrepreneurs per 100,000 population compared to Silicon Valley’s 411.
One measure for examining inclusion and equity in an innovation region is to look at how populations traditionally under-represented in innovation are succeeding, in this instance, women entrepreneurs. In Silicon Valley, the share of new women entrepreneurs is second highest among the innovation regions, behind only Seattle. However, between 2013-2015, Silicon Valley experienced the biggest drop in the share of new female entrepreneurship among the innovation regions, from 46% to 42%.
Silicon Valley, along with Seattle and New York City are above the national average in the share of new women entrepreneurs. The national average of 39% remained the same between 2013 and 2015, while Seattle and Boston added to their shares of new female entrepreneurs. New York City, Austin, and Southern California all lost ground.
Silicon Valley’s production of new entrepreneurs has dropped back to its 2010 level, while Austin, Seattle, and Boston are all well above their 2010 levels. Both Southern California and New York City are below their 2010 levels, but Southern California’s production of new entrepreneurs per 100,000 population remains higher than that of Silicon Valley.

15
Silicon Valley venture capital investment in 2016 is well behind 2015 levels. While Silicon Valley is still the leader in venture capital investment, the gap has closed considerably with other regions.
Between Q3 2015 and Q3 2016, total venture capital investment in Silicon Valley companies fell 46 percent. Moreover, venture capital funding levels have now dropped four out of the last five quarters up to Q3 2016. The number of venture capital investments in Silicon Valley declined too, but by a much smaller 4.6% between Q3 2015 and Q3 2016. Except for New York City (+4.8%), other innovation region experienced drops in venture capital investments ranging from 12-19%.
Total Venture Capital Investment - AnnualInnovation Regions, 2004-2016*
Total Venture Capital Investment - QuarterlySilicon Valley and Innovation Regions, Q1 2012 - Q3 2016
0
$5
$10
$15
$20
$25
2004 2005 2006 2007 2008 2009 2010 2011 2012 2013 2014 2015 2016
New York City
S. CaliforniaBoston
SeattleAustin
Tota
l VC
Fund
ing
in b
illio
ns o
f Dol
lars
(Inf
latio
n ad
just
ed)
Silicon Valley
0
$2
$4
$6
$8
$10
Q1 Q2 Q3 Q4 Q1 Q2 Q3 Q4 Q1 Q2 Q3 Q4 Q4Q1 Q2 Q3
BostonNew York CityS. CaliforniaSeattleAustin
Tota
l VC
Fund
ing
in b
illio
ns o
f Dol
lars
(Inf
latio
n ad
just
ed)
Silicon Valley
2012 2013 2014 2015
Q1 Q2 Q3
2016
*Data through November 14, 2016Data Source: CB InsightsAnalysis: Collaborative Economics
Venture capital is important for the growth of start-up companies as venture investors tolerate more risk than conventional investors and lending institutions. R&D funding helps to build a pipeline of research for future innovations.
Innovation Assets: Risk Capital and R&D Funding
A key forward-looking indicator of the health of venture capital investment is venture capital fundraising. Despite declines in venture capital investment, venture capital fundraising continues to be well ahead of 2009-2013 levels, closer to pre-recession totals. In fact, fundraising in 2016 is on pace to meet or exceed that of 2015, which recorded the highest total in seven years. While venture capital investment has slowed recently in Silicon Valley and other innovation regions, the amount of venture capital available nationally has grown substantially from just three years ago.
Venture Capital FundraisingUnited States, 2006-Q3 2016
$0
$5
$10
$15
$20
$25
$30
$35
$40
2006 2007 2008 2009 2010 2011 2012 2013 2014 2015 2016*
Billi
ons
of D
olla
rs, I
nfla
tion
Adju
sted
*2016 through September 30, 2016 Data Source: National Venture Capital Association (NVCA) and Thomson Reuters Fundraising ReportAnalysis: Collaborative Economics
svcip.com

16
Silicon Valley Competitiveness and Innovation Project - 2017 Report svcip.com
Venture Capital Investment, Share by IndustrySilicon Valley
*2016 through November 14, 2016 Data Source: CB InsightsAnalysis: Collaborative Economics
Seattle
Austin
New York City
Boston
Silicon Valley
SouthernCalifornia
$3.73Billion
$1.54Billion
$296Million
$1.06Billion
$279Million
$1.29Billion
Total Early StageInvestment,
2016*
+22%-3%
+150%-39%
+23%-39%
-51%+60%
-49%-31%A
A
A
A
A
A
+9%-24%
Percentchange in
investment
Angel/Seed/Seed VC investment
Series A investmentA
Percent change, Q3 2015 - Q3 2016
Very Early Stage FundingAngel/Seed and Series A Investments, 2016*Innovation Regions
*2016 Data through November 14, 2016 Data Source: CB InsightsAnalysis: Collaborative Economics
Ass
ets:
Risk
Cap
ital a
nd R
&D F
undi
ng
In contrast to the decline in total venture capital investment, very early stage investments (including angel, seed and seed venture capital) increased in Silicon Valley, as the region outpaced Boston, Seattle, and New York City, was on par with Austin, and trailed only Southern California in percentage growth between Q3 2015 and Q3 2016. Series A investment was down substantially in most innovation regions, with the exception of Boston (which was up substantially) and Silicon Valley (which was down a small percentage compared to other regions).
0%
10%
20%
30%
2010 2011 2012 2013 2014 2015 2016
40%
50%
60%
70%
80%
90%
100%
Shar
e of
Ven
ture
Cap
ital F
undi
ng
Other InvestmentMedical Devices & Equipment Computer Hardware Software Biotechnology Mobile & Telecommunications Internet
A closer examination of venture capital funding trends reveals that investment in some industries grew and in others declined between Q3 2015 and Q3 2016.
Venture capital investment rose nearly 40% in Biotechnology and 7% in Software between 2015 and mid-November 2016. Venture capital investment in Medical Devices and Equipment and Computer Hardware were also up during this period.
Gains in some industries, however, did not offset steep declines in Silicon Valley’s biggest industry investment areas between 2015 and mid-November 2016: internet (-49%) and mobile/telecommunications (-62%). In 2015, these two sectors accounted for 75% of Silicon Valley’s investments.

17
Silicon Valley Competitiveness and Innovation Project - 2017 Report svcip.com
University R&D expenditures are important to the innovation pipeline because they provide opportunities for risk taking and proving ideas. Nationally, university R&D expenditures rose 17% between 2005 and 2014 (the latest data available and adjusted for inflation), but some regions did much better: New York (+68%), Boston (+34%), and Seattle (+26%).
Silicon Valley, however, did not keep pace with the national average, increasing its university R&D expenditures only 12% during this ten-year period. Our region was tied with Austin (+12%) and only outpaced Southern California (+9%).
Between 2013 and 2014,Silicon Valley’s university R&Dexpenditures grew faster (+1%)than the national average(-1%). New York City’s R&Dexpenditures grew faster(+7%) than Silicon Valley, butspending levels dropped inAustin, Boston, Seattle, and Southern California.
Growth in Academic R&D ExpendituresInnovation Regions, 2005-2014 (Index 2005=100)
90
100
110
120
130
140
150
160
170 New York City +68%
Boston +34%
Austin, Silicon Valley +12%
Seattle* +26%
ALL INSTITUTIONS +17%
S. California +9%
2005 2006 2007 2008 2009 2010 2011 2012 2013 2014
Inde
xed
Gro
wth
in T
otal
R&
D E
xpen
ditu
re (2
005=
100)
, Inf
latio
n Ad
just
ed
*Seattle's index growth path 2005-2010 is proxied by the University of Washington's federal R&D funding growth rate, 2010-2014 indexed growth reverts to Total R&D expenditures within the region.** Silicon Valley includes East Bay universitiesData Source: National Science FoundationAnalysis: Collaborative Economics
Total R&D Expenditures2014
All U.S. Institutions $67.2B
S. California $4.1B
New York City $3.6B
Silicon Valley** $2.9B
Boston $2.8B
Seattle* $1.2B
Austin $629M
Assets: Risk C
apital and R&D Funding

18
Patent filings indicate the number of new ideas generated by region. Compared to all other innovation regions, Silicon Valley has kept if not expanded its large lead during the past decade. Silicon Valley’s inventors filed 8,834 computer, data processing, and information storage patents with the USPTO in 2015. No other innovation region filed more than 3,000 during that year.
While the number of patents registered declined in Silicon Valley for the first time in 2015 since 2007, other innovation regions also experienced similar declines.
Patent FilingsComputers, Data Processing and Information StorageInnovation Regions, 2005-2015
0
2000
4000
6000
8000
10000
2005 2006 2007 2008 2009 2010 2011 2012 2013 2014 2015
Num
ber o
f Pat
ents
File
d, b
y Fi
rst A
utho
r's L
ocat
ion Silicon Valley
Seattle
New York CityS. California
BostonAustin
Data Source: US Patent and Trademark Office Custom Data ExtractsAnalysis: Collaborative Economics
Innovation processes leverage the economy’s assets in talent, capital and R&D to translate ideas into commercial products and services. Idea generation is an early step in that process. Patent filings and commercialization - the development and scaling of technology or services - are other critical elements of the innovation process. The progression of follow on investments into venture-backed startup companies illustrates the ability for early stage companies to grow and scale.
Innovation Processes: Idea Generation and Commercialization
A smaller share of Silicon Valley start-up companies are progressing through investment stages than in the past. About 21 percent of the region’s startups that first received very early stage investment in 2014 (Angel, Seed or Seed VC) successfully secured the next level of investment (Series A) compared to 32 percent in 2012. Similarly, only 24 percent of companies that received Series A investments secured Series B investments in 2014, compared to 40 percent in 2012.
While investment progression has been lagging, more start-ups in 2015 and 2016 are securing very early stage investment (530 and 506 through mid-November 2016, respectively).
Progression of Early Stage Investment* Silicon Valley Based Startups - For Companies that Launched in 2009, 2012 and 2014
*Reflects follow-on venture capital investments into start up companies, which secured their first Seed, Angel or Seed VC investment in 2009, 2012 or 2014Incorporates investment data through November 14, 2016Data Source: CB InsightsAnalysis: Collaborative Economics
2009 2012 2014
Pre-ASeries ASeries BSeries CSeries D+
412472
119
51371914
151
60
23
87
21
2 1
svcip.com

19
0
100
200
2010 2011 2012 2013 2014 2015 2016*
300
400
500
600
New York City
Boston
Silicon Valley
SeattleAustin
S. California
Num
bers
of M
erge
rs a
nd A
cqui
sitio
ns D
eals
Innovation Processes: Business Innovation
Business innovation is an aspect of Innovation Processes and reflects new business models, technologies and services creating value in regions. Startup company valuations and initial public offerings (IPOs) compare the economic value (or potential for value) of business innovation across regions.
Initial Public Offerings continued to decline in 2016, with valuations dropping 71 percent in Silicon Valley between 2015 through mid-November 2016.
While all of the innovation regions experienced declines over this period, there were none as substantial as the decline in Silicon Valley. New York City’s IPO valuations (and number of IPOs) exceeded Silicon Valley’s IPO valuations in 2016 through November ($1.8B, across 16 deals, compared to $1.1B across 11 deals, respectively).
Value of IPOsInnovation Regions, 2010-2016*
Mergers and Acquisitions ActivityInnovation Regions, 2010-2016*
*Data through November 14, 2016Data Source: CB InsightsAnalysis: Collaborative Economics
*Data through November 14, 2016Data Source: CB InsightsAnalysis: Collaborative Economics
0
$2
$4
$6
$8
$10
Silicon Valley New York City Boston S. California AustinSeattle
Billi
ons
of d
olla
rs (i
nfla
tion
adju
sted
)
2010201120122013201420152016*
2012 FacebookIPO is $16 billion,scale is truncated
In contrast to IPOs, Mergers and Acquisitions (M&A) have remained fairly steady. Silicon Valley recorded 380 M&A deals up to mid-November 2016, about the same as the prior year. M&A activity is an indicator of the value of company assets to others, a dimension of regional economic competitiveness.
svcip.com

20
Silicon Valley Competitiveness and Innovation Project - 2017 Report svcip.com
Austin
Silicon Valley
S. California
Seattle
New York City
Boston
EARLY STAGE
$40
$30
$20
$10
$0
Austin
Silicon Valley
S. California
Seattle
New York City
Boston
$150
$100
$50
$0
Note: Adjusted amounts from Bureau of Labor Statistics CPI Inflation Calculator into 2016 dollars (www.bls.gov/data/inflation_calculator.htm) Data and Analysis: Pitchbook Data, Inc. July 2016
Median Valuation of Early and Late Stage Start-Up Companies In Millions of Dollars, Inflation AdjustedInnovation Regions - 2014, 2015 and 2016 Thru Third Quarter (3Q)
201420152016 thru 3Q
201420152016 thru 3Q
[Scale is 3x larger than Early Stage]
EARLY STAGE LATER STAGE
Valuations are estimates of start-up companies’ worth, and a higher median regional valuation suggests that companies are larger, worth more and have been better able to secure past investment. Early stage median valuation of Silicon Valley companies increased between 2015 and the third quarter of 2016, comparable to Austin and Southern California, but much less than Seattle, New York City, and Boston. As a result, Silicon Valley no longer has the highest early stage median valuation as Seattle moved into the top ranking.
Silicon Valley’s later stage median valuation dropped substantially between 2015 and the third quarter of 2016, as did those of Southern California and New York City, with declines ranging from 32% to 54%. However, later stage median valuation for Austin, Boston, and Seattle all rose substantially during the same period, with gains ranging from 19% to 94%, meaning several innovation regions thrived during the local decline.
While Silicon Valley arguably experienced an unsustainably large increase in 2015, the region’s later stage valuation in Q3 2016 had still not rebounded to its 2014 level. In contrast, Austin, Boston, and Seattle are above their 2014 levels. Even with these changes, Silicon Valley maintains the highest later stage valuation among the innovation regions.
Inno
vatio
n Pr
oces
ses:
Bus
ines
s In
nova
tion

21
Outcomes and Prosperity: Business Competitiveness
Worker ProductivityAnnual Value Added per EmployeeInnovation Regions and U.S. Overall, 2005 and 2015
Data Source: U.S. Bureau of Economic Analysis, U.S. Bureau of Labor Statistics Analysis: Collaborative Economics
100
125
150
175
200
225
250
U.S. Overall Austin Boston SouthernCalifornia
Seattle New YorkCity
SiliconValley
2005
2015
Thou
sand
s of
Dol
lars
of O
utpu
t per
Wor
ker,
per Y
ear
Infla
tion
Adju
sted
Silicon Valley’s worker productivity remained the highest of the innovation regions in 2015. Average value added per employee (a rough proxy for labor productivity) was $231,000 per Silicon Valley worker in 2015, up from $225,000 in 2014.
In 2015, the region’s worker productivity was 1.7 times the U.S. average, a 15 percent increase from 2005. Seattle was the only innovation region where productivity expanded at an even higher rate (+17%).
Labor productivity and business operations costs are critical considerations for companies as they determine where to conduct business, though strong labor productivity and other regional assets (such as access to suppliers and end markets) may outweigh cost trade-offs.
svcip.com

22
Using the San José Metropolitan Statistical Area to represent Silicon Valley home and apartment prices, we see that median home values continued to increase quickly in the first half of 2016. In fact, median home values rose to $935,180, according to Zillow, exceeding home values in San Francisco ($799,150), and all innovation regions by a substantial margin. The rate of increase was comparable to Austin and Seattle, while more than double that of Boston and triple that of the New York City region between the first half of 2015 and first half of 2016.
Rent prices in Silicon Valley also compounded the region’s affordability challenge, with a two-bedroom unit renting for an average of $3,185 per month in the first half of 2016. Other markets experienced even higher rental prices for two-bedroom rental units, including New York City ($3,579 per month), with Boston close behind at $3,179 per month. However, Silicon Valley’s rate of increase in rents was among the highest of the innovation regions.
Outcomes and Prosperity: Quality of Life
Seattle
New York City
Boston
Silicon Valley**
Southern California**
Austin
$935K
$565K
$380K
$390K
$249K
$385K
Median homevalue 2016*
Percent change in median home value (first half 2015 to first half 2016)
Average monthly rent for a 2 bedroom apartment (2016*)
Percent change in average rent (August 2015 to August 2016)
+9%$3,185+10%
% change inmedian homevalue, average
monthly rentfor a 2 BR,
and % changein average
monthly rent
+5%$2,918
+9%+8%
$1,598+10%
+10%$2,661+11%
+4%$3,179
+7%
+3%$3,579
+5%
Housing Costs in Innovation RegionsMedian Home Values and Average Monthly Rent, 2016*
*2016 data span January through August 2016**Due to data constraints, the Silicon Valley indicator uses data from the San José Metro Area. The Southern California category uses Los Angeles data Data Source: Zillow, Rent Jungle, Bureau of Labor StatisticsAnalysis: Collaborative Economics
Housing costs and commutes are key factors influencing residents’ quality of life, which affects innovation regions’ ability to attract and retain talent.
svcip.com

23
Silicon Valley Competitiveness and Innovation Project - 2017 Report svcip.com
Growth in Employment, Population and Housing Stock Silicon Valley (Index 2010=100)
Source: US Census, American Community Survey; California Department of Finance, Bureau of Labor Statistics
Analysis: Collaborative Economics
*AMI is county area median household income. For more information about income categories and levels, consult the California Department of Housing and Community Development.
Silicon Valley Progress in Meeting Housing Need Allocation By Income, 2007-2014
Counties Very Low Income
Households (0-50% of AMI*)
Low Income Households
(50-80% of AMI)
Moderate Income
Households (80-120% of AMI)
Higher Income Households
(Above 120% of AMI)
San Francisco 59% 27% 18% 109%
San Mateo 20% 25% 25% 93%
Santa Clara 27% 28% 22% 139%
98
100
102
104
106
108
110
112
114
116
118
120
122
124
126Overall Employment +24.5%
Population Growth +6.4%
Housing Stock+2.6%
2010 2011 2012 2013 2014 2015
Inde
x Ch
ange
(201
0=10
0)
As Silicon Valley rebounded from the national recession, employment boomed and the population grew considerably. However, housing stock increased very little with few affordable housing options for households at or below the average median income.
Between 2010 and 2015, employment in the region increased by almost 25%, while the population increased more than six percent. However, housing units grew by less than three percent over the same period. While the economy added 367,064 jobs in Silicon Valley during this period, only 57,094 new housing units were created.
According to the Association of Bay Area Governments, between 2007 and 2014, jurisdictions in San Francisco, San Mateo, and Santa Clara Counties issued permits meeting about a quarter of the estimated housing need for households at or below their county median household income, while fully meeting the need for households at 120% or more than their county median household income.
Outcom
es and Prosperity: Quality of Life

24
Silicon Valley Competitiveness and Innovation Project - 2017 Report svcip.com
Change in Average Commute Time Innovation Regions, 2010 and 2015 (Index 2010=100)
Reflects commute times for workers employed in the innovation regions
Source: US Census, American Community Survey
Analysis: Collaborative Economics
98
100
102
104
106
108
110
112
114
116Silicon Valley +15.5%
Seattle +11.4%
Austin +5.7%New York City +5.2%
2010 2015
Inde
x Ch
ange
in A
nnua
l Tra
ffic
Del
ay (2
010=
100)
Boston +8.9%
S. California +6.5%
Commute times continued to increase in 2015 across the innovation regions, with Silicon Valley’s total increasing the most between 2010 and 2015 (+15.5%). Commute time can be an important factor in worker productivity and quality of life.
The average Silicon Valley worker spends an hour and 10 minutes commuting per day (both ways), second only to New York City workers, who spend an hour and 14 minutes commuting. Other innovation regions have shorter average round-trip commute times: Boston (66 minutes), Seattle (61.8 minutes), Southern California (61 minutes), and Austin (53.4 minutes).
Out
com
es a
nd P
rosp
erity
: Qua
lity
of L
ife

25
Outcomes and Prosperity: Access to Opportunity
Preschool EnrollmentShare of 3-4 Year Olds Enrolled in SchoolInnovation Regions, 2010-2015
Data Source: American Community SurveyAnalysis: Collaborative Economics
2010 2011 2012 2013 20152014
Perc
ent o
f 3-4
yea
r old
s en
rolle
d in
sch
ool
40%
45%
50%
55%
60%
65%
Silicon Valley 62%New York City 62%Boston 61%
S. California 54%Austin 52%
Seattle 44%
Attending preschool can provide youth with foundational skills critical to later educational success. In 2015, 62% of Silicon Valley’s 3-4 year olds were enrolled in a preschool program, a level comparable to that of Boston and New York City. Other regions, while well behind, made gains in 2015. Although Silicon Valley has generally kept pace with other leading innovation regions, about four in ten of the region’s 3-4 year olds continue to be without the advantages of preschool education.
Education enables access to well-paying jobs and facilitates income mobility. Jobs in Innovation Industries have strong earning potential; high quality education is therefore particularly important to promote access to opportunity across the full population.
English Language Arts Proficiency Levels Among 3rd Grade StudentsShare of Students Meeting or Exceeding Standards, by Race and EthnicitySilicon Valley, 2016
Data Source: California Department of Education, CAASPP 2016Analysis: Collaborative Economics
0%
20%
40%
60%
80%
100%
Share of studentsnot meeting standard
Average % proficientin Silicon ValleyAverage % proficientin California
Share of studentsmeeting or exceedingstandard
Black orAfrican
American
Hispanic orLatino
NativeHawaiian or
Pacific Islander
AmericanIndian or
Alaska Native
Filipino Ethnicity -Two or More
Races
White Asian
Third grade proficiency in English Language Arts is an important indicator of future academic success. The percentage of local 3rd grade students meeting or exceeding the state standard for English Language Arts rose from 52% in 2015 to 55% in 2016.
In 2016, higher proportions of Silicon Valley 3rd grade students across all ethnicities met or exceeded the state standard for English Language Arts compared to the previous year. Notably, the proportion of Hispanic and Latino students (accounting for 38 percent of 3rd grade test takers) that met or exceeded the state standard rose by 4.6 percent in 2016, to 31 percent. The achievement gap by ethnicity was slightly less pronounced in Silicon Valley in 2016 than 2015. However, the gap was still large: 46 percentage points separated Asian students, who had the highest proportion meeting or exceeding the standards, and African American students, who had the lowest proportion.
svcip.com

26
Silicon Valley Competitiveness and Innovation Project - 2017 Report svcip.comO
utco
mes
and
Pro
sper
ity: A
cces
s to
Opp
ortu
nity
Mathematics Proficiency Among 8th Grade StudentsShare of Students Meeting or Exceeding Standards, by Race and EthnicitySilicon Valley, 2016
Data Source: California Department of Education, CAASPP 2016Analysis: Collaborative Economics
0%
20%
40%
60%
80%
100%
Share of studentsnot meeting standard
Average % proficientin Silicon Valley
Average % proficientin California
Share of studentsmeeting or exceedingstandard
Black orAfrican
American
Hispanic orLatino
NativeHawaiian or
Pacific Islander
AmericanIndian or
Alaska Native
Filipino Ethnicity -Two or More
Races
White Asian
Eighth grade math proficiency is an important predictor for college preparedness and professional opportunities. In 2016, 53% of Silicon Valley’s eighth grade students met or exceeded the state standards for mathematics proficiency, compared to 49% in 2015.
However, in 2016 the achievement gap in mathematics by ethnicity in Silicon Valley remained striking: only 24 percent of African American and 25 percent of Hispanic or Latino eighth graders met or exceeded the state standards for mathematics proficiency. At the same time, 82 percent of Asian students and 68 percent of Caucasian students met or exceeded the standard.
11th Grade English Language Arts Exam
11th GradeMathematics Exam
20%
40%
60%
80%
100%
2015 2016
Share of Students Meeting and Exceeding State Learning Standards in 11th Grade Mathematics and English Language ArtsSilicon Valley, 2015 & 2016
Source: California Department of Education, CAASPP 2015, 2016Analysis: Collaborative Economics
Since 11th grade students are close to either entering college or the workforce, test results are an important indicator of their readiness for college or work. In 2016, about two-thirds of Silicon Valley 11th grade students (67%) met or exceeded the state standard for English Language Arts, an increase from 65% in 2015. Less than half of 11th graders met or exceeded the state standard in Mathematics (47%), an important indicator for STEM career readiness.

27
Silicon Valley Competitiveness and Innovation Project - 2017 Report svcip.com
Mathematics Proficiency Levels Among 11th Grade Students by Race/EthnicitySilicon Valley, 2016
English Language Arts Proficiency Levels Among 11th Grade Students by Race/EthnicitySilicon Valley, 2016
Note: Data for American Indian or Alaska Native students not available, due to small number of test takersSource: California Department of Education, CAASPP 2016Analysis: Collaborative Economics
Note: Data for American Indian or Alaska Native students not available, due to small number of test takersSource: California Department of Education, CAASPP 2016Analysis: Collaborative Economics
There are substantial disparities in mathematics proficiency by race and ethnicity in Silicon Valley. Only about one in five African American (17%) and Hispanic or Latino 11th grade students (20%) met or exceeded the state standard in Mathematics, well below the regional average and the average among White and Asian students. The same pattern was true for English Language Arts. Notably, Hispanic and Latino students comprised the largest group (37%) of Silicon Valley’s 11th grade students who took the state test in 2016, and thus the largest group of students who are about to move on to postsecondary education and training or join the labor force.
0%
10%
20%
30%
40%
50%
60%
70%
80%
90%
100%
Percentage of studentsnot meeting standard
Average % proficientin Silicon Valley
Average % proficientin California
Percentage of studentsmeeting or exceedingstandard
Black orAfrican
American
Hispanic orLatino
NativeHawaiian or
Pacific Islander
Filipino Ethnicity -Two or More
Races
White Asian
0%
10%
20%
30%
40%
50%
60%
70%
80%
90%
100%
Percentage of studentsnot meeting standard
Average % proficientin Silicon ValleyAverage % proficientin California
Percentage of studentsmeeting or exceedingstandard
Black orAfrican
American
Hispanic orLatino
NativeHawaiian or
Pacific Islander
Filipino Ethnicity -Two or More
Races
White Asian
Outcom
es and Prosperity: Access to O
pportunity

28
Policy Scorecard
High-Skill Immigration
Streamline the visa process for permanent residents and non-immigration visas.
Broaden eligibility criteria for EB-5, to better reflect start-up company growth.
Maximize O-1 visas, especially for high-talent entrepreneurs.
Education: STEM Education and High-Quality Pre-K
Increase funding for public preschool education programs, particularly targeting at-risk populations
Increase student opportunities to engage with STEM in pre-K and K-12
Accept more STEM courses as A-G requirements (e.g., engineering, science courses) for UC/CSU admission
Increase student proficiency in 3rd grade reading and 8th grade Algebra
Transportation and Housing
Increase funding for BART and Caltrain, leveraging New Starts, Cap & Trade funds, local ballot initiatives and infrastructure financing districts
Develop a permanent funding source for affordable housing
Engage corporate leaders to encourage connectivity to transit
Research and Development
Develop R&D funding matching program for areas such as biotechnology, clean energy and DARPA
Implement permanent R&D (and R&D equipment) tax credits
Emphasize return on investment in funding formula, tax credits
Cost of Doing Business and Regulation
Modernize CEQA
Augment tax credits, incentives to encourage business expansion locally
Automate local permitting system
Key
Federal Action
State Action
Local Action
In 2015, the Silicon Valley Leadership Group and Silicon Valley Community Foundation hosted a series of public policy strategy sessions with federal, state and local officials, CEOs, education administrators, and community leaders. The following public policy recommendations emerged as priorities to enhance the health of Silicon Valley’s economy.
svcip.com
29
Education Policy Wins
Housing and Transportation Policy Wins
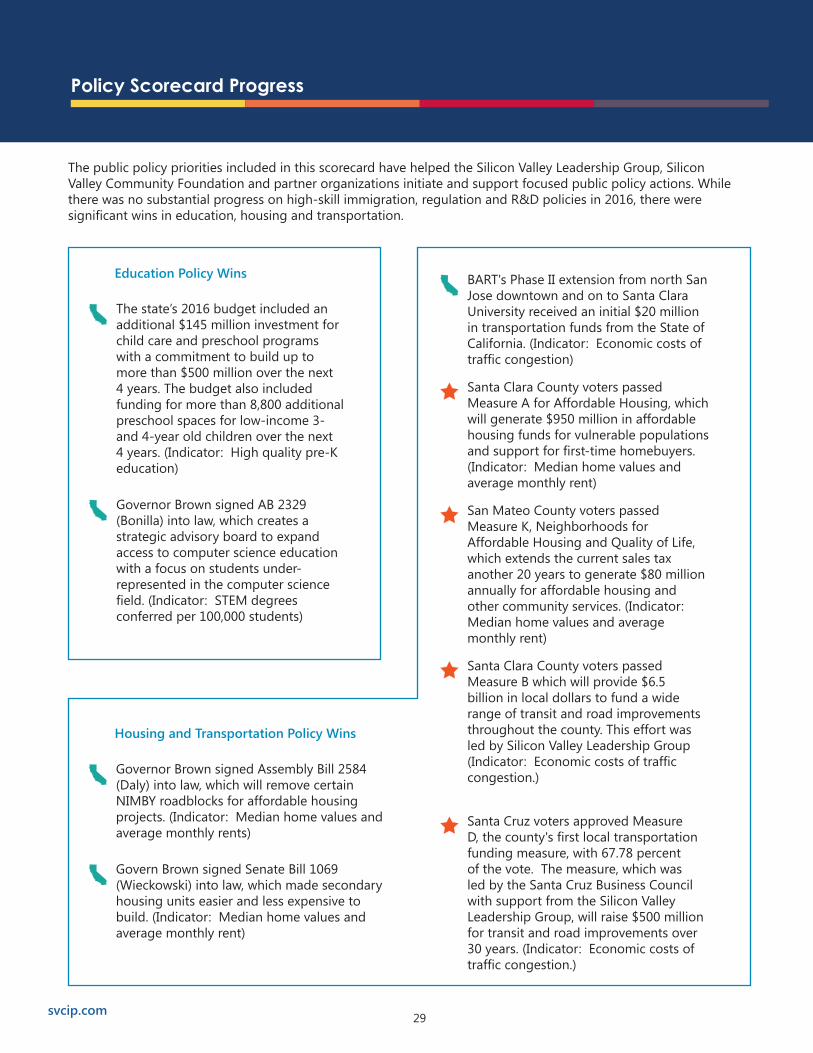
The state’s 2016 budget included an additional $145 million investment for child care and preschool programs with a commitment to build up to more than $500 million over the next 4 years. The budget also included funding for more than 8,800 additional preschool spaces for low-income 3- and 4-year old children over the next 4 years. (Indicator: High quality pre-K education)
Governor Brown signed AB 2329 (Bonilla) into law, which creates a strategic advisory board to expand access to computer science education with a focus on students under-represented in the computer science field. (Indicator: STEM degrees conferred per 100,000 students)
BART's Phase II extension from north San Jose downtown and on to Santa Clara University received an initial $20 million in transportation funds from the State of California. (Indicator: Economic costs of traffic congestion)
Santa Clara County voters passed Measure A for Affordable Housing, which will generate $950 million in affordable housing funds for vulnerable populations and support for first-time homebuyers. (Indicator: Median home values and average monthly rent)
San Mateo County voters passed Measure K, Neighborhoods for Affordable Housing and Quality of Life, which extends the current sales tax another 20 years to generate $80 million annually for affordable housing and other community services. (Indicator: Median home values and average monthly rent)
Santa Clara County voters passed Measure B which will provide $6.5 billion in local dollars to fund a wide range of transit and road improvements throughout the county. This effort was led by Silicon Valley Leadership Group (Indicator: Economic costs of traffic congestion.)
Santa Cruz voters approved Measure D, the county's first local transportation funding measure, with 67.78 percent of the vote. The measure, which was led by the Santa Cruz Business Council with support from the Silicon Valley Leadership Group, will raise $500 million for transit and road improvements over 30 years. (Indicator: Economic costs of traffic congestion.)
Governor Brown signed Assembly Bill 2584 (Daly) into law, which will remove certain NIMBY roadblocks for affordable housing projects. (Indicator: Median home values and average monthly rents)
Govern Brown signed Senate Bill 1069 (Wieckowski) into law, which made secondary housing units easier and less expensive to build. (Indicator: Median home values and average monthly rent)
Policy Scorecard Progress
The public policy priorities included in this scorecard have helped the Silicon Valley Leadership Group, Silicon Valley Community Foundation and partner organizations initiate and support focused public policy actions. While there was no substantial progress on high-skill immigration, regulation and R&D policies in 2016, there were significant wins in education, housing and transportation.
svcip.com

30
Appendix
Regional Output in Innovation Industries - Regional Output in Innovation Industries is estimated using Moody’s Analytics nominal GDP levels for Santa Clara, San Mateo and San Francisco counties, adjusted for inflation using the Bureau of Economic Analysis personal consumption expenditures (PCE) price index. Due to data constraints, Innovation Industries include the following sectors: computer and electronic product manufacturing, electrical equipment, appliance and component manufacturing, and information. A share of professional, scientific, and technical services GDP was added as well, in the same proportion as the computer system design services and custom computer programming services employment share of professional, scientific, and technical services employment from BLS-QCEW.
Employment in Innovation Industries - BLS-QCEW employment data are county-level survey-based employment estimates, available to the 4-Digit NAICS level. In this report, BLS-QCEW employment levels are annual averages. As a consistent methodology over time, this source is the basis for industry growth estimates.
Talent Pool for Innovation Industries: Concentration, Jobs, Change in Concentration 2005-2015, and 2015 STEM Employment - Data on high-technology STEM occupational employment is from the Bureau of Labor Statistics Occupational Employment Statistics for May of 2005 and 2015. Regional data is available by Metropolitan Statistical Area (MSA) rather than by county. High-technology STEM occupations are scientific, engineering and technical occupations defined by the BLS (Hecker, 2005), including computer and mathematical scientists, engineers, drafters, engineering and mapping technicians, life scientists, physical scientists, life and physical science technicians, computer and information systems managers, engineering managers, and natural science managers. Science and engineering industries are classified using the 2010 Standard Occupational Classification (SOC) System from the U.S. Census Bureau.
Population Change by Educational Attainment - Population Change by Educational Attainment report change in the number of adult residents 25 years and older by education level between 2013 and 2015, divided by the total number of adult residents in 2013 and normalized per 10,000 adult residents. Data are from the United States Census Bureau’s American Community Survey (ACS). The report uses 1-year estimates, for 2013 and 2015. Due to data constraints, regions are defined by MSAs, rather than by county. The geographical definition for Southern California combines the Los Angeles, and San Diego MSAs; and Silicon Valley combines the San Francisco and San José MSAs which additionally include data from Alameda, San Benito, and Marin counties.
STEM Degrees Conferred - Data on the number of STEM Degrees conferred comes from the National Center for Education Statistics’ Integrated Postsecondary Education Data System (IPEDS). Data are based on first major and include bachelor’s, master’s, and doctoral degrees in Biological & Biomedical Sciences, Physical Sciences, Engineering, Computer & Information Sciences, Mathematics & Statistics, Engineering Technologies and Related, Science Technologies/Technicians. To obtain STEM degrees conferred per 10,000 residents, Collaborative Economics divides the number of STEM degrees in each region by the region’s population.
Migration - Migration estimates reflect net change in number of migrants, based on origin, from U.S. Census Bureau Population Estimates. To obtain monthly averages, yearly migration numbers are divided by 12 months. In Silicon Valley, Boston, Southern California and New York City, the net change in domestic migrants was negative, meaning that more people left those regions than arrived from the rest of the U.S., hence all positive change in population was from abroad.
International Talent - Data for international talent is provided by the United States Census Bureau’s, 2015 American Community Survey (ACS) Public Use Microdata Sample (PUMS). Science and Engineering (S&E) occupations include science and engineering managers, computer scientists, programmers, developers and analysts; and Engineering; Art, Architecture, and Design; Mathematics; and Science occupations. Data includes all currently employed individuals with a Bachelor’s degree or higher. Foreign-born does not include individuals from U.S. territories. Regions are defined by county. In-state-born share of workers for New York City only incorporates New York state, and for Boston, only the state of Massachusetts. Science and engineering occupational definitions are based on the U.S. Census Bureau’s Standard Occupational Classification system, updated in 2010.
New Entrepreneurship and New Female Entrepreneurship Rates - The rate of new entrepreneurship measures the average share of the adult population that became entrepreneurs in a given month. Please refer to the 2016 Kauffman Index of Startup Activity for further discussion of the methods used to calculate the indicator. Microdata used to calculate the rate of new entrepreneurship and the rate of new female entrepreneurship come from the Current Population Survey (CPS), a joint production of the U.S. Census Bureau and U.S. Bureau of Labor Statistics. Robert W. Fairlie provided the underlying microdata files, which were also are used to construct the Kauffman Foundation’s Index of Startup Activity. Regions are based on 2010 MSA definitions as follows: Southern California combines 41740, San Diego-Carlsbad-San Marcos, CA, and 31100, Los Angeles-Long Beach-Santa Ana, CA; Silicon Valley combines 41860, San Francisco-Oakland-Fremont, CA and 41940, San José-Sunnyvale-Santa Clara, CA. Austin is 12420, Austin-Round Rock, TX; Boston is 71650 Boston-Cambridge-Quincy, MA-NH; and Seattle is 42660, Seattle-Tacoma-Bellevue, WA. New York City is 35620 New York-Northern New Jersey-Long Island, NY-NJ-PA, excluding the Pennsylvania portion of the sample.
svcip.com

31
Venture Capital & Early Stage Funding - Investment data are provided by CB InsightsTM (www.cbinsights.com) and include disclosed investment deals in private companies. Data are through November 14, 2016, unless explicitly noted to be through Q3 2016. All figures were adjusted for inflation, as described above. VC data includes Angel, Seed, Series A-E+, Growth Equity, Bridge, and Incubator series types.
Research and Development Expenditures at Universities - Data on university R&D Expenditures come from the Higher Education Research and Development Survey produced by the National Science Foundation’s National Center for Science and Engineering Statistics. Universities were classified into their respective regions by county. Some institution totals for all R&D expenditure for FY 2004 through FY 2009 may be lower-bound estimates because the National Science Foundation did not attempt to correct for non-response on non-science and engineering R&D expenditure items. Total R&D expenditure estimates were not available for Seattle from 2004 to 2009: Collaborative Economics estimated Seattle’s growth trajectory based on growth in the University of Washington’s Federal R&D expenditure over time. The Federal R&D data were from the Statistical Abstract of the United States for 2007, and the U.S. Census Federal R&D Obligations in 2008. In 2012, the University of Washington accounted for 99% of Seattle’s total reported research funding and Federal funding was 86% of the University of Washington’s total R&D expenditure.
Patents - Patent data are obtained from the Custom Data Extract of the U.S. Patent and Trademark Office and reflect utility patents granted by location of the first inventor. Regions are defined by county, based on the first inventor’s city and zip code. Patent registrations in Computers, Data Processing & Information Storage reflect USPC Classes 235, 341, 345-7, 360, 365, 369, 377, 700-20, 725-26, and 902.
Progression of Early-Stage Investment - Progression of Early-Stage Investment by Series data are from CB InsightsTM (www.cbinsights.com) and include disclosed investment deals in private companies through November 14, 2016. This indicator tracks venture-backed startup companies that launched in the selected year through subsequent rounds of funding. While companies may have received multiple rounds of funding within the series (e.g., several rounds of Series A funding), this indicator counts the first investment in the series only, and then that company’s subsequent, higher-level series. Pre-A investments include angel, seed and seed VC investments. This indicator reflects 2013 as the most recent cohort because companies that launched in 2014 and 2015 have had less time to secure subsequent funding rounds, and historical comparisons would be inappropriate. Regions are defined by county, based on startups’ HQ city.
IPO Valuations and M&A Activity - IPO Valuation data are from CB InsightsTM (www.cbinsights.com) and include initial public offering exits among private companies through November 14, 2016, adjusted for inflation. Where IPO valuation data were unavailable from CB Insights, valuations from CrunchBase (http://www.crunchbase.com/) were used. M&A activity also sourced from CB Insights as of November 14, 2016. Regions are defined by county, based on startups’ HQ city.
Median Valuations of Startup Companies - Median Valuation of Startup Companies data and analysis are from Pitchbook Data, Inc. (pitchbook.com) as of July 2016. Valuations are evaluated before a subsequent round of investment (“pre-money”). Included are venture-backed companies that have not exited (e.g., through an initial public offering, merger/acquisition, etc). Figures are inflation adjusted using BLS CPI-U data. “Early Stage” startups are companies that have secured seed/seed VC or series A investments, while “Later Stage” startups refer to companies that received Series B investment or later. Regions are defined by county, based on startups’ HQ city.
Productivity – Annual Output per Worker - Worker productivity is roughly proxied by annual regional output (GDP) in the private sector per private sector worker, in 2015. Regional GDP data are from Bureau of Economic Analysis, and employment data are from BLS-QCEW. Due to data constraints, regions are organized by principal metropolitan area. Silicon Valley is proxied by San José, New York City by New York metro, Southern California by Los Angeles. BLS-QCEW county-level data were matched to the MSA county definitions.
Median Home Value and Average Rents -Median Home Value data are from Zillow (www.zillow.com), and are inflation adjusted. Rents are sourced from Rent Jungle. Due to data constraints, regions are organized by principal city. Silicon Valley is proxied by San José, New York City by New York metro and Southern California by Los Angeles. Monthly data are averaged to estimate annuals.
Population, Housing, and Jobs - Data for this indicator is sourced from the U.S. Census American Community Survey, California Department of Finance, California Department of Housing and Community Development, U.S. Bureau of Labor Statistics, and Association of Bay Area Governments.
Average Commute Times - Change in average commute time for workers in innovation regions is sourced from the U.S. Census, American Community Survey.
Pre-School Enrollment - Preschool participation data are from the U.S. Census Bureau American Community Survey 1-year estimates from 2010 through 2015, and reflect the percent share of total three- and four-year-old children enrolled in school. Regions are defined by county.
English and Mathematics Proficiency - Exam performance data are from the California Department of Education, CAASPP Results in 2016, and “proficiency” reflect students meeting or exceeding state standards in 3rd grade English Arts, 8th grade Mathematics, and 11th grade English Arts and Mathematics. Regions are defined by county.
svcip.com
The Silicon Valley Leadership Group, founded in 1978 by David Packard of Hewlett-Packard, represents nearly 400 of Silicon Valley's most respected employers on issues, programs and campaigns that affect the economic health and quality of life in Silicon Valley. The Leadership Group focuses on key issues of importance including energy, transportation, education, housing, health care, taxation, economic vitality and the environment. Leadership Group members collectively provide nearly one of every three private sector jobs in Silicon Valley and have more than $3 trillion in annual revenue. For more information, visit svlg.org.
Silicon Valley Community Foundation advances innovative philanthropic solutions to challenging problems. As the largest community foundation in the world, we engage donors and corporations from Silicon Valley, across the country and around the globe to make our region and world better for all. Our passion for helping people and organizations achieve their philanthropic dreams has created a global philanthropic enterprise committed to the belief that possibilities start here.
Learn more at siliconvalleycf.org.
Silicon Valley Competitiveness and Innovation Project - 2017svcip.com