siemens netherlands annual report 2018...siemens nederland n.v. is a wholly-owned subsidiary of...
TRANSCRIPT

siemens.nl
Annual Report 2018Siemens Nederland N.V.

Contents
PageSupervisory Board reportReport of the Management Board
Financial StatementsCompany Statement of financial positionCompany Income statementCompany Statement of comprehensive incomeCompany Statement of changes in equityCompany Statement of cash flows
Notes to the company financial statementsGeneral disclosuresNote 1 Basis of presentationNote 2 Summary of significant judgments, estimates and assumptionsNote 3 Accounting policiesNote 4 Fair value measurementNote 5 Risk management
Notes to the company statement of financial positionNote 6 Non-current intangible assetsNote 7 Property, plant and equipmentNote 8 Investments in associates and joint venturesNote 9 Non-current receivablesNote 10 Contract assets and contract liabilitiesNote 11 InventoriesNote 12 Trade and other receivablesNote 13 Other financial assetsNote 14 PrepaymentsNote 15 Cash and cash equivalentsNote 16 Assets held for saleNote 17 EquityNote 18 Deferred tax liabilitiesNote 19 Other financial obligations (included in non-current liabilities)Note 20 ProvisionsNote 21 Trade and other payablesNote 22 Tax liabilitiesNote 23 Financial instrumentsNote 24 Contingent liabilities
Notes to the company statement of profit and lossNote 25 RevenueNote 26 Other operating incomeNote 27 Finance income and expensesNote 28 Tax on profit from continuing operationsNote 29 Related partiesNote 30 Compensation of executive management and the Supervisory BoardNote 31 Rights to equity instrumentsNote 32 EmployeesNote 33 Depreciation, amortization, and impairment lossesNote 34 Personnel costsNote 35 Joint operationsNote 36 Audit feesNote 37 Events after the reporting date
Other informationStatutory rules concerning result appropriationIndependent auditor’s report
24
1112131415
161720212930
32333434343535363636374041414346464749
51525252535454565656575757

-2-
2018 Supervisory Board Report
The Siemens Nederland N.V. Supervisory Board oversees the Management Board's policies and assists the
Management Board with advice. The Supervisory Board holds an ordinary meeting every quarter, partly together with
the Management Board. At this meeting the Board discusses day-to-day business and the results achieved compared
to the approved budget on the basis of financial reports. Developments in the Siemens Group in the Netherlands are
also discussed, along with potential acquisitions and carve-outs. The Business Outlook, all reportable events, financial
reporting and Enterprise Risk Management including Environment, Health & Safety as well as Cybersecurity are
covered at every meeting, as are any developments related to personnel and past and future social policy are
discussed on the basis of statistics. The sustainability policy and digitalization are furthermore also recurring topics of
discussion. The Audit Committee assists the Supervisory Board in fulfilling its supervisory responsibilities with regard to
the entire financial reporting process, the independence and qualifications of the independent external auditors, the system
of internal control, the governance process, and the company’s process for monitoring compliance with the law, Siemens’
internal regulations and applicable codes of conduct.
The Supervisory Board also attends events for business contacts and personnel. As a rule there is always a member of
the Supervisory Board present at the consultation meetings with the Works Council.
Meeting of December 8, 2017At this meeting the Supervisory Board discussed the annual financial accounts for the 2017 fiscal year. Mr. Pierer von
Esch reported on the Audit Committee meeting that took place prior to the Supervisory Board meeting. Mr. Van der
Poel informed the Supervisory Board on the Group reporting and told that no unadjusted audit differences were found
when the Financial Statements were audited.
Furthermore, the developments in economy, market trends, long-time perspectives and new opportunities were
discussed. The Management Board has informed the Supervisory Board on the situation of the Hengelo location
regarding its announced restructuring.
The Supervisory Board resolved to recommend the reappointment of Mr. Kaeser for the next 4 years.
Meeting of March 21, 2018Besides discussing the usual topics, the Supervisory Board was comprehensively informed about the actual situation of
the Hengelo location and different scenarios and approaches were discussed. The Hengelo situation has been a
recurring theme each meeting and has also been discussed in separately planned teleconferences.
It was the last Supervisory Board meeting attended by Mr. Van der Touw before his retirement on April 1, and a
proposal to appoint Mr. Winters as member of the Management Board and CEO of Siemens Nederland N.V. as of April
1, was approved.
Meeting of June 15, 2018The Management Board informed the Supervisory Board on the half-yearly results and the main lines of the strategic
policy, the general and financial risks as well as of the Company's management and control systems. The Supervisory
Board was informed on the Audit Committee meeting of June 14. Mr. Pierer von Esch decided to step down from the
Supervisory Board due to another appointment within Siemens. Ms. Al Refai has been appointed per July 1, 2018. The
Supervisory Board Members thanked Mr. Pierer von Esch for his valuable contribution during the years of his
membership. Furthermore, the Supervisory Board was informed about the status of the transformation of the
Mechanical Drives business and the intended sale of Siemens Mobility B.V.
Meeting of September 14, 2018In its meeting of September 14, the Supervisory Board has discussed Vision 2020+, a future-focused strategy program
for Siemens worldwide, and its impact on Siemens Nederland N.V. Next to the three currently majority-owned Strategic
Companies - Siemens Healthineers, Siemens Gamesa Renewable Energy and Siemens Mobility, the new set-up that

-3-
will take shape in the coming time will include three Operating Companies - Smart Infrastructure (SI), Digital Industries
(DI) and Gas and Power (GP) as hub structure. Siemens Nederland N.V., one of the 21 Siemens Lead Countries, will
be internally allocated to Digital Industries (DI). The Supervisory Board has been updated and it has advised on the
progress of the envisaged transfer of the Hengelo Business to a third party.
We thank the Management Board and all employees for their efforts and commitment during the past year.
The Hague, December 7, 2018
Supervisory Board
Siemens Nederland N.V.
C. Kaeser, Chairman

-4-
Managing Board Report
Siemens is a technology company with core activities in the fields of electrification, automation and digitalization.
Siemens is a leading supplier of power generation, power transmission and infrastructure solutions as well as automation,
drive and software solutions for industry and of medical diagnostic solutions. Economic growth in the Netherlands is strong,
resulting in a level of confidence among consumers and investors that was inconceivable just a few years ago. This presents
our company opportunities for growth and to add value to our society, for example in areas such as the digitalization of
industry, the energy transition and affordable, high-quality healthcare. It also presents our company with challenges to
transition our portfolio from traditional power generation and the oil and gas market, to renewable energy production. Both
within our company, as within society, we need to create momentum for several much-needed transformations.
About Siemens NederlandAt the end of the 2018 financial year, Siemens Nederland N.V. consisted of five divisions (Power and Gas, Energy
Management, Building Technologies, Digital Factory and Process Industries & Drives). During the year under review, the
Mobility division was sold to another Siemens entity, as well as its Healthcare subsidiary and Mechanical Drives unit.
On 16 November 2017 Siemens AG announced measures in the Power & Gas and Process Industries & Drives divisions.
Structural changes in the oil and gas and power generation market, forced Siemens to take measures in the number of sites
and jobs worldwide. Part of this restructuring program is the intended closure of the site of Siemens Nederland in Hengelo.
Approximately 392 employees (FTE) are employed on this site by Siemens Nederland. Siemens intensively negotiated a
transfer undertaking with VDL and after year end Siemens Nederland N.V. and Siemens Heat Transfer Technology B.V.
signed binding agreements to transfer business related assets, liabilities and employees pertaining to the operations in
Hengelo to VDL group.
The portfolio includes products, systems, installations and services. At the end of the year under review, Siemens Nederland
had 1,557 permanent employees.
Organizational structureSiemens Nederland N.V. is a wholly-owned subsidiary of Siemens International Holding B.V., with its registered office in The
Hague, and forms part of the fiscal entity managed by Siemens International Holding B.V. All parties in this entity share joint
and several liability. Siemens International Holding B.V. is ultimately a wholly-owned subsidiary of Siemens AG, with its head
offices in Berlin and Munich. During the year under review, Ab van der Touw retired as a member of the Managing Board.
The Managing Board now consists of two members: Godert van der Poel (CFO) and the undersigned.
Key figuresFrom continuing operation Siemens Nederland closed the year with sales of EUR 815.1 million, which together with new
orders amounting to EUR 794.6 million and a net profit from continuing operations of EUR 58.7 million, both achieved across
the whole spectrum of our portfolio in the past year, gives us confidence and continuity for the years ahead. Discontinued
operations relate the Healthcare, Mobility and Mechanical Drives businesses which have been sold in fiscal year 2018. Net
profit from discontinued operations is EUR 342.8 million which is inclusive of a gain of EUR 250.9 million resulting from the
sale of Healthcare, EUR 81.9 million from the sale of Mobility and EUR 5.3 million of the sale of Mechanical Drives. In total
net profit of the year amounts to EUR 401.5 million. Siemens Netherlands N.V. reached at the end of fiscal year 2018 a
reduction in CO₂ emissions of 33% (compared to 2014). The number of women in management positions has grown to 13.8%.
In fiscal year 2017 there has been one compliance related incident which is now handed over to public prosecution. The Lost
Time Injury Frequency Rate (LTIFR), a metric for injuries that occurred in the workplace that resulted in an employee's inability
to work the next full work day, of Siemens Netherlands N.V. ended at 0.48. (lost time injuries per every 1,000,000 hours
worked) Health related absenteeism was 2.2%.

-5-
Financial results and developmentsNet working capital increased compared to prior year. However, total cashflow was positive, mainly as a result of the net
profit. The solvency ratio, defined as equity / total assets, at September 30, 2018 amounts to 64% compared to 45% as of
September 30, 2017. Siemens Nederland N.V. intends to distribute annual profit of 401.5 million for fiscal 2018 as a dividend.
No major changes in the funding structure of the firm are expected.
Portfolio and strategic choicesTo further increase the entrepreneurial freedom of our businesses, we are reorganizing our operations. Implementation of the
new organization will be completed by the end of the second quarter of fiscal 2019. We will begin reporting financial results
according to the new company structure beginning with the third quarter of fiscal 2019. For the new structure, we are forming
three Operating Companies consisting of the reportable segments Gas and Power, Smart Infrastructure and Digital Industries.
These Operating Companies will form our Industrial Businesses together with three Strategic Companies consisting of the
reportable segments Siemens Healthineers, SGRE and Siemens Alstom, following the completion of the proposed
combination of Siemens’ mobility business with Alstom S A (Mobility until completion of the proposed combination)..
ElectrificationOne of our key strategic priorities is (and always has been) to provide solutions throughout the electrification chain. As one
of the participants in the ‘Energy Agreement’, which the Dutch government concluded with businesses and NGOs in 2013,
Siemens directly contributed to a sharp fall in the cost price of offshore wind energy. During the year under review, we also
worked on the infrastructure needed for efficient and flexible transport of renewable energy, building converter stations for the
COBRA cable which will connect the Dutch and Danish energy markets. On a more fundamental level, Siemens was one of
the initiators of the ‘Transitiecoalitie’, a partnership of 57 large companies that aims to speed up the energy transition and in
2017 called on the new Dutch government to create the necessary conditions. Our aim is to achieve carbon-neutrality by
2050 and to exceed the goals set out in the Paris agreement, by drawing up an ‘Energy agreement 2.0’.
AutomationSiemens’ automation solutions make a valuable contribution to a more modern and efficient infrastructure. In 2018 we won
the bid for the extensive renovation of the Koningstunnel in Den Haag to update this tunnel to the latest requirements for
tunnel safety. Furthermore, we will automate 8 electrically driven cranes in the harbor of Felixstowe (GB) putting electrification,
digitalization and automation into practice. Siemens technology is being used to automate the welding process of 80-meter-
long monopiles for offshore wind turbines, which play a vital part in the energy transition in the Netherlands.
DigitalizationVia the MindSphere platform Siemens enables clients to manage and analyze data gathered from machines and physical
infrastructure, in order to improve the efficiency and speed of a wide variety of processes. During the year under review we
worked on digitalization with clients in a number of areas. Using Building Information Modelling we provide virtual 3D designs
for datacenters, reducing errors in the design phase and speeding up construction on site substantially. A particular focus is
digitalization in industry. It is generally recognized that digitalization furnishes a unique opportunity to revive the Dutch
manufacturing industry, increasing its global competitiveness. A prime example is the collaboration with Airborne, which
engineers and manufactures composites. The digitalization of complex production processes makes it possible to develop
more applications for this extremely light and robust material. Our cooperation includes the Airborne Siemens Fieldlab
Experience Center, a platform for education, workshops and demonstrations, in cooperation with knowledge institutes and
industrial partners. Digitalization and cyber security go hand in hand, which is why Siemens contributed expertise to the yearly
NATO cyber security exercise, providing know-how on industrial control systems.
Sustainable and transparentSiemens technology is helping our customers improve their energy efficiency. Thanks to Siemens’ green portfolio they have
achieved a reduction of 570 million tons until fiscal year 2017 (522 until 2016), since the beginning of fiscal 2002, in their CO₂

-6-
emissions worldwide. In addition, the Siemens Group is also continuously reducing its own CO₂ footprint. Siemens Group
wants to be the first major industrial company in the world with a neutral CO₂ footprint by 2030, since the program launch,
Siemens Group has managed to reduce its CO2 emission by around 33%.
DiversityTo foster diversity throughout the Siemens organization, Siemens AG launched a Diversity Initiative, which bundles targeted
measures and projects for ensuring and further enhancing diversity at all levels of Siemens. Examples include the global
network of Siemens Diversity Ambassadors, who identify diversity issues Company-wide. The Board of Directors and the
Supervisory Board of the Company fully support the Diversity Initiative and the Diversity principles.
In preparing recommendations on the appointment of members of the Board of Directors or members of the Supervisory
Board, the shareholder and the Supervisory Board take into account a candidate’s professional qualifications, international
experience and leadership qualities, the Board’s plans for succession as well as the Board’s diversity and, in particular, the
appropriate consideration of women and/or cultural background.
The Supervisory Board is staffed with members with different nationalities and different working experiences as well as
different ages. The gender balance of the Supervisory Board is fifty-fifty. The Managing Board consists of two male members,
but the total number of women in management positions has grown to 13.8% (compared to 11.9% in 2015).
Future perspectivesAlthough the Dutch economy is still growing, it might be affected and feel the impact of global tensions, such as the Brexit,
the rise of populism and global trade wars. Nevertheless, the portfolio of Siemens is strong, and has a focus on the megatrends
of energy transition and digitalization. Furthermore, our financial position is sound and provides a good basis for profitable
growth in the coming fiscal year. Due to focus on operational entities Smart Infrastructure, Digital Industries, Gas & Power
and strategic companies Siemens Gamesa Renewable Energy, Siemens Healthineers, and the potential joint venture
between Siemens and Alstom, Siemens as a group is well positioned to bring value to our clients and society. The strategic
re-alignment under Vision2020+ will lead to a smaller legal entity Siemens Nederland N.V., but at the same time to a stronger
presence of Siemens in the Netherlands.

-7-
Risk management
Siemens is subject to several risks in its daily activities, which risks are classified as strategic, operational, financial or
compliance risks. Good risk management is crucial to control these risks, since it allows Siemens to identify potential problems
before they occur so that risk-handling activities may be performed as needed to mitigate adverse impacts on achieving
objectives
Organization
The Management Board, ultimately responsible for establishing and supervising the risk management system, has
established a risk management committee, which is responsible for developing and monitoring the risk management policies
of Siemens Nederland N.V. The committee regularly reports on its activities to the Management Board. The aim of the risk
policies of Siemens Nederland N.V. is to map out and analyze the risks, determine appropriate risk limits and controls, and to
monitor the risks and compliance with the limits. The risk management policies and systems are evaluated regularly and
adjusted where necessary to changes in the market environment and the Siemens Group's activities. Through training and
development as well as on the basis of management standards and procedures, Siemens Nederland N.V. aims to develop a
disciplined and constructive climate in which all employees understand their roles and obligations.
Governance
The governance department of Siemens Nederland N.V. oversees management's monitoring of compliance with the Group's
risk management policies and procedures. In addition, the governance department deals with the adequacy of the risk
management system in relation to the risks to which Siemens Nederland N.V. is exposed. The governance department
together with the audit department of Siemens AG conduct regular and ad hoc reviews of the risk management controls and
procedures and reports its findings to the Management Board. Accordingly, if deficits are detected, it is possible to adopt
appropriate measures for their elimination. This coordination of processes and procedures is intended to help ensure that the
Management Board and the Supervisory Board are fully informed about significant risks in a timely manner.
Reporting
Each quarter, based on a systematic approach, Divisions review and classify risks in terms of likeliness and impact, which is
discussed in Executive Management meetings. On a yearly basis, Division management and representatives from Divisions
and Support units have a teambuilding session, which aims to avoid tunnel vision in determining risks and mitigating
measures. The Management board reports on the effectiveness of risk management and control, after having discussed this
including the main risk items in the audit committee.
Risk appetiteStrategic: Moderate Siemens is prepared to take moderate risks to realize its ambitions
Operational: Very low Siemens has a very low appetite to risks such as Reputation, Customer, HSE,Business Continuity or Information Security. Due to the very nature of part of itsbusiness it may have higher project management risks for some of its projects(such as new technology or complexity).
Financial: Very low Siemens Nederland is in a strong financial position in terms of both solvency andsolvability and is also able to get additional funds from its mother Siemens AG.
Compliance: None Siemens requires full compliance with all applicable laws and regulations.
Risk management tools

-8-
Siemens has implemented and coordinated a set of risk management and control systems which supports in the early
recognition of developments that could jeopardize the continuity of the business. The most important of these systems
include Siemens’ enterprise-wide processes for strategic planning and management reporting. Strategic planning is
intended to support in considering potential risks well in advance of major business decisions, while management reporting
is intended to enable monitoring such risks more closely as business progresses.
Risk management at Siemens builds on a comprehensive, interactive and management-oriented Enterprise Risk
Management (ERM) approach that is integrated into the organization and that addresses both risks and opportunities.
Siemens’ ERM approach is based on the worldwide accepted Enterprise Risk Management – Integrated Framework (2004)
developed by the Committee of Sponsoring Organizations of the Treadway Commission (COSO). The framework connects
the ERM process with our financial reporting process and our internal control system. It considers a company’s strategy, the
efficiency and effectiveness of its business operations, the reliability of its financial reporting as well as compliance with
relevant laws and regulations to be equally important. The ERM process aims for early identification and evaluation of, and
response regarding, risks and opportunities that could materially affect the achievement of Siemens’ strategic, operational,
financial and compliance objectives. The time horizon covered by ERM is typically three years. Siemens’ ERM is based on
a net risk approach, addressing risks and opportunities remaining after the execution of existing control measures. In order
to provide a comprehensive view on business activities, risks and opportunities are identified in a structured way combining
elements of both top-down and bottom-up approaches. Risks and opportunities are generally reported on a quarterly basis.
This regular reporting process is complemented by an ad-hoc reporting process that aims to escalate critical issues in a
timely manner. Relevant risks and opportunities are prioritized in terms of impact and likelihood, considering different
perspectives, including business objectives, reputation and regulatory matters. This top down element ensures that potential
new risks and opportunities are discussed at management level and are included in the subsequent reporting process, if
found to be relevant. Reported risks and opportunities are analyzed regarding potential cumulative effects and are
aggregated within and for each of the organizations mentioned above. Responsibilities are assigned for all relevant risks
and opportunities with the hierarchical level of responsibility depending on the significance of the respective risk or
opportunity. In a first step, assuming responsibility for a specific risk or opportunity involves deciding upon one of Siemens’
general response strategies. Siemens’ general response strategies with respect to risks are avoidance, transfer, reduction
or acceptance of the relevant risk. Siemens’ general response strategies with respect to opportunities are partial or
complete realization of the relevant opportunity. In a second step, responsibility for a risk or opportunity also involves the
development, initiation and monitoring of appropriate response measures corresponding to the chosen response strategy.
These response measures have to be specifically tailored to allow for effective risk management. Accordingly, Siemens has
developed a variety of response measures with different characteristics.

-9-
Identified risksDuring 2018 no risks occurred which required changes in the risk management process.Based on the latest risk review as of September 30, 2018 the risks with the highest level of exposure were:
Risk area Risk Measures to mitigate risk
Strategic Competitive environment The markets for our products, solutions and services are highlycompetitive in terms of pricing, product and service quality, productdevelopment and introduction time, customer service, financing termsand shifts in market demands. We face strong competitors in severalmarkets, which may have a better cost structure. Some industries inwhich we operate are undergoing consolidation, which may result instronger competition, a change in our relative market position, orunexpected price erosion. Furthermore, there is a risk that competitorsare increasingly offering services for our installed base. We addressthese risks with various measures, for example benchmarking, strategicinitiatives, sales push initiatives, executing productivity measures andtarget cost projects, rightsizing of our footprint, outsourcings andoptimizing our product portfolio. We continuously monitor and analyzecompetitive and market information in order to be able to anticipateunfavorable changes in the competitive environment rather than merelyreacting to such changes.
Disruptive technologies The markets in which our businesses operate experience rapid andsignificant changes due to the introduction of innovative and disruptivetechnologies. In the fields of digitalization (e. g. internet of things, web ofsystems, cloud offerings, Industry 4.0), there are risks of newcompetitors, substitutions of existing products / solutions / services,niche players, new business models (e. g. in terms of pricing, financing,extended scopes for project business or subscription models in softwarebusiness) and finally the risk that our competitors may have faster time-to-market strategies and introduce their digital products and solutionsfaster than Siemens. Our operating results depend to a significant extenton our technological leadership, our ability to anticipate and adapt tochanges in our markets and to reduce the costs of producing ourproducts. The Siemens Group constantly applies for new patents andactively manage our intellectual property portfolio to secure ourtechnological position. However, our patents and other intellectualproperty may not prevent competitors from independently developing orselling products and services that are similar to or duplicates of ours.
Footprint The risk is that we are not flexible enough in adjusting our organizationaland manufacturing footprint in order to quickly respond to changingmarkets, resulting in a non-competitive cost position and consequentloss of business. To mitigate this risk, we continuously monitor andanalyze competitive and market information. Furthermore, we closelymonitor the implementation of the planned measures, maintain strictcost management, and conduct ongoing discussions with all concernedinterest groups.

-10-
Operational: Project management Professional project management is very important to Siemens,because a large proportion of its revenue is generated through projects.Customers also expect that the projects are managed in an excellent,innovative, and responsible manner. This applies in particular to majorprojects and turn-key projects. To meet this expectation, Siemens hasimplemented a globally harmonized system: PM@Siemens. This is acollective name given to a range of activities aimed at improving projectmanagement within Siemens. Examples include process improvements,assessments, and training. PM@Siemens is not a ready-made workingmethod, but a set of guidelines through which we provide good projectmanagement guidance that is consistent on key points. The focus of thisguidance is on the use of best practices. The aim is to harmonize thestandards for good project management and sponsor them within theorganization.
Shortage of (especially technical)personnel
Due to a general shortage it is difficult to attract qualified staff. Siemenstries to mitigate this risk by using a comprehensive approach. Inparticular by further improving existing and extending relationship withschools and universities, offering more internships and traineeships toidentify talent besides attempting to relieve the general lack of personnelby promoting technical studies.
Cyber security Due to, amongst others, digitalization, availability of data, virtual workingand interconnectivity sensitive information is shared and processedmore widely and becomes increasingly vulnerable for (sophisticated)cyber security threats. A cyber security action plan has been initiatedand a pilot has started for a Data Leakage Prevention solution.
Financial: Foreign exchange Siemens is exposed to currency risks as a result of sales and purchasesin currencies other than the functional currency. The risk on virtually allsales and purchases denominated in foreign currency is hedged in fullthrough forward exchange contracts.
Compliance: Changes of laws, legislations,Codes and Standards
If not dealt with or implemented adequately can lead to non-conformances (fines, limitations, legal cases, negative exposure)Siemens has assigned local governance owners, which review changesof laws, legislation, Codes and standards. In addition, it makes use ofdatabases and experts to support implementation.
Bribing, corruption, adherence tolaw
This is important since Siemens is doing business in all parts of theworld, including countries which score low on the "Corruptionsperceptions index" as published by Transparency International. Siemenspromotes integrity and acting in accordance with our values and allowszero tolerance for corruption and violations of principles of faircompetition. The Siemens compliance system is divided into 3 actionlevels: Prevent, Detect and Respond. These action levels encompass acomprehensive system of activities by which Siemens intends to ensurebusiness in full accordance with applicable laws and regulations as wellas Siemens' internal principles and rules.
The Hague, December 7, 2018
Chairman of the Management Board
Siemens Nederland N.V.
H.J. Winters

-11-
Company statement of financial positionStatement of financial position as of September 30 (EUR million) before profit appropriation
Note 2018 2017** Oct 1, 2016**Non-current assets Restated** Restated**Intangible assets 6 9.5 9.8 18.6Property, plant and equipment 7 6.7 19.7 26.1Non-current financial assets Investments in associates and joint ventures 8 - 0.4 5.0
Non-current receivables 9 6.5 7.5 12.7Non-current contract assets* 10 29.2 22.8 22.9Total non-current assets 51.9 60.2 85.3
Current assetsInventories 11 3.9 4.4 4.0Contract assets* 10 60.0 61.1 53.6Receivables
Trade and other receivables 12 714.8 531.7 659.5 Other financial assets 13 4.4 6.5 11.3Prepayments 14 98.8 157.9 118.1Cash and cash equivalents 15 1.1 2.1 2.6Total current assets 883.0 763.7 849.5
Assets held for sale 16 - 43.8 41.7
Total assets 934.9 867.7 976.5
Equity 17Issued capital 36.3 36.3 36.3Share premium 150.9 150.9 150.9Retained earnings 6.3 6.4 4.8Profit for the year 401.5 193.4 169.1Total equity 595.0 387.0 361.1
Non-current liabilitiesDeferred tax liabilities 18 2.8 4.0 2.5Other financial obligations 19 3.1 3.5 6.1Non-current contract liabilities* 10 55.0 65.7 61.8Provisions** 20 13.4 20.1 23.4Total non-current liabilities 74.3 93.3 93.8
Current liabilitiesProvisions** 20 21.3 37.5 44.0Trade and other payables** 21 106.9 143.0 216.2Contract liabilities* 10 134.6 203.8 169.8Tax liabilities 22 2.8 3.1 51.1Total current liabilities 265.6 387.4 479.9Liabilities directly related with assets held for sale - - 41.7
Total liabilities 339.9 480.7 615.4Total equity and liabilities 934.9 867.7 976.5
The notes are an integral part of these company financial statements.
* New IFRS 15 disclosure requirement
** IFRS 15 restatements as disclosed in note 10.

-12-
Company income statementFiscal year from October 1 through September 30 (EUR million)
Note 2018 2017*
RestatedContinuing operationsRevenue 25 815.1 767.0Other operating income 26 - 0.5Total operating income 815.1 767.5
Cost of sales 654.7 600.2Gross profit 160.4 167.3
R&D expenses 0.1 1.5Selling expenses 78.9 79.8General and administrative expenses 4.9 2.3Other operating expenses -4.0 0.3Total operating expenses 734.6 684.1
Operating profit 80.5 83.4
Finance income 27 0.0 0.0Finance costs 27 -3.3 -2.4Income from other equity investments 16 - -
Profit from continuing operations, before tax 77.2 81.0
Tax on profit from continuing operations 28 -18.5 -21.3
Profit from continuing operations, after tax 58.7 59.7
Discontinued operationsProfit from discontinued operations, after tax 16 342.8 133.7
Profit after tax 401.5 193.4
The profit after tax is attributable in full to Siemens International Holding B.V., the sole shareholder of Siemens Nederland
N.V.
The notes are an integral part of these company financial statements.
*Due to the sale of its Mobility business, prior year figures of the Mobility business have been restated to discontinued
operations.

-13-
Company statement of comprehensive income
Fiscal year from October 1 through September 30 (EUR million)
Note 2018 2017
Profit for the year, net of tax 401.5 193.4
Other comprehensive income
Other comprehensive income to be reclassified to profit or loss insubsequent periods:Net movement on cash flow hedges - 2.0Income tax effect - -0.5
Net other comprehensive income to be reclassified to profit orloss in subsequent periods - 1.5
Other comprehensive income not to be reclassified to profit or lossin subsequent periods:Re-measurement gains (losses) on defined benefit plans 20 -0.1 0.1Income tax effect 20 0.0 -0.0
Net other comprehensive income not to be reclassified to profit orloss in subsequent periods -0.1 0.1Other comprehensive income for the year, net of tax -0.1 1.6Total comprehensive income for the year, net of tax 401.4 195.0
(Attributable in full to the shareholder of Siemens Nederland N.V.)
The notes are an integral part of these company financial statements.

-14-
Statement of changes in equity
Issuedcapital
Sharepremium
Retainedearnings
Cash flowhedge
Profit forthe year Total
At September 30, 2016 36.3 150.9 6.3 -1.5 169.1 361.1
Profit after tax - - - - 193.4 193.4
Other comprehensive income - - 0.1 1.5 - 1.6Total comprehensive income - - 0.1 1.5 193.4 195.0Dividends - - -0.0 - -169.1 -169.1Allocations to reserves - - - - - -At September 30, 2017 36.3 150.9 6.4 - 193.4 387.0
Profit after tax - - - - 401.5 401.5
Other comprehensive income - - -0.1 - - -0.1
Total comprehensive income - - -0.1 - 401.5 401.4Dividends - - - - -193.4 -193.4At September 30, 2018 36.3 150.9 6.3 - 401.5 595.0

-15-
Company statement of cash flowsFiscal year from October 1 through September 30 (EUR million)
2018 2017*Restated
Operating profit before tax from continuing operations 80.5 81.0Operating profit before tax from discontinued operations 343.4 137.7Operating profit before tax 423.9 218.7
Adjustments to reconcile operating profit to net cash flow:Depreciation, amortization, and impairment losses 13.8 9.1Change in provisions -22.9 -3.2
Working capital adjustments:Change in receivables 63.6 6.8Change in inventories 0.5 -0.2Change in trade and other payables -115.1 -49.7
Interest received 0.0 0.5Interest paid -3.3 -3.6Tax payments (income taxes) -20.5 -72.1Net cash flows from operating activities 340.0 106.3
Disposal of investments, net of cash 44.5 -Payments for property, plant, and equipment -0.9 -7.2Proceeds from sale of property, plant, and equipment - 1.5Net cash flows from/used in investing activities 43.6 -5.7
Change in financing receivables -191.2 68.0Dividends paid -193.4 -169.1Net cash flows used in financing activities -384.6 -101.1
Change in cash and cash equivalentsCash and cash equivalents at October 1 2.1 2.6Cash and cash equivalents at September 30 1.1 2.1
-1.0 -0.5
The notes are an integral part of these company financial statements.
-16-
Notes to the company statement of financial position and the company incomestatement
General disclosures
The company financial statements of Siemens Nederland N.V. (hereafter “the Company”), having its legal seat in The Hague,
the Netherlands, as of September 30, 2018 were approved for publication on the basis of a resolution of the Management
Board and Supervisory Board of December 6, 2018 and will be filed with The Chamber of Commerce, The Hague under
registration number 27015771.
Siemens Nederland N.V. focused its activities in fiscal year 2018 on five divisions namely Power and Gas, Energy
Management, Building Technologies, Digital Factory and Process Industries and Drives. The portfolio includes products,
systems, installations and services. Siemens Nederland N.V. has more than 1,500 employees, making it one of the largest
electrical and electronics engineering companies in the Netherlands. It is a wholly-owned subsidiary of Siemens International
Holding B.V., The Hague, and forms part of the tax group led by Siemens International Holding B.V. All members of this group
are jointly and severally liable for the taxes payable by the tax group. Siemens International Holding B.V. is ultimately a wholly-
owned subsidiary of Siemens AG, which has its headquarters in Berlin and Munich, Germany.
Unless stated otherwise, all amounts are in millions of euros.

-17-
Accounting policies
(1) Basis of preparation
(1.1) Declaration of conformity
The company financial statements of Siemens Nederland N.V. have been prepared in accordance with the International
Financial Reporting Standards as adopted in the European Union as of September 30, 2018 (IFRS) applicable to fiscal years
ended as of September 30, 2018.
(1.2) Measurement basis
Unless stated otherwise, the company financial statements have been prepared on the basis of historical cost, with the
exception that derivative financial instruments are measured at fair value and any changes in value are recognized in the
income statement; the methods for determining fair value are explained in more detail in note 4.
The financial statements are presented in euros, the Company's functional currency.
(1.3) Changes to accounting policies
Newly applied standards
The Company has applied all relevant IFRS standards and IFRIC interpretations in effect and adopted by the European Union
as of September 30, 2018 and applicable to fiscal years ended on September 30, 2018.
IFRS 15 Revenue from Contracts with Customers
This standard replaces IAS 18 Revenue and IAS 11 Construction Contracts and sets out a single framework for revenue
recognition. Its core principle is that an entity recognizes revenue to depict the transfer of promised goods or services to
customers in an amount that reflects the consideration to which the entity expects to be entitled in exchange for those
goods or services. The Company early-adopted IFRS 15 retrospectively as of October 1, 2017 i. e. the comparable prior
year period is presented in accordance with IFRS 15 (using practical expedients). The adoption had no material impact on
the line items of the Company income statement; total cash flows from operating, investing and financing activities were not
impacted in fiscal 2017. The following table summarizes the impacts of adopting IFRS 15 on Company’s statement of
financial position (mainly reclassifications):
Company financial position As of september 30, 2017In millions of EUR Previously reported Adjustments RestatedTotal assets 849.2 18.5 867.7Thereof Contract assets 0.0 84.0 84.0Thereof Projects in process on 223.4 -223.4 0.0the instructions of third parties
Thereof Prepayments 0.0 157.9 157.9
Total liabilities 462.2 18.5 480.7
Thereof Contract liabilities 0.0 269.5 269.5Thereof Trade and other payables 385.7 -242.7 143.0Thereof Provisions 65.9 -8.3 57.6
Total Equity 387.0 0.0 387.0

-18-
Company financial position As of october 1, 2016In millions of EUR Previously reported Adjustments RestatedTotal assets 976.5 0.0 867.7Thereof Contract assets 0.0 76.5 76.5Thereof Projects in process on 194.6 -194.6 0.0 the instructions of third parties
Thereof Prepayments 0.0 118.1 118.1
Total liabilities 615.4 0.0 615.4
Thereof Contract liabilities 0.0 230.5 230.5Thereof Trade and other payables 440.2 -224.0 216.2Thereof Provisions 73.8 -6.4 67.4
Total Equity 361.1 0.0 361.1
New disclosure requirements under IFRS 15 are amongst others the disclosure of the order backlog and its reach and the
new balance sheet positions Contract asset and Contract liabilities.
The revenue of 2017 was restated with million 2.5 EUR (Geographical area Asia and segment Process Industries & Drives)
offset to Cost of sales with no impact on the gross profit.
Standards issued but not yet effective
IFRS 16 Leases
This standard replaces IAS 17 and provides a single lessee accounting model, requiring lessees to recognize assets and
liabilities for all leases unless the lease term is 12 months or less or the underlying asset has a low value. A lessee
measures right-of-use assets similarly to other non-financial assets (such as property, plant and equipment) and lease
liabilities similarly to other financial liabilities. As a consequence, a lessee recognizes depreciation of the right-of-use asset
and interest on the lease liability. As a consequence, a lessee recognizes depreciation of the right-of-use asset and interest
on the lease liability. IFRS 16 is effective for annual periods beginning on or after January 1, 2019. The Company will adopt
the standard for the fiscal year beginning as of October 1, 2019, by applying the modified retrospective approach, i. e.
comparative figures for the preceding year will not be adjusted.
Currently, it is expected that the majority of the transition effect relates to real estate leased by the Company. By applying
IFRS 16, straight-line operating lease expense will be replaced by depreciation expense on right-of-use assets and interest
expense on lease liabilities. This results in a deterioration in cash flows from financing activities and an improvement in cash
flows from operating activities. The Company is currently assessing further impacts of adopting IFRS 16 on the Financial
Statements. It is intended to use most of the simplifications available under IFRS 16.
IFRS 9 Financial Instruments
This standard replaces IAS 39 and specifies how an entity should classify and measure financial assets, financial liabilities,
and some contracts to buy or sell non-financial items. IFRS 9 requires an entity to recognize a financial asset or a financial
liability in its statement of financial position in a category reflecting the measurement, which is based on the contractual
cash flow characteristics and the entity’s business model for managing the financial asset.
The Company will adopt IFRS 9 for the fiscal year beginning as of October 1, 2018 and will not adjust comparative figures
for the preceding fiscal year, in accordance with IFRS 9 transitional provisions. The Company has analyzed its existing

-19-
positions for differences in recognition between the existing standard and IFRS 16 and expects no impact on the
measurement and limited impact on the valuation from the transition.
The Company has not yet assessed the effects of the new disclosure requirements on its financial statements.
The Company will adopt the IFRS 9 hedge accounting rules prospectively from October 1, 2018.
(1.4) Scope of consolidation
The prior year consolidated financial statements included the financial statements of the subsidiary Siemens Healthcare B.V.
which was classified as held for sale. All companies are accounted for as subsidiaries if the Company has control over the
entity's management and financial policies on the basis of additional arrangements. Since January 2018 the company has
sold all her equity investments. As a consequence, the company has no subsidiaries to consolidate and therefore no
consolidated statements are presented anymore.
As of September 30, the Company held the following equity investments:
NameRegisteredoffice
Share of issued capitalas of September 30, 2018
Share of issued capitalas of September 30, 2017
Siemens HealthcareNederland B.V. The Hague - 100%

-20-
(2) Significant judgments, estimates, and assumptions used in this report
Operating lease liabilities – the Company as lessor
The Company leases out various building security installations. The Company has determined that it has retained all
significant risks and rewards incidental to ownership of these assets and therefore accounts for them as operating leases.
Significant accounting judgements, estimates and assumptionsThe most important assumptions about the future and other significant sources of uncertainty associated with estimates as of
the reporting date, which entail a major risk of substantial adjustment to the carrying amounts of assets and liabilities in the
next fiscal year, are presented below.
Impairment of goodwill
At least once a year, the Company tests goodwill for impairment. This involves estimating the value in use of the cash
generating units to which the goodwill has been allocated. To estimate value in use, management must estimate the expected
future cash flows of the cash generating unit and determine an adequate discount rate for calculating the present value of
these cash flows. The goodwill carrying amount as of September 30, 2018 was EUR 9.5 million (September 30, 2017: EUR 9.8
million). See note 6 for further information.
Pension and other post-employment benefit plans
The costs of post-employment defined benefit plans are determined based on actuarial methods. The actuarial methods
comprise assumptions made about discount rates, expected returns on plan assets, future salary increases, mortality rates,
and the future indexation of pension payments. Because of the long-term nature of these plans, such estimates are subject
to significant uncertainty. The estimate at the beginning of the fiscal year determines the net periodic cost of the fiscal year.
At the end of the fiscal year, the amount of the pension provision is recalculated based on actual figures for the year ended
and adjusted actuarial assumptions about the future. After this recalculation, differences in the net obligation as a result of
adjustments to assumptions and/or variations in estimates are added to pension provisions and the corresponding expense
or income recognized directly in equity (actuarial gains or losses). The defined benefit arrangement only relates to an
executive management plan without active participants, since it was discontinued in the prior fiscal year. See note 20 for
further information.
Revenue recognition for projects
A significant portion of the company’s revenue is generated in long-term projects. Revenue is recognized in line with the stage
of completion of the project in process. For each project, the total revenue to be generated is determined, based on contract
value. In addition, the total costs to be incurred to complete the project are estimated. During the project, project revenue is
recognized based on the ratio of costs incurred to total expected costs. In doing so, only progress-relevant costs are taken
into consideration. Revenue is not recognized for costs that are temporarily not progress-relevant, but these costs are
presented as prepayments in the statement of financial position. Costs that are permanently not progress-relevant are directly
charged to the income statement without recognizing revenue. The estimation element of the cost-to-cost variant of the
percentage of completion method requires estimates and continual updates of the total expected costs.

-21-
(3) Accounting policies
(3.1) Goodwill
Goodwill, which arises during the acquisition of equity interests and/or independent business units, is the amount by which
the cost of the business combination exceeds the acquirer's interest in the net fair value of the identifiable assets, liabilities,
and contingent liabilities.
Goodwill is measured at cost less any accumulated impairment losses.
Goodwill is not amortized but tested annually for impairment. This is done more often if events or changes in circumstances
indicate that the carrying amount may be impaired. The impairment loss to be recognized is determined based on an
assessment of the net realizable value of the cash generating unit to which the goodwill has been allocated. If the net realizable
value of the cash generating unit is lower than it’s carrying amount, an impairment loss is recognized.
(3.2) Other non-current intangible assets
Non-current intangible assets include, among other things, the direct costs of designing, building, testing, setting up, and
customizing an enterprise resource planning (ERP) system for internal use and for use by other corporate units. These direct
costs are amortized over the expected useful life of 3 years.
(3.3) Property, plant, and equipment
Property, plant, and equipment is initially recognized at cost. Property, plant, and equipment is depreciated using the straight-
line method over the estimated useful lives of the assets; a residual value of zero is assumed (except for land). Depreciation
of investments made in the current period commences on the date the asset is used for the first time.
Machinery and installations are depreciated applying the component approach, under which the depreciation period is
differentiated according to the nature of the asset. Land is not depreciated.
The annual straight-line depreciation charges, expressed as a percentage of cost, are as follows:
%Land and buildings 0 to 2.5Machinery and installations 10 to 25Other durable operating assets 20 to 33
In the case of major investment projects, financing costs incurred during construction are recognized as part of the cost of the
item of property, plant, and equipment concerned.
Capitalized leased assets are depreciated over the shorter of estimated useful life or lease term of the asset, if there is no
reasonable assurance that Siemens will take ownership at the end of the lease term.
Assets held for sale are measured at the lower of their carrying amounts or fair value less costs to sell.
(3.4) Impairment of other non-current intangible assets and property, plant, and equipment
The carrying amounts of other non-current intangible assets and property, plant, and equipment are tested for impairment if
there have been changes or circumstances that suggest that the carrying amount of the asset may not be recovered. The
recoverability of assets in use is determined by comparing their carrying amounts with the present value of the future net cash
flows the assets are expected to generate. If the carrying amount of an asset is higher than the estimated future cash flows

-22-
or the direct realizable value less costs to sell, an additional write-down is recognized and charged to the income statement
for the difference between the carrying amount and the net realizable value of the asset. Assets available for sale are
measured at the lower of carrying amount or market value less costs to sell.
(3.5) Non-current financial assets
Receivables arising from financial leases are measured at the present value of the lease installments still to be received.
Other non-current receivables as well as receivables arising from the equity investments are measured at amortized cost less
any allowances deemed necessary for receivables that may be uncollectable.
(3.6) Inventories
Inventories of merchandise and semi-finished goods are measured at the lower of average cost or market value. Allowances
necessary as a result of obsolescence are recognized on these amounts.
(3.7) Receivables
Receivables are initially recognized at fair value (including transaction costs) and subsequently at amortized cost less any
allowances deemed necessary for receivables that may be uncollectable. Receivables include liquid assets that are placed
in interest-bearing investments within the Siemens Group as part of cash pooling.
(3.8) Contract assets and liabilities
When either party to a contract with customers has performed, the company presents a contract asset, a contract liability or
a receivable depending on the relationship between Siemens’ performance and the customer’s payment. Contract assets
and liabilities are presented net as current since incurred in the operating cycle. Receivables are recognized when the right
to consideration becomes unconditional. Valuation allowances for credit risks are setup for contract assets and receivables
according to the accounting policy for loans and receivables.
(3.9) PrepaymentsPrepayments are initially recognized at fair value (including transaction costs) and subsequently at amortized cost less any
allowances deemed necessary for receivables that may be uncollectable.
(3.10) Cash and cash equivalents
Cash and cash equivalents are measured at nominal values. Cash and cash equivalents include all credit balances with
banks, excluding affiliated companies, and short-term, highly liquid investments with an original maturity of three months or
less, which can be directly converted into cash and cash equivalents.
(3.11) Provisions
General
Provisions are recognized, if:
(a) there is a legal or constructive obligation because of a past event;
(b) it is probable that an outflow of resources will be required to settle the obligation; and
(c) the amount of the obligation can be reliably estimated.
If the Company expects to receive compensation for the provision in full or in part, for example because of an insurance
policy, the compensation is recognized as a separate asset, providing it is virtually certain that the compensation will be

-23-
received. The expense incurred in connection with the provision is recognized in the income statement, less any
compensation. If the effect of the time value of money is material, the provisions are discounted to present value by applying
a discount rate before tax, which, where applicable, considers the specific risks associated with the obligation. If the provision
is discounted, the increase in the provision with the passage of time is charged to financing costs.
Warranty provisions
Warranty provisions relate to warranties issued on products, systems, and projects sold. They are measured at the present
value of the expected settlement costs. These settlement costs are estimated based on costs the Company has incurred in
the past for the sale of comparable products and/or based on technical assessments. The majority of warranty obligations
have duration of one to two years.
Onerous contracts
A provision for onerous contracts is recognized in the statement of financial position, if the benefits expected to be generated
for the Company from a contract are lower than the unavoidable costs of meeting the obligations under the contract. The
provision is measured at the present value of the costs expected to terminate the contract or, if lower, the present value of
the net costs expected to continue to perform the contract. Before recognizing a provision, the Company recognizes any
impairment write-downs on the assets related to the contract.
(3.12) Pensions
Defined contribution plans
Defined contribution plans are post-employment benefit plans under which an entity pays fixed contributions into a separate
entity and will have no legal or constructive obligation to pay further contributions. Obligations in connection with contributions
to defined contribution plans are recognized as personnel expenses in the income statement when the amounts fall due.
Amounts paid in advance are recognized as assets, providing they can be repaid in cash or offset against future payments.
Defined benefit plans
Defined benefit plans are post-employment benefit plans other than defined contribution plans. The net obligation of the
Company arising from defined benefit plans is calculated separately for each plan by estimating the pension benefits the
employees have accrued in exchange for their services in the reporting period and in prior periods. These pension benefits
are discounted to determine present value. Any unrecognized past service costs and the fair value of plan assets are
deducted. The discount rate reflects the yields at the reporting date on prime-rated corporate bonds with maturities that
approximate those of the liabilities of the company. They are denominated in the same currency in which the benefits are
expected to be paid. The calculation is made by an actuary annually using the projected unit credit method. Actuarial gains
or losses are recognized directly in equity. As of April 1, 2011, only the executive management pension plan qualified as a
defined benefit plan. See note 19 for further information.
If the calculation results in a positive balance for the company, the asset recognized is limited to an amount that is no higher
than the present value of economic benefits in the form of any future refunds from the plan or reductions in future contributions
to the plan. An economic benefit is available to Siemens Nederland N.V. if it can be realized during the term of the plan or on
settlement of the obligations of the plan.
(3.13) Non-current liabilities
Non-current liabilities are initially recognized at fair value (including transaction costs) and subsequently measured at
amortized cost. Share premiums, discounts, redemption premiums, and transaction costs are allocated to the respective
periods as interest expenses using the effective interest method.

-24-
(3.14) Leases
The determination of whether an arrangement is, or contains, a lease is based on the economic substance of the arrangement
at its inception and requires an assessment of whether fulfillment of the arrangement depends on the use of one or more
specified assets and whether the arrangement transfers the right to use that asset. A reassessment of the lease after its
inception is made only if any one of the following conditions is met:
(a) There is a change in the contractual terms, unless the change only renews or extends the arrangement;
(b) A renewal option is exercised, or an extension is agreed to, unless the term of the renewal or extension had initially been
included in the lease term;
(c) There is a change in the determination of whether fulfillment is dependent on a specified asset; or
(d) There is a substantial change to the asset.
If an arrangement is reassessed and is determined to contain a lease (or not to contain a lease), lease accounting is applied
(or ceases to apply) according to the new circumstances from:
(a) If condition a, c, or d is met, the time when the change in circumstances occurs that gives rise to the reassessment;
(b) If condition b is met, the start of the extension period.
The Company as lessee
Operating lease installments are recognized as expenses in the income statement on a straight-line basis during the lease
term.
The Company as lessor
Leases under which the Company retains virtually all risks and rewards of ownership of the asset are classified as operating
leases. The initial costs incurred while negotiating an operating lease are added to the carrying amount of the leased asset.
Leases under which the Company transfers virtually all risks and rewards of ownership of the asset to the customer are
classified as finance leases. If the leased item is a Siemens product or installation, the initial costs are not capitalized but
deducted from the sales margin. If the leased item is not a Siemens product or installation, the initial costs are recognized as
part of the lease receivable.
(3.15) Other assets and liabilities
Other assets and liabilities (if they are financial instruments) are initially recognized at fair value (including transaction costs)
and subsequently measured at amortized cost, with the carrying amount of other assets adjusted where necessary.
(3.16) Foreign currency translation
Monetary assets and liabilities denominated in foreign currency are measured at the rate as of the reporting date. Income and
expenses denominated in foreign currency are translated at the transaction rates in the respective accounting period.
(3.17) Revenue
Revenue recognition – Siemens recognizes revenue, when or as control over distinct goods or services is transferred to the
customer; i. e. when the customer is able to direct the use of the transferred goods or services and obtains substantially all
of the remaining benefits, provided a contract with enforceable rights and obligations exists and amongst others collectability
of consideration is probable taking into account our customer’s creditworthiness. Revenue is the transaction price Siemens
expects to be entitled to. Variable consideration is included in the transaction price if it is highly probable that a significant
reversal of revenue will not occur once associated uncertainties are resolved. The amount of variable consideration is
-25-
calculated by either using the expected value or the most likely amount depending on which is expected to better predict the
amount of variable consideration. Consideration is adjusted for the time value of money if the period between the transfer of
goods or services and the receipt of payment exceeds twelve months and there is a significant financing benefit either to the
customer or Siemens. If a contract contains more than one distinct good or service, the transaction price is allocated to each
performance obligation based on relative stand-alone selling prices. If stand-alone selling prices are not observable, the
Company reasonably estimates those. Revenue is recognized for each performance obligation either at a point in time or
over time.
Sales from construction-type contracts: Revenues are recognized over time under the percentage-of-completion method,
based on the percentage of costs incurred to date compared to total estimated costs. An expected loss on the contract is
recognized as an expense immediately. Payment terms are usually 30 days from the date of invoice issued according to the
contractual terms. The percentage-of-completion method places considerable importance on accurate estimates of the extent
of progress towards completion and may involve estimates on the scope of deliveries and services required for fulfilling the
contractually defined obligations. These significant estimates include total estimated costs, total estimated revenues, contract
risks, including technical, political and regulatory risks, and other judgments. Under the percentage-of-completion method,
changes in estimates may lead to an increase or decrease of revenue. In addition, Siemens needs to assess whether the
contract is expected to continue or to be terminated. In determining whether the continuation or termination of a contract is
expected to be the most likely scenario, all relevant facts and circumstances relating to the contract are considered on an
individual basis.
Revenues from services: Revenues are recognized over time on a straight-line basis or, if the performance pattern is other
than straight-line, as services are provided, i. e. under the percentage-of-completion method as described above. Payment
terms are usually 30 days from the date of invoice issued according to the contractual terms.
Sale of goods: Revenues are recognized at a point in time when control of the goods passes to the buyer, usually upon
delivery of the goods. Invoices are issued at that point in time and are usually payable within 30 days.
(3.18) Interest incomeIncome is recognized as the interest accrues (using the effective interest method, i.e., the interest rate that discounts the
estimated future cash inflows during the expected useful life of the financial asset to the net carrying amount of the financial
asset).
(3.19) Income taxes
Current taxes
Current taxes receivable and payable for current and prior years are measured at the amount that is expected to be paid or
recovered within the tax group. The tax amount is calculated based on the substantively enacted tax rates and tax laws.
Deferred taxes
For deferred tax liabilities, provisions are recognized based on the temporary differences as of the reporting date between
the tax bases of assets and liabilities and the carrying amounts recognized in these financial statements. Deferred tax assets
are recognized for all recoverable temporary differences, unused tax credits, and unused tax loss carry forwards, to the extent
that it is probable that taxable profit will be available to offset the recoverable temporary differences, and the recoverable
temporary differences, unused tax credits, and unused tax loss carry forwards can be utilized.
The carrying amount of deferred tax assets is assessed as of the reporting date and reduced to the extent that it is not
probable that sufficient tax profit will be available against which the temporary difference can be fully or partially utilized.
Unrecognized deferred tax assets are reassessed as of the reporting date and recognized to the extent that it is probable that

-26-
sufficient tax profit will be available in the future against which this deferred tax asset can be utilized Deferred tax assets and
liabilities are measured using the tax rates expected to be applicable to the period in which the asset is recovered or the
liability settled, on the basis of the enacted tax rates and tax laws.
Taxes on items directly recognized in equity are likewise recognized in equity instead of the income statement.
Deferred tax assets and liabilities are offset if there is a legally enforceable right to settle tax assets and liabilities on a net
basis and the deferred tax amounts are levied by the same taxing authority on the same taxable entity.
Tax group
Siemens Nederland N.V. and other group companies form a tax group with its parent company in the Netherlands for the
levying of corporation tax. The Group forms a tax group with its parent company for value added tax.
(3.20) Company statement of cash flows
The company statement of cash flows has been compiled using the indirect method. Bank overdrafts that can be drawn
directly and form an integral part of the companies' liquidity management are included under cash and cash equivalents in
the statement of cash flows. Any surplus of cash and cash equivalents is invested with financial institutions of the Siemens
Group. If there is any shortfall of cash and cash equivalents, it is borrowed from the same financial institutions. For this reason,
changes in financing receivables from and liabilities to affilated companies are reported in the statement of cash flows not as
changes in working capital, but on a net basis as cash flows from financing activities.
(3.21) Financial instruments
Siemens Nederland N.V. uses financial instruments and derivatives in the normal course of business. These instruments are
recorded under assets and liabilities.
Non-derivative financial instrumentsNon-derivative financial instruments include trade receivables, non-current receivables and other receivables, cash and cash
equivalents, borrowings and other financing liabilities, trade payables, and other items payable. Cash and cash equivalents
include cash and bank balances as well as other directly callable deposits. Non-derivative financial instruments are initially
recognized at fair value (including transaction costs) and subsequently measured at amortized cost using the effective interest
method, reduced by impairment losses.
Derivative financial instruments and hedging activitiesSiemens Nederland N.V. uses derivative financial instruments, such as forward currency contracts are used, to hedge foreign
currency risks. Such derivative financial instruments are initially recognized at fair value on the date on which a derivative
contract is entered into and are subsequently remeasured at fair value. Derivatives are carried as financial assets when the
fair value is positive and as financial liabilities when the fair value is negative. The purchase contracts that meet the definition
of a derivative under IAS 39 are recognized in the statement of profit and loss as cost of sales. Any gains or losses arising
from changes in the fair value of derivatives are taken directly to profit or loss. The Company applies hedge accounting, using
the cash flow hedging method. When entering into a cash flow hedge, the hedging relationship is designated and documented,
as are the purpose and financial risk management strategy pursued in entering into the hedging transaction. The
documentation provides information about the hedging instrument, the hedged item or transaction, the type of risk to be
hedged, and how the Company will assess the effectiveness of the hedging instrument in offsetting the risk of changes in the
fair value of the hedged item or in the cash flows attributed to the hedged risk. These types of hedges are expected to be
highly effective in offsetting the changes in fair value or cash flows attributable to the hedged risk; they are continually
assessed to determine whether the hedge was substantially highly effective during the reporting periods for which the hedge

-27-
was intended. Under cash flow hedging any change in fair value of the effective portion of the hedged item is recognized as
an asset or liability and the corresponding gain or loss is recognized in other comprehensive income.
(3.22) Subsidies
Subsidies reduce the costs in the line item to which the costs of the subsidized activities were charged. Subsidies are
recognized as soon as there is reasonable assurance that the subsidy will be paid. Main subsidies are from the “WBSO”.
Under this Act, a contribution is paid towards the wage costs of employees directly involved in R&D. The contribution is in the
form of the payroll tax reduction and social security contributions. Subsidies are only recognized in profit & loss when the
related costs are incurred.
(3.23) Share-based payment
The Company grants stock awards as a means for providing share-based compensation to members of the senior
management. Stock awards are subject to a restriction period of about four years and entitle the beneficiary to Siemens AG
shares without payment of consideration following the restriction period. Since fiscal 2012, the allocation of stock awards is
tied to corporate performance criteria. The target attainment for the performance criteria ranges between 0% and 200%.
Half of the annual target amount for stock awards is based on the average of earnings per share (EPS, basic) of the past
three fiscal years. The target attainment determines the number of stock awards upon allocation. Settlement of these stock
awards is in shares following the four-year restriction period. The other half of the annual target amount for stock awards is
based on the share price performance of Siemens shares relative to the share price performance of five important Siemens
competitors (ABB, Alstom, General Electric, Rockwell and Schneider) during the four-year restriction period. The target
attainment is determined during the four-year restriction period for the stock awards and accordingly, determines the number
of Siemens shares ultimately transferred following the restriction period. If the target attainment is up to 100%, settlement is
in shares. If the target attainment exceeds 100% (up to 200%) an additional cash payment corresponding to the
outperformance results.
The Company decides each year whether to grant stock awards. The stock awards are granted once a year, within 30 days
of the publication of the financial results. Siemens AG decides annually about the number of stock awards to be granted to
individual members of the Management Board and the total number of stock awards to be distributed to members of the
senior management. The Management Board decides annually about the distribution among the senior management.
Other forms of share-based payment are the Share Matching Plan (SMP) and the Monthly Investment Plan (MIP). The SMP
is for senior management and the MIP is accessible to all employees. Under the SMP, members of senior management may
invest a percentage of their annual variable compensation in this plan. The shares are purchased at the market price at a
predetermined date. SMP participants receive the right to 1 bonus share in Siemens AG for every 3 investment shares
continuously held over a period of at least 3 years. Every year, Siemens AG decides whether to extend the SMP plan by
another year. Under the MIP, employees may invest a percentage of their monthly compensation in this plan. Shares are
purchased at the market price at a predetermined date during the month. Unlike the SMP, the right to bonus shares is not
granted directly. Siemens AG decides once a year whether the shares bought by employees under the MIP plan will be
transferred to the SMP plan, after which they will be processed in accordance with the SMP plan.
In the previous year Siemens introduced another scheme, which is eligible to all employees except for senior management.
This Siemens Profit Sharing (SPS) constitutes a voluntary and discretionary, decided by the Siemens AG board, distribution
of a part of the yearly Siemens Profit to employees below Senior Management of up to EUR 400 million annually in Siemens
Profit Sharing pool. The related costs are accrued over the expected period and charged to all Siemens companies. Since
this scheme is at the sole discretion of the Siemens AG board, no actual shares are awarded but only costs are accrued.
Depending on Siemens AG, the amounts if paid, are settled in cash or shares of Siemens AG.

-28-
For all awards and bonus shares provided, rights forfeit if the beneficiary's employment with the Company terminates during
the restriction period. During the restriction period, beneficiaries are not entitled to dividends for the awards and bonus shares.
The awards and bonus shares may not be assigned, sold, or pledged.
The Company pays Siemens AG a consideration for the awards and bonus shares provided and will account for the
transaction as a cash-settled share-based payment. The cost of these cash-settled transactions is measured initially at fair
value at the grant date. This fair value is expensed over the period until the vesting date with recognition of a corresponding
liability. The liability is re-measured to fair value at each reporting date up to, and including the settlement date, with changes
in fair value recognized as expense. The fair value in each fiscal year is calculated by applying a valuation model. Inputs to
that model include an expected weighted volatility of Siemens shares and a market price per Siemens share. Expected
volatility was determined by reference to historic volatilities.

-29-
(4) Fair value measurement
A number of policies and the Group's information provision requirements necessitate the determination of the fair values of
both financial and non-financial assets and liabilities. For measurement and information purposes, fair value has been
determined using the following methods. Where applicable, further information about the bases for determining fair value is
provided in the section of this note applicable specifically to the asset or liability concerned.
Property, plant and equipment
The fair value of property, plant and equipment in the Hengelo location is based on market value, which is based on the
price negotiated for these assets between Siemens and an external party.
Goodwill
The fair value of goodwill acquired as a result of a business combination is determined on the basis of the discounted
estimated future cash flows.

-30-
(5) Risk management
This section of the notes provides information on the exposure of the company to each of the risks itemized in the paragraphs
below, the purposes, policies, and procedures the company pursues to manage and measure those risks, as well as on the
capital management of the company. In addition, these company financial statements include further quantitative disclosures.
The Management Board is ultimately responsible for establishing and supervising the risk management system of the
company. To this end, the Management Board has established a risk management committee, which is responsible for
developing and monitoring the risk management policies of the company. The committee regularly reports on its activities to
the Management Board.
The aim of the risk policies of the company is to map out and analyze the risks, determine appropriate risk limits and controls,
and to monitor the risks and compliance with the limits. The risk management policies and systems are evaluated regularly
and adjusted where necessary to changes in the market environment and the Group's activities. Through training and
development as well as based on management standards and procedures, the company aims to develop a disciplined and
constructive climate in which all employees understand their roles and obligations.
The governance department of the company oversees management's monitoring of compliance with the Group's risk
management policies and procedures. In addition, the governance department deals with the adequacy of the risk
management system in relation to the risks to which the company is exposed. The governance department together with the
audit departments of Siemens AG conduct regular and ad hoc reviews of the risk management controls and procedures and
reports its findings to the Management Board.
(5.1) Financial risks
The use of financial instruments by the company means that they are exposed to the following risks:
· Credit risk;
· Market risk.
Credit riskCredit risk is the risk that a counterparty will not meet its obligations under a financial instrument or customer contract,
leading to a financial loss. The Company is exposed to credit risk from its operating activities (primarily trade receivables)
and from its financing activities.
Regarding trade receivable credit risk, the Company uses a risk management system of which credit risk monitoring and
control is a significant element. A credit check is performed on all customers requesting credit in excess of a specified
amount. Credit ratings are determined based on internal and external sources, such as Dun & Bradstreet. The Company
evaluates the concentration of risk with respect to trade receivables as low, as its customers are located in several
industries and operate in largely independent markets.
Siemens recognizes allowances for bad debt and doubtful accounts for the estimated credit risk, based on a combination of
the individual customer's credit rating and specific risks. Specific risks include, for example, a moratorium on payments, the
instigation of collection procedures, and payment arrangements made.
Market riskMarket risk is the risk that the he company's revenue or the value of investments in financial instruments are adversely affected
by changes in market prices, such as exchange rates, interest rates, and share prices. Market risk management is aimed at
keeping the market risk exposure within acceptable limits while optimizing returns. For managing market risk, the Company
enters into derivative financial instruments. These types of transactions are carried out in accordance with the guidelines

-31-
specified by the risk management committee. In general, the company uses hedge accounting to manage volatility in the
income statement.
Interest rate risks
On average in 2018, the Company held EUR 501.1 million (2017: EUR 366.4 million) in short-term deposits or on current
account with the treasury department of Siemens AG. Following market conditions, interest on these amounts is fixed for a
maximum of three months at arm’s length market rates. A change in the interest rate on the deposits of 10 basis points would
lead to a change in interest expense of EUR 0.5 million (2017: EUR 0.4 million) for the Company.
Foreign currency risks
The Company is exposed to foreign currency risks because of sales and purchases in currencies other than the functional
currency. The risk on virtually all sales and purchases denominated in foreign currency is hedged in full through forward
exchange contracts at the treasury department of Siemens AG. This approach has proved successful in the past in managing
these risks. The Company is responsible for its own administration, assessment, monitoring, and hedging of the currency
risks on sales and purchases. The FX derivative financial instruments at the end of the reporting period are not material.
Please refer to note 23.
(5.2) Liquidity risk
The Company manages its liquidity risk by managing the working capital and the deposits at its disposal, which are invested
within the Siemens Group, as well as cash and cash equivalents. In addition, the company manages its liquidity risk by making
use of the borrowing and deposit facilities within the Siemens Group.
(5.3) Capital management
The Company’s capital consists of: issued and paid in share capital, share premium reserves and retained earnings as stated
as Equity in the Statement of Financial position and the Statement of changes in Equity. The main purpose of capital
management at the company is to maintain a good credit rating and a healthy solvency ratio to support its activities and
maximize shareholder value. The Company is not subject to externally imposed capital requirements. The Company did not
change its objectives, policies and processes for capital management during the fiscal year.
(5.4) Operational risks
Professional project management is very important to Siemens, because a large proportion of its revenue is generated
through projects. Customers also expect that the projects are managed in an excellent, innovative, and responsible manner.
This applies in particular to major projects and turn-key projects.
To meet this expectation, Siemens has implemented a globally harmonized system: PM@Siemens.
This is a collective name given to a range of activities aimed at improving project management within Siemens. Examples
include process improvements, assessments and training. PM@Siemens is not a ready-made working method, but a set of
guidelines through which we provide good project management guidance that is consistent on key points. The focus of this
guidance is on the use of best practices. The aim is to harmonize the standards for good project management and sponsor
them within the organization.
In addition to improved project management, another reason Siemens has launched PM@Siemens is to ensure a uniform
project management culture. Siemens must act vis-à-vis customers as a partner with a recognizable mentality and
recognizable processes. This is part of the profile of expectations that customers have of us. It also helps determine
whether a customer will enter into an agreement with us.

-32-

-33-
Notes to the company statement of financial position
(6) Non-current intangible assets
Software anddevelopment
costs Goodwill TotalCarrying amount as of September 30, 2016Cost 35.1 9.8 44.9Amortization -35.1 - -35.1
- 9.8 9.8
ChangesAmortization charged to income - - -Divestment - - -
- - -Carrying amount as of September 30, 2017Cost 35.1 9.8 44.9Amortization -35.1 - -35.1
- 9.8 9.8
ChangesAmortization charged to income - - -Divestment (Mechanical Drives) - -0.3 -0.3
- -0.3 -0.3Carrying amount as of September 30, 2018Cost 35.1 9.5 44.6Amortization -35.1 - -35.1
- 9.5 9.5
Software includes internally developed software. This software operates on the ERP system for the Company's own use and
for use by other corporate units.
Once a year, an impairment test is performed to establish whether the value of Goodwill is not overstated. The discounted
value of expected future cash flows is then compared with the net carrying amount of the asset. The test is performed at
Division level, which is the level to which income and expenses can be allocated independently. Amounts are discounted
using a Division-specific cost of capital after tax. No (fixed) growth rate is assumed, because this would provide skewed
figures for the Divisions that primarily deal in projects.
Division Goodwill WACC
Power and Gas 7.7 8.0
Energy Management 0.2 8.0
Building Technologies 0.1 8.0
Digital Factory 1.1 8.5
Process Industries and Drives 0.4 8.0
9.5
The discounted cash flows exceeded the net carrying amounts in all cases, which means that the amount in the Division's
statement of financial position is not overstated. As in previous years, there is no indication that goodwill must be impaired in
the fiscal year under review. Reasonably possible changes in a key assumption would not cause the carrying amount to

-34-
exceed its recoverable amount and consequently no sensitivity analysis is disclosed.
The goodwill recognized in the statement of financial position of the Company consists primarily of goodwill that arose during
the acquisition of the sales department for The Netherlands of the former Siemens Industrial Turbomachinery B.V. in Hengelo
in fiscal year 2005-2006. This department has since been integrated into the Power and Gas Division of Siemens Nederland
N.V. There is no accumulated impairment on Goodwill.
(7) Property, plant and equipment
Land andbuildings
Machineryand
installations Inventories
Non-currentoperatingassets inprocess Total
Carrying amount as ofSeptember 30, 2016Cost 11.2 23.9 19.9 3.3 58.3Depreciation -5.0 -17.8 -16.6 0.0 -39.4
6.2 6.1 3.3 3.3 18.9
ChangesTransfers, cost 2.3 2.1 1.9 -2.5 3.8Transfers, depreciation -1.5 - -1.4 - -2.9Investments 1.7 0.2 1.0 1.6 4.6Depreciation charged to income -1.0 -2.0 -1.4 - -4.5Divestments, cost -0.1 -0.6 -2.1 - -2.8Divestments, depreciation 0.1 0.6 1.9 - 2.6
1.5 0.3 -0.1 -0.9 0.8
Carrying amount as ofSeptember 30, 2017Cost 15.2 25.6 20.7 2.4 63.9Depreciation -7.5 -19.2 -17.5 - -44.2
7.7 6.4 3.2 2.4 19.7
ChangesTransfers, cost 0.1 2.1 0.2 -2.4 -Transfers, depreciation - - - - -Investments 0.0 0.3 0.6 0.0 0.9Depreciation charged to income -1.1 -1.5 -1.5 - -4.1Divestments, cost -0.1 -0.5 -1.0 - -1.6Divestments, depreciation 0.1 0.5 0.9 - 1.5Impairment -1.7 -6.9 -1.1 - -9.7
-2.8 -6.0 -1.9 -2.4 -13.0
Carrying amount as ofSeptember 30, 2018Cost 15.2 27.5 20.6 - 63.3Depreciation -10.2 -27.1 -19.3 - -56.6
5.0 0.4 1.3 - 6.7
An impairment of EUR 9.7 million has been recognized following the transfer of our fixed assets in Hengelo with a
recoverable amount of nil (their fair market value less cost to sell).

-35-
The carrying amount of installations supplied under operating leases amounted to EUR 0.3 million as of September 30, 2018
(2017: EUR 0.5 million). The investments made in these assets during the year amounted to EUR 0.0 million (2017: EUR 0.0
million).
The cost of property, plant and equipment still in use at September 30, 2018 was EUR 48.5 million (2017: EUR 28.0 million),
which had been depreciated in full. The contractual obligations to acquire property, plant, and equipment amounted to
EUR 0.0 million as of September 30, 2018 (2017: EUR 0.2 million).
(8) Investments in associates and joint ventures
At the end of fiscal year 2018 the company had no equity investments anymore as a result of the sale of the mobility and
healthcare businesses.
Name Registered office
Percentage of issuedcapital
as of September 30, 2018
Percentage of issuedcapital
as of September 30, 2017
Infraspeed Maintenance B.V. Haarlem - 50.0
Siemens Healthcare BV Den Haag - 100.0
The equity investment in Infraspeed Maintenance B.V. has been sold as part of the Mobility business.
(9) Non-current receivables2018 2017
Loans - 2.3Unbilled revenue and prepayments 6.4 5.2
6.4 7.5
Unbilled revenue and prepayments mainly relate to the sublease of part of The Hague office, in which performance and
payment scheme differs.
10) Contract assets and contract liabilities
Contract assets 2018 2017Contract assets 93.3 84
Provision on contract assets -4.1 -0.1
Total contract assets 89.2 83.9
Current 60.0 61.1
Noncurrent 29.2 22.8
Contract liabilitiesRefund liabilities
- Penalties 17.2 8.3
- Price and quantity discounts* 3.7 -
Advance payments from 3rd parties 49.4 25.2
Billings in excess of costs 119.4 236.0
Total contract liabilities 189.7 269.5

-36-
Current 134.6 203.8
Noncurrent 55.1 65.7
Contract assets did not significantly change. Significant change in contract liabilities amounts to million 79.8 EUR resulted
mainly from business combinations.
* was included in trade receivables in fiscal year 2017 for an amount of EUR 3.9 million
(11) Inventories
As of September 30, 2018, a provision of EUR 4.5 million had been recognized for obsolescent inventories (2017: EUR 6.1
million).
(12) Trade and other receivables2018 2017
Trade receivables 100.5 107.7Receivables from Affiliated Companies 609.9 419.1Other receivables 4.4 4.9
714.8 531.7
Most of the receivables from companies that are part of the Siemens Group relate to receivables on funds temporarily placed
in interest-bearing deposits or current account within the Group. For more information, please refer to note 23 on financial
instruments.
The changes in allowances for uncollectible trade receivables were as follows:
2018 2017
At October 1 8.3 10.5Realized losses -0.6 -0.0Additions (withdraws) 2.3 -2.2
At September 30 10.0 8.3
The credit and currency risks associated with trade and other receivables (excluding projects in process on the instructions
of third parties) are explained in note 23.
Ageing analyses of receivables
Overdue in days
Totalreceivables Not overdue <31 31-60 61-90 91-180 > 180
2018 100.6 50.4 4.0 10.2 3.9 3.2 28.9
2017 107.7 56,7 4.0 10.6 1.4 9.7 25.3
The amount in overdue receivables of >180 days is mainly caused by difficulties in money collection from clients based inIran.
AllowanceAs at 2018 2017
Receivables Allowance Receivables Allowance
With allowance 99.9 10.0 107.1 8.3Without allowance 0.7 0.6
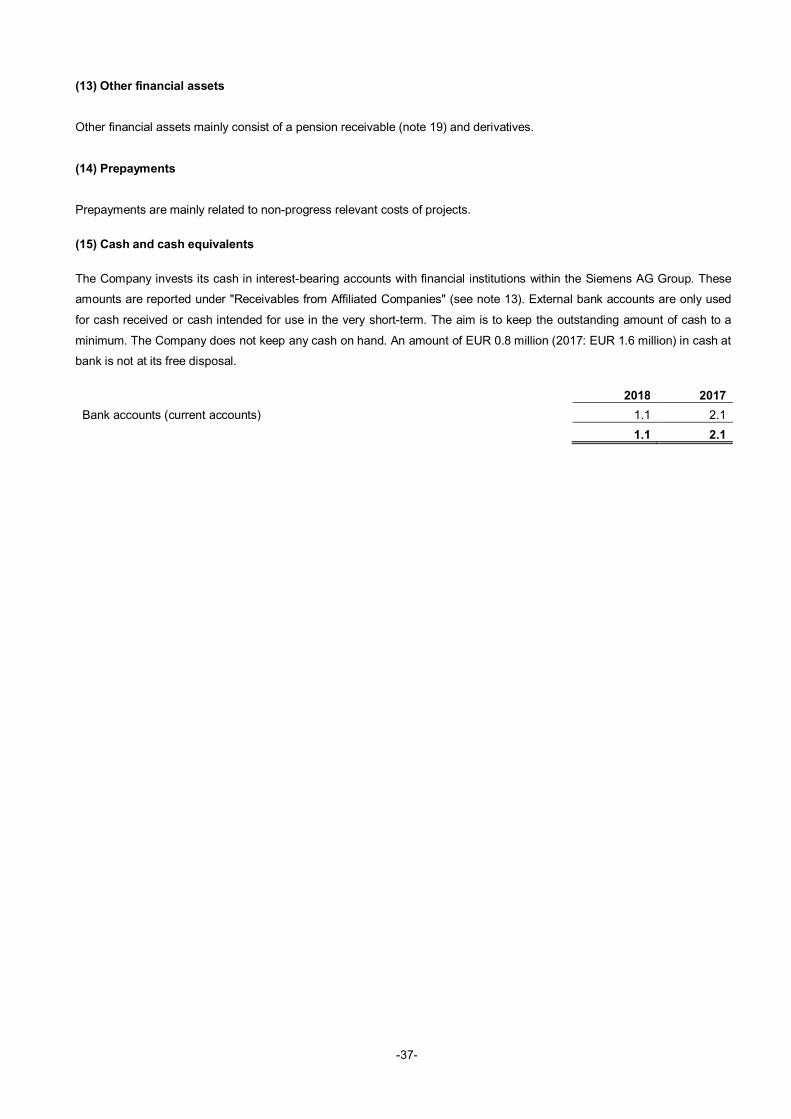
-37-
(13) Other financial assets
Other financial assets mainly consist of a pension receivable (note 19) and derivatives.
(14) Prepayments
Prepayments are mainly related to non-progress relevant costs of projects.
(15) Cash and cash equivalents
The Company invests its cash in interest-bearing accounts with financial institutions within the Siemens AG Group. These
amounts are reported under "Receivables from Affiliated Companies" (see note 13). External bank accounts are only used
for cash received or cash intended for use in the very short-term. The aim is to keep the outstanding amount of cash to a
minimum. The Company does not keep any cash on hand. An amount of EUR 0.8 million (2017: EUR 1.6 million) in cash at
bank is not at its free disposal.
2018 2017Bank accounts (current accounts) 1.1 2.1
1.1 2.1

-38-
(16) Assets held for sale and discontinued operations
Siemens Healthcare Nederland B.V.
The Company sold its Healthcare subsidiary on January 12, 2018 to another Siemens Group company, outside its
consolidation group. The income from this investment until the sale including the gain on the sale is shown under profit
from discontinued operations and amounted to EUR 253.3 million (2017: EUR 7.7 million).
The income statement of Healthcare is shown below.2018 2017
Revenue 38.2 122.7
Cost of sales 30.4 97.1Selling expenses 4.1 12.8General and administrative expenses 0.6 1.6Other operating expenses 0.0 0.0Operating income 3.2 11.2
Finance costs 0.0 0.7Profit from discontinued operations, before tax 3.2 10.5
Tax related to pre-tax profit -0.8 -2.8
Profit from discontinued operations, after tax 2.4 7.7
Gain on sale of business 250.9 -
Total profit from discontinued operations, after tax 253.3 7.7
The net cash flows of the held for sale Healthcare business is as follows:2018 2017
Net cash flows from operating activities -1.8 19.2
Net cash flows from/used in investing activities -0.7 -8.8
Net cash flows from/used in financing activities 2.5 10.4
Net cash flow 0.0 0.0

-39-
Wind Power
The Wind Power division has been sold on January 31st, 2017 to Siemens Gamesa. Below statements therefore only reflectthe first 4 months of fiscal year 2017.
The income statement of Wind Power is shown below.
2018 2017Revenue - 60.8
Cost of sales - 50.5Selling expenses - 0.7General and administrative expenses - 0.0Other operating expenses - -
Operating income - 9.6
Finance costs - 0.0Profit from discontinued operations, before tax - 9.6
Tax related to pre-tax profit - -2.1
Profit from discontinued operations, after tax - 7.5
Gain on sale of business - 113.0
Total profit from discontinued operations, after tax - 120.5
The net cash flows of the sold Wind Power business are as follows:2018 2017
Net cash flows from operating activities - -26.0
Net cash flows from/used in investing activities - 0.3
Net cash flows from/used in financing activities - 33.3
Net cash flow - 7.6
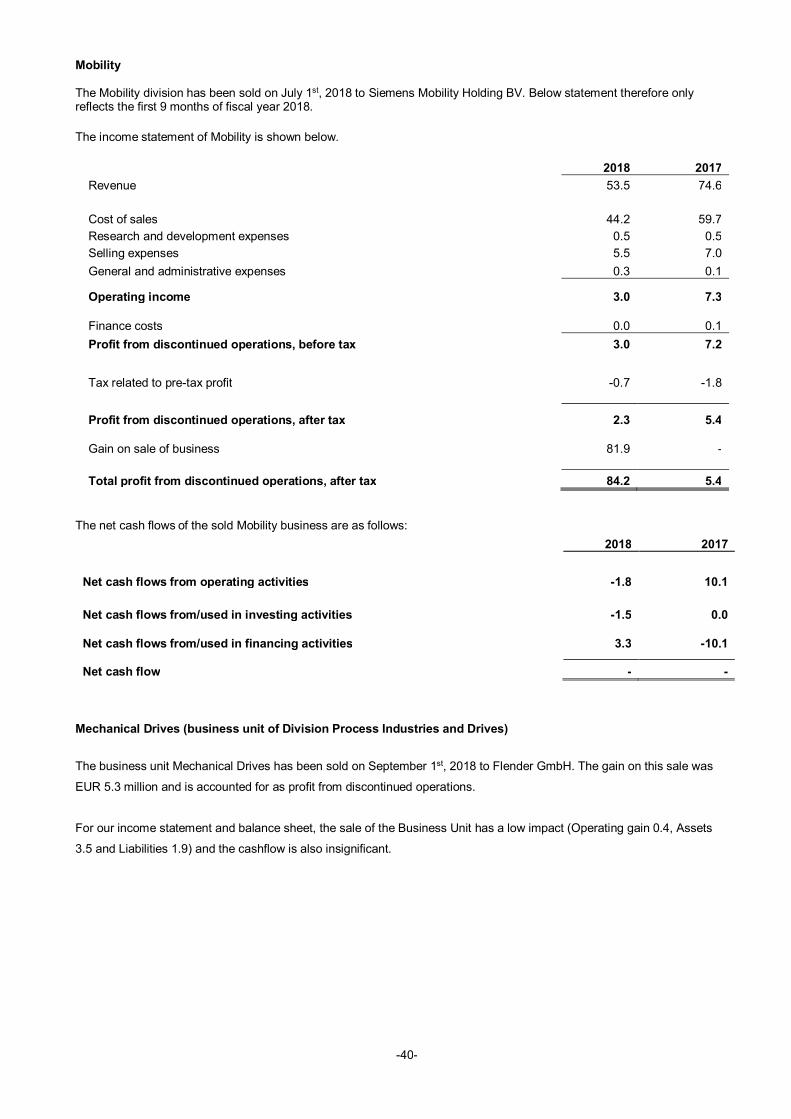
-40-
Mobility
The Mobility division has been sold on July 1st, 2018 to Siemens Mobility Holding BV. Below statement therefore onlyreflects the first 9 months of fiscal year 2018.
The income statement of Mobility is shown below.
2018 2017Revenue 53.5 74.6
Cost of sales 44.2 59.7Research and development expenses 0.5 0.5Selling expenses 5.5 7.0General and administrative expenses 0.3 0.1
Operating income 3.0 7.3
Finance costs 0.0 0.1Profit from discontinued operations, before tax 3.0 7.2
Tax related to pre-tax profit -0.7 -1.8
Profit from discontinued operations, after tax 2.3 5.4
Gain on sale of business 81.9 -
Total profit from discontinued operations, after tax 84.2 5.4
The net cash flows of the sold Mobility business are as follows:2018 2017
Net cash flows from operating activities -1.8 10.1
Net cash flows from/used in investing activities -1.5 0.0
Net cash flows from/used in financing activities 3.3 -10.1
Net cash flow - -
Mechanical Drives (business unit of Division Process Industries and Drives)
The business unit Mechanical Drives has been sold on September 1st, 2018 to Flender GmbH. The gain on this sale was
EUR 5.3 million and is accounted for as profit from discontinued operations.
For our income statement and balance sheet, the sale of the Business Unit has a low impact (Operating gain 0.4, Assets
3.5 and Liabilities 1.9) and the cashflow is also insignificant.

-41-
(17) Equity
Issuedcapital
Sharepremium
Retainedearnings
Cash flowhedge
Profit forthe year Total
At September 30, 2016 36.3 150.9 6.3 -1.5 169.1 361.1
Profit after tax - - - - 193.4 193.4
Other comprehensive income - - 0.1 1.5 - 1.6Total comprehensive income - - 0.1 1.5 193.4 195.0Dividends - - - - -169.1 -169.1Allocations to reserves - - - - - -At September 30, 2017 36.3 150.9 6.4 - 193.4 387.0
Profit after tax - - - - 401.5 401.5
Other comprehensive income - - -0.1 - - -0.1Total comprehensive income - - -0.1 - 401.5 401.4Dividends - - - - -193.4 -193.4At September 30, 2018 36.3 150.9 6.3 - 401.5 595.0
The retained earnings from prior years include cumulative actuarial gains and losses.
Issued capitalThe Company's share capital amounts to EUR 100 million, divided into in 100,000 shares with a nominal amount of EUR 1,000
each, 36,307 shares of the share capital have been issued and fully paid up.
Share premiumAll share premium is considered as paid-up capital from a tax perspective.
Dividends2018 2017
Declared and distributed during the year 193.4 169.1
2018 2017Proposed for approval by the Annual General Meeting (not recognized as a liability as 401.5 193.4of September 30)

-42-
(18) Deferred tax liabilities2018 Equity P&L 2017 Equity P&L 2016
Deferred tax assets:Provisions 0.1 - -0.0 0.1 - 0.0 0.1Other - - - - -0.5 - 0.5
0.1 - -0.0 0.1 -0.5 0.0 0.6
Deferred tax liabilities:Non-current intangible assets -1.9 - 0.0 -1.9 - -0.0 -1.9
Property, plant, and equipment -0.2 - 0.6 -0.8 - 0.1 -0.9Pensions -0.8 - - -0.8 - - -0.8Provisions 0.0 - 0.6 -0.6 - 0.6 -1.2
-2.9 - 1.2 -4.1 - 0.7 -4.8Net deferred tax liabilities -2.8 - 1.2 -4.0 -0.5 0.7 -4.2
All tax receivables and liabilities are recognized in the statement of financial position. There are no unused deferred tax
liabilities. For more information, please refer to note 28 on income taxes.
(19) Other financial obligations (included in non-current liabilities)
2018 2017Finance lease and hire purchase liabilities 1.4 1.6Other financial liabilities 1.7 1.9
3.1 3.5
Finance lease obligations are presented as follows in the statement of financial position:
2018 2017Short-term finance lease payables 0.2 0.1Long-term finance lease payables 1.4 1.6
1.6 1.7
The portion due within one year has been recognized under Trade and other payables.
The minimum lease payments to be made under finance leases and hire purchase agreements in the future are as follows:
2018 2017To be settled in 1st subsequent year 0.2 0.2To be settled in 2nd subsequent year 0.2 0.2To be settled in 3rd subsequent year 0.2 0.2To be settled in 4th subsequent year 0.2 0.2To be settled in 5th subsequent year 0.2 0.2To be settled after 5th year 0.7 0.9Minimum lease payments to be received in the future 1.7 1.9

-43-
The table below shows a reconciliation between the minimum lease payments and the gross and net lease investment to the
present value of the minimum lease payments:
2018 2017Minimum lease payments 1.7 1.9Gross investment in leases 1.7 1.9less: Finance income received in advance (unearned interest) -0.1 -0.2Net investment in leases 1.6 1.7Present value of minimum lease payments 1.6 1.7
The gross investment in leases and the present value of the minimum lease liabilities mature as follows:
2018 2017Gross lease investment 1.7 1.9
within 1 year 0.2 0.2within 1 to 5 years 0.8 0.8after 5 years 0.7 0.9
Present value of minimum lease payments 1.6 1.7within 1 year 0.2 0.1within 1 to 5 years 0.7 0.7after 5 years 0.7 0.9
The current finance lease relates to an office location in Breda.

-44-
(20) Provisions
Warranty Order-related
Personnel-related Other Total
Carrying amount as of Oct. 1, 2016 26.7 24.9 8.7 7.1 67.4Additions during the year 0.0 8.7 2.5 0.2 11.4Utilization -2.9 -6.8 -4.0 -0.8 -14.5Reversals - -0.2 0.0 - -0.2Change in scope of consolidation - - 0.0 - 0.0Adjustments due to IFRS 15 - -6.5 - - -6.5Carrying amount as of Sept. 30, 2017 23.8 20.1 7.2 6.5 57.6
Additions during the year 0.2 12.7 1.1 0.0 14.0Utilization -2.3 -14.4 -2.0 -0.7 -19.4Reversals -3.7 -2.2 -0.2 -0.4 -6.5Change in scope of consolidation -3.0 -7.2 -0.7 -0.1 -11.0Carrying amount as of Sept. 30, 2018 15.0 9.0 5.4 5.3 34.7
Current as of September 30, 2017 15.9 17.9 2.2 1.5 37.5Non-current as of September 30, 2017 7.9 2.2 5.0 5.0 20.1Carrying amount as of Sept. 30, 2017 23.8 20.1 7.2 6.5 57.6
Current as of September 30, 2018 10.4 9.0 1.0 0.9 21.3Non-current as of September 30, 2018 4.6 - 4.4 4.4 13.4Carrying amount as of Sept. 30, 2018 15.0 9.0 5.4 5.3 34.7
Pensions
As of April 1, 2011, the Company transferred the entire pension plan to the Pension Fund for the Mechanical and Electrical
Engineering Industry (PME), except for the pension plan for senior management. The pension scheme is a defined benefit
agreement referred to as a conditional average earnings scheme. Employees build up 1,875% of the pensionable earnings
as pension, with a standard retirement age of 68. The company accounts for the defined benefit agreement as a defined
contribution plan, because there is no reliable basis for allocating the obligations, plan assets, and costs to the participating
companies, since PME does not (or cannot) provide the information. In accordance with the PME plan, Siemens only has
an obligation to pay the contributions due annually. Since there is no reliable basis for allocating the obligations, plan
assets, and costs to the participating companies in PME, there is very likely no obligation to make up any shortfalls in the
plan. If the coverage of PME assets versus liabilities is not enough, the deficit would likely be reflected as decrease of
vested rights and/or increase of pension premium. For the upcoming 3 years employers and employees (Social partners)
have agreed to keep the pension premium equal to current year. The industry fund has a coverage ratio of 103,4 % as at 30
September 2018 (2017: 101,6%).
The pension plan for senior management was a final salary scheme, increasing by 1.75% for each year of service but has
been discontinued as of January 1, 2015. All vested rights have been frozen as of this date. Indexation is decided annually
but is limited to the indexation granted in the Pension Fund for the Mechanical and Electrical Engineering Industry (PME) and
conditional depending on plan assets. The administration of the pension plan for senior management has been assigned to
an insurer in accordance with section 2 (4) (B) of the Dutch Pensions and Savings Funds Act. No contributions are due after
discontinuation of the pension plan.
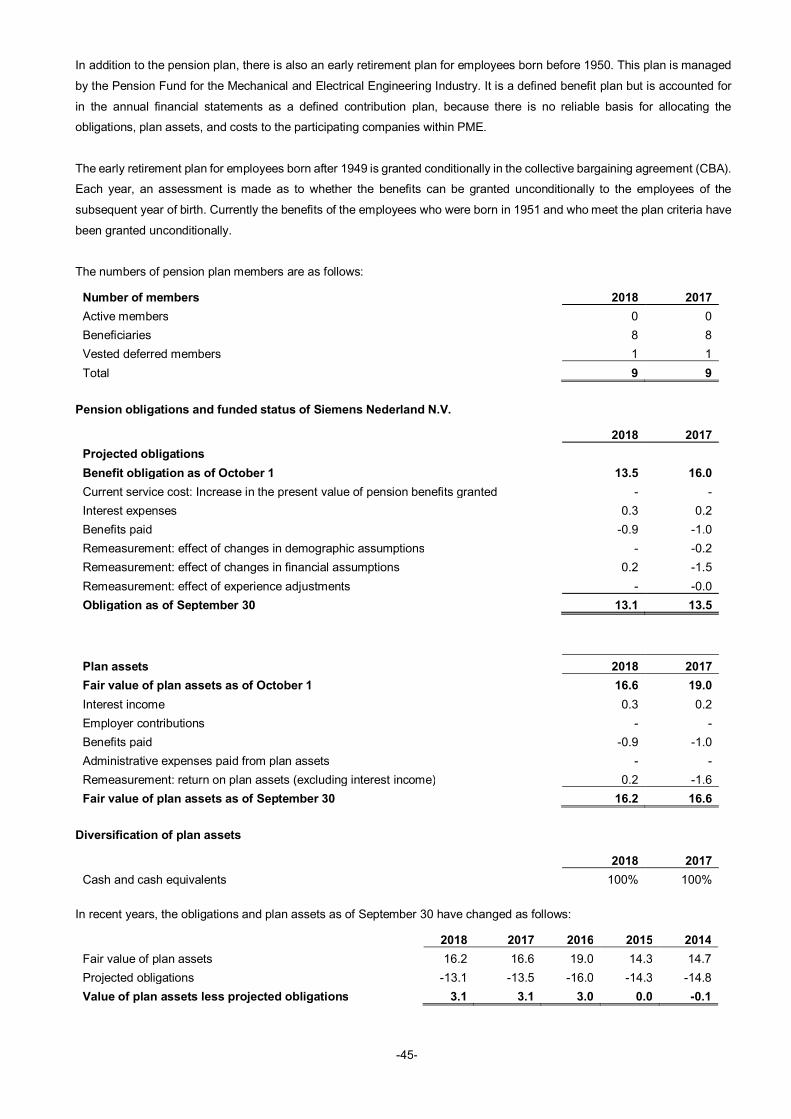
-45-
In addition to the pension plan, there is also an early retirement plan for employees born before 1950. This plan is managed
by the Pension Fund for the Mechanical and Electrical Engineering Industry. It is a defined benefit plan but is accounted for
in the annual financial statements as a defined contribution plan, because there is no reliable basis for allocating the
obligations, plan assets, and costs to the participating companies within PME.
The early retirement plan for employees born after 1949 is granted conditionally in the collective bargaining agreement (CBA).
Each year, an assessment is made as to whether the benefits can be granted unconditionally to the employees of the
subsequent year of birth. Currently the benefits of the employees who were born in 1951 and who meet the plan criteria have
been granted unconditionally.
The numbers of pension plan members are as follows:
Number of members 2018 2017Active members 0 0Beneficiaries 8 8Vested deferred members 1 1Total 9 9
Pension obligations and funded status of Siemens Nederland N.V.
2018 2017Projected obligationsBenefit obligation as of October 1 13.5 16.0Current service cost: Increase in the present value of pension benefits granted - -Interest expenses 0.3 0.2Benefits paid -0.9 -1.0Remeasurement: effect of changes in demographic assumptions - -0.2Remeasurement: effect of changes in financial assumptions 0.2 -1.5Remeasurement: effect of experience adjustments - -0.0Obligation as of September 30 13.1 13.5
Plan assets 2018 2017Fair value of plan assets as of October 1 16.6 19.0Interest income 0.3 0.2Employer contributions - -Benefits paid -0.9 -1.0Administrative expenses paid from plan assets - -Remeasurement: return on plan assets (excluding interest income) 0.2 -1.6Fair value of plan assets as of September 30 16.2 16.6
Diversification of plan assets
2018 2017Cash and cash equivalents 100% 100%
In recent years, the obligations and plan assets as of September 30 have changed as follows:
2018 2017 2016 2015 2014Fair value of plan assets 16.2 16.6 19.0 14.3 14.7Projected obligations -13.1 -13.5 -16.0 -14.3 -14.8Value of plan assets less projected obligations 3.1 3.1 3.0 0.0 -0.1
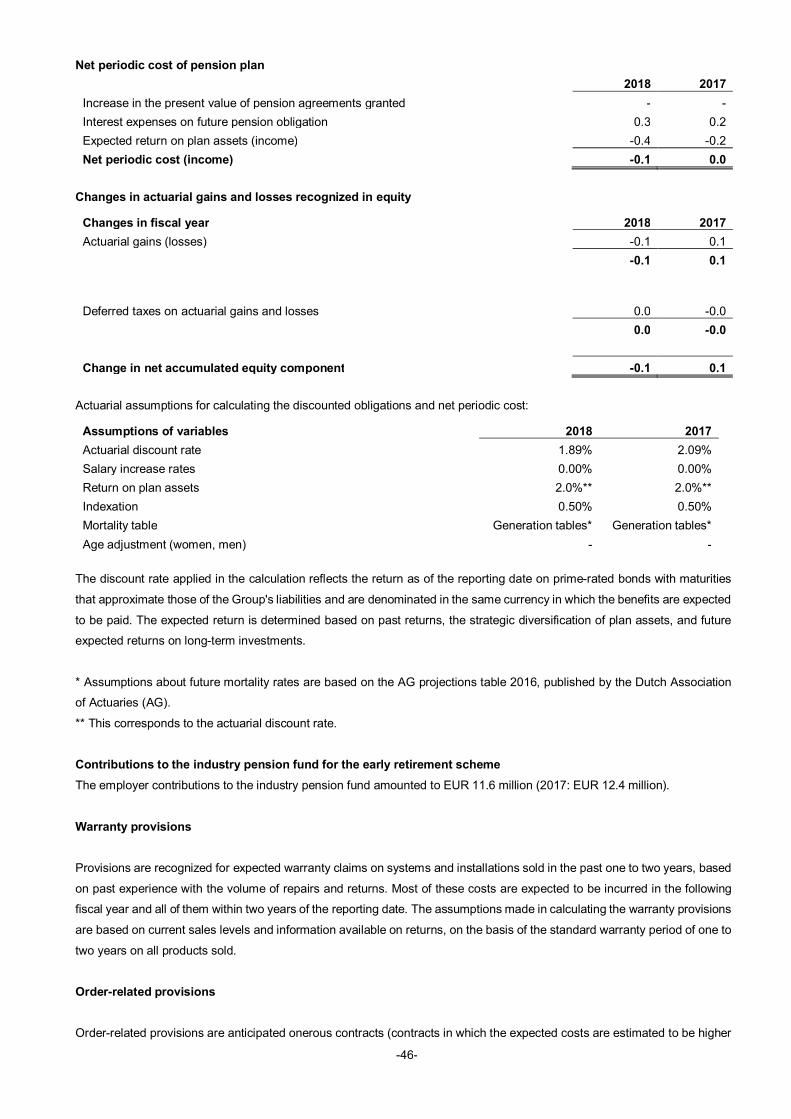
-46-
Net periodic cost of pension plan2018 2017
Increase in the present value of pension agreements granted - -Interest expenses on future pension obligation 0.3 0.2Expected return on plan assets (income) -0.4 -0.2Net periodic cost (income) -0.1 0.0
Changes in actuarial gains and losses recognized in equity
Changes in fiscal year 2018 2017Actuarial gains (losses) -0.1 0.1
-0.1 0.1
Deferred taxes on actuarial gains and losses 0.0 -0.00.0 -0.0
Change in net accumulated equity component -0.1 0.1
Actuarial assumptions for calculating the discounted obligations and net periodic cost:
Assumptions of variables 2018 2017Actuarial discount rate 1.89% 2.09%Salary increase rates 0.00% 0.00%Return on plan assets 2.0%** 2.0%**Indexation 0.50% 0.50%Mortality table Generation tables* Generation tables*Age adjustment (women, men) - -
The discount rate applied in the calculation reflects the return as of the reporting date on prime-rated bonds with maturities
that approximate those of the Group's liabilities and are denominated in the same currency in which the benefits are expected
to be paid. The expected return is determined based on past returns, the strategic diversification of plan assets, and future
expected returns on long-term investments.
* Assumptions about future mortality rates are based on the AG projections table 2016, published by the Dutch Association
of Actuaries (AG).
** This corresponds to the actuarial discount rate.
Contributions to the industry pension fund for the early retirement schemeThe employer contributions to the industry pension fund amounted to EUR 11.6 million (2017: EUR 12.4 million).
Warranty provisions
Provisions are recognized for expected warranty claims on systems and installations sold in the past one to two years, based
on past experience with the volume of repairs and returns. Most of these costs are expected to be incurred in the following
fiscal year and all of them within two years of the reporting date. The assumptions made in calculating the warranty provisions
are based on current sales levels and information available on returns, on the basis of the standard warranty period of one to
two years on all products sold.
Order-related provisions
Order-related provisions are anticipated onerous contracts (contracts in which the expected costs are estimated to be higher

-47-
than the expected benefits) and outstanding (project) costs still to be received.
The IFRS 15 adjustment relates to the provisions for fines and compensation for late delivery which under IFRS 15 is no
longer a provision but a refund liability under contract liabilities.
Personnel-related provisions
Personnel-related provisions are mainly severance payments and long-term service awards.
Other provisions
Other provisions comprise all provisions, which are not included in the provisions mentioned above. These include amongst
other record retention, under-utilization of real estate and other assets leased under an operating lease and specific other
minor provisions.
(21) Trade and other payables
2018 2017Trade payables 48.8 69.8Liabilities to Affiliated Companies 1.6 9.5Taxes and social security contributions payable 31.4 31.6Other liabilities 22.2 28.2Liabilities under forward exchange contracts 0.7 2.4Pension contributions payable 2.2 1.5
106.9 143.0
Advance payments received on orders and deferred income are under IFRS 15 no longer a payable but now presented as a
contract liability.
The taxes and social security contributions payable have been offset against taxes and social security contributions
receivable, provided that they are payable to or receivable from the same party and a legal right to offset exists.
(22) Tax liabilities2018 2017
Tax liabilities 2.8 3.1

-48-
(23) Financial instruments
The table below shows the carrying amounts of all financial instruments recognized in the financial statements.
2018 2017Financial assetsNon-current financial assets:
Non-current receivables:Other receivables 6.4 7.5
Current receivables: Trade and other receivables:
Receivables from Affiliated Companies 609.8 419.1Other trade receivables and other receivables 104.9 112.6
Other financial receivables:Other financial receivables 4.4 6.5
Financial liabilitiesNon-current liabilities:
Other financial liabilities:Lease and hire purchase liabilities -1.4 -1.6Other financial liabilities -1.7 -1.9
Current liabilities:Trade and other payables -106.9 -143.0
Tax liabilities -2.8 -3.1
The fair values of cash and cash equivalents, (current) receivables, and current liabilities correspond to their carrying amounts.
This is due to the high level of liquidity and/or short maturities of the instruments.

-49-
Liquidity riskThe table below shows the contractual terms and repayment obligations of the financial assets and financial liabilities,
including estimated interest payments:
At September 30, 2018Within 1
year1 to 2years
2 to 3years
3 to 4years
4 to 5years
After 5years Total
Fixed-income financial assetsOther receivables - 1.4 1.0 1.0 1.0 2.0 6.4Variable-income financial assetsReceivables from Affiliated Companies 609.8 - - - - - 609.8Other trade receivables and otherreceivables 104.9 - - - - - 104.9Variable-income financial liabilitiesFinance lease and hire purchaseagreements - -0.2 -0.2 -0.2 -0.2 -0.7 -1.5Other financial liabilities - -1.6 - - - - -1.6Trade and other payables -106.9 - - - - - -106.9Tax Liabilities -2.8 - - - - - -2.8
At September 30, 2017Within 1
year1 to 2years
2 to 3years
3 to 4years
4 to 5years
After 5years Total
Fixed-income financial assetsOther receivables - 1.5 1.0 1.0 1.0 3.0 7.5Variable-income financial assetsReceivables from Affiliated Companies 419.0 - - - - - 419.0Other trade receivables and otherreceivables 112.6 - - - - - 112.6Variable-income financial liabilitiesFinance lease and hire purchaseagreements - -0.2 -0.2 -0.2 -0.2 -0.8 -1.6Other financial liabilities - -1.9 - - - - -1.9Trade and other payables -143.0 - - - - - -143.0Tax Liabilities -3.1 - - - - - -3.1
The interest is fixed until the end of the term of the intragroup deposits.
Interest rate riskFor an assessment of the risk in the subsequent year, please refer to note 5.
Credit riskWith regard to the trade receivables and lease receivables items, the Company has processes and control mechanisms in
place to keep the risks to a minimum. The Company's maximum risk exposure is theoretically equal to the total balance
outstanding. The Company regards its policies to manage this risk (see also note 5) as effective, since realized losses (see
note 13) have been low in recent years.
Currency riskAn exchange rate profit of EUR 0.0 million was generated (2017: loss of EUR 0.2 million).

-50-
Hedging activities
As of September 30, 2017, and September 30, 2018, the Company had entered into various forward exchange contracts to
hedge currency risks on expected future sales to customers and future deliveries from suppliers. Most of the contracts expire
within one year. Cash flow hedge accounting is used, if all strict conditions are met.
The fair values recognized for these forward exchange contracts as of September 30 were as follows:
2018 2017Derivatives not designated as hedging instrumentsForeign exchange forward contracts 0.3 1.6Embedded derivatives -0.3 -1.4
Derivatives designated as hedging instrumentsForeign exchange forward contracts (fair value hedge) - -Foreign exchange forward contracts (cash flow hedge) - -
(24) Contingent liabilities
For certain projects, banks issue bank guarantees to third parties in which they stand surety for the Company meeting its
obligations under the contracts. If a claim is made on a bank guarantee by third parties, the bank has the right of recourse to
the Company. On September 30, the following amounts of bank guarantees were outstanding:
2018 2017Bank guarantees 94.0 97.9
In addition to the guarantees provided by banks, as disclosed above, the ultimate parent company Siemens AG or its wholly-
owned subsidiaries also stand surety vis-à-vis third parties for the Company. meeting its obligations under the contracts. In
2018, the ultimate parent company Siemens AG or its wholly-owned subsidiaries provided surety in an amount of EUR 101.8
million (2017: EUR 81.7 million). The total guarantee amount for 2018 is therefore EUR 195.8 million (2017: EUR 179.6
million).
Lease obligations
Lease obligations Operating asset obligations
2018 2017 2018 2017To be settled in 1st subsequent year 12.9 13.0 4.3 5.4To be settled in 2nd subsequent year 12.7 12.4 2.9 3.8To be settled in 3rd subsequent year 11.4 12.1 1.6 2.3To be settled in 4th subsequent year 9.4 10.7 0.6 0.9To be settled in 5th subsequent year 8.8 9.0 0.1 0.2Total obligation to be settled within 5 years 55.2 57.2 9.5 12.6Total obligation to be settled after 5 years 19.3 26.8 - -Total obligation as of the reporting date 74.5 84.0 9.5 12.6
In the 2017, the Company had committed to a credit facility towards its former joint venture Infraspeed Maintenance B.V.
This agreement including the joint venture were part of the sale of the Mobility business and therefore the Company is no
longer liable.
The Company has liabilities arising from long-term leases and operating assets. The liabilities arising from operating assets
are primarily related to obligations for leased vehicles. All companies belonging to either of these tax groups are jointly and
severally liable for the taxes payable by the respective tax group. Siemens International Holding B.V. is the head of the tax
group. The Company is the taxpayer. All companies in the Group periodically settle the account receivable or payable position

-51-
with Siemens International Holding B.V. Since Siemens International Holding B.V. is the head of the tax group, all current and
deferred tax assets and liabilities of the Company are positions vis-à-vis the parent company.
The Company is partner in the joint operation of GLT Plus VOF, and therefore jointly and severally liable. The principal
place of business for GLT Plus VOF is Sappemeer in Groningen. The contractual arrangement establishes the allocation of
revenues and expenses based on the relative performance of each party to the joint arrangement. In addition, GLT Plus
VOF will invoice the final customer NAM based on work performed. All partners will only receive payment after the amount
has been received by GLT Plus VOF. No advances are given for work to be performed. Additionally, a significant portion of
the contingent liability relates to sales tax, for which GLT Plus VOF collects and pays the amount to the Tax Authority.
Decision making in GLT PLUS VOF is bound to strict limitations and allow day-to-day decisions related to the Scope of
work. Other decisions require unanimous approval from the partners.

-52-
Notes to the company income statement
(25) Revenue
In accordance with section 2:380 of the Dutch Civil Code, the table below shows the distribution of revenue over geographical
areas and operating segments.
Geographical areas 2018 2018 2017 2017Restated* Restated*
Third partiesRelated parties of
Siemens AG Third partiesRelated parties of
Siemens AG
The Netherlands 506.9 8.7 468.5 7.2Middle East 126.7 13.6 108.6 6.8Asia 34.3 8.4 45.5 5.2Europe other 29.4 52.6 23.6 61.4Africa 14.4 2.3 26.7 2.7Americas 8.8 1.7 2.1 3.3
Australia -1.9 9.2 1.9 3.5
Total 718.6 96.5 676.9 90.1
Operating segments 2018 2018 2017 2017Restated* Restated*
Third partiesRelated parties of
Siemens AG Third partiesRelated parties of
Siemens AGPower and Gas 288,6 73,9 246,4 63,0Process Industries and Drives 125,6 8,8 145,5 10,4Digital Factory 112,3 0,6 105,2 0,3Building Technologies 106,1 0,7 108,2 0,5Energy Management 83,5 6,1 69,4 9,8Real Estate 2,5 6,4 2,2 6,1Corporate Managed portfolio 0,0 0,0 0,0 0,0Total 718,6 96,5 676,9 90,1
* Amounts shown here do not correspond to the 2017 financial statements and relate to adjustments made regarding Mobility
(refer to note 16) and IFRS 15 (refer to note 1.3).
The amount of revenue recognized in the current period which was included in the contract liability at the end of the
previous period was EUR 35.5 million.

-53-
Order backlog
On September 30, 2018, order backlog was reported for EUR 829.8 million and this is expected to be recognized asrevenue as follows:
Order backlog recognized asrevenue:
Within 1 year In the 1stsubsequent year
After the 1stsubsequent year Total
Thirdparties
Relatedparties
ofSiemens
AG
Thirdparties
Relatedparties
ofSiemens
AG
Thirdparties
Relatedparties
ofSiemens
AG
Thirdparties
Relatedparties
ofSiemens
AG
Power and Gas 156.7 65.2 34.5 4.6 359.9 12.7 551.1 82.5
Process Industries and Drives 58.2 3.0 4.3 0.0 1.0 0.0 63.5 3.0
Digital Factory 8.0 0.1 0.0 0.0 0.0 0.0 8.0 0.1
Building Technologies 28.0 1.7 8.4 0.8 0.0 0.0 36.4 2.5
Energy Management 45.6 23.9 7.3 5.9 0.0 0.0 52.9 29.8
Total 296.5 93.9 54.5 11.3 360.9 12.7 711.9 117.9
(26) Other operating income2018 2017
Sale of the Breda building (Real Estate) - 0.5- 0.5
(27) Finance income and expenses
Interest and similar income include an amount of EUR 0.0 million (2017: EUR 0.0 million) from affiliated companies. Other
interest and similar expenses include an amount of EUR -2.8 million (2017: EUR -2.0 million) from affiliated companies. For
more information, please refer to note 29 on related parties.
(28) Tax on profit from continuing operations
The tax expense (income) recognized in the company income statement breaks down as follows:
2018 2017Income taxes for the current period from continued operations 19.7 21.3Income taxes for the current period from discontinued operations 0.7 6.8Total current tax 20.4 28.1
Deferred taxes for the current period from continued operations -1.2 -0.7Deferred taxes for the current period from discontinued operations -0.0 0.6Total deferred tax -1.2 -0.1
Total income tax for the current period 19.2 28.0

-54-
The reconciliation between the tax burden and the result of calculating the profit before tax, multiplied by the local tax rate,
is as follows:
2018 2017Profit before tax(profit from continuing operations and profit from discontinued operations) 420.6 221.5
Tax at the locally applicable rate of 25,0% (2017: 25,0%) 105.1 55.4Participation exemption regarding gain sale of Wind power - -28.3Participation exemption regarding gain sale of Mobility -20.5 -Participation exemption regarding gain sale of Healthcare -63.3 -Participation exemption regarding gain sale of Mechanical Drives -1.3 -Participation exemption regarding impairment investment - 0.2True up related to prior years 0.0 0.3Nondeductible expenses for tax purposes - 0.2Other -0.8 0.2Tax burden 19.2 28.0
Siemens Nederland N.V. is part of a tax group headed by Siemens International Holding B.V. under which all parties are
jointly and severally liable for the tax position.
(29) Related parties
Transactions with managing directors and key management personnelSiemens Nederland N.V. has not issued loans to or entered into transactions with managing directors or managers.
Other related party transactionsThe values of transactions involving goods and services with companies included in the scope of consolidation of Siemens
AG were as follows:
Transaction values2018 2017
Purchases 299.0 326.3
Sales 96.5 90.3
Interest Balance outstanding2018 2017 2018 2017
Loans issued and interest income (expense*)Siemens Financial Services (current) -2.6 -1.9 570.0 335.0
Loans received and interest expensesSiemens Financial Services (non-current) - - - -
Cost of providing guaranteesSiemens Financial Services -0.1 -0.1 - -
Cost of assuming credit riskSiemens Financial Services 0.0 0.0 - -
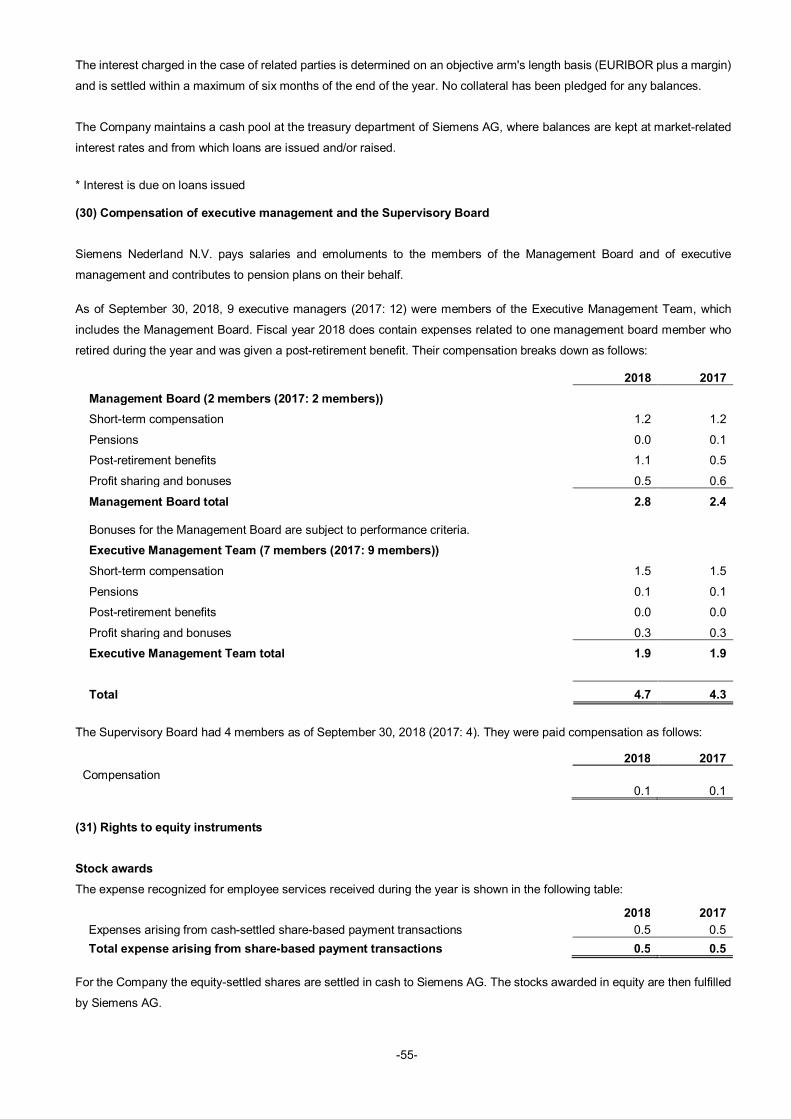
-55-
The interest charged in the case of related parties is determined on an objective arm's length basis (EURIBOR plus a margin)
and is settled within a maximum of six months of the end of the year. No collateral has been pledged for any balances.
The Company maintains a cash pool at the treasury department of Siemens AG, where balances are kept at market-related
interest rates and from which loans are issued and/or raised.
* Interest is due on loans issued
(30) Compensation of executive management and the Supervisory Board
Siemens Nederland N.V. pays salaries and emoluments to the members of the Management Board and of executive
management and contributes to pension plans on their behalf.
As of September 30, 2018, 9 executive managers (2017: 12) were members of the Executive Management Team, which
includes the Management Board. Fiscal year 2018 does contain expenses related to one management board member who
retired during the year and was given a post-retirement benefit. Their compensation breaks down as follows:
2018 2017Management Board (2 members (2017: 2 members))Short-term compensation 1.2 1.2
Pensions 0.0 0.1
Post-retirement benefits 1.1 0.5
Profit sharing and bonuses 0.5 0.6
Management Board total 2.8 2.4
Bonuses for the Management Board are subject to performance criteria.
Executive Management Team (7 members (2017: 9 members))Short-term compensation 1.5 1.5
Pensions 0.1 0.1
Post-retirement benefits 0.0 0.0
Profit sharing and bonuses 0.3 0.3
Executive Management Team total 1.9 1.9
Total 4.7 4.3
The Supervisory Board had 4 members as of September 30, 2018 (2017: 4). They were paid compensation as follows:
2018 2017Compensation
0.1 0.1
(31) Rights to equity instruments
Stock awardsThe expense recognized for employee services received during the year is shown in the following table:
2018 2017Expenses arising from cash-settled share-based payment transactions 0.5 0.5Total expense arising from share-based payment transactions 0.5 0.5
For the Company the equity-settled shares are settled in cash to Siemens AG. The stocks awarded in equity are then fulfilled
by Siemens AG.

-56-
In 2018, 3,779 (2017: 7,154) stock awards were granted to employees, of which 1,870 (2017: 3,791) to the Executive
Management Team (including the Management Board).
2018 2018 2017 2017Awards in
absolute numbersCumulative fair
valueAwards in absolute
numbersCumulative fair
valueAt beginning of fiscal year 28,614 3.4 29,969 3.1Disposal Siemens HealthcareNederland B.V. -2,973 -Granted provisionally 6,056 7,154Awarded -5,878 -7,580Forfeited/settled -5,888 -929Transferred -1,488 -At end of fiscal year 18,443 2.0 28,614 3.4
At the end of fiscal year 2017 the balance included 2,973 stock awards of the Healthcare business.
The transferred shares relate to carve out of the Mobility business.
Fair value at the end of the fiscal year is calculated by multiplying the number of awards outstanding by the market value per
share at the end of the fiscal year. The market value of the shares granted was EUR 110.36 as of September 30, 2018
compared with EUR 119.45 as of September 30, 2017.
Share Matching Plan
The expenses recognized for employee services received during the year is shown in the following table:
2018 2017Expenses arising from cash-settled share-based payment transactions 0.5 0.3Total expenses arising from share-based payment transactions 0.5 0.3
For the Company the equity-settled shares are settled in cash to Siemens AG. The stocks awarded in equity are then fulfilled
by Siemens AG.
In 2018, 1,374 (2017: 1,990) bonus shares were granted to employees, of which 32 (2017: 90) to the Executive Management
Team (including the Management Board).
2018 2018 2017 2017Awards in
absolute numbersCumulative fair
valueAwards in
absolute numbersCumulative fair
valueAt beginning of fiscal year 4,247 0.5 3,926 0.4Disposal Siemens HealthcareNederland B.V. -759Granted 1,734 1,990Awarded -1,870 -1,232Forfeited/settled -211 -437Transferred -311 -At end of fiscal year 2,830 0.3 4,247 0.5
At the end of fiscal year 2017 the balance included 759 awards of the Siemens Healthcare Nederland B.V.. These are not
accounted for in the company anymore after the sale of this business which explains the change in opening balance of fiscal
year 2018.
The transferred shares relate to the carve out of the Mobility and Mechanical Drives businesses.

-57-
Fair value at the end of the fiscal year is calculated by multiplying the number of bonus shares by the market value per share
at the end of the fiscal year. The market value of the bonus shares issued was EUR 110.36 as of September 30, 2017
compared with EUR 119.45 as of September 30, 2017.
Siemens Profit Sharing
The Siemens Profit Sharing (SPS) constitutes a voluntary and discretionary, decided by the Siemens AG board, distribution
of a part of the yearly Siemens Profit to employees below Senior Management of up to EUR 400 million annually in Siemens
Profit Sharing pool. The related costs are accrued over the expected period and charged to all Siemens companies. Since
this scheme is at the sole discretion of the Siemens AG board, no actual shares are awarded but only costs are accrued.
Depending on Siemens AG, the amounts if paid, are settled in cash or shares of Siemens AG. For the Company equity-settled
shares are settled in cash to Siemens AG. The stocks awarded in equity are then fulfilled by Siemens AG.
The expense recognized for the profit-sharing scheme during the year is shown in the following table:
2018 2017Expenses arising from cash-settled share-based payment transactions 0.7 1.1Total expense arising from share-based payment transactions 0.7 1.1
For the Company the equity-settled shares are settled in cash to Siemens AG. The stocks awarded in equity are then fulfilled
by Siemens AG.
(32) Employees
The number of employees, expressed as full-time equivalents, working for Siemens Nederland N.V. at year end was as
follows:
2018 2017Sales divisions 1,588 1,669Management and staff departments 140 175
Total 1,728 1,844
On average these employees were employed in The Netherlands during the reporting period. The number of employees
decreased in part because of the sale of the Mobility and Mechanical Drives businesses.
(33) Depreciation, amortization, and impairment losses
2018 2017Non-current intangible assets - 1.9Impairment 9.7 0.7Property, plant, and equipment 4.1 6.5Total 13.8 9.1
(34) Personnel costs
2018 2017Wages and salaries 122.3 140.7Pension costs 10.6 12.3Other social security costs 16.1 18.4Total 149.0 171.4

-58-
(35) Joint operations
A small part of the Company’s activities is carried out in joint arrangements classified as joint operations. The Group
participates in 1 joint operations (2017: 2). These collaborative arrangements remain in place until a project is finished, and
they are accordingly finite.
(36) Audit fees
On the basis of Book 2 of the Dutch Civil Code, part 9 section 382a (3), Siemens Nederland N.V. opts not to disclose the
costs of the auditors, because Siemens AG includes these costs in its IFRS financial statements in accordance with EU
requirements.
(37) Events after the reporting date
On 15 November 2018, Siemens Nederland N.V. and Siemens Heat Transfer Technology B.V. signed binding agreements
to transfer business related assets, liabilities and employees pertaining to the operations in Hengelo to VDL group. VDL
takes over the total number of 430 employees (FTE), thereof 372 full time jobs from Siemens Nederland N.V., most of
whom will be employed by VDL Energy Systems. Other employees will work at the high-tech cluster of VDL ETG,
Technology & Development Hengelo. The transaction will become financially effective in Q1 FY19 but will not have a
significant impact on the operational result of Siemens Nederland. The one-off effect on net income level is dependent on
various external factors but in any case, expected to be overcompensated by FY19 operational profits from ongoing
operations.

-59-
The Hague, December 7, 2018
Management Board:
H.J. Winters (Chairman)
W.G. van der Poel
Supervisory Board:
C.D. Kaeser (Chairman)
A.H.G. Rinnooy Kan
G.A. Verbeet
A. Al Refai

-60-
Other disclosures
Requirement in the Articles of Incorporation relating to the appropriation of profitsArticle 22 (1) of the Articles of Incorporation reads as follows:
"The profit according to the approved income statement shall be at the disposal of the General Shareholders' Meeting."

-61-
Independent auditor’s reportTo: the general shareholders’ meeting and the supervisory board of Siemens Nederland N.V.
Report on the audit of the financial statements for the year ended 30 September 2018 includedin the annual report
Our opinionWe have audited the accompanying financial statements for the year ended 30 September 2018 of Siemens NederlandN.V., based in The Hague.
In our opinion the accompanying financial statements give a true and fair view of the financial position of SiemensNederland N.V. for the year ended 30 September 2018, and of its result and its cash flows for the year then ended inaccordance with International Financial Reporting Standards as adopted by the European Union (EU-IFRS) and with Part 9of Book 2 of the Dutch Civil Code.
The financial statements comprise:• The company statement of financial position for the year ended 30 September 2018• The following statements for the year ended: the company income statement, the company statements of
comprehensive income, changes in equity and cash flows• The notes comprising a summary of the significant accounting policies and other explanatory information
Basis for our opinionWe conducted our audit in accordance with Dutch law, including the Dutch Standards on Auditing. Our responsibilitiesunder those standards are further described in the “Our responsibilities for the audit of the financial statements” section ofour report.
We are independent of Siemens Nederland N.V. in accordance with the Verordening inzake de onafhankelijkheid vanaccountants bij assurance-opdrachten (ViO, Code of Ethics for Professional Accountants, a regulation with respect toindependence) and other relevant independence regulations in the Netherlands. Furthermore we have complied with theVerordening gedrags- en beroepsregels accountants (VGBA, Dutch Code of Ethics).
We believe the audit evidence we have obtained is sufficient and appropriate to provide a basis for our opinion.
Report on other legal and regulatory requirementsIn addition to the financial statements and our auditor’s report thereon, the annual report contains other information thatconsists of:• Supervisory Board Report• Report of the Management Board• Other information pursuant to Part 9 of Book 2 of the Dutch Civil Code
Based on the following procedures performed, we conclude that the other information:• Is consistent with the financial statements and does not contain material misstatements• Contains the information as required by Part 9 of Book 2 of the Dutch Civil Code
We have read the other information. Based on our knowledge and understanding obtained through our audit of the financialstatements or otherwise, we have considered whether the other information contains material misstatements. By performingthese procedures, we comply with the requirements of Part 9 of Book 2 of the Dutch Civil Code and the Dutch Standard720. The scope of the procedures performed is less than the scope of those performed in our audit of the financialstatements.
Management is responsible for the preparation of the other information, including the management board’s report inaccordance with Part 9 of Book 2 of the Dutch Civil Code and other information pursuant to Part 9 of Book 2 of the DutchCivil Code.

-62-
Description of responsibilities for the financial statements
Responsibilities of management and the Supervisory Board for the financial statementsManagement is responsible for the preparation and fair presentation of the financial statements in accordance with EU-IFRSand Part 9 of Book 2 of the Dutch Civil Code. Furthermore, management is responsible for such internal control asmanagement determines is necessary to enable the preparation of the financial statements that are free from materialmisstatement, whether due to fraud or error.
As part of the preparation of the financial statements, management is responsible for assessing the company’s ability tocontinue as a going concern. Based on the financial reporting frameworks mentioned, management should prepare thefinancial statements using the going concern basis of accounting unless management either intends to liquidate thecompany or to cease operations, or has no realistic alternative but to do so. Management should disclose events andcircumstances that may cast significant doubt on the company’s ability to continue as a going concern in the financialstatements.
The Supervisory Board is responsible for overseeing the company’s financial reporting process.
Our responsibilities for the audit of the financial statementsOur objective is to plan and perform the audit assignment in a manner that allows us to obtain sufficient and appropriateaudit evidence for our opinion.
Our audit has been performed with a high, but not absolute, level of assurance, which means we may not have detected allmaterial errors and fraud.
Misstatements can arise from fraud or error and are considered material if, individually or in the aggregate, they couldreasonably be expected to influence the economic decisions of users taken on the basis of these financial statements. Themateriality affects the nature, timing and extent of our audit procedures and the evaluation of the effect of identifiedmisstatements on our opinion.
We have exercised professional judgment and have maintained professional skepticism throughout the audit, in accordancewith Dutch Standards on Auditing, ethical requirements and independence requirements. Our audit included among others:• Identifying and assessing the risks of material misstatement of the financial statements, whether due to fraud or error,
designing and performing audit procedures responsive to those risks, and obtaining audit evidence that is sufficient andappropriate to provide a basis for our opinion. The risk of not detecting a material misstatement resulting from fraud ishigher than for one resulting from error, as fraud may involve collusion, forgery, intentional omissions,misrepresentations, or the override of internal control
• Obtaining an understanding of internal control relevant to the audit in order to design audit procedures that areappropriate in the circumstances, but not for the purpose of expressing an opinion on the effectiveness of the company’sinternal control
• Evaluating the appropriateness of accounting policies used and the reasonableness of accounting estimates and relateddisclosures made by management
• Concluding on the appropriateness of management’s use of the going concern basis of accounting, and based on theaudit evidence obtained, whether a material uncertainty exists related to events or conditions that may cast significantdoubt on the company’s ability to continue as a going concern. If we conclude that a material uncertainty exists, we arerequired to draw attention in our auditor’s report to the related disclosures in the financial statements or, if suchdisclosures are inadequate, to modify our opinion. Our conclusions are based on the audit evidence obtained up to thedate of our auditor’s report. However, future events or conditions may cause a company to cease to continue as a goingconcern
• Evaluating the overall presentation, structure and content of the financial statements, including the disclosures• Evaluating whether the financial statements represent the underlying transactions and events in a manner that achieves
fair presentation
We provide the supervisory board with a statement that we have complied with relevant ethical requirements regardingindependence, and to communicate with them all relationships and other matters that may reasonably be thought to bear onour independence, and where applicable,related safeguards.
-63-
We communicate with management regarding, among other matters, the planned scope and timing of the audit andsignificant audit findings, including any significant findings in internal control that we identify during our audit.
Rotterdam, 7 December 2018
Ernst & Young Accountants LLP
Signed by W.P. de Pater

-64-
Siemens Nederland N.V.
Prinses Beatrixlaan 8002595 BN The HagueP.O. Box 160682500 BB The HagueThe Netherlands
Tel. +31 (0)70 333 3333Fax +31 (0)70 333 2917
www.siemens.nl