siemens digital industries software accelerating …...siemens digital industries software hite...
TRANSCRIPT
Executive summaryHydraulic systems must satisfy increasing demands for high performance and efficiency of products without affecting durability. More and more control systems are introduced, adding another level of complexity that impacts the time and cost of development. Virtual product integration using multidomain system simulation is a technology deployed in various industries to reduce the number of real prototypes and test benches and to solve integration problems earlier in the development cycle. The objective of this white paper is to explain the requirements in terms of simulation capabilities to perform such virtual integration, and to provide several application cases.
Siemens Digital Industries Software
siemens.com/simcenter
Accelerating hydraulic component and system design with model-based systems engineering
Siemens Digital Industries Software
White paper | Accelerating hydraulic component and system design with model-based systems engineering
2
Abstract
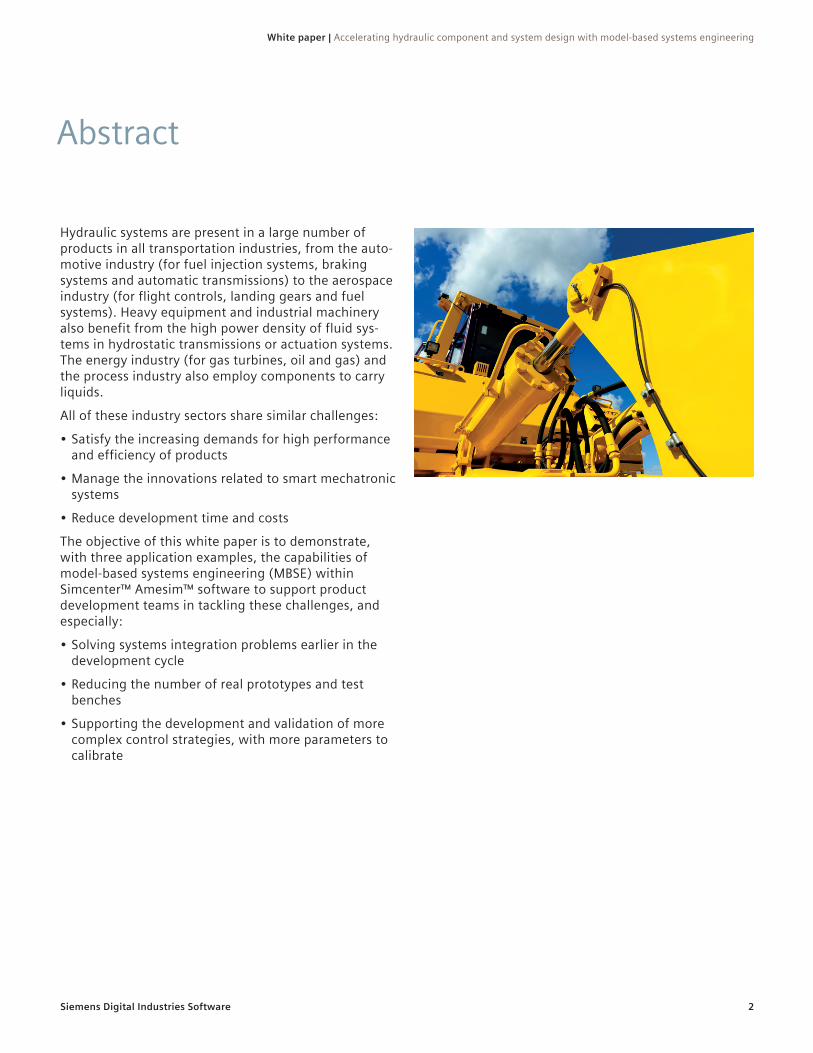
Hydraulic systems are present in a large number of products in all transportation industries, from the auto-motive industry (for fuel injection systems, braking systems and automatic transmissions) to the aerospace industry (for flight controls, landing gears and fuel systems). Heavy equipment and industrial machinery also benefit from the high power density of fluid sys-tems in hydrostatic transmissions or actuation systems. The energy industry (for gas turbines, oil and gas) and the process industry also employ components to carry liquids.
All of these industry sectors share similar challenges:
• Satisfy the increasing demands for high performance and efficiency of products
• Manage the innovations related to smart mechatronic systems
• Reduce development time and costs
The objective of this white paper is to demonstrate, with three application examples, the capabilities of model-based systems engineering (MBSE) within Simcenter™ Amesim™ software to support product development teams in tackling these challenges, and especially:
• Solving systems integration problems earlier in the development cycle
• Reducing the number of real prototypes and test benches
• Supporting the development and validation of more complex control strategies, with more parameters to calibrate
Siemens Digital Industries Software
White paper | Accelerating hydraulic component and system design with model-based systems engineering
3
Simulation requirements
To satisfy the increasing demands for the high perfor-mance and efficiency of products, the development of fluid systems requires:
• A proper sizing of pumps, valves and actuators to fulfill the requirements in terms of time, maximum performance and response time
• The optimization of energy consumption• Stable behavior in the full range of operating
conditions• Improved noise, vibration and harshness (NVH)
characteristics
As a consequence, the requirements in terms of simula-tion capabilities are the following:
• Advanced modeling of liquids properties: compress-ible liquids with strict handling of properties as a function of pressure and temperature (thermody-namic variables always respect mass and energy conservation principles), aeration and cavitation management
• Different complexity levels for components depending on simulation needs: - Overall trends or detailed high-fidelity behavior - Available input data (data sheet or computer-aided
design drawings) - Dynamics to be represented: quasi-static, slow or
fast transients - Five types of components: pumps and motors,
valves, actuators, heat exchangers and piping (junc-tions, bends, volumes, etc.)
• Mechanical simulation capabilities: - 1D, 2D or 3D mechanical representation with auto-
matic assembly and animation tools, depending on the simulation need
- Elementary physics (inertia, stiffness and damping) and applicative elements (gears, ropes and pulleys, cams, etc.)
- Interfaces with 3D multibody tools
• Electrical simulation capabilities: - Level of modeling adaptable to available input data
and dynamics to be represented (quasi-static, slow or fast transient)
- Generic components: voltage or current sources, resistance, inductance, capacitance, etc.
- Applicative components: solenoid valves, electrical motors and drives, electric network, battery
• Link with controls: - Embedded signal and control functionalities, includ-
ing state machines - Import of C-coded control logic - Full interfaces with control development tools for
model-in-the-loop and software-in-the-loop - Code export to all major hardware-in-the-loop
platforms
Siemens Digital Industries Software
White paper | Accelerating hydraulic component and system design with model-based systems engineering
4
Application: Controllability and NVH characteristics of a vane pump
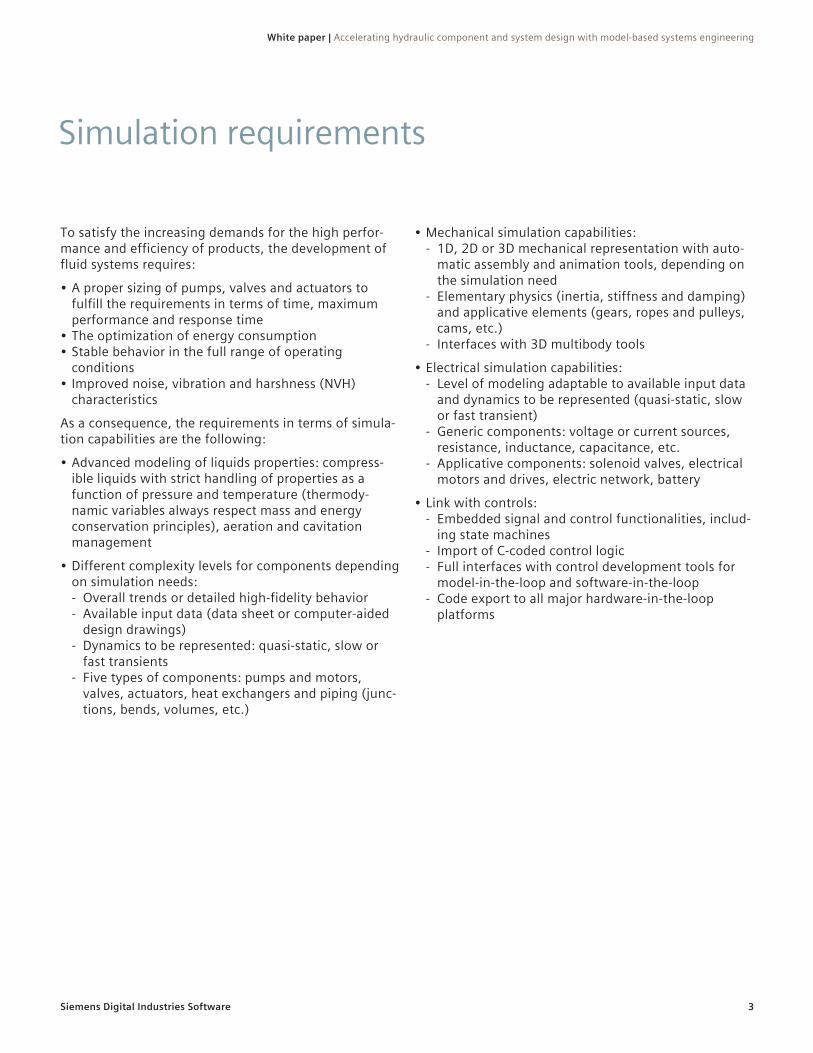
In the automotive industry, vane pumps are commonly used for power steering and automatic transmission. Vane pumps can also be used in low-pressure gasoline applications such as secondary air injection for auto exhaust emission control, or in low-pressure chemical vapor deposition systems.
The design of a pressure-controlled vane pump is shown in figure 1. The pump consists of a rotor with five vanes, a translating stator ring and the pump housing. The displaced volume of the pump is dependent on the eccentricity between the rotor and the stator axes. The motion of the stator ring changes the current value of the eccentricity and consequently the delivered flow rate.
Figure 1: Variable displacement vane pump.
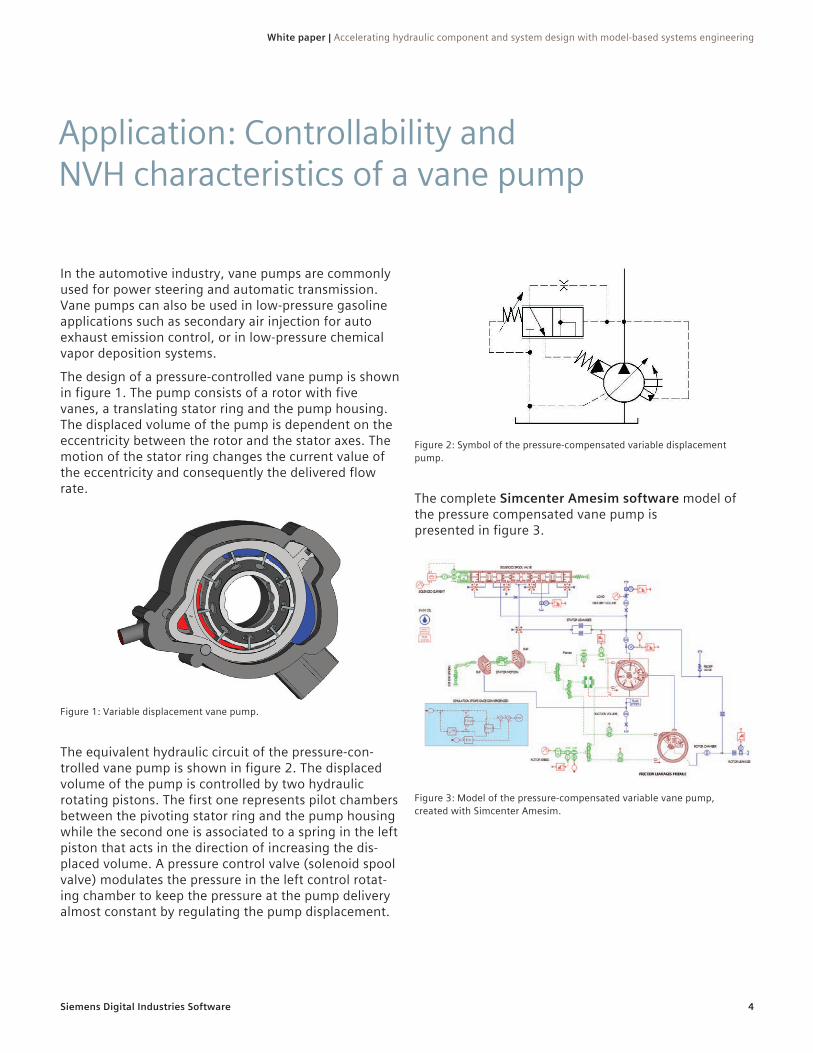
The equivalent hydraulic circuit of the pressure-con-trolled vane pump is shown in figure 2. The displaced volume of the pump is controlled by two hydraulic rotating pistons. The first one represents pilot chambers between the pivoting stator ring and the pump housing while the second one is associated to a spring in the left piston that acts in the direction of increasing the dis-placed volume. A pressure control valve (solenoid spool valve) modulates the pressure in the left control rotat-ing chamber to keep the pressure at the pump delivery almost constant by regulating the pump displacement.
Figure 2: Symbol of the pressure-compensated variable displacement pump.
The complete Simcenter Amesim software model of the pressure compensated vane pump is presented in figure 3.
Figure 3: Model of the pressure-compensated variable vane pump, created with Simcenter Amesim.
Siemens Digital Industries Software
White paper | Accelerating hydraulic component and system design with model-based systems engineering
5
Two dedicated analytical submodels are developed for vane pumps (for both sliding and pivoting technology), using Simcenter Amesim:
• The main model describes the variable displacement volume between two consecutive vanes, the external diameter of the rotor and the internal diameter of the stator ring. The chamber volume varies with both the rotor angular position and the eccentricity between the rotor and stator ring. Permanent contact between vane tip and stator ring is assumed. This model also describes the variable flow passage area between each chamber and the suction or the delivery. The silencing notch on the port rim and the grooves are also considered by this pump model.
• The additional friction model computes the torques and efforts exerted on the rotor and stator as results of the friction and contact between each vane and the stator ring of the pump. Also, the viscous friction taking place between the side plates and the rotor rim is considered in this module.
The model evaluates and takes into account the follow-ing phenomena:
• Instantaneous chamber volume and flow rate induced by the variation of the volume itself
• Back flows• Leakage flow• Variable flow passage areas between each chamber
and the suction or delivery volumes• Instantaneous chamber pressure• Instantaneous force acting on the stator ring in the
direction of the line of the centers• Instantaneous absorbed torque• Cavitation phenomenon
Consequently it is possible to analyze:
• The pump’s efficiency in different operating condi-tions (in particular, the case of incomplete filling at high pump speed)
• Kinematic and real pressure/flow ripples• The behavior of the controller (in steady and dynamic
state)• The influence of the port plate timing on the pressure/
flow ripples
An orifice at the pump outlet represents the generic load pressurizing the pump delivery. In the current example, the operating conditions of the pump are summarized below:
• Constant angular speed: 1,500 revolutions per minute (rpm)
• Cracking pressure of the control valve: about 11.45 bar
• Initial value of the pressure in the system: 0 bar• The loading orifice is kept at constant opening in the
first phase, then partially closed during the second phase and finally kept at constant opening during the third phase
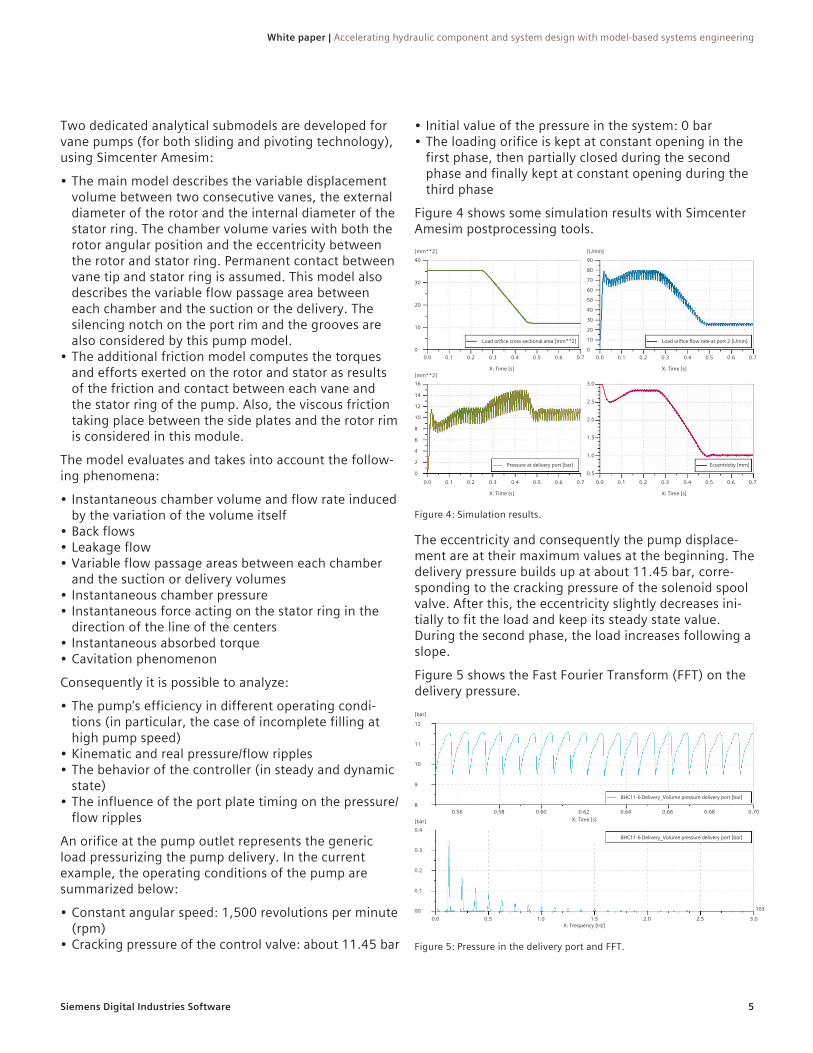
Figure 4 shows some simulation results with Simcenter Amesim postprocessing tools.
Figure 4: Simulation results.
[mm**2] [L/min]
[mm**2]X: Time [s] X: Time [s]
X: Time [s] X: Time [s]
40 90
30
80
20
70
60
50
40
30
2010
10
0 0
16 3.0
142.5
12
2.010
1.58
1.0
6
4
2
0 0.5
0.0 0.0
0.0 0.0
0.1 0.1
0.1 0.1
0.2 0.2
0.2 0.2
0.3 0.3
0.3 0.3
0.4 0.4
0.4 0.4
0.5 0.5
0.5 0.5
0.6 0.6
0.6 0.6
0.7 0.7
0.7 0.7
Load orifice cross sectional area [mm**2] Load orifice flow rate at port 2 [L/min]
Pressure at delivery port [bar] Eccentricity [mm]
The eccentricity and consequently the pump displace-ment are at their maximum values at the beginning. The delivery pressure builds up at about 11.45 bar, corre-sponding to the cracking pressure of the solenoid spool valve. After this, the eccentricity slightly decreases ini-tially to fit the load and keep its steady state value. During the second phase, the load increases following a slope.
Figure 5 shows the Fast Fourier Transform (FFT) on the delivery pressure.
Figure 5: Pressure in the delivery port and FFT.
BHC11-6 Delivery_Volume pressure delivery port [bar]
BHC11-6 Delivery_Volume pressure delivery port [bar]
[bar]
[bar]
12
0.4
11
0.3
10
0.2
9
0.1
0.56
0.0 0.5 1.0 1.5 2.0 2.5 3.0
103
0.58 0.60 0.62 0.64 0.66 0.68 0.708
00
X: Time [s]
X: Frequency [Hz]
Siemens Digital Industries Software
White paper | Accelerating hydraulic component and system design with model-based systems engineering
6
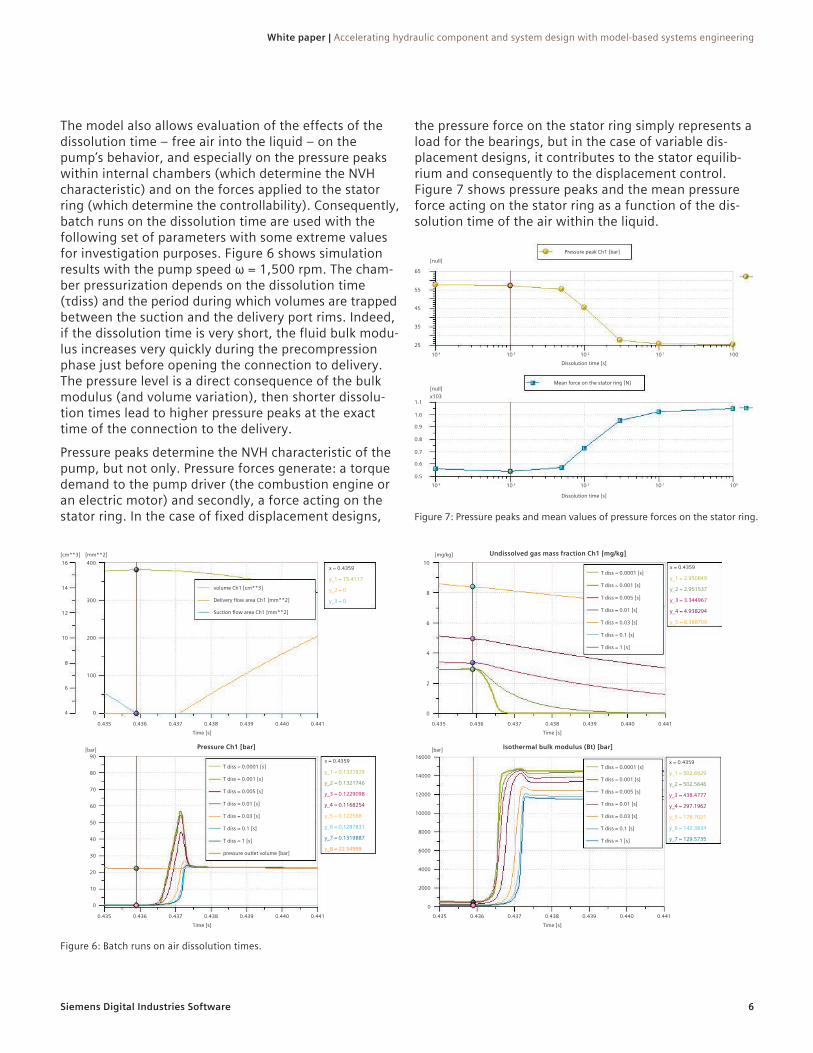
The model also allows evaluation of the effects of the dissolution time – free air into the liquid – on the pump’s behavior, and especially on the pressure peaks within internal chambers (which determine the NVH characteristic) and on the forces applied to the stator ring (which determine the controllability). Consequently, batch runs on the dissolution time are used with the following set of parameters with some extreme values for investigation purposes. Figure 6 shows simulation results with the pump speed ω = 1,500 rpm. The cham-ber pressurization depends on the dissolution time (τdiss) and the period during which volumes are trapped between the suction and the delivery port rims. Indeed, if the dissolution time is very short, the fluid bulk modu-lus increases very quickly during the precompression phase just before opening the connection to delivery. The pressure level is a direct consequence of the bulk modulus (and volume variation), then shorter dissolu-tion times lead to higher pressure peaks at the exact time of the connection to the delivery.
Pressure peaks determine the NVH characteristic of the pump, but not only. Pressure forces generate: a torque demand to the pump driver (the combustion engine or an electric motor) and secondly, a force acting on the stator ring. In the case of fixed displacement designs,
the pressure force on the stator ring simply represents a load for the bearings, but in the case of variable dis-placement designs, it contributes to the stator equilib-rium and consequently to the displacement control. Figure 7 shows pressure peaks and the mean pressure force acting on the stator ring as a function of the dis-solution time of the air within the liquid.
Figure 7: Pressure peaks and mean values of pressure forces on the stator ring.
Pressure peak Ch1 [bar]
Mean force on the stator ring [N]
[null]
[null]x103
65
1.1
1.0
0.9
0.8
0.7
0.6
0.5
55
45
35
25
10-4
10-4 10-3 10-2 10-1 100
10-3 10-2 10-1 100Dissolution time [s]
Dissolution time [s]
Figure 6: Batch runs on air dissolution times.
volume Ch1 [cm**3]
x = 0.4359
y_1 = 15.4117
y_2 = 0
y_3 = 0Delivery flow area Ch1 [mm**2]
Suction flow area Ch1 [mm**2]
[mm**2][cm**3]16 400
14
300
12
20010
100
0.435 0.436 0.437 0.438 0.439 0.440 0.441
8
6
4 0
Time [s]
T diss = 0.0001 [s]
T diss = 0.001 [s]
T diss = 0.005 [s]
T diss = 0.01 [s]
T diss = 0.03 [s]
T diss = 0.1 [s]
T diss = 1 [s]
pressure outlet volume [bar]
x = 0.4359
y_1 = 0.1321929
y_2 = 0.1321746
y_3 = 0.1229098
y_4 = 0.1168254
y_5 = 0.122588
y_6 = 0.1287831
y_7 = 0.1319887
y_8 = 22.54999
Pressure Ch1 [bar][bar]
0.435 0.436 0.437 0.438 0.439 0.440 0.441
90
80
70
60
50
40
30
20
10
0
Time [s]
x = 0.4359
y_1 = 2.950849
y_2 = 2.951537
y_3 = 3.344967
y_4 = 4.938294
y_5 = 8.388709
T diss = 0.0001 [s]
T diss = 0.001 [s]
T diss = 0.005 [s]
T diss = 0.01 [s]
T diss = 0.03 [s]
T diss = 0.1 [s]
T diss = 1 [s]
Undissolved gas mass fraction Ch1 [mg/kg][mg/kg]10
8
6
4
2
0
0.435 0.436 0.437 0.438 0.439 0.440 0.441Time [s]
x = 0.4359
y_1 = 502.6929
y_2 = 502.5646
y_3 = 438.4777
y_4 = 297.1962
y_5 = 178.7021
y_6 = 142.3834
y_7 = 129.5735
T diss = 0.0001 [s]
T diss = 0.001 [s]
T diss = 0.005 [s]
T diss = 0.01 [s]
T diss = 0.03 [s]
T diss = 0.1 [s]
T diss = 1 [s]
Isothermal bulk modulus (Bt) [bar][bar]
0.435 0.4410.4400.4390.4380.4370.436
16000
14000
12000
10000
8000
6000
4000
2000
0
Time [s]
Siemens Digital Industries Software
White paper | Accelerating hydraulic component and system design with model-based systems engineering
7
Application: Increase of energy efficiency
In the heavy equipment industry, fuel is one of the largest costs over the life of the vehicle. Improving fuel efficiency will translate into a reduction of the equip-ment operating costs. Many options may be considered to achieve the target, such as the optimization of the combustion engine, the optimization of the drivetrain efficiency and vehicle hybridization. In particular, within the hybrid option, hydraulic hybrid is a choice that has many advantages compared to the well-known electric hybrid used in the automotive industry: higher power density, reliability and others.
Forklift propulsion is commonly based on a hydrostatic transmission. During the braking phase, the kinetic energy of the forklift is mainly converted into thermal energy provided to the oil. Fuel savings of up to 25 percent and a corresponding reduction in Carbon Dioxide (CO2) emissions are expected using a hydraulic hybrid drive.
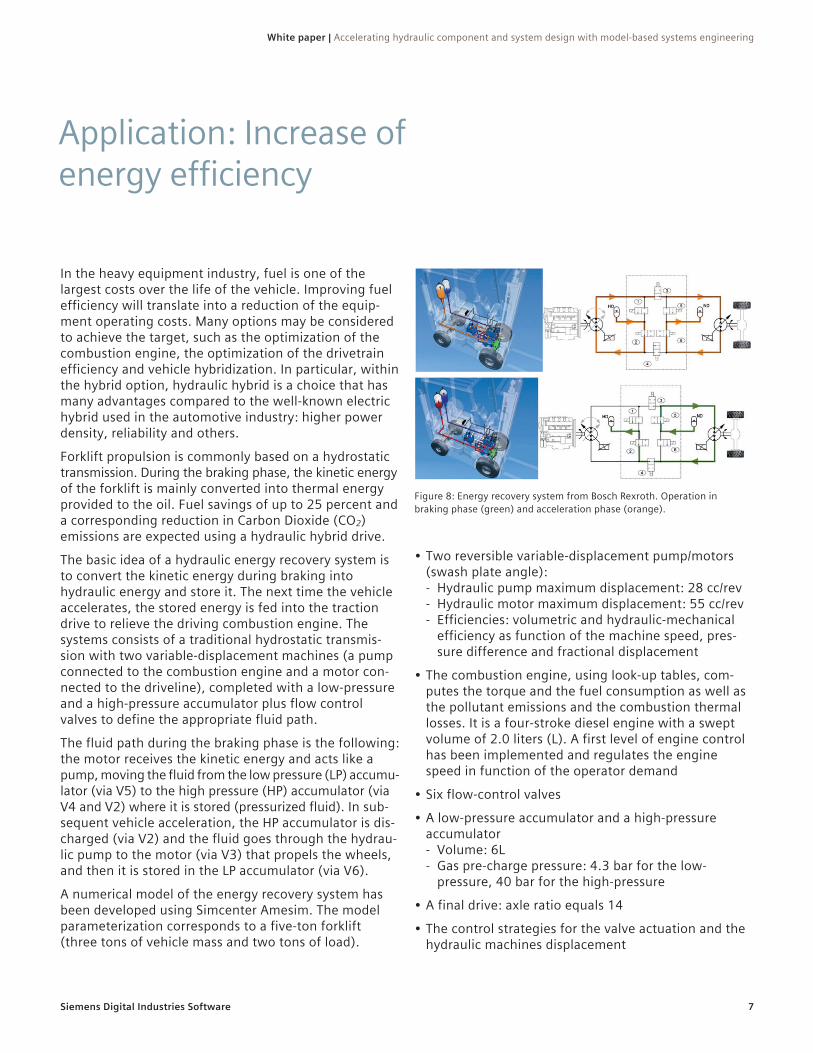
The basic idea of a hydraulic energy recovery system is to convert the kinetic energy during braking into hydraulic energy and store it. The next time the vehicle accelerates, the stored energy is fed into the traction drive to relieve the driving combustion engine. The systems consists of a traditional hydrostatic transmis-sion with two variable-displacement machines (a pump connected to the combustion engine and a motor con-nected to the driveline), completed with a low-pressure and a high-pressure accumulator plus flow control valves to define the appropriate fluid path.
The fluid path during the braking phase is the following: the motor receives the kinetic energy and acts like a pump, moving the fluid from the low pressure (LP) accumu- lator (via V5) to the high pressure (HP) accumulator (via V4 and V2) where it is stored (pressurized fluid). In sub-sequent vehicle acceleration, the HP accumulator is dis- charged (via V2) and the fluid goes through the hydrau-lic pump to the motor (via V3) that propels the wheels, and then it is stored in the LP accumulator (via V6).
A numerical model of the energy recovery system has been developed using Simcenter Amesim. The model parameterization corresponds to a five-ton forklift (three tons of vehicle mass and two tons of load).
• Two reversible variable-displacement pump/motors (swash plate angle): - Hydraulic pump maximum displacement: 28 cc/rev - Hydraulic motor maximum displacement: 55 cc/rev - Efficiencies: volumetric and hydraulic-mechanical
efficiency as function of the machine speed, pres-sure difference and fractional displacement
• The combustion engine, using look-up tables, com-putes the torque and the fuel consumption as well as the pollutant emissions and the combustion thermal losses. It is a four-stroke diesel engine with a swept volume of 2.0 liters (L). A first level of engine control has been implemented and regulates the engine speed in function of the operator demand
• Six flow-control valves
• A low-pressure accumulator and a high-pressure accumulator - Volume: 6L - Gas pre-charge pressure: 4.3 bar for the low-
pressure, 40 bar for the high-pressure
• A final drive: axle ratio equals 14
• The control strategies for the valve actuation and the hydraulic machines displacement
Figure 8: Energy recovery system from Bosch Rexroth. Operation in braking phase (green) and acceleration phase (orange).
Siemens Digital Industries Software
White paper | Accelerating hydraulic component and system design with model-based systems engineering
8
RPM target Fluid properties
Driver accelerationTheoretical load
Torque max 300 bar
HP accu
LP accu P3 motor
P1 motor
Hydraulic motor speed
300 bar
20 bar
Torque request
Pump displacement
Accumulator pressure
Motor displacement
Engine model
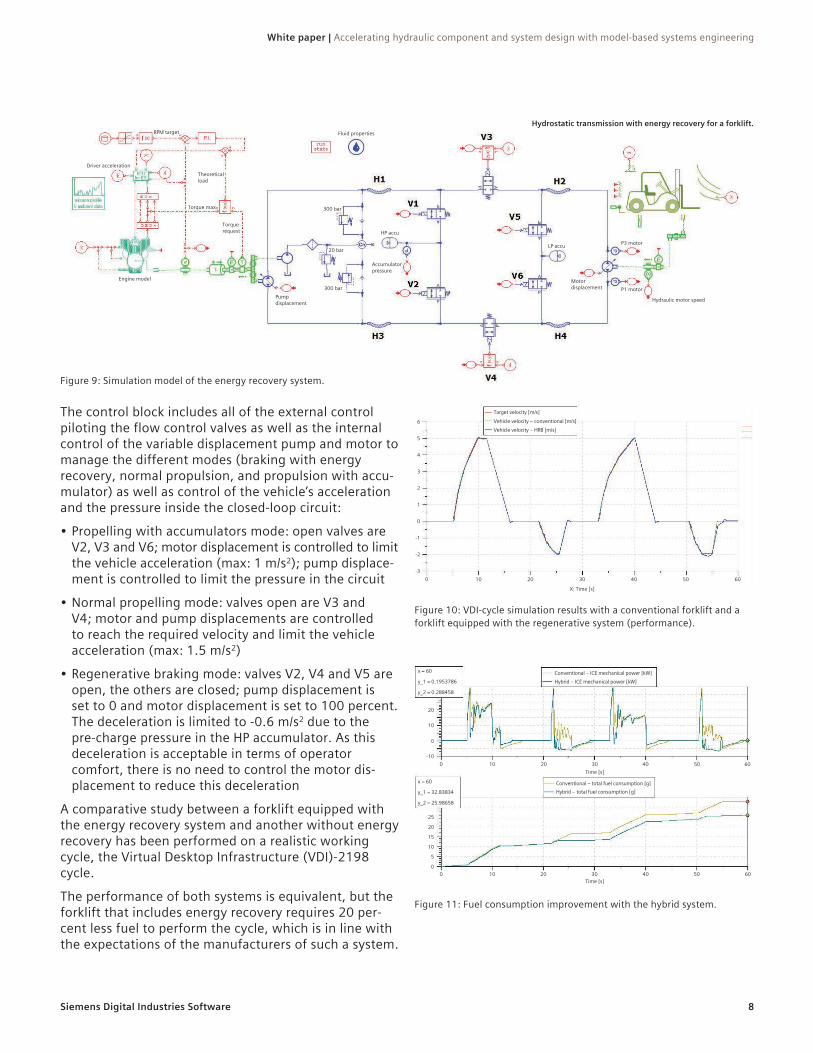
The control block includes all of the external control piloting the flow control valves as well as the internal control of the variable displacement pump and motor to manage the different modes (braking with energy recovery, normal propulsion, and propulsion with accu-mulator) as well as control of the vehicle’s acceleration and the pressure inside the closed-loop circuit:
• Propelling with accumulators mode: open valves are V2, V3 and V6; motor displacement is controlled to limit the vehicle acceleration (max: 1 m/s2); pump displace- ment is controlled to limit the pressure in the circuit
• Normal propelling mode: valves open are V3 and V4; motor and pump displacements are controlled to reach the required velocity and limit the vehicle acceleration (max: 1.5 m/s2)
• Regenerative braking mode: valves V2, V4 and V5 are open, the others are closed; pump displacement is set to 0 and motor displacement is set to 100 percent. The deceleration is limited to -0.6 m/s2 due to the pre-charge pressure in the HP accumulator. As this deceleration is acceptable in terms of operator comfort, there is no need to control the motor dis-placement to reduce this deceleration
A comparative study between a forklift equipped with the energy recovery system and another without energy recovery has been performed on a realistic working cycle, the Virtual Desktop Infrastructure (VDI)-2198 cycle.
The performance of both systems is equivalent, but the forklift that includes energy recovery requires 20 per-cent less fuel to perform the cycle, which is in line with the expectations of the manufacturers of such a system.
Figure 10: VDI-cycle simulation results with a conventional forklift and a forklift equipped with the regenerative system (performance).
X: Time [s]
6
5
4
3
2
1
0
-1
-2
0 10 20 30 40 50 60-3
Target velocity [m/s]Vehicle velocity – conventional [m/s]Vehicle velocity – HRB [m/s]
Figure 11: Fuel consumption improvement with the hybrid system.
x = 60
y_1 = 0.1953786
y_2 = 0.288458
x = 60
y_1 = 32.83834
y_2 = 25.98658
Conventional – ICE mechanical power [kW]
Conventional – total fuel consumption [g]Hybrid – total fuel consumption [g]
Hybrid – ICE mechanical power [kW]
-100
0 10 20 30 40 50 60
10 20 30 40 50 60
0
0
5
10
15
20
25
10
20
Time [s]
Time [s]
Figure 9: Simulation model of the energy recovery system.
Hydrostatic transmission with energy recovery for a forklift.
Siemens Digital Industries Software
White paper | Accelerating hydraulic component and system design with model-based systems engineering
9
Application: Reduction of vibrations
Heavy equipment systems are typically affected by a machine’s vibrations with negative consequences for the operator’s comfort, the machine’s durability and controllability. Consequently, international standards exist in order to define the acceptable vibration level for the operator’s health. Vibrations arise as a consequence of several reasons, either in the mechanical domain (structural elasticity, dry friction, end-stops, etc.) and/or in the hydraulic domain (fluid compressibility, excitation of hydraulic natural modes, etc.). Vibrations are most likely to occur in specific environments (irregular soils), but also for certain working conditions such as the download motion of goods (overrunning loads).
The proposed application example describes a pure hydraulic technology applied to a hydraulic crane to control the load lowering. Counterbalance valves are widely used in fluid power (cranes, telehandlers, winches, etc.) to prevent the load from running ahead of the pump (falling). Overcenter (OVC) valves are special designs for counterbalance valves characterized by two pilot-pressures acting onto two corresponding influence surfaces with pilot ratio α. OVC valves have a normally closed position and an open position depend-ing on the net balance between the pilot pressure forces and the spring force equivalent to the OVC crack-ing pressure (p*OVC). In the case of piston extension, a check valve integrated within the OVC valve allows the free flow to the actuator; while in the case of piston retraction, the flow goes through the OVC valve and a counter-pressure is generated within the actuator bal-ancing the gravity effects and thus preventing from falling.
It is well-known that OVC valve dynamics can play a significant role in the system’s behavior. In particular, oscillations often arise in case of load-sensing architectures.
The p*OVC is usually set depending on the maximum load to be held in the worst case of pipes failure; while the surface pilot ratio (α) is usually greater than 1 (up to 22), even though pilot ratios as small as 0.5 are also used.
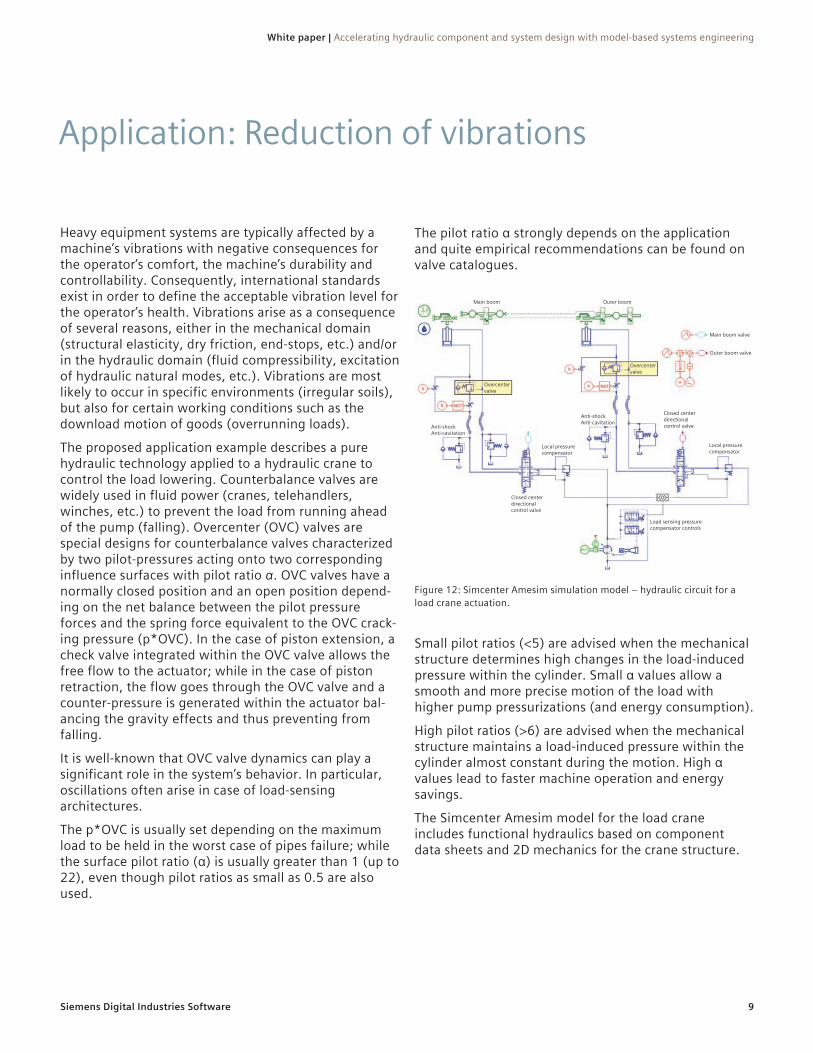
The pilot ratio α strongly depends on the application and quite empirical recommendations can be found on valve catalogues.
Figure 12: Simcenter Amesim simulation model – hydraulic circuit for a load crane actuation.
Main boom
Overcenter valve
Anti-shock Anti-cavitation
Anti-shock Anti-cavitation
Local pressure compensator
Closed center directional control valve
Load sensing pressure compensator controls
Local pressure compensator
Closed center directional control valve
Main boom valve
Outer boom valve
Overcenter valve
Outer boom
Small pilot ratios (<5) are advised when the mechanical structure determines high changes in the load-induced pressure within the cylinder. Small α values allow a smooth and more precise motion of the load with higher pump pressurizations (and energy consumption).
High pilot ratios (>6) are advised when the mechanical structure maintains a load-induced pressure within the cylinder almost constant during the motion. High α values lead to faster machine operation and energy savings.
The Simcenter Amesim model for the load crane includes functional hydraulics based on component data sheets and 2D mechanics for the crane structure.
Siemens Digital Industries Software
White paper | Accelerating hydraulic component and system design with model-based systems engineering
10
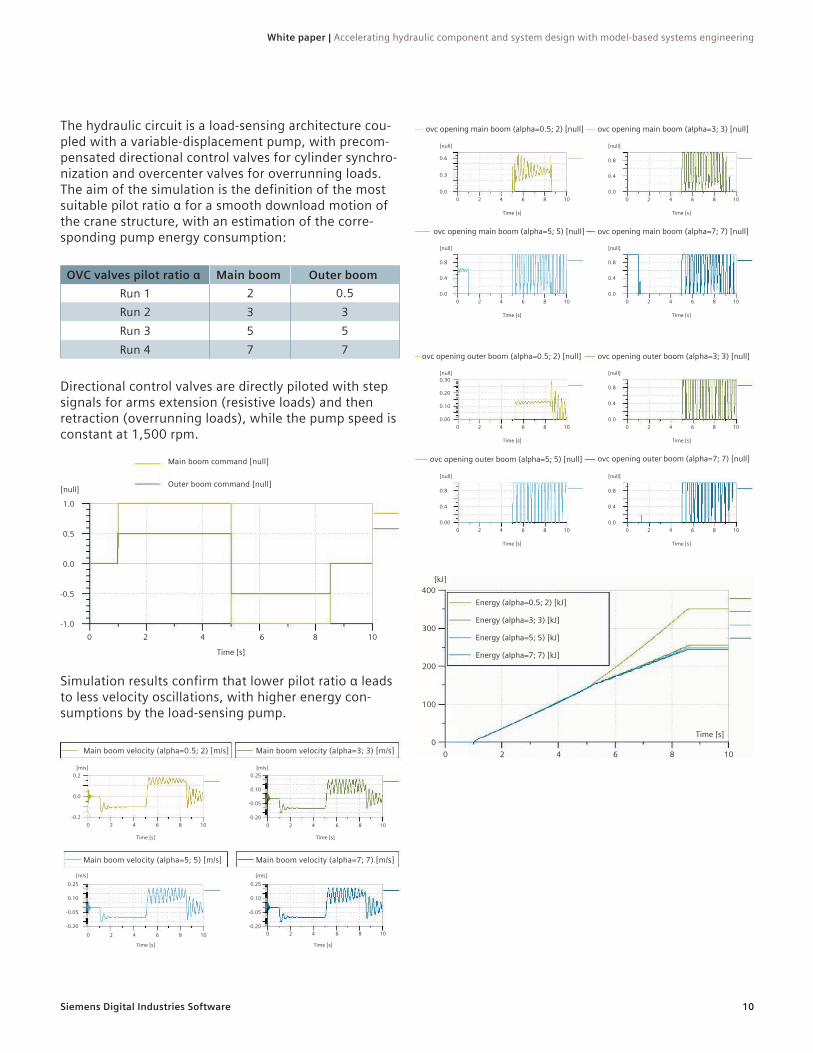
The hydraulic circuit is a load-sensing architecture cou-pled with a variable-displacement pump, with precom-pensated directional control valves for cylinder synchro-nization and overcenter valves for overrunning loads. The aim of the simulation is the definition of the most suitable pilot ratio α for a smooth download motion of the crane structure, with an estimation of the corre-sponding pump energy consumption:
OVC valves pilot ratio α Main boom Outer boomRun 1 2 0.5Run 2 3 3Run 3 5 5Run 4 7 7
Directional control valves are directly piloted with step signals for arms extension (resistive loads) and then retraction (overrunning loads), while the pump speed is constant at 1,500 rpm.
Main boom command [null]
Outer boom command [null]
0 2 4 6 8 10
1.0
0.5
0.0
-0.5
-1.0
Time [s]
[null]
Simulation results confirm that lower pilot ratio α leads to less velocity oscillations, with higher energy con-sumptions by the load-sensing pump.
Main boom velocity (alpha=0.5; 2) [m/s]
Main boom velocity (alpha=5; 5) [m/s]
Main boom velocity (alpha=3; 3) [m/s]
Main boom velocity (alpha=7; 7) [m/s]
-0.200
0 2 4 6 8 10
2 4 6 8 10 0 2 4 6 8 10
-0.2
0.0
0.2 0.25
-0.200 2 4 6 8 10
-0.05
0.10
[m/s] [m/s]
[m/s]
Time [s] Time [s]
Time [s] Time [s]
[m/s]
-0.05
0.10
0.25 0.25
0.10
-0.05
-0.20
ovc opening main boom (alpha=0.5; 2) [null]
ovc opening main boom (alpha=5; 5) [null]
ovc opening main boom (alpha=3; 3) [null]
ovc opening main boom (alpha=7; 7) [null]
[null]
[null]
[null]
[null]
Time [s]
Time [s]
Time [s]
Time [s]
0.6
0.8
0.8
0.8
0.3
0.4
0.4
0.4
0.0
0.0
0.0
0.0
0
0
0
0
2
2
2
2
4
4
4
4
6
6
6
6
8
8
8
8
10
10
10
10
ovc opening outer boom (alpha=0.5; 2) [null]
ovc opening outer boom (alpha=5; 5) [null]
ovc opening outer boom (alpha=3; 3) [null]
ovc opening outer boom (alpha=7; 7) [null]
[null]
[null]
[null]
[null]
Time [s]
Time [s]
Time [s]
Time [s]
0.30
0.8
0.8
0.8
0.20
0.4
0.10 0.4
0.4
0.00
0.00
0.0
0.0
0
0
0
0
2
2
2
2
4
4
4
4
6
6
6
6
8
8
8
8
10
10
10
10
Energy (alpha=0.5; 2) [kJ]
Energy (alpha=3; 3) [kJ]
Energy (alpha=5; 5) [kJ]
Energy (alpha=7; 7) [kJ]
400[kJ]
300
200
Time [s]
100
00 2 4 6 8 10
Siemens Digital Industries Software
White paper | Accelerating hydraulic component and system design with model-based systems engineering
11
Original equipment manufacturers (OEMs) and suppli-ers in all industry sectors involving hydraulic, pneumatic and two-phase flow components can benefit from multidomain system simulation. This technique has proven to solve integration problems earlier in the development cycle and in turn shorten the development cycle. The Simcenter Amesim platform allows an easy collaboration between suppliers and OEMs thanks to an encryption capability that protects the intellectual property.
Conclusion
References1. Markus G. Kliffken, Christine Ehret, Matthias Beck and Robert
Stawiarski, Bosch Rexroth, “Put the brake on costs and preserve the environment with hydraulic hybrid drive,” ATZ off highway 2009.
2. Lorenzo Serrao, Giulio Ornella, Gilberto Burgio, Ettore Cosoli, Dana Holding Corp., DANA SAE, “Development and testing of a hydraulic hybrid concept for off-highway vehicles,” SAE 2013 Commercial Vehicle Engineering Congress.
3. Y. Brunel, G, Lemaire, Poclain Hydraulics Industrie, “An hydraulic hybrid system using radial piston P/M: control and efficiency,” IFPE 2011 - 52nd National Conference on Fluid Power, March 23-25, Las Vegas, USA.
4. F. Furno, L. Vasile , D. Andersson, “The Simcenter Amesim tool for the analysis and the optimization of hydraulic vane pumps,” 11th Scandinavian International Conference on Fluid Power, SICFP09, June 2-4, 2009, Linkoping, Sweden.
5. S. Manco, N. Nervegna, M. Rundo, G. Armenio, “Modeling and simula-tion of variable displacement vane pumps for IC engine lubrication,” 2004 SAE International World Congress, Detroit, Michigan.
6. J. Ivantsyn, M. Ivantysynova, Hydrostatic Pumps and Motors, Tech Books International 2003.
7. INCOSE. Systems Engineering Handbook: A guide for system life cycle processes and activities, INCOSE, 2011.
8. D. Cristofori, A. Vacca and K. Ariyur, “A novel pressure-feedback based adaptative control method to damp instabilities of hydraulic Machines,” SAE 2012-01-2035.
9. G. F. Ritelli and A. Vacca, “Energy and dynamic impact of counterbal-ance valves in fluid power machines,” Energy Conversion and Management 76 (2013) 701-711 - Elsevier.
10. Bosch Rexroth Oil Control S.p.A, Counterbalance Valves Catalogue11. N. Nervegna, Oleodinamica e pneumatica, Politeko 2003, Turin - Italy.
White paper | Accelerating hydraulic component and system design with model-based systems engineering
Siemens Digital Industries Software
HeadquartersGranite Park One 5800 Granite Parkway Suite 600 Plano, TX 75024 USA +1 972 987 3000
AmericasGranite Park One 5800 Granite Parkway Suite 600 Plano, TX 75024 USA +1 314 264 8499
EuropeStephenson House Sir William Siemens Square Frimley, Camberley Surrey, GU16 8QD +44 (0) 1276 413200
Asia-PacificUnit 901-902, 9/FTower B, Manulife Financial Centre223-231 Wai Yip Street, Kwun TongKowloon, Hong Kong +852 2230 3333
siemens.com/software© 2020 Siemens. A list of relevant Siemens trademarks can be found here. Other trademarks belong to their respective owners.
55533-C8 3/20 H
About Siemens Digital Industries SoftwareSiemens Digital Industries Software is driving transfor-mation to enable a digital enterprise where engineering, manufacturing and electronics design meet tomorrow. Our solutions help companies of all sizes create and leverage digital twins that provide organizations with new insights, opportunities and levels of automation to drive innovation. For more information on Siemens Digital Industries Software products and services, visit siemens.com/software or follow us on LinkedIn, Twitter, Facebook and Instagram. Siemens Digital Industries Software – Where today meets tomorrow.