si units - mmstcphysics.weebly.com
TRANSCRIPT
SI UNITS (Le System International d’unites)
• Standard System of measurement used by scientific community.
• Based on universal values
• Not really the metric system but close.
There are two types of nations in this world; those that use the metric system, and those who have walked on the moon.
SI UnitsLENGTH
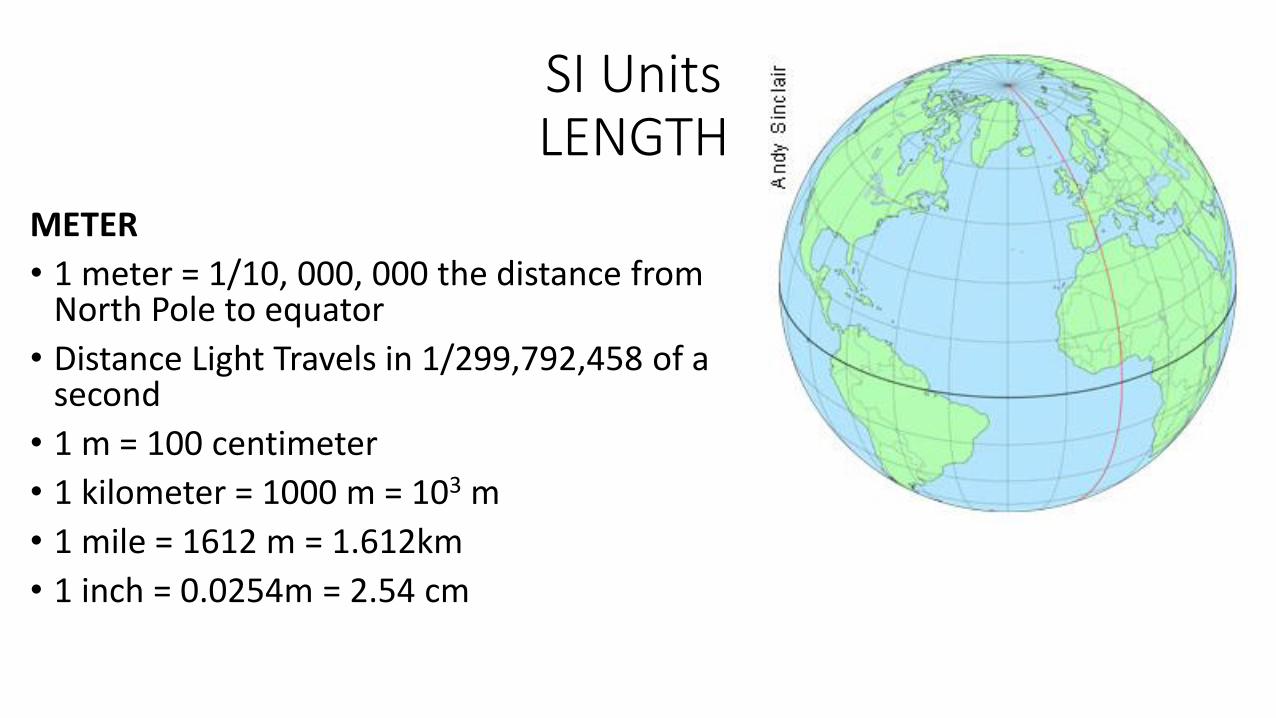
METER
• 1 meter = 1/10, 000, 000 the distance from North Pole to equator
• Distance Light Travels in 1/299,792,458 of a second
• 1 m = 100 centimeter
• 1 kilometer = 1000 m = 103 m
• 1 mile = 1612 m = 1.612km
• 1 inch = 0.0254m = 2.54 cm
SI UnitsMass
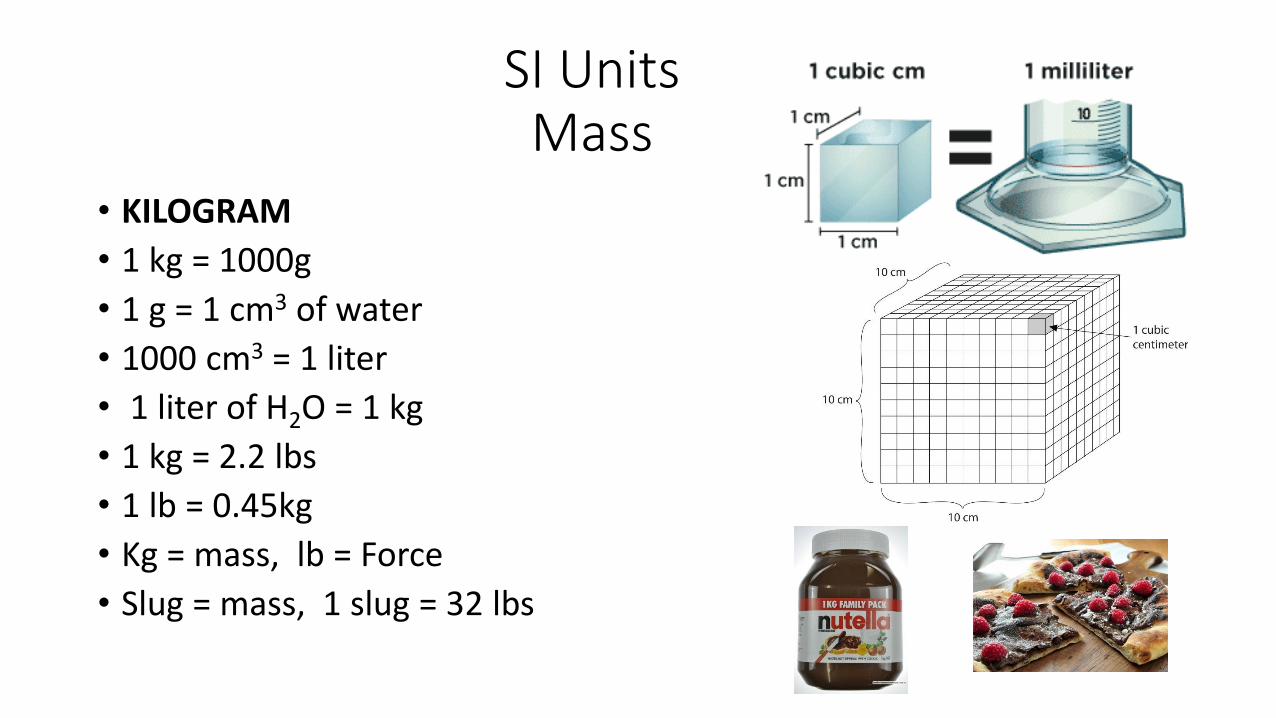
• KILOGRAM
• 1 kg = 1000g
• 1 g = 1 cm3 of water
• 1000 cm3 = 1 liter
• 1 liter of H2O = 1 kg
• 1 kg = 2.2 lbs
• 1 lb = 0.45kg
• Kg = mass, lb = Force
• Slug = mass, 1 slug = 32 lbs

SI UnitsTIME
• SECOND
• 1 second = 1/86, 400 of a mean solar day
• 1 second = 0.0000157 days = 1.57*10-5 days
• Time it takes:• To say: 1 chimpanzee
• A snail to travel 1 cm
• The international space station travels 7700m
• The time a Cesium atom vibrates 9,192,631,770 times (1967, General Conference of Weights and Measures)
SI UNITSTemperature
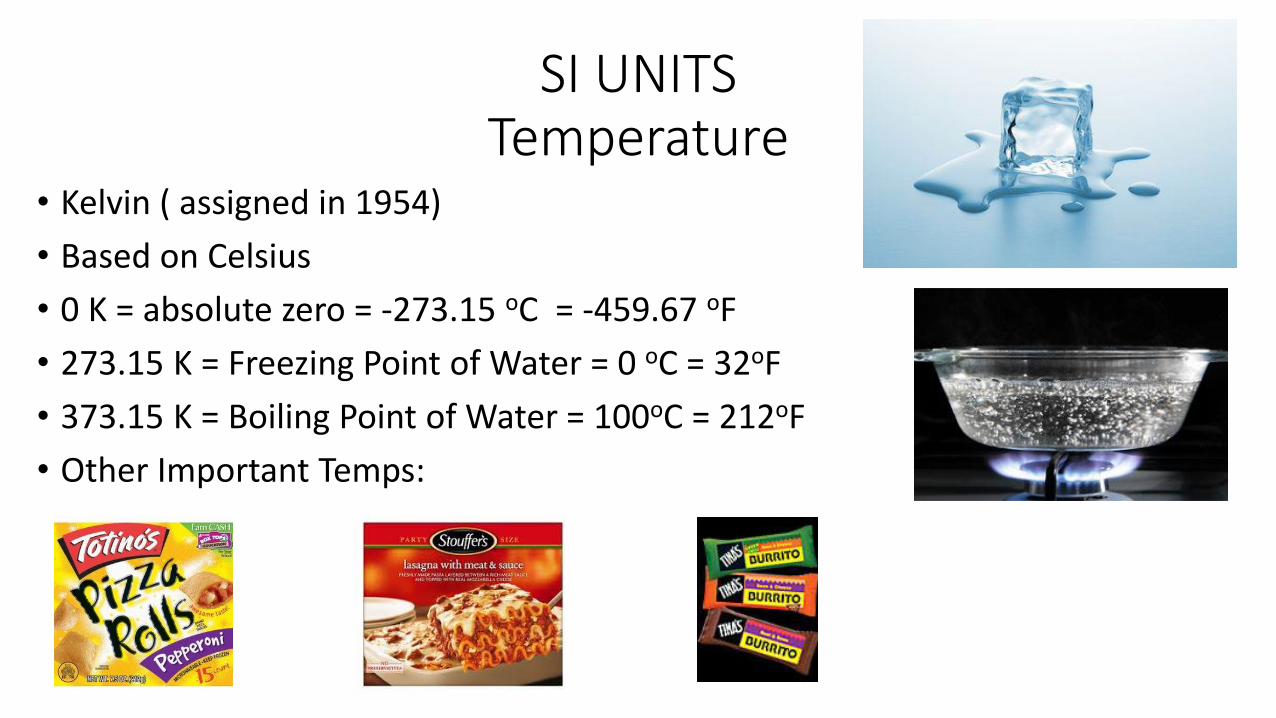
• Kelvin ( assigned in 1954)
• Based on Celsius
• 0 K = absolute zero = -273.15 oC = -459.67 oF
• 273.15 K = Freezing Point of Water = 0 oC = 32oF
• 373.15 K = Boiling Point of Water = 100oC = 212oF
• Other Important Temps:
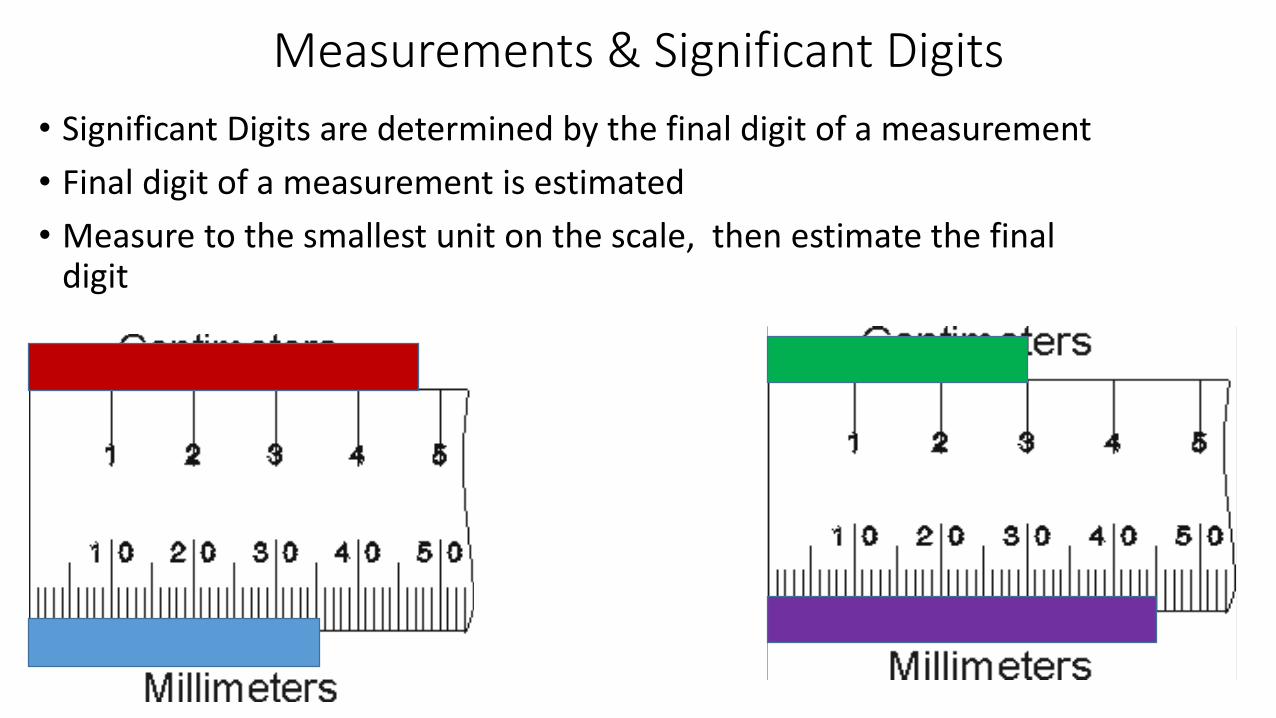
Measurements & Significant Digits
• Significant Digits are determined by the final digit of a measurement
• Final digit of a measurement is estimated
• Measure to the smallest unit on the scale, then estimate the final digit

Significant DigitsRULES FOR ZEROS
• All non-zero numbers are significant
• All Final Zeros after a decimal are significant (ex. 3.0 cm)
• Zeros between of Sig. Digits are significant (ex. 20.05 mm)
• Zeros use only as as place holders are NOT significant ( ex. 0.030 m, or 0.0205 m)
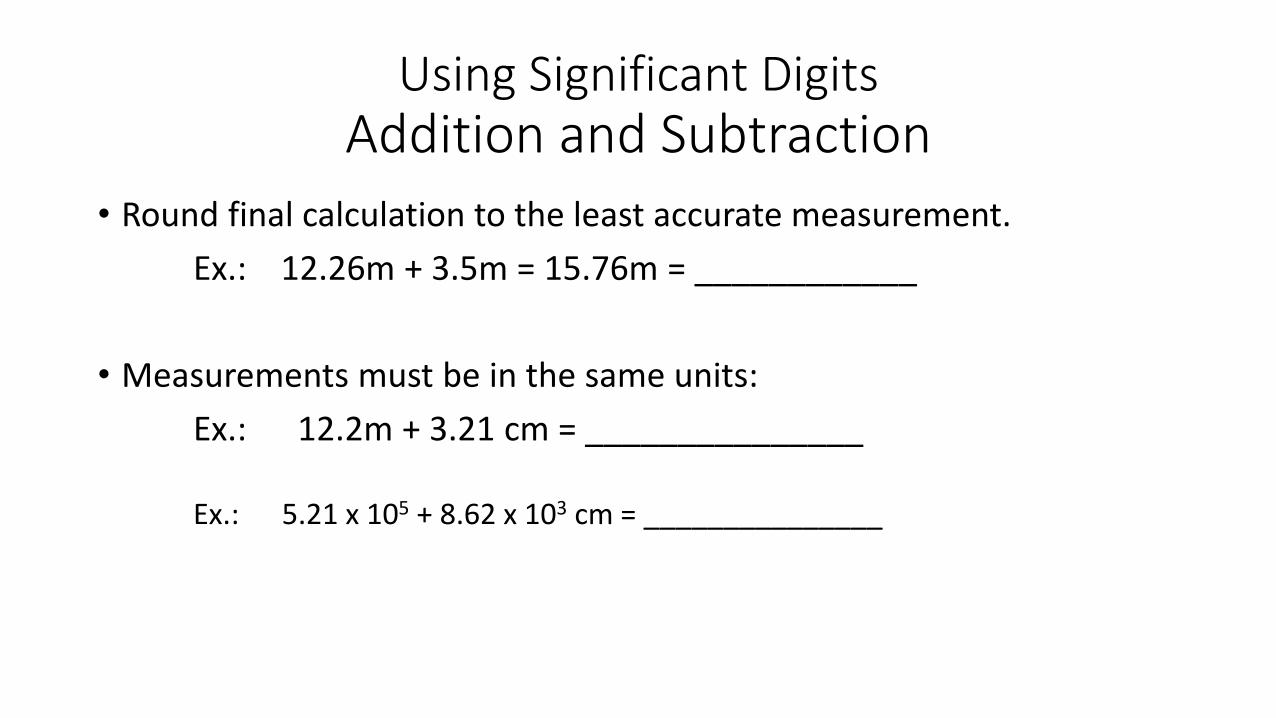
Using Significant DigitsAddition and Subtraction
• Round final calculation to the least accurate measurement.
Ex.: 12.26m + 3.5m = 15.76m = ____________
• Measurements must be in the same units:
Ex.: 12.2m + 3.21 cm = _______________
Ex.: 5.21 x 10⁵ + 8.62 x 103 cm = _______________
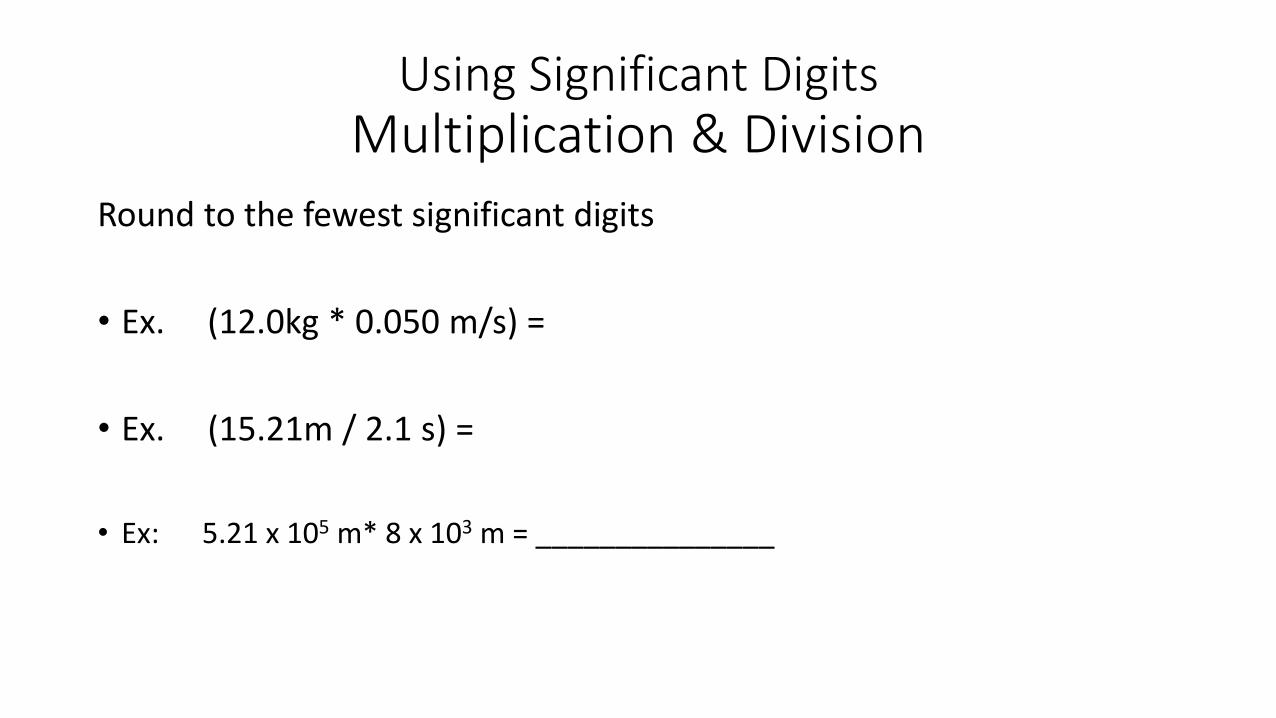
Using Significant DigitsMultiplication & Division
Round to the fewest significant digits
• Ex. (12.0kg * 0.050 m/s) =
• Ex. (15.21m / 2.1 s) =
• Ex: 5.21 x 105 m* 8 x 103 m = _______________

Calculate perimeter and area of the object below with the appropriate significant figures
1.5 m
65.0 cm

HW: Worksheet
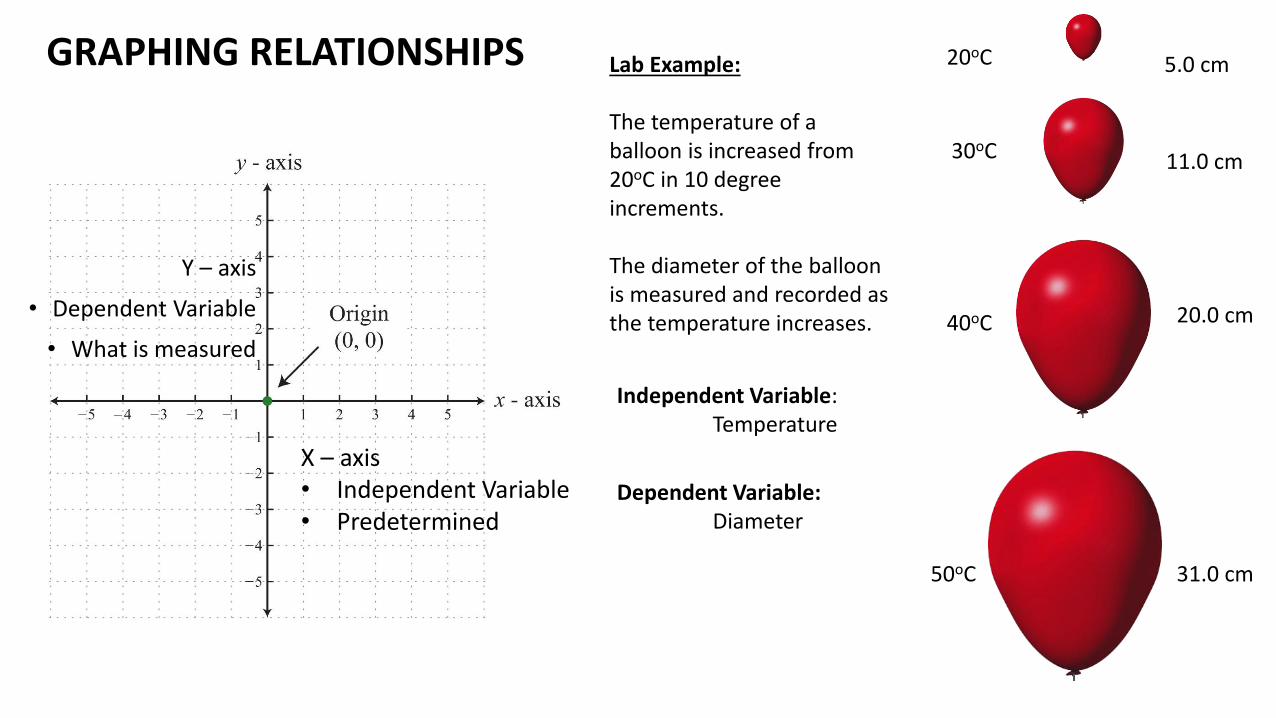
Y – axis
• Dependent Variable
• What is measured
X – axis• Independent Variable• Predetermined
GRAPHING RELATIONSHIPS 20oC
30oC
40oC
50oC
5.0 cm
11.0 cm
20.0 cm
31.0 cm
Lab Example:
The temperature of a balloon is increased from 20oC in 10 degree increments.
The diameter of the balloon is measured and recorded as the temperature increases.
Independent Variable:Temperature
Dependent Variable:Diameter
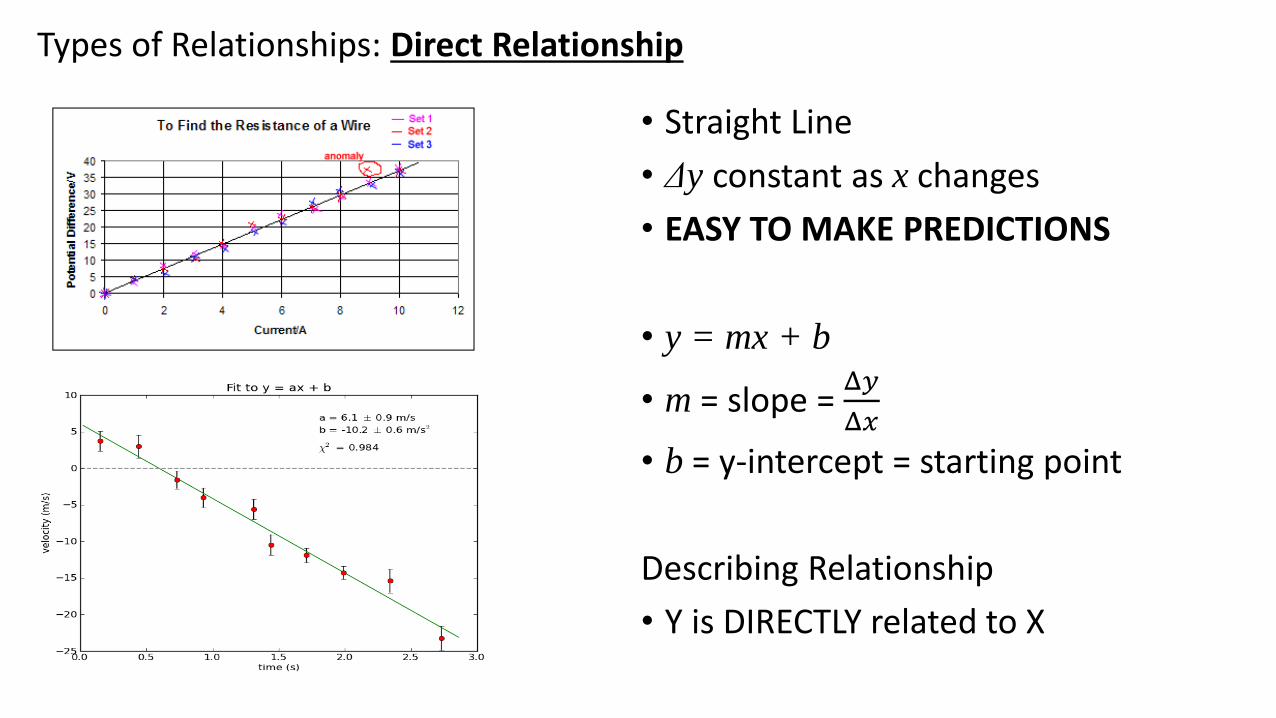
• Straight Line
• Δy constant as x changes
• EASY TO MAKE PREDICTIONS
• y = mx + b
• m = slope = Δ𝑦
Δ𝑥
• b = y-intercept = starting point
Describing Relationship
• Y is DIRECTLY related to X
Types of Relationships: Direct Relationship
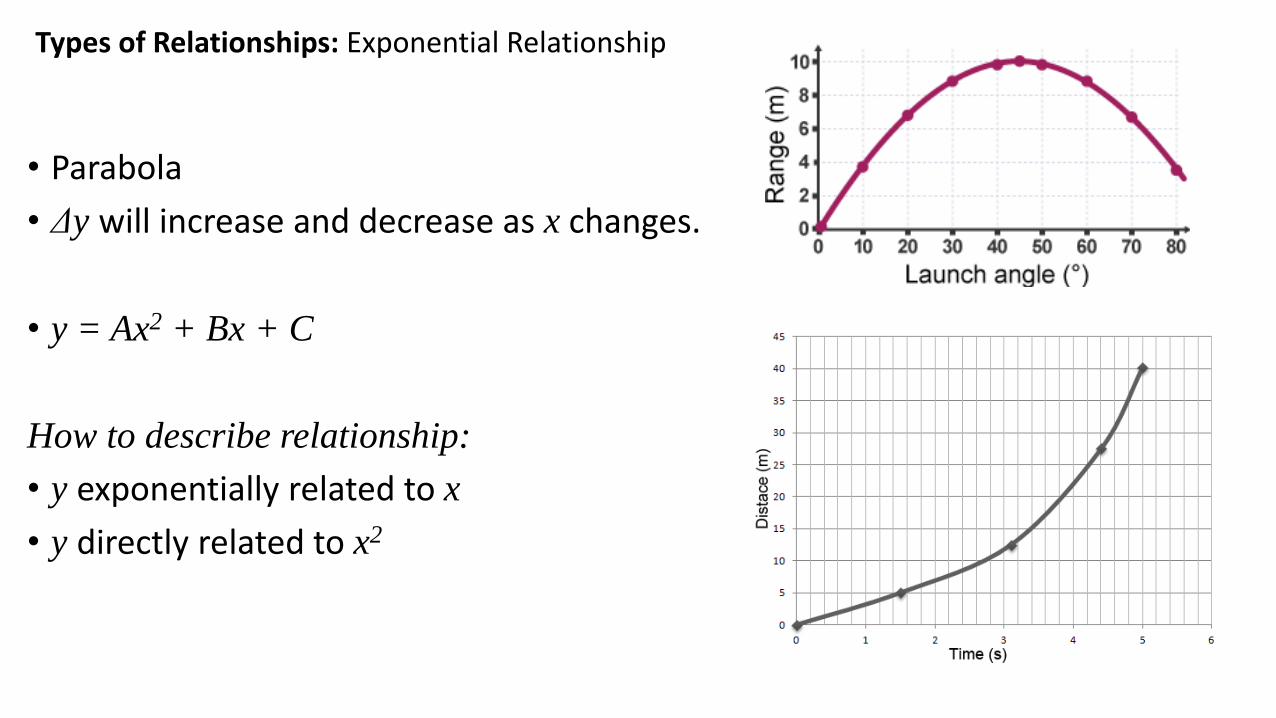
• Parabola
• Δy will increase and decrease as x changes.
• y = Ax2 + Bx + C
How to describe relationship:
• y exponentially related to x
• y directly related to x2
Types of Relationships: Exponential Relationship
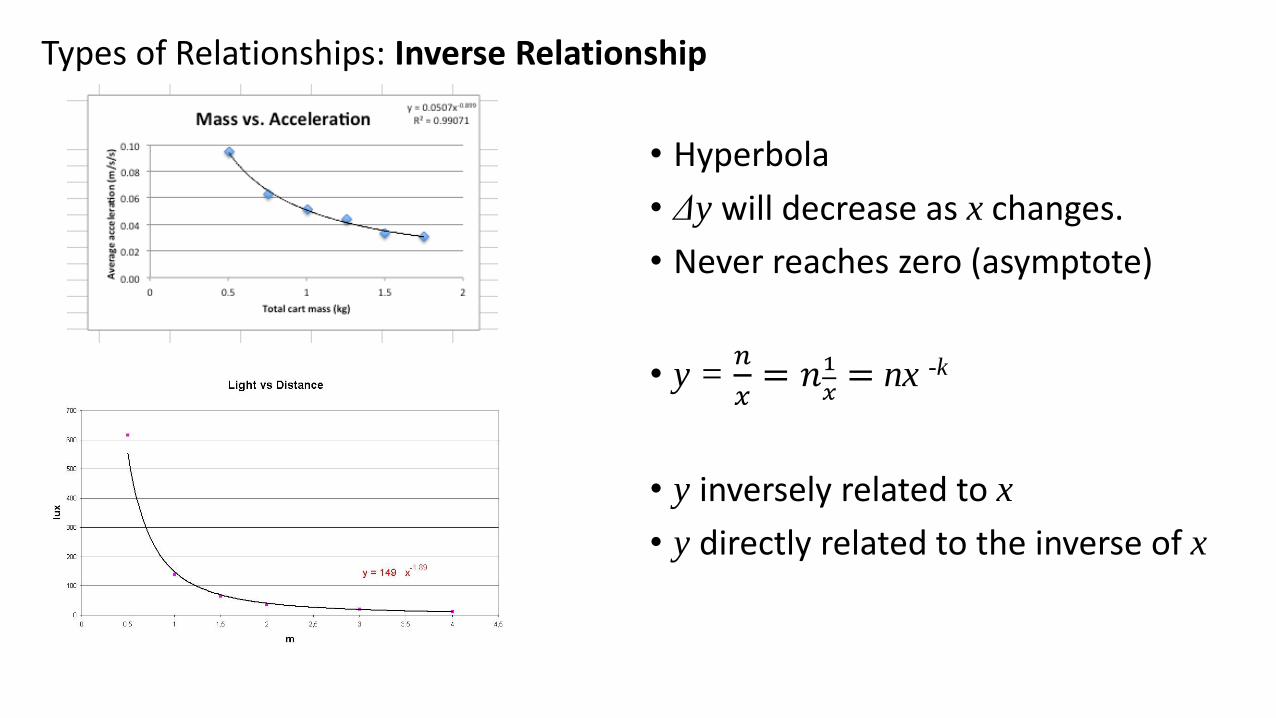
• Hyperbola
• Δy will decrease as x changes.
• Never reaches zero (asymptote)
• y = 𝑛
𝑥= 𝑛1
𝑥= nx -k
• y inversely related to x
• y directly related to the inverse of x
Types of Relationships: Inverse Relationship

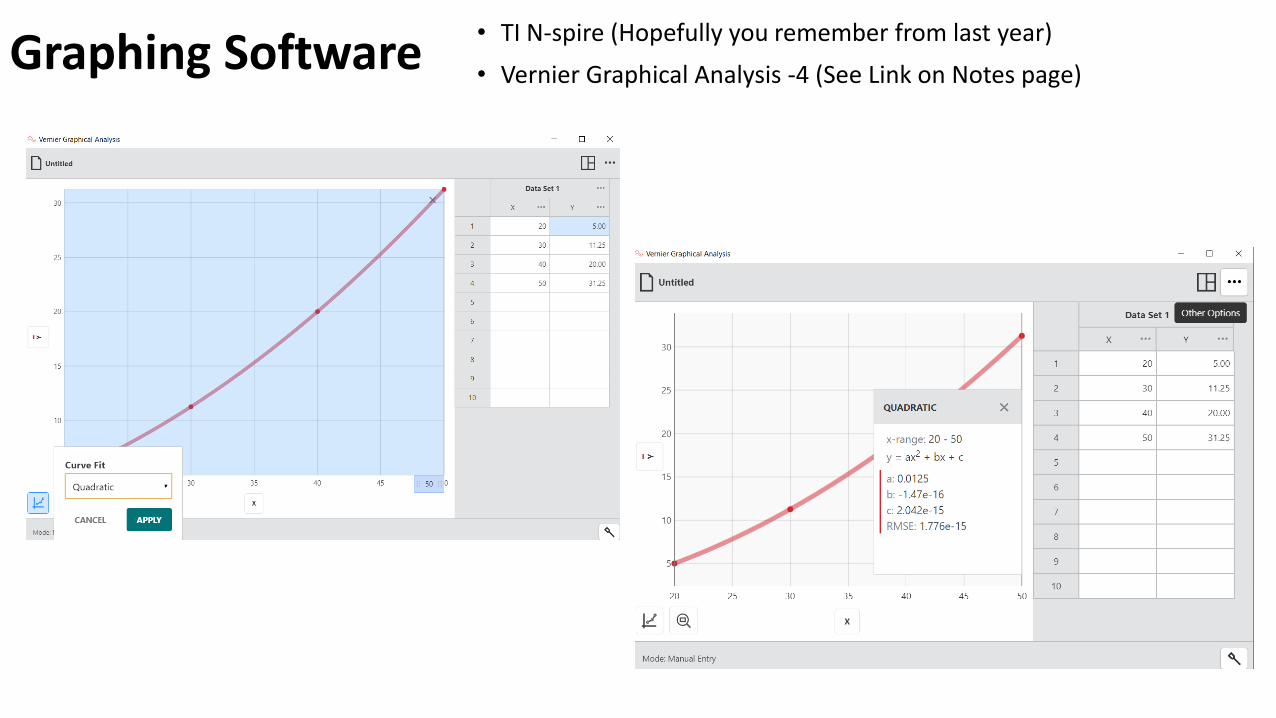
• TI N-spire (Hopefully you remember from last year)
• Vernier Graphical Analysis -4 (See Link on Notes page)Graphing Software
• TI N-spire (Hopefully you remember from last year)
• Vernier Graphical Analysis -4 (See Link on Notes page)Graphing Software
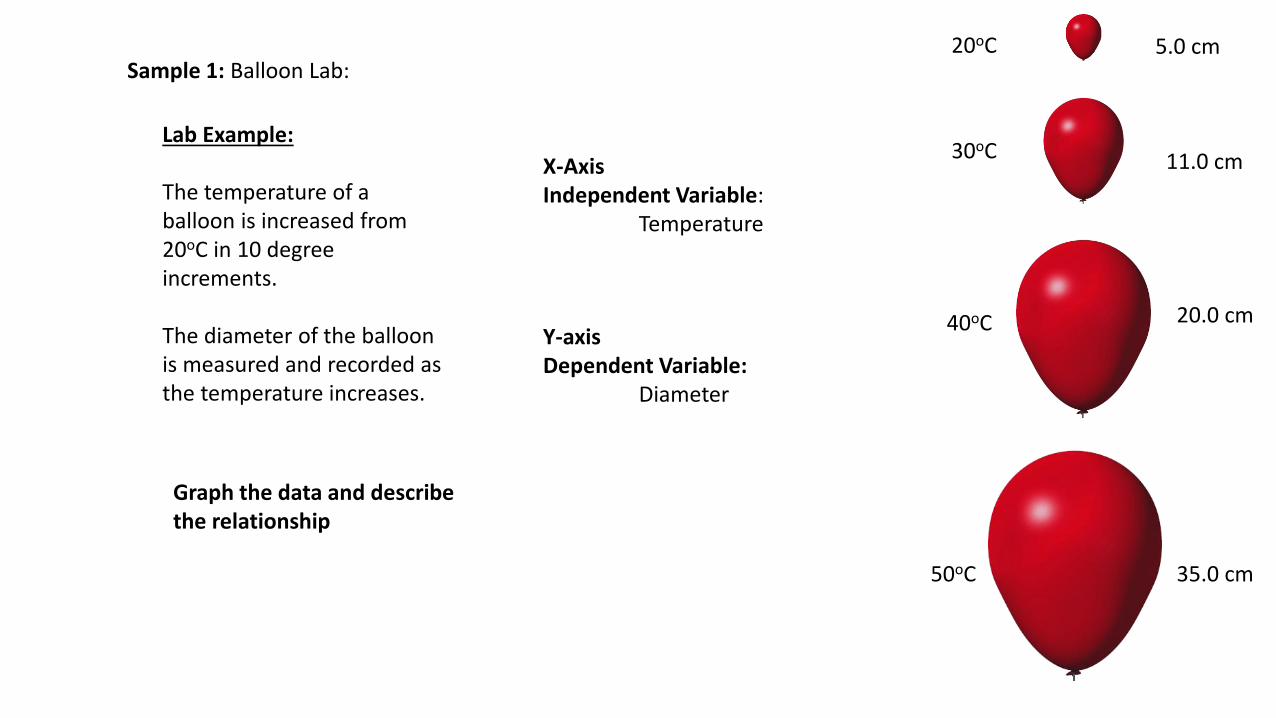
Sample 1: Balloon Lab:20oC
30oC
40oC
50oC
5.0 cm
11.0 cm
20.0 cm
35.0 cm
Lab Example:
The temperature of a balloon is increased from 20oC in 10 degree increments.
The diameter of the balloon is measured and recorded as the temperature increases.
X-AxisIndependent Variable:
Temperature
Y-axisDependent Variable:
Diameter
Graph the data and describe the relationship
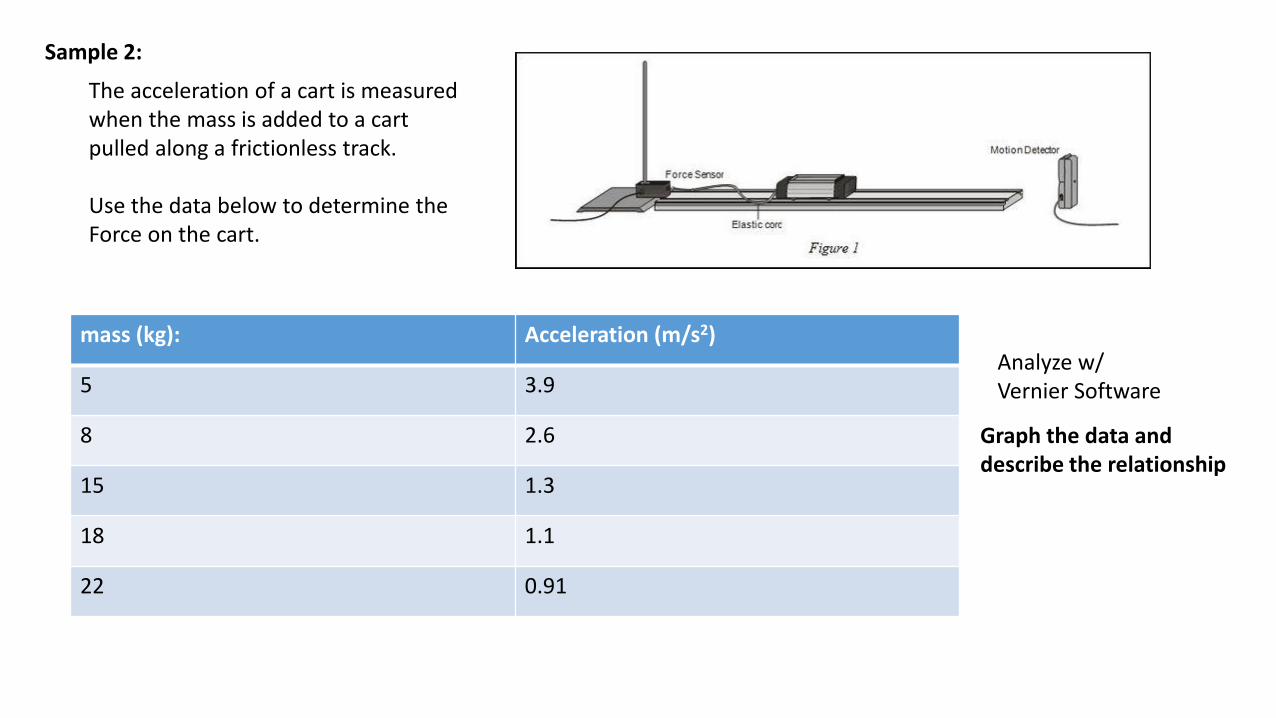
Sample 2:
The acceleration of a cart is measured when the mass is added to a cart pulled along a frictionless track.
Use the data below to determine the Force on the cart.
mass (kg): Acceleration (m/s2)
5 3.9
8 2.6
15 1.3
18 1.1
22 0.91
Analyze w/Vernier Software
Graph the data and describe the relationship
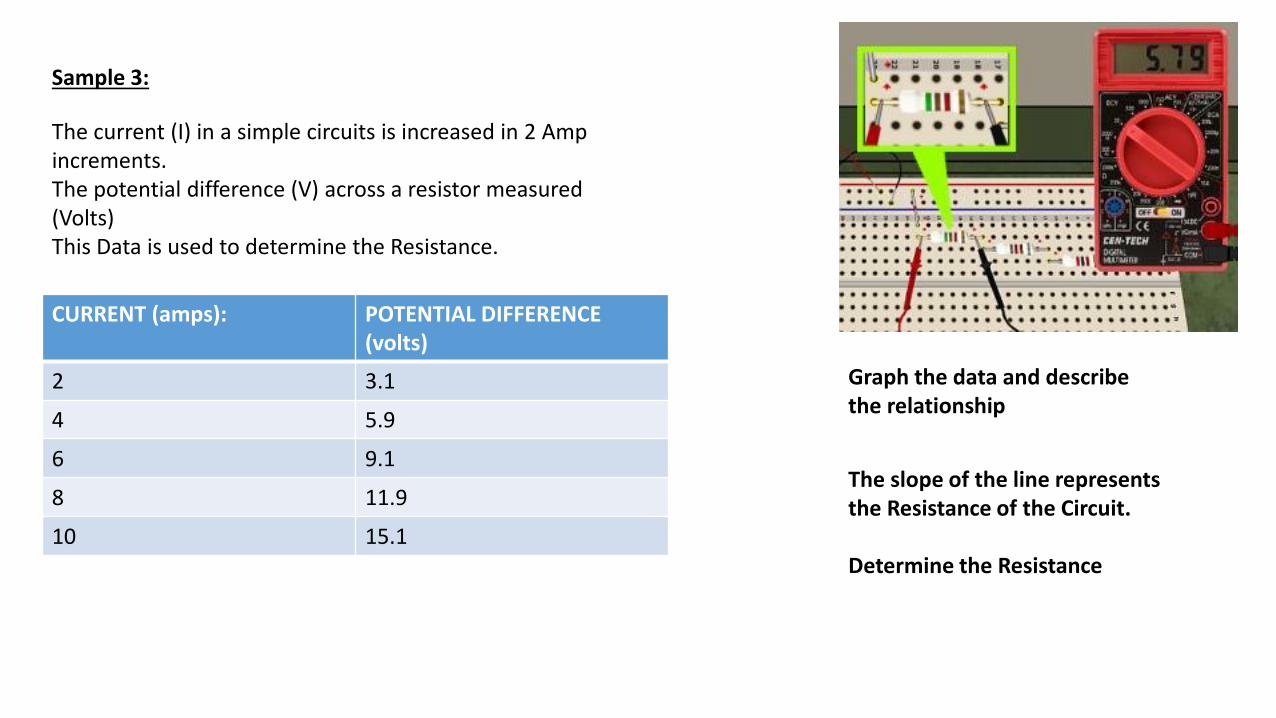
Sample 3:
The current (I) in a simple circuits is increased in 2 Amp increments.The potential difference (V) across a resistor measured (Volts) This Data is used to determine the Resistance.
CURRENT (amps): POTENTIAL DIFFERENCE (volts)
2 3.1
4 5.9
6 9.1
8 11.9
10 15.1
Graph the data and describe the relationship
The slope of the line represents the Resistance of the Circuit.
Determine the Resistance

Determining Absolute Zero(HOMEWORK)
TEMPERATURE (oC) PRESSURE (AP)