the si system of fundamental and derived units 1.2.1state the fundamental units in the si system....
TRANSCRIPT
The SI system of fundamental and derived units
1.2.1 State the fundamental units in the SI system.
1.2.2 Distinguish between fundamental and derived units and give examples of derived units.
1.2.3 Convert between different units of quantities.
1.2.4 State units in the accepted SI format.
1.2.5 State values in scientific notation and in multiples of units with appropriate prefixes.
Topic 1: Physics and physical measurement1.2 Measurement and uncertainties
The SI system of fundamental and derived units
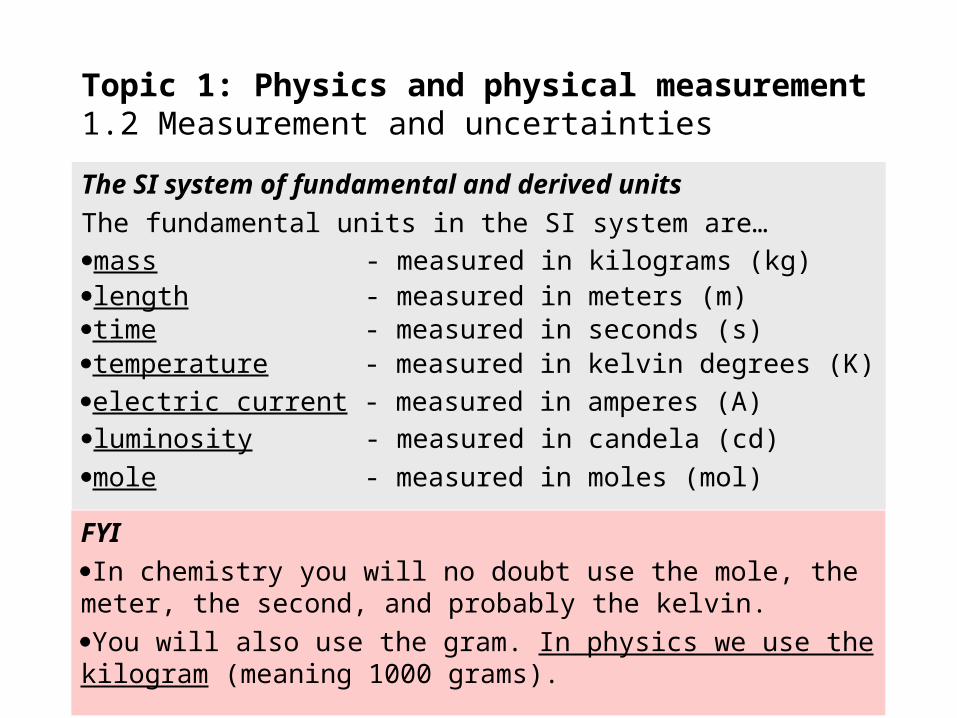
The fundamental units in the SI system are…
Topic 1: Physics and physical measurement1.2 Measurement and uncertainties
mass - measured in kilograms (kg)length - measured in meters (m)time - measured in seconds (s)temperature - measured in kelvin degrees (K)electric current - measured in amperes (A)luminosity - measured in candela (cd)mole - measured in moles (mol)
FYI
In chemistry you will no doubt use the mole, the meter, the second, and probably the kelvin.
You will also use the gram. In physics we use the kilogram (meaning 1000 grams).
The SI system of fundamental and derived units
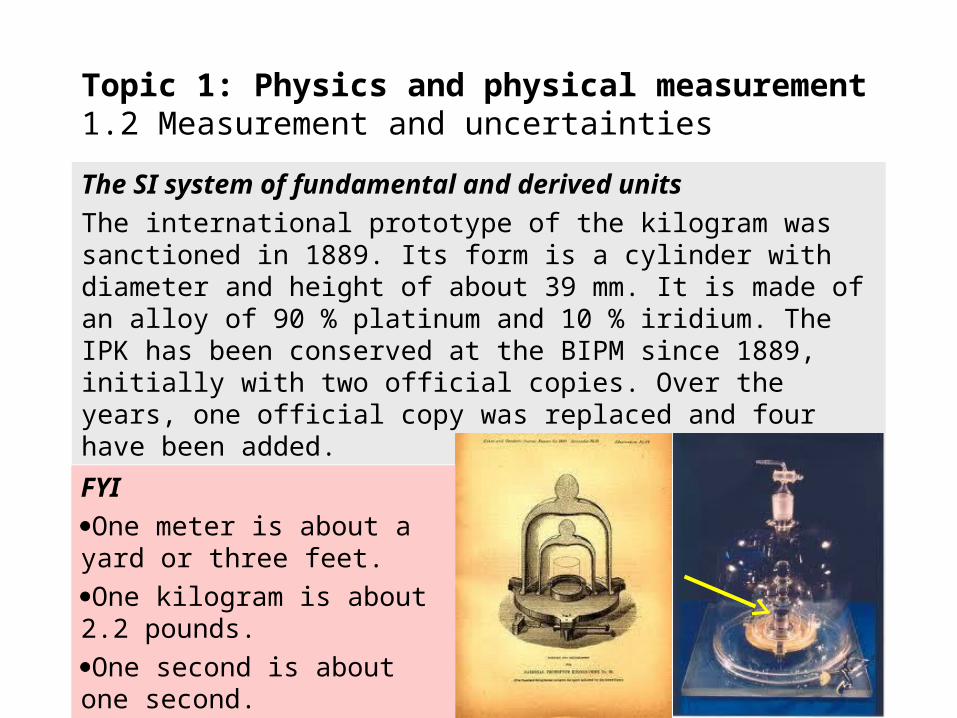
The international prototype of the kilogram was sanctioned in 1889. Its form is a cylinder with diameter and height of about 39 mm. It is made of an alloy of 90 % platinum and 10 % iridium. The IPK has been conserved at the BIPM since 1889, initially with two official copies. Over the years, one official copy was replaced and four have been added.
Topic 1: Physics and physical measurement1.2 Measurement and uncertainties
FYI
One meter is about a yard or three feet.
One kilogram is about 2.2 pounds.
One second is about one second.
The SI system of fundamental and derived units
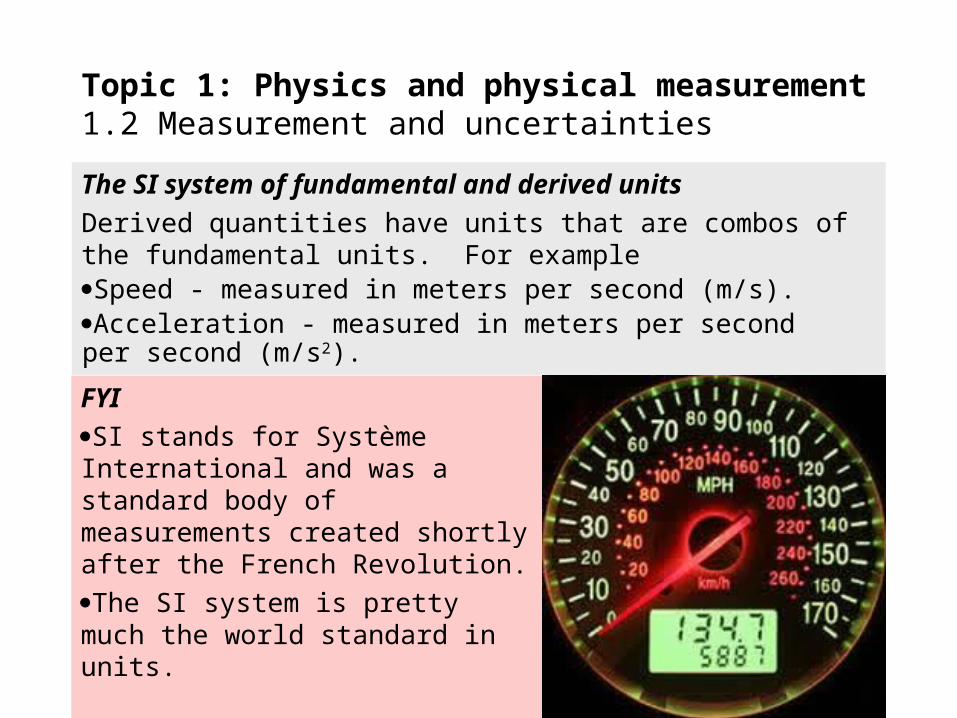
Derived quantities have units that are combos of the fundamental units. For example
Topic 1: Physics and physical measurement1.2 Measurement and uncertainties
Speed - measured in meters per second (m/s).Acceleration - measured in meters per second per second (m/s2).
FYI
SI stands for Système International and was a standard body of measurements created shortly after the French Revolution.
The SI system is pretty much the world standard in units.
The SI system of fundamental and derived units
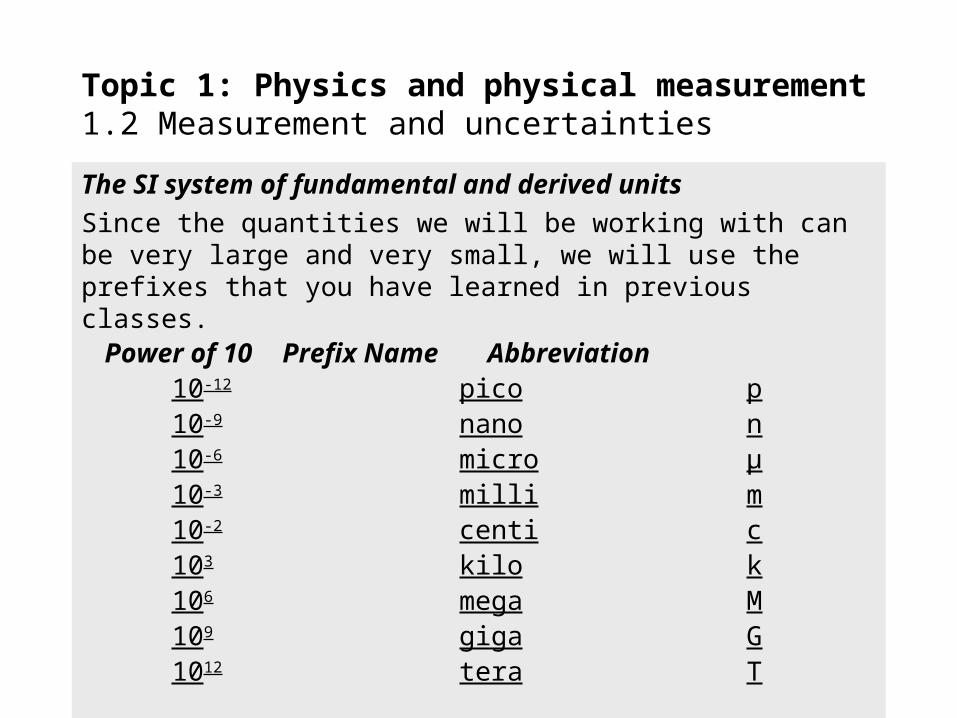
Since the quantities we will be working with can be very large and very small, we will use the prefixes that you have learned in previous classes.
Topic 1: Physics and physical measurement1.2 Measurement and uncertainties
Power of 10 Prefix Name Abbreviation10-12 pico p10-9 nano n10-6 micro µ10-3 milli m10-2 centi c103 kilo k106 mega M109 giga G1012 tera T
The SI system of fundamental and derived units
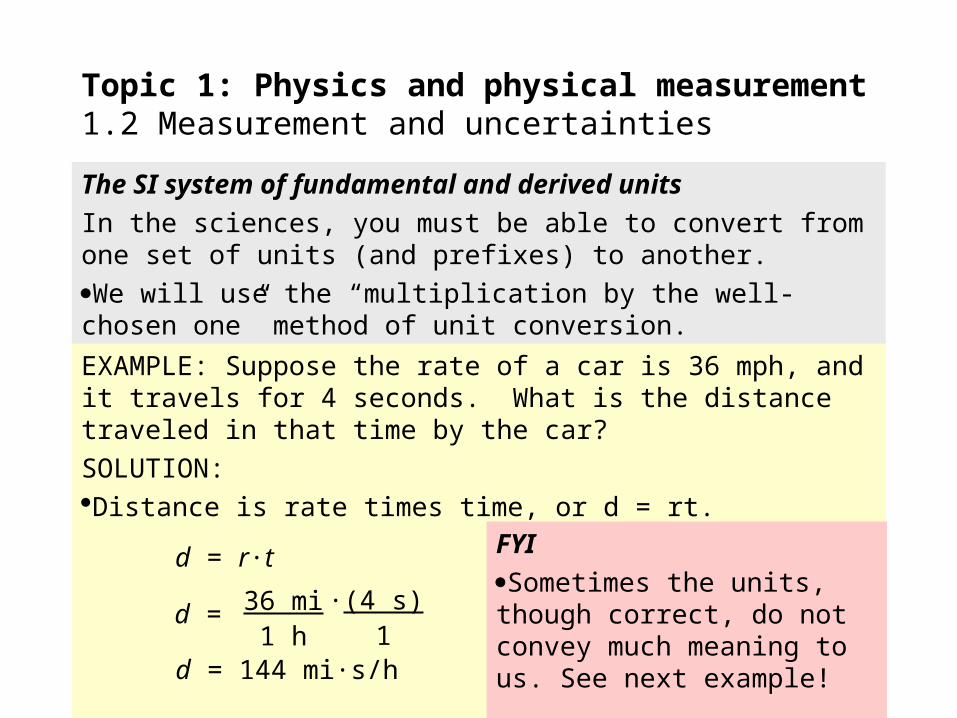
In the sciences, you must be able to convert from one set of units (and prefixes) to another.
We will use the “multiplication by the well-chosen one” method of unit conversion.
Topic 1: Physics and physical measurement1.2 Measurement and uncertainties
EXAMPLE: Suppose the rate of a car is 36 mph, and it travels for 4 seconds. What is the distance traveled in that time by the car?
SOLUTION:Distance is rate times time, or d = rt.
d = r·t
d = 36 mi1 h
·(4 s) 1
d = 144 mi·s/h
FYI
Sometimes the units, though correct, do not convey much meaning to us. See next example!
The SI system of fundamental and derived units
In the sciences, you must be able to convert from one set of units (and prefixes) to another.
We will use the “multiplication by the well-chosen one” method of unit conversion.
Topic 1: Physics and physical measurement1.2 Measurement and uncertainties
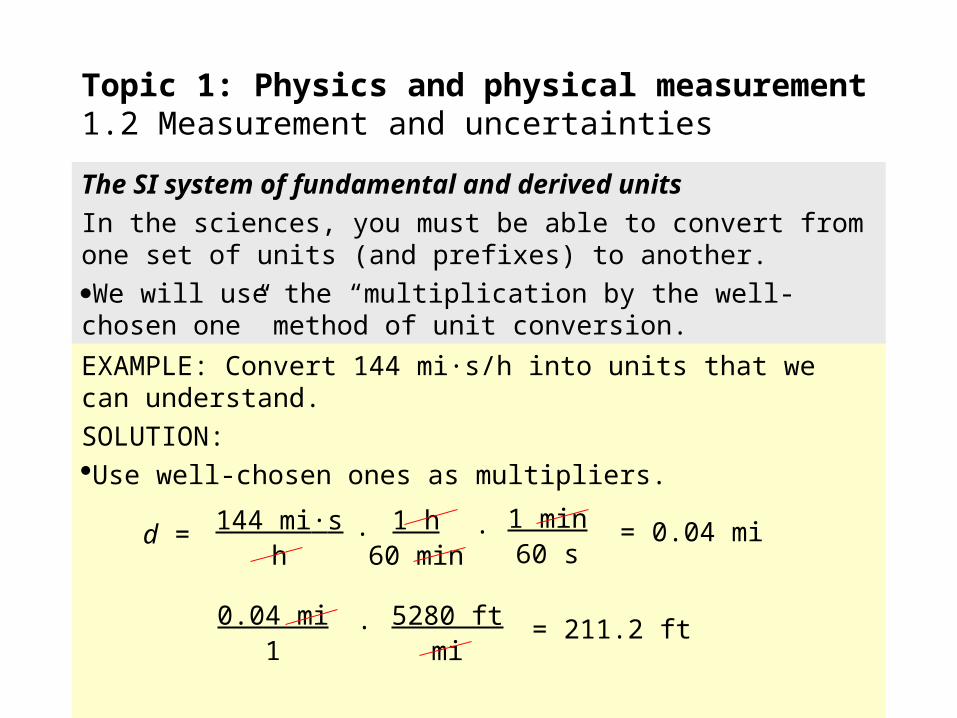
EXAMPLE: Convert 144 mi·s/h into units that we can understand.
SOLUTION:Use well-chosen ones as multipliers.
d = 144 mi·sh
1 h60 min· · 1 min
60 s= 0.04 mi
0.04 mi1
5280 ftmi
· = 211.2 ft
The SI system of fundamental and derived units
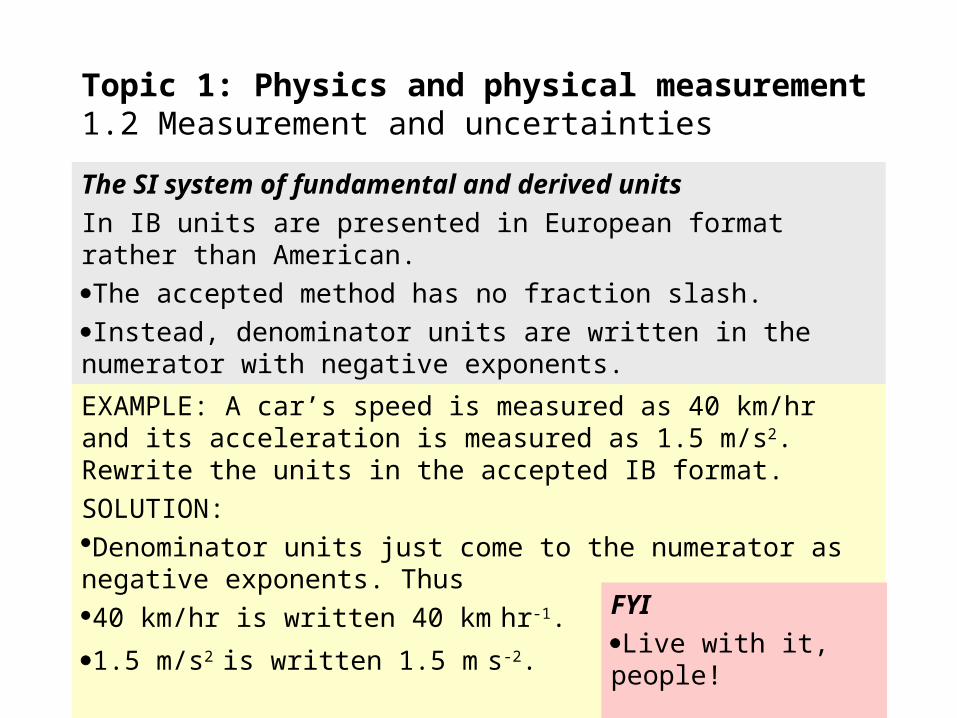
In IB units are presented in European format rather than American.
The accepted method has no fraction slash.Instead, denominator units are written in the numerator with negative exponents.
Topic 1: Physics and physical measurement1.2 Measurement and uncertainties
EXAMPLE: A car’s speed is measured as 40 km/hr and its acceleration is measured as 1.5 m/s2. Rewrite the units in the accepted IB format.
SOLUTION:Denominator units just come to the numerator as negative exponents. Thus40 km/hr is written 40 km hr-1.
1.5 m/s2 is written 1.5 m s-2.
FYI
Live with it, people!
The SI system of fundamental and derived units
You can use units to prove that equations cannot be valid.
Topic 1: Physics and physical measurement1.2 Measurement and uncertainties
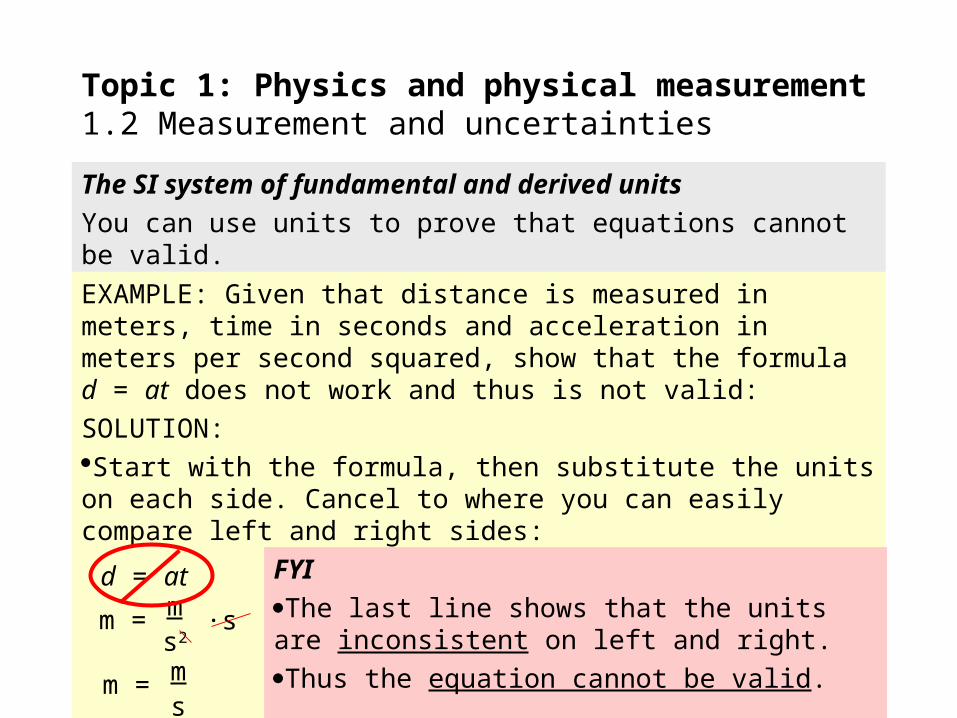
EXAMPLE: Given that distance is measured in meters, time in seconds and acceleration in meters per second squared, show that the formula d = at does not work and thus is not valid:
SOLUTION:Start with the formula, then substitute the units on each side. Cancel to where you can easily compare left and right sides:
d = at
m = ms2
·s
m = ms
FYI
The last line shows that the units are inconsistent on left and right.
Thus the equation cannot be valid.
The SI system of fundamental and derived units
You can use units to prove that equations cannot be valid.
Topic 1: Physics and physical measurement1.2 Measurement and uncertainties
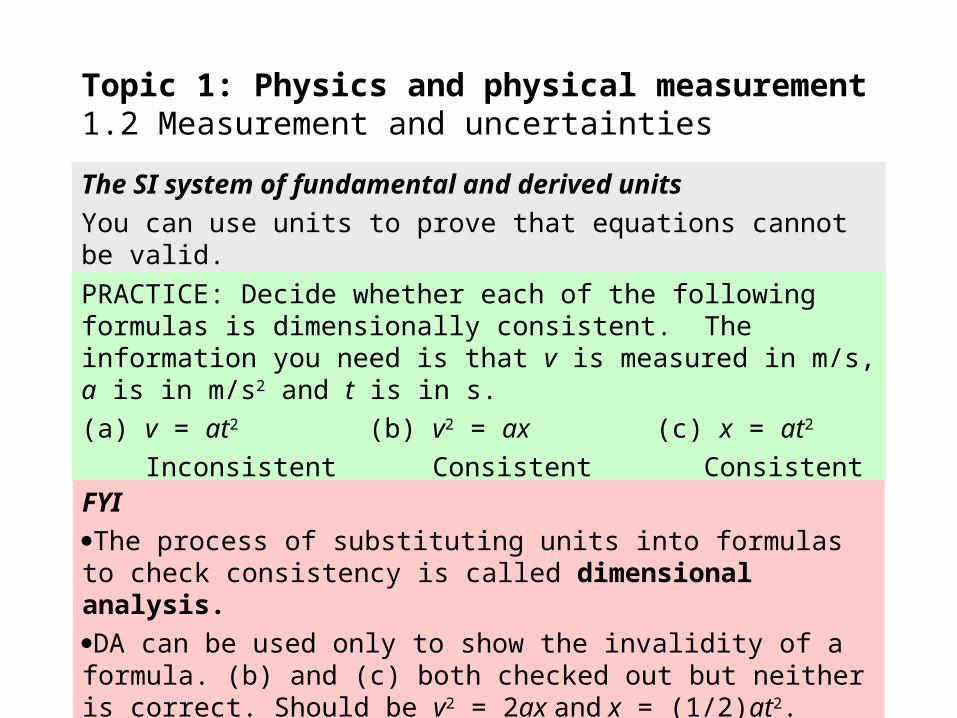
PRACTICE: Decide whether each of the following formulas is dimensionally consistent. The information you need is that v is measured in m/s, a is in m/s2 and t is in s.
(a) v = at2 (b) v2 = ax (c) x = at2
Inconsistent Consistent ConsistentFYI
The process of substituting units into formulas to check consistency is called dimensional analysis.
DA can be used only to show the invalidity of a formula. (b) and (c) both checked out but neither is correct. Should be v2 = 2ax and x = (1/2)at2.
Uncertainty and error in measurement
1.2.6 Describe and give examples of random and systematic errors.
1.2.7 Distinguish between precision and accuracy.
1.2.8 Explain how the effects of random errors may be reduced.
1.2.9 Calculate quantities and results of calculations to the appropriate number of significant figures.
Topic 1: Physics and physical measurement1.2 Measurement and uncertainties
Uncertainty and error in measurement
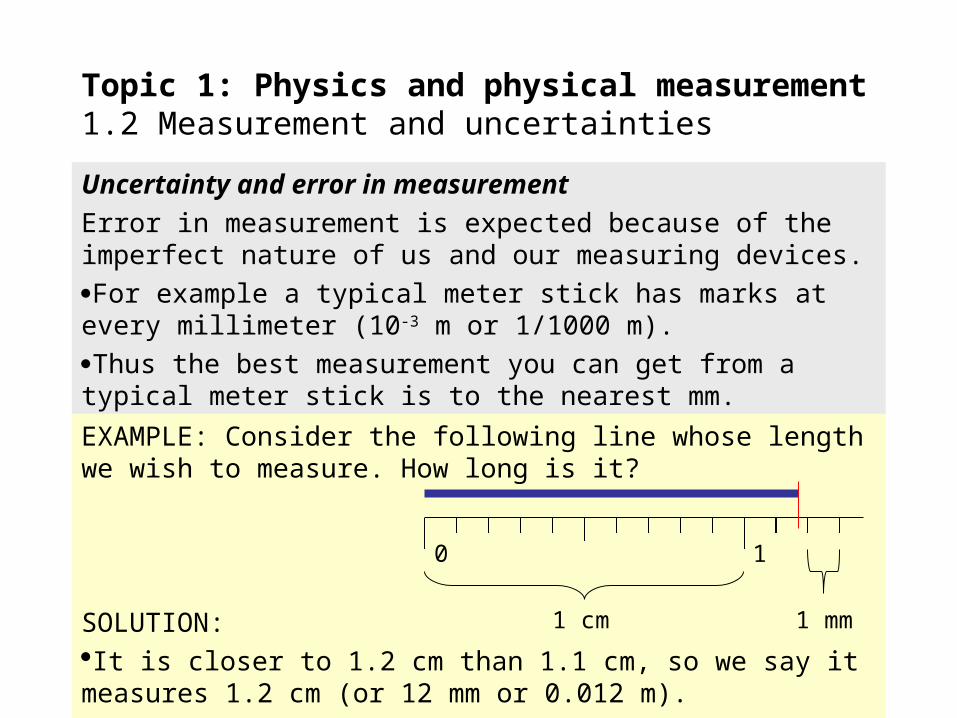
Error in measurement is expected because of the imperfect nature of us and our measuring devices.
For example a typical meter stick has marks at every millimeter (10-3 m or 1/1000 m).
Thus the best measurement you can get from a typical meter stick is to the nearest mm.
Topic 1: Physics and physical measurement1.2 Measurement and uncertainties
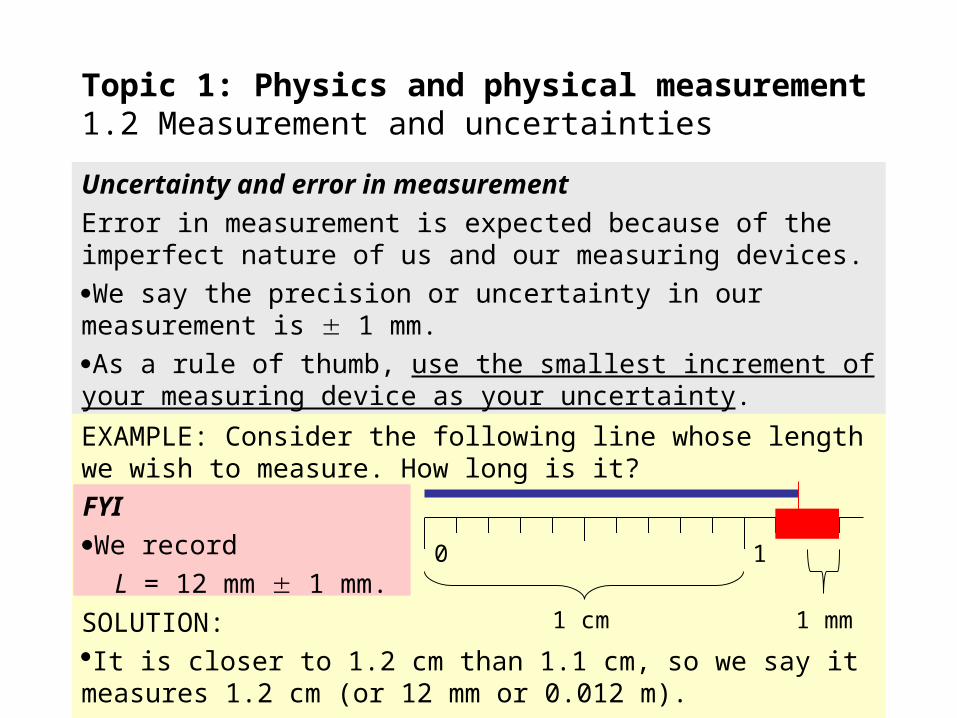
EXAMPLE: Consider the following line whose length we wish to measure. How long is it?
SOLUTION:It is closer to 1.2 cm than 1.1 cm, so we say it measures 1.2 cm (or 12 mm or 0.012 m).
0 1
1 cm 1 mm
Uncertainty and error in measurement
Error in measurement is expected because of the imperfect nature of us and our measuring devices.
We say the precision or uncertainty in our measurement is 1 mm.As a rule of thumb, use the smallest increment of your measuring device as your uncertainty.
Topic 1: Physics and physical measurement1.2 Measurement and uncertainties
EXAMPLE: Consider the following line whose length we wish to measure. How long is it?
SOLUTION:It is closer to 1.2 cm than 1.1 cm, so we say it measures 1.2 cm (or 12 mm or 0.012 m).
0 1
1 cm 1 mm
FYI
We record L = 12 mm 1 mm.
Uncertainty and error in measurement
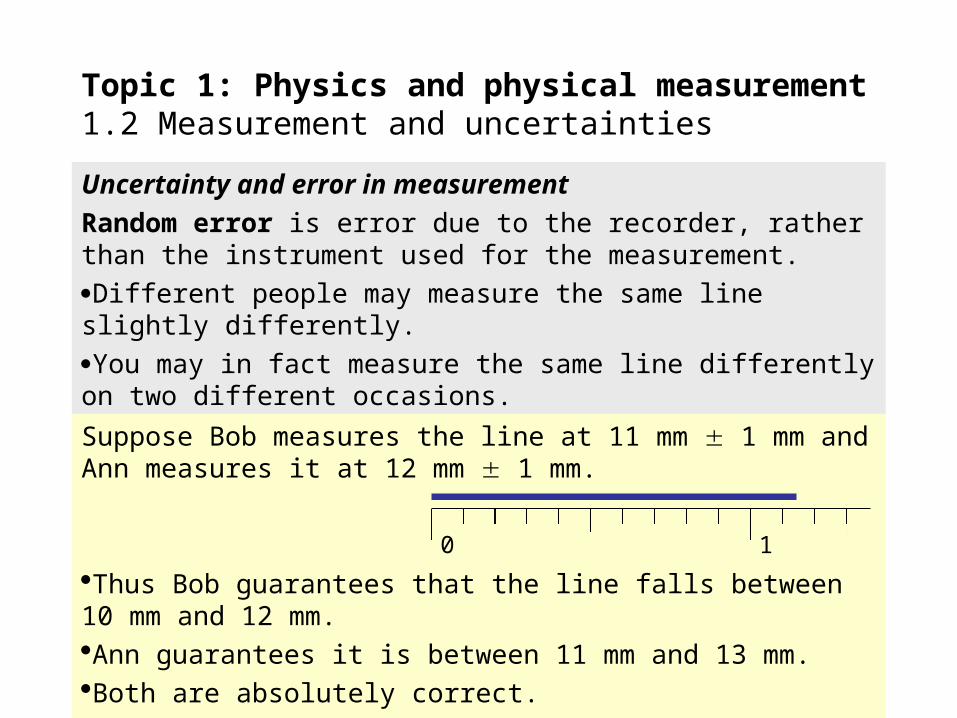
Random error is error due to the recorder, rather than the instrument used for the measurement.
Different people may measure the same line slightly differently.
You may in fact measure the same line differently on two different occasions.
Topic 1: Physics and physical measurement1.2 Measurement and uncertainties
Suppose Bob measures the line at 11 mm 1 mm and Ann measures it at 12 mm 1 mm.
Thus Bob guarantees that the line falls between 10 mm and 12 mm.Ann guarantees it is between 11 mm and 13 mm.Both are absolutely correct.
0 1
Uncertainty and error in measurement
Random error is error due to the recorder, rather than the instrument used for the measurement.
Different people may measure the same line slightly differently.
You may in fact measure the same line differently on two different occasions.
Perhaps the ruler wasn’t perfectly lined up.Perhaps your eye was viewing at an angle rather than head-on. This is called a parallax error.
Topic 1: Physics and physical measurement1.2 Measurement and uncertainties
FYI
The only way to minimize random error is to take many readings of the same measurement and to average them all together.
Uncertainty and error in measurement
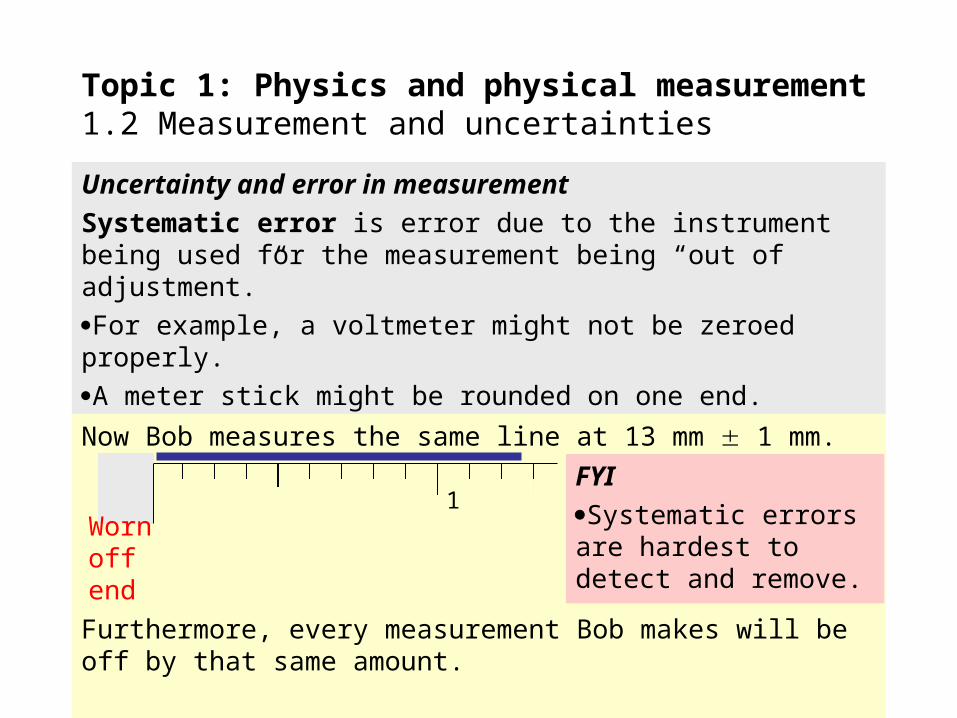
Systematic error is error due to the instrument being used for the measurement being “out of adjustment.”
For example, a voltmeter might not be zeroed properly.
A meter stick might be rounded on one end.
Topic 1: Physics and physical measurement1.2 Measurement and uncertainties
Now Bob measures the same line at 13 mm 1 mm.
Furthermore, every measurement Bob makes will be off by that same amount.
0 1Worn off end
FYI
Systematic errors are hardest to detect and remove.
Uncertainty and error in measurement
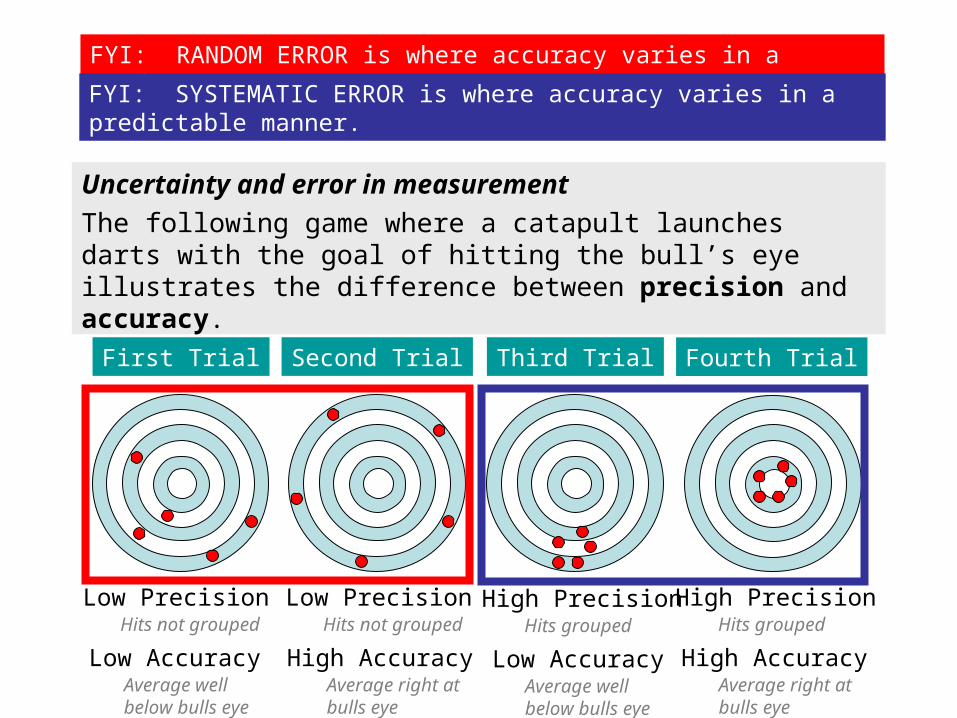
The following game where a catapult launches darts with the goal of hitting the bull’s eye illustrates the difference between precision and accuracy.
Topic 1: Physics and physical measurement1.2 Measurement and uncertainties
First Trial Second Trial Third Trial Fourth Trial
Low PrecisionHits not grouped
Low AccuracyAverage well below bulls eye
Low PrecisionHits not grouped
High AccuracyAverage right at bulls eye
High PrecisionHits grouped
Low AccuracyAverage well below bulls eye
High PrecisionHits grouped
High AccuracyAverage right at bulls eye
FYI: RANDOM ERROR is where accuracy varies in a random manner.
FYI: SYSTEMATIC ERROR is where accuracy varies in a predictable manner.
Uncertainty and error in measurement
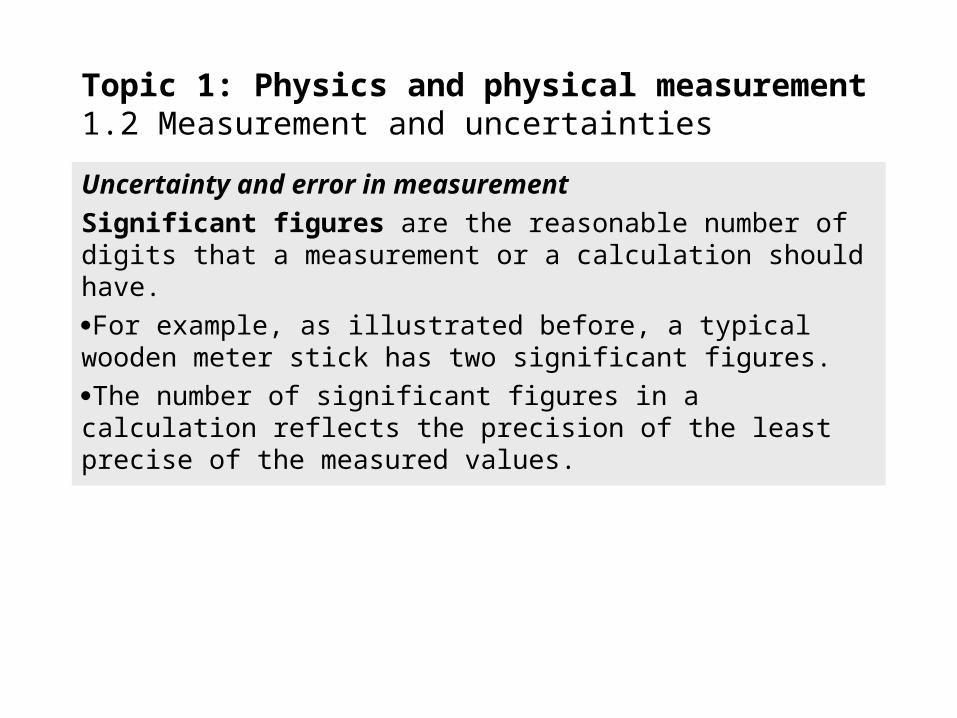
Significant figures are the reasonable number of digits that a measurement or a calculation should have.
For example, as illustrated before, a typical wooden meter stick has two significant figures.
The number of significant figures in a calculation reflects the precision of the least precise of the measured values.
Topic 1: Physics and physical measurement1.2 Measurement and uncertainties
Uncertainty and error in measurement
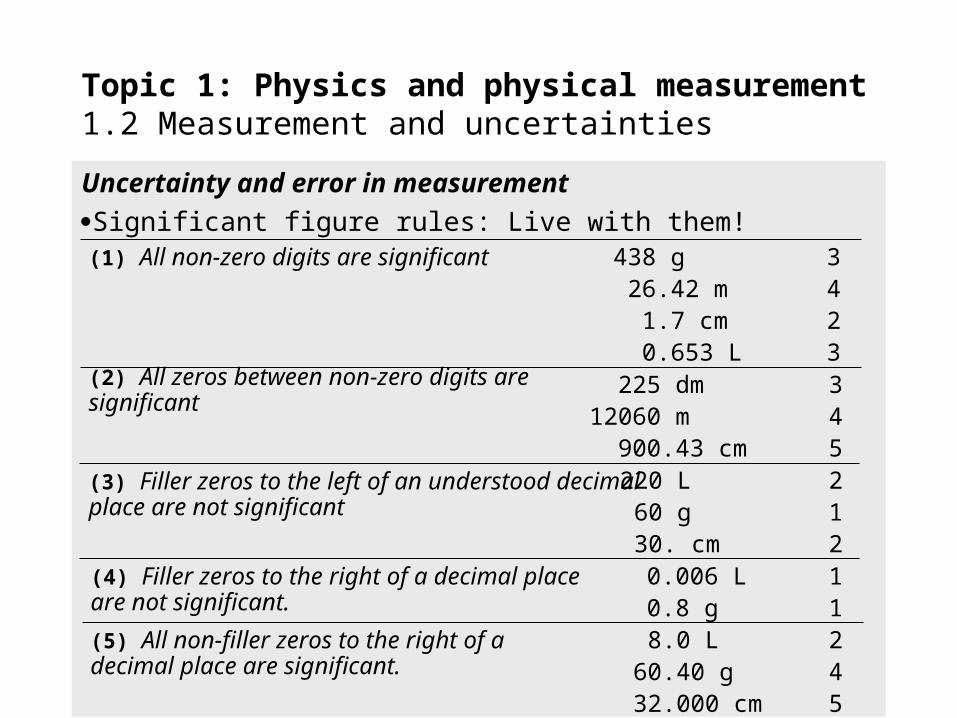
Significant figure rules: Live with them!
Topic 1: Physics and physical measurement1.2 Measurement and uncertainties
(1) All non-zero digits are significant
(2) All zeros between non-zero digits are significant
(3) Filler zeros to the left of an understood decimal place are not significant
(4) Filler zeros to the right of a decimal place are not significant.
(5) All non-filler zeros to the right of a decimal place are significant.
438 g 26.42 m 1.7 cm 0.653 L
3423
225 dm12060 m 900.43 cm
345
220 L 60 g 30. cm
212
0.006 L 0.8 g
11
8.0 L60.40 g32.000 cm
245
Uncertainty and error in measurement
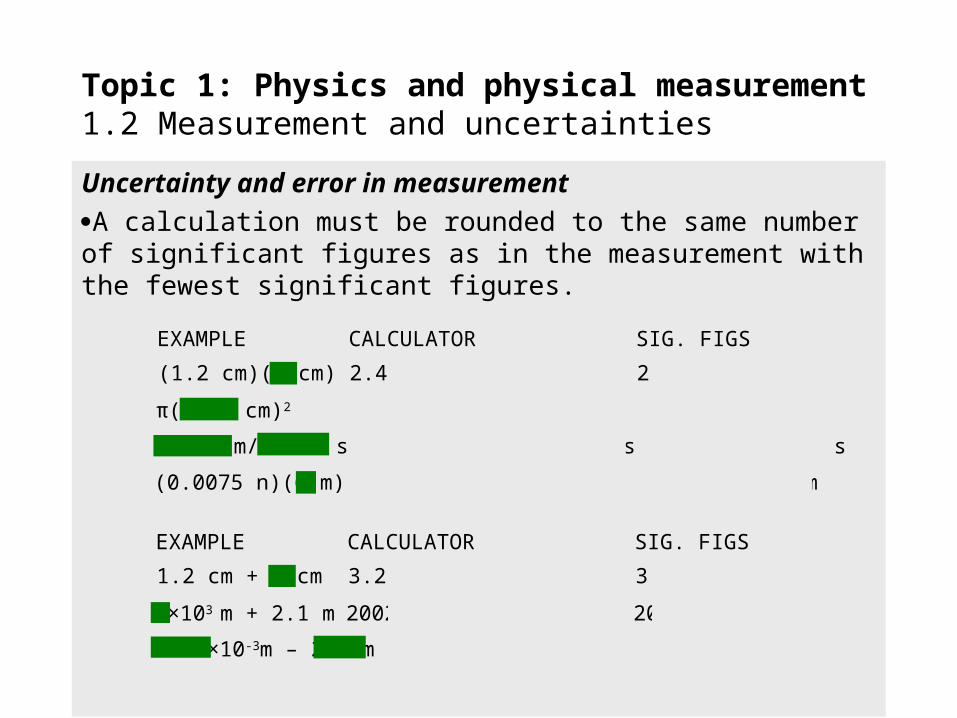
A calculation must be rounded to the same number of significant figures as in the measurement with the fewest significant figures.
Topic 1: Physics and physical measurement1.2 Measurement and uncertainties
EXAMPLE CALCULATOR SIG. FIGS
(1.2 cm)(2 cm) 2.4 cm2 2 cm2
π(2.75 cm)2 7.5625 cm2 7.56 cm2
5.350 m/2.752 s 1.944040698 m/s 1.944 m/s
(0.0075 n)(6 m) 0.045 nm 0.04 nm
5.30×10⁻³m – 2.10m -2.0947 m -2.09 m
EXAMPLE CALCULATOR SIG. FIGS
1.2 cm + 2 cm 3.2 cm 3 cm
2×10³ m + 2.1 m 2002.1 m 2000 m
Uncertainties in calculated results
1.2.10 State uncertainties as absolute, fractional and percentage uncertainties.
1.2.11 Determine the uncertainties in results.
Topic 1: Physics and physical measurement1.2 Measurement and uncertainties
Uncertainties in calculated results
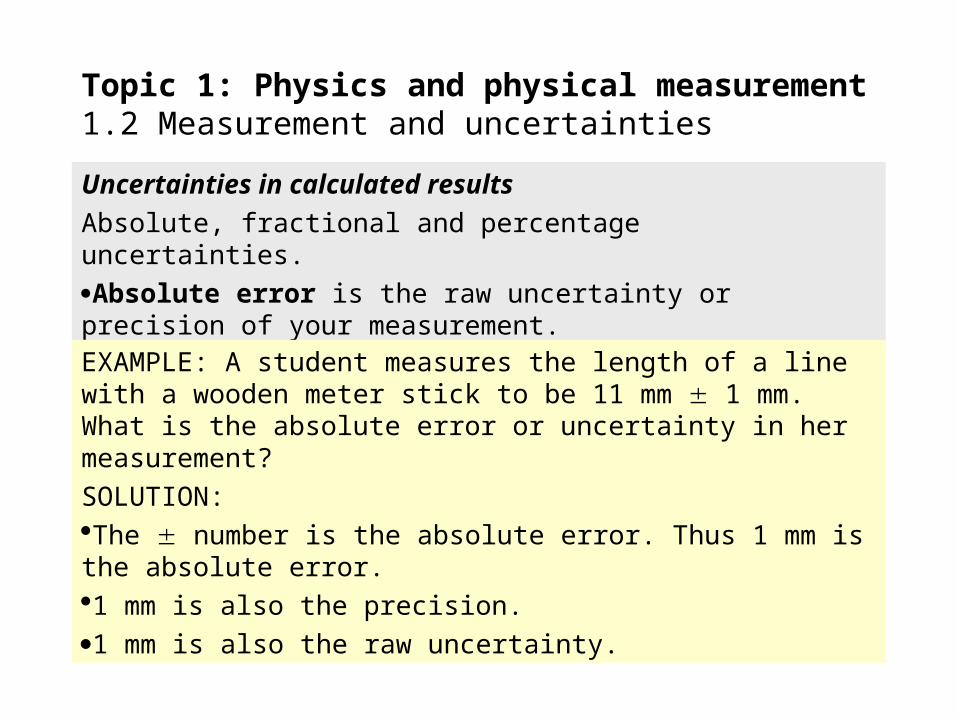
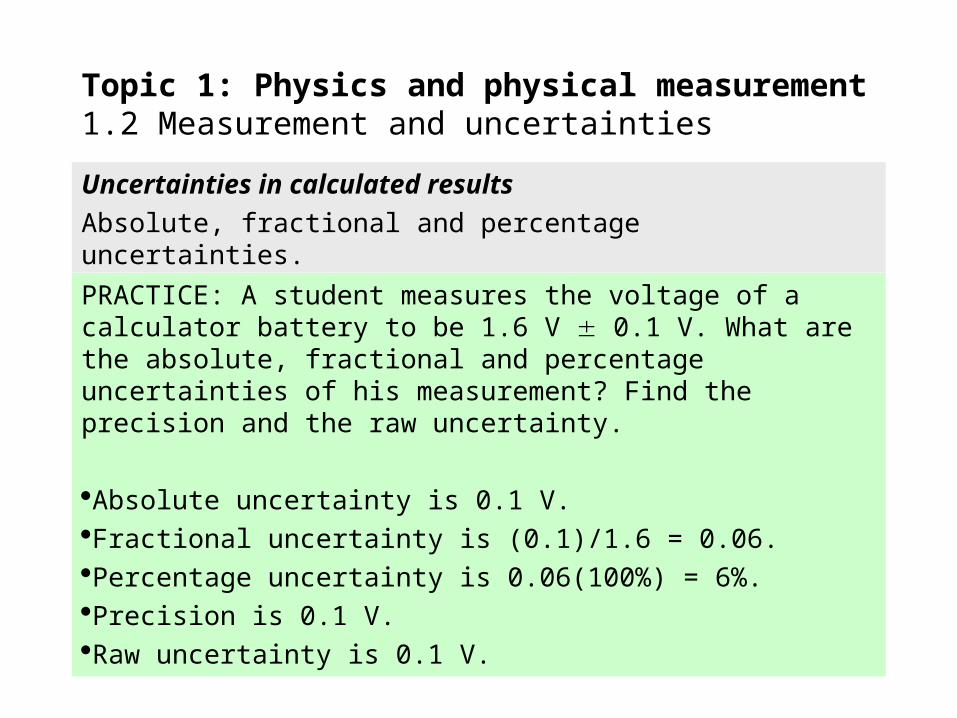
Absolute, fractional and percentage uncertainties.
Absolute error is the raw uncertainty or precision of your measurement.
Topic 1: Physics and physical measurement1.2 Measurement and uncertainties
EXAMPLE: A student measures the length of a line with a wooden meter stick to be 11 mm 1 mm. What is the absolute error or uncertainty in her measurement?
SOLUTION:The number is the absolute error. Thus 1 mm is the absolute error.1 mm is also the precision.1 mm is also the raw uncertainty.
Uncertainties in calculated results
Absolute, fractional and percentage uncertainties.
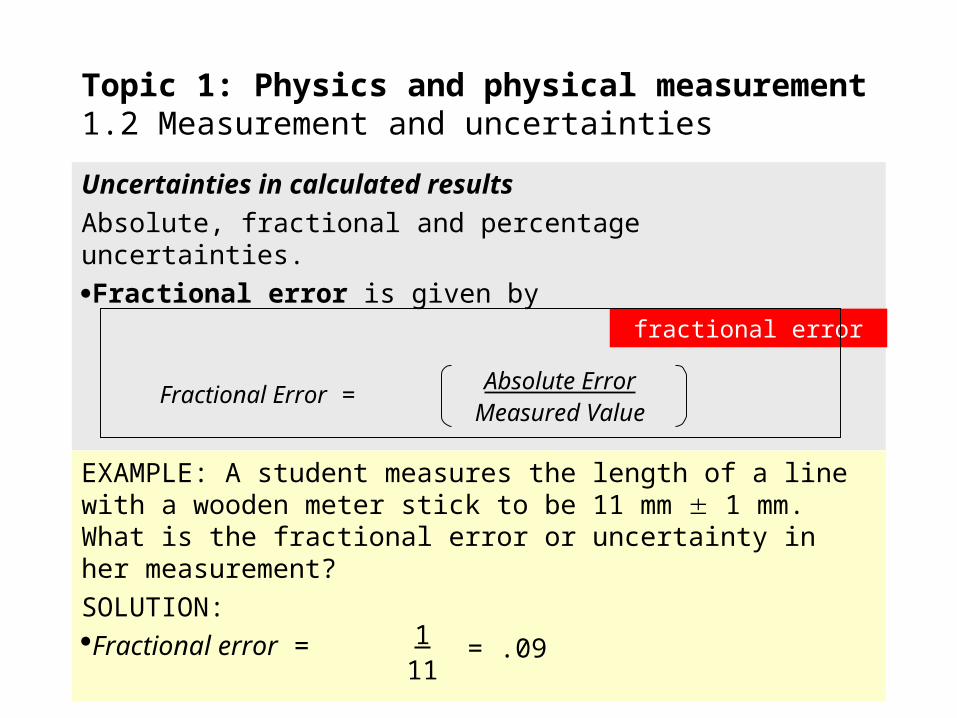
Fractional error is given by
Topic 1: Physics and physical measurement1.2 Measurement and uncertainties
EXAMPLE: A student measures the length of a line with a wooden meter stick to be 11 mm 1 mm. What is the fractional error or uncertainty in her measurement?
SOLUTION:Fractional error =
Fractional Error =Absolute ErrorMeasured Value
fractional error
111
= .09
Uncertainties in calculated results
Absolute, fractional and percentage uncertainties.
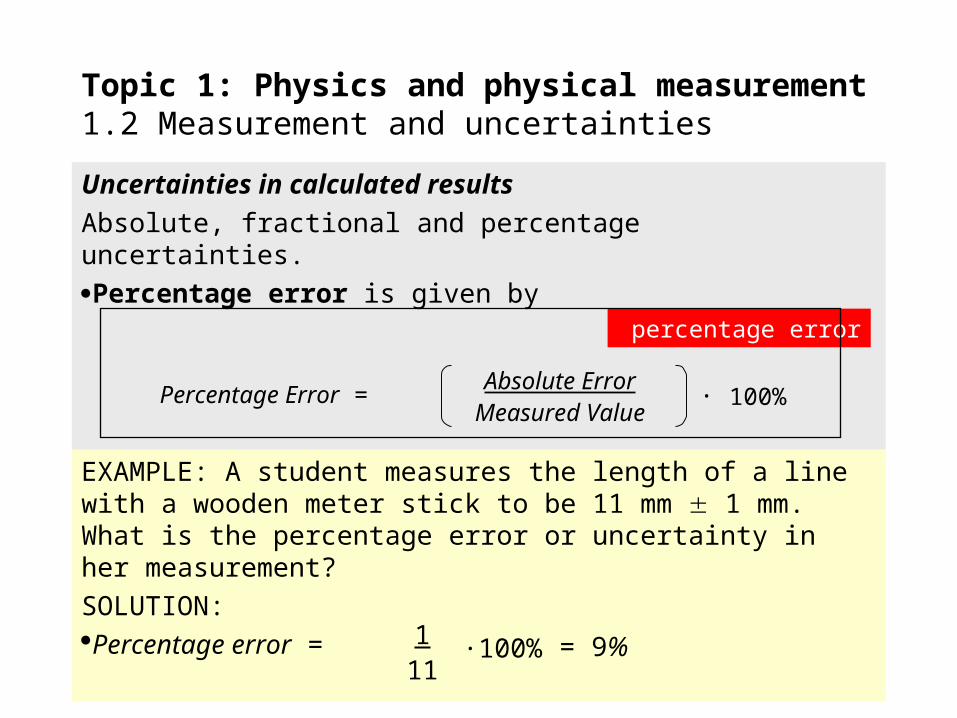
Percentage error is given by
Topic 1: Physics and physical measurement1.2 Measurement and uncertainties
EXAMPLE: A student measures the length of a line with a wooden meter stick to be 11 mm 1 mm. What is the percentage error or uncertainty in her measurement?
SOLUTION:Percentage error =
Percentage Error =Absolute ErrorMeasured Value
percentage error
111
·100%
· 100%
= 9%
Uncertainties in calculated results
Absolute, fractional and percentage uncertainties.
Topic 1: Physics and physical measurement1.2 Measurement and uncertainties
PRACTICE: A student measures the voltage of a calculator battery to be 1.6 V 0.1 V. What are the absolute, fractional and percentage uncertainties of his measurement? Find the precision and the raw uncertainty.
Absolute uncertainty is 0.1 V.Fractional uncertainty is (0.1)/1.6 = 0.06.Percentage uncertainty is 0.06(100%) = 6%.Precision is 0.1 V.Raw uncertainty is 0.1 V.
Uncertainties in calculated results
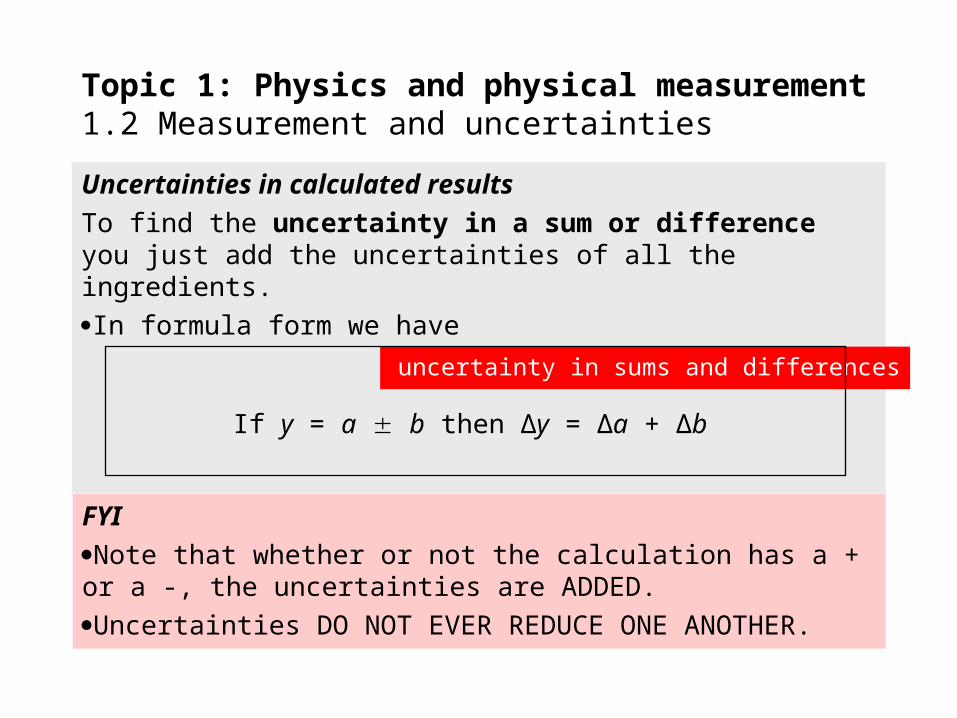
To find the uncertainty in a sum or difference you just add the uncertainties of all the ingredients.
In formula form we have
Topic 1: Physics and physical measurement1.2 Measurement and uncertainties
If y = a b then ∆y = ∆a + ∆b
uncertainty in sums and differences
FYI
Note that whether or not the calculation has a + or a -, the uncertainties are ADDED.
Uncertainties DO NOT EVER REDUCE ONE ANOTHER.
Uncertainties in calculated results
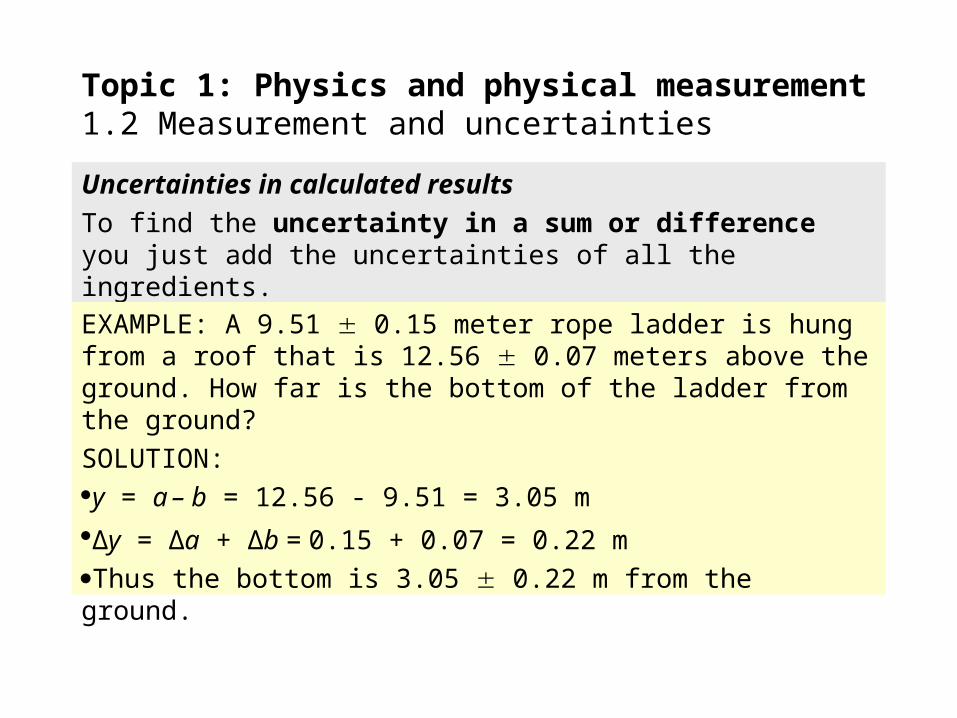
To find the uncertainty in a sum or difference you just add the uncertainties of all the ingredients.
Topic 1: Physics and physical measurement1.2 Measurement and uncertainties
EXAMPLE: A 9.51 0.15 meter rope ladder is hung from a roof that is 12.56 0.07 meters above the ground. How far is the bottom of the ladder from the ground?
SOLUTION:y = a – b = 12.56 - 9.51 = 3.05 m
∆y = ∆a + ∆b = 0.15 + 0.07 = 0.22 mThus the bottom is 3.05 0.22 m from the ground.
Uncertainties in calculated results
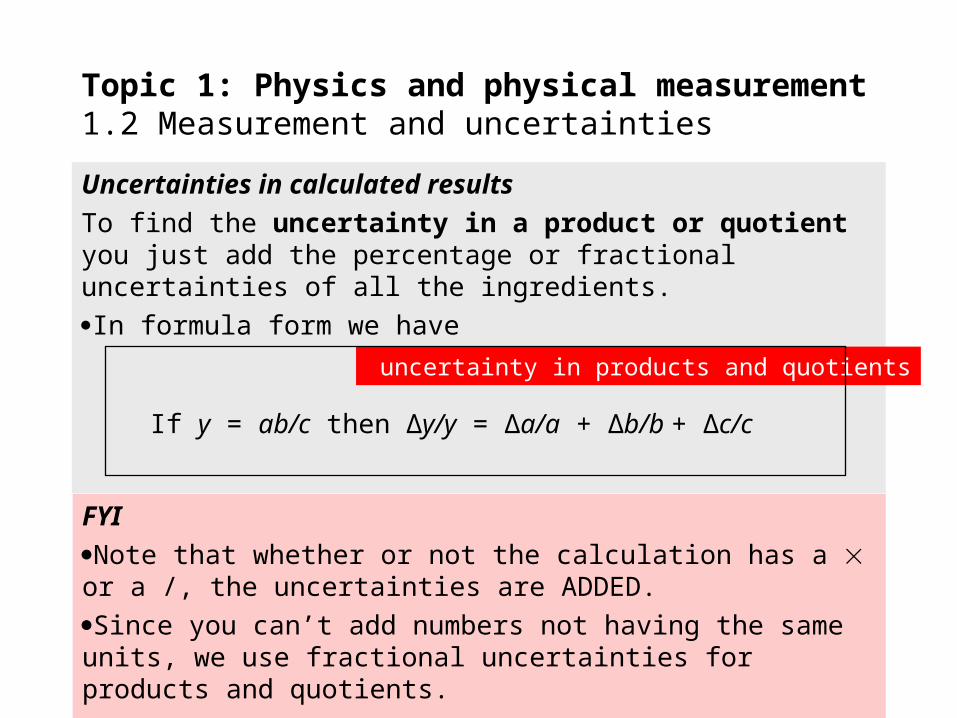
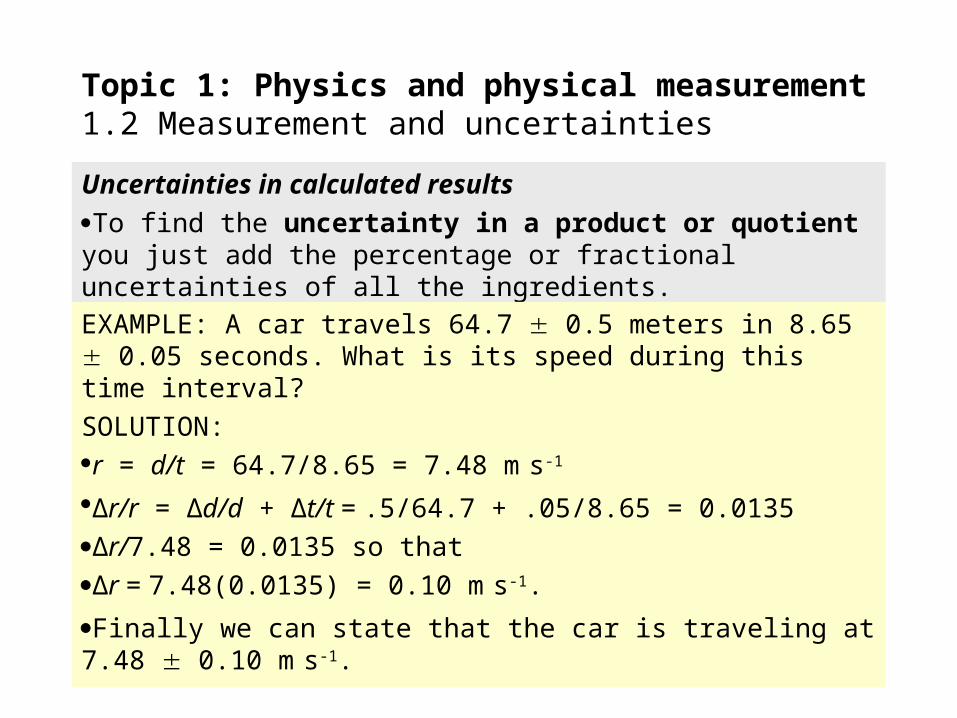
To find the uncertainty in a product or quotient you just add the percentage or fractional uncertainties of all the ingredients.
In formula form we have
Topic 1: Physics and physical measurement1.2 Measurement and uncertainties
If y = ab/c then ∆y/y = ∆a/a + ∆b/b + ∆c/c
uncertainty in products and quotients
FYI
Note that whether or not the calculation has a or a /, the uncertainties are ADDED.
Since you can’t add numbers not having the same units, we use fractional uncertainties for products and quotients.
Uncertainties in calculated results
To find the uncertainty in a product or quotient you just add the percentage or fractional uncertainties of all the ingredients.
Topic 1: Physics and physical measurement1.2 Measurement and uncertainties
EXAMPLE: A car travels 64.7 0.5 meters in 8.65 0.05 seconds. What is its speed during this time interval?
SOLUTION:r = d/t = 64.7/8.65 = 7.48 m s-1
∆r/r = ∆d/d + ∆t/t = .5/64.7 + .05/8.65 = 0.0135∆r/7.48 = 0.0135 so that ∆r = 7.48(0.0135) = 0.10 m s-1.
Finally we can state that the car is traveling at 7.48 0.10 m s-1.
Uncertainties in graphs
1.2.12 Identify uncertainties as error bars in graphs.
1.2.13 State random uncertainty as an uncertainty range (+/-) and represent it graphically as an ‘error bar.’
1.2.14 Determine the uncertainties in the gradient and intercepts of a straight-line graph.
Topic 1: Physics and physical measurement1.2 Measurement and uncertainties
Uncertainties in graphs
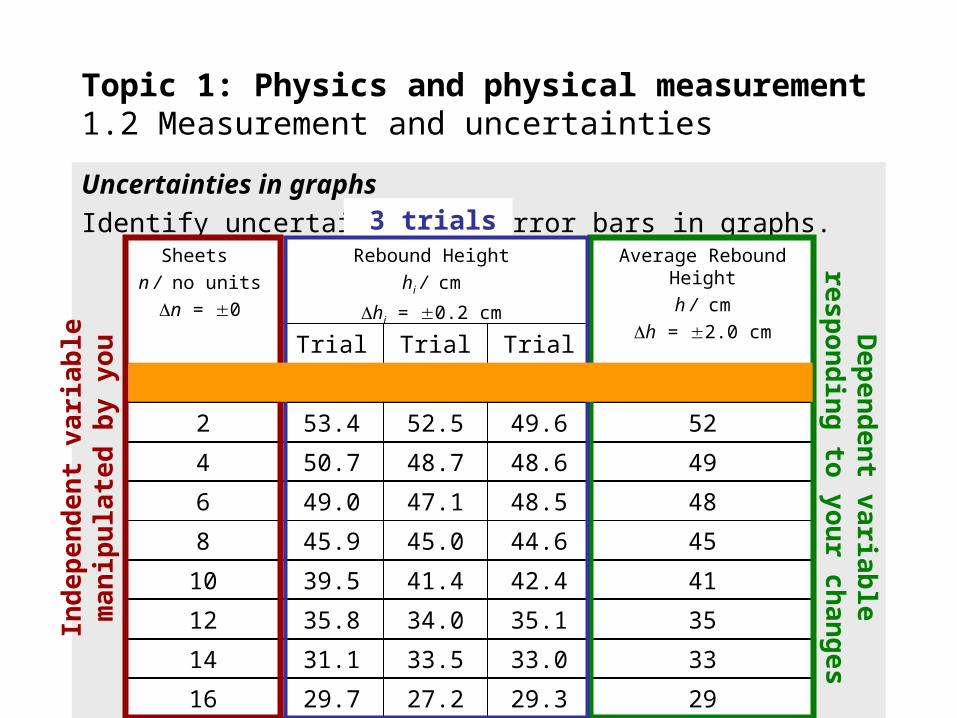
Identify uncertainties as error bars in graphs.
IB has a requirement that when you conduct an experiment of your own design, you must have three trials for each variation in your independent variable.
This means that for each independent variable you will gather three values for the dependent variable.
The three values for each dependent variable will then be averaged.
The following slide shows a sample of a well designed table containing all of the information required by IB.
Topic 1: Physics and physical measurement1.2 Measurement and uncertainties
Uncertainties in graphs
Identify uncertainties as error bars in graphs.
Topic 1: Physics and physical measurement1.2 Measurement and uncertainties
Sheets
n / no units
n = 0
Rebound Height
hi / cm
hi = 0.2 cm
Average Rebound Height
h / cm
h = 2.0 cm
0 5554.8 55.1 54.6
Trial 1 Trial 2 Trial 3
2 5253.4 52.5 49.6
4 4950.7 48.7 48.6
6 4849.0 47.1 48.5
8 4545.9 45.0 44.6
10 4139.5 41.4 42.4
12 3535.8 34.0 35.1
14 3331.1 33.5 33.0
16 2929.7 27.2 29.3
Independent variable
manipulated by you
Dependent variable
responding to your changes
3 trials
Uncertainties in graphs
Identify uncertainties as error bars in graphs.
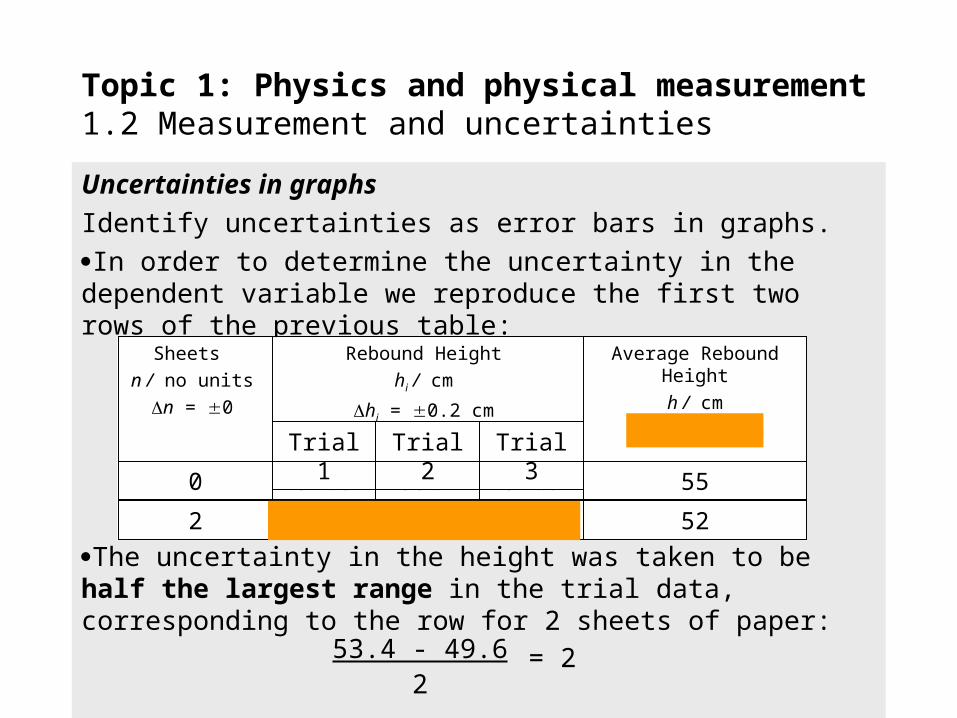
In order to determine the uncertainty in the dependent variable we reproduce the first two rows of the previous table:
The uncertainty in the height was taken to be half the largest range in the trial data, corresponding to the row for 2 sheets of paper:
Topic 1: Physics and physical measurement1.2 Measurement and uncertainties
Sheets
n / no units
n = 0
Rebound Height
hi / cm
hi = 0.2 cm
Average Rebound Height
h / cm
h = 2.0 cm
0 5554.8 55.1 54.6
Trial 1 Trial 2 Trial 3
2 5253.4 52.5 49.6
53.4 - 49.62
= 2
Uncertainties in graphs
Identify uncertainties as error bars in graphs.
The size of the error bar in the graph is then up two and down two at each point in the graph on the next slide…
Topic 1: Physics and physical measurement1.2 Measurement and uncertainties
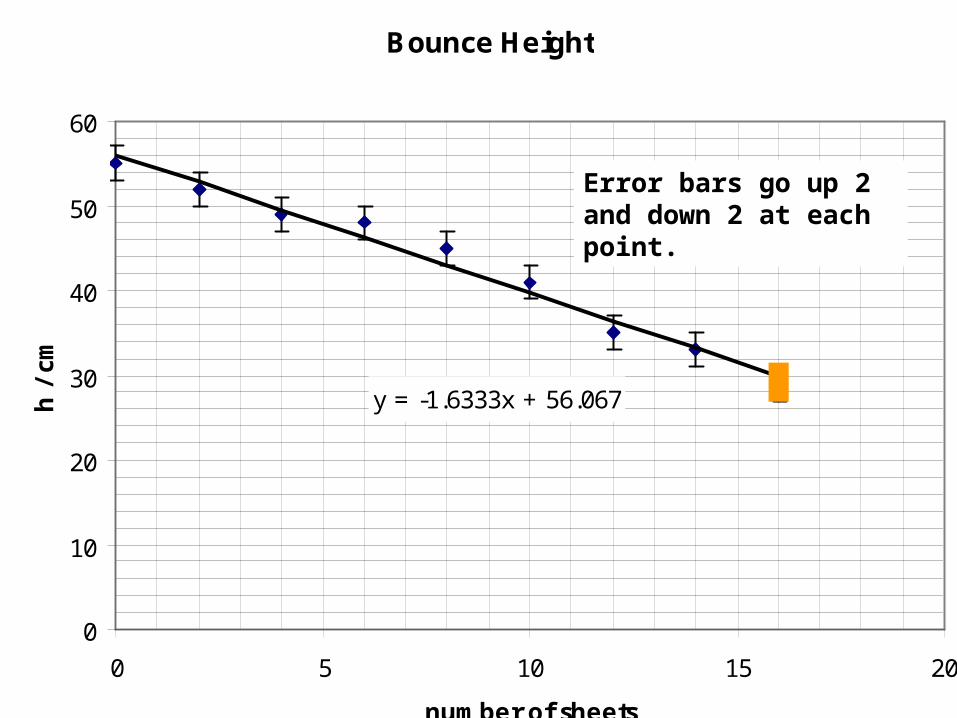
Bounce Height
y = -1.6333x + 56.067
0
10
20
30
40
50
60
0 5 10 15 20
number of sheets
h /
cm
Error bars go up 2 and down 2 at each point.
Uncertainties in graphs
Determine the uncertainties in the gradient and intercepts of a straight-line graph.
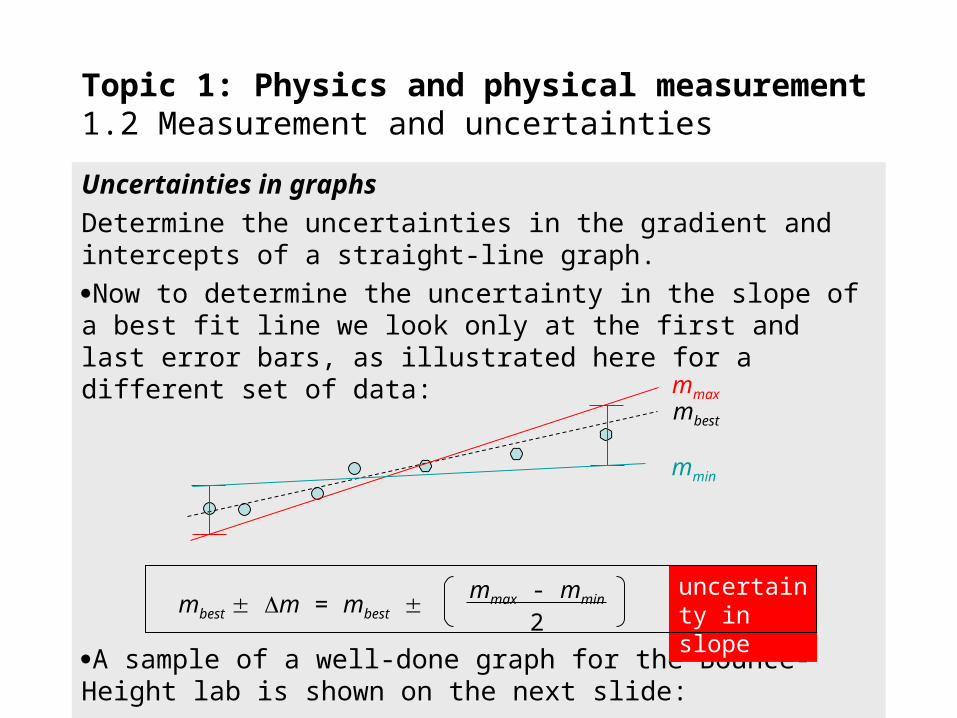
Now to determine the uncertainty in the slope of a best fit line we look only at the first and last error bars, as illustrated here for a different set of data:
A sample of a well-done graph for the Bounce-Height lab is shown on the next slide:
Topic 1: Physics and physical measurement1.2 Measurement and uncertainties
mbest
mmax
mmin
mbest m = mbest mmax - mmin
2
uncertainty in slope
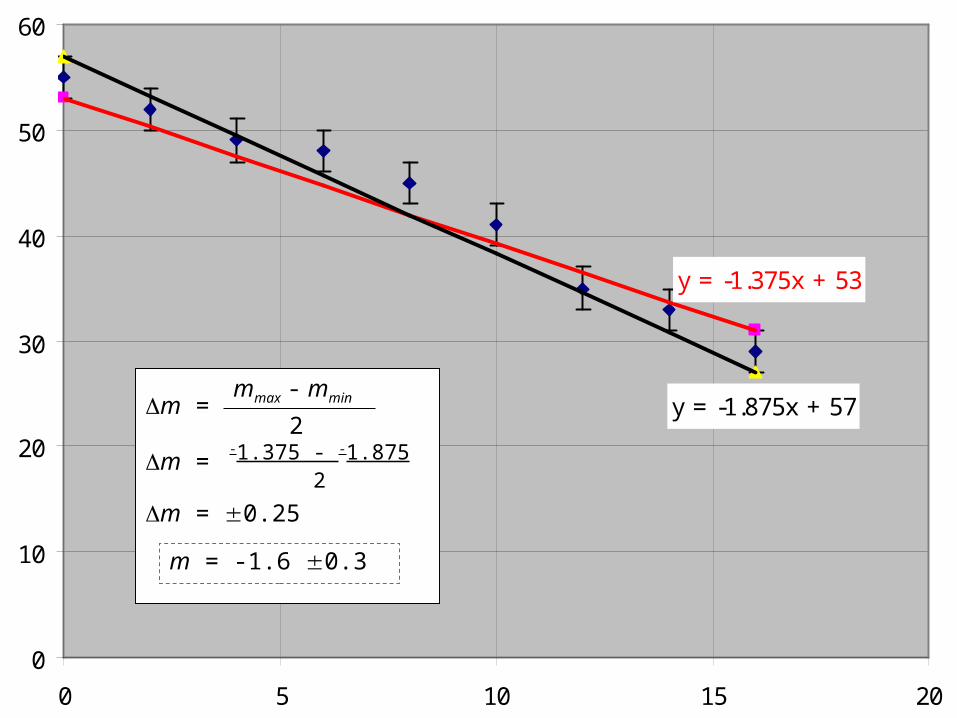
y = -1.375x + 53
y = -1.875x + 57
0
10
20
30
40
50
60
0 5 10 15 20
m = mmax - mmin
2
m = -1.375 - -1.875
2
m = 0.25
m = -1.6 0.3