shrp2 travel time reliability analytical product ... 22 report shrp2 ttr analytical prod… · shrp...
TRANSCRIPT

SHRP2 Travel Time Reliability Analytical Product Implementation
final report
February 2015


report
SHRP 2 Travel Time Reliability Analytical Product Implementation
Task 22 Final Report
prepared for
Florida Department of Transportation
prepared by
Cambridge Systematics, Inc.
with
Kittelson & Associates, Inc.
date
February 2015


SHRP 2 Travel Time Reliability Analytical Product Implementation
i
Table of Contents Executive Summary ...................................................................................................ES-1
SHRP 2 L05 ................................................................................................ES- 2 SHRP 2 C11 ................................................................................................ ES-2 SHRP 2 L07 ................................................................................................ ES-3 SHRP2 L02 ................................................................................................. ES-3
1.0 Introduction ......................................................................................................... 1-1
2.0 Incorporating Travel Time Reliability into Planning and Programming – SHRP2 Project L05 ................................................................. 2-1 2.1 Summary of SHRP Guidance .................................................................... 2-1
2.2 Applicability of the Guidance to FDOT................................................... 2-1
2.3 Analysis Description and Results ............................................................. 2-2
2.4 Summary and Recommendations for Next Steps .................................. 2-7
3.0 Development of Improved Economic Impact Analysis Tools - SHRP2 Project C11 .............................................................................................. 3-1 3.1 Summary of SHRP2 Guidance .................................................................. 3-1
3.2 Applicability of The Guidance to FDOT ................................................. 3-2
3.3 Analysis Description and Results ............................................................. 3-2
Results .......................................................................................................... 3-3
3.4 Summary and Recommendations For Next Steps ................................. 3-5
4.0 Identification and Evaluation of the Cost-Effectiveness of Highway Design Features to Reduce Nonrecurrent Congestion – SHRP2 Project L07 ............................................................................................................ 4-1 4.1 Summary of SHRP Guidance .................................................................... 4-1
4.2 Applicability Of Guidance To FDOT ....................................................... 4-4
4.3 Analysis Description And Results ............................................................ 4-5
Task 1 –Select Test Sites ............................................................................. 4-5
Task 2 –Stakeholders Working Group Kick-off Meeting ...................... 4-5
Task 3 –SHRP2 L07 Products Field Evaluation Plan ............................. 4-6
Task 4 –Field Testing of SHRP2 L07 Products ........................................ 4-6
Task 5 – District Design Engineer Review .............................................. 4-6
4.4 Summary and Recommendations for Next Steps .................................. 4-7
Next Steps .................................................................................................... 4-9

Table of Contents, continued
ii
5.0 Establishing Monitoring Programs for Travel Time Reliability – SHRP2 Project L02 .............................................................................................. 5-1 5.1 Summary of SHRP Guidance .................................................................... 5-1
5.2 Applicability of the Guidance to FDOT................................................... 5-4
5.3 Analysis Description and Results ............................................................. 5-5
Task 1 – Evaluation of Travel Time Data Sources (New) ...................... 5-7
Task 2 – Integration of Unreliability Explanatory Factors into Database(s) (New) ...................................................................................... 5-8
5.4 Summary and Recommendations for Next Steps .................................. 5-8
6.0 Incorporation of Travel Time Reliability into the Highway Capacity Manual - SHRP2 Project L08 ............................................................................. 6-1 6.1 Summary of SHRP Guidance .................................................................... 6-1
6.2 Applicability of the Guidance to FDOT................................................... 6-2
Appendix A L05 - Analysis and Results Description ........................................... A-1
Appendix B C11 - Analysis and Results Description ........................................... B-1
Appendix C L07 - Analysis and Results Description ........................................... C-1
Appendix D L02 - Analysis and Results Description ........................................... D-1
Appendix E Highway Sections With Congestion Management Improvements ............................................................................... E-1

SHRP 2 Travel Time Reliability Analytical Product Implementation
iii
List of Tables Table 3-1 Crash Reduction Costs and Benefits ..................................................... 3-4
Table 3-2 Crash Reductions Due to Safety Investments (Arterials and Collectors, Hillsborough County) .......................................................... 3-4
Table 4-1 SHRP2 L07 Reliability Design Treatments ........................................... 4-2
Table 4-2 SHRP2 L07 Reliability Treatments Recommendations ..................... 4-10
Table 4-3 SHRP2 L07 Reliability Non-Design Treatments Recommendations .................................................................................. 4-12


SHRP 2 Travel Time Reliability Analytical Product Implementation
v
List of Figures Figure 2-1 High Level Diagram of Central Office Planning and
Programming Processes .......................................................................... 2-5
Figure 4-1 L07 Decision Tree for Selecting Reliability Design Treatments ......... 4-3
Figure 4-2 L07 Decision Tree for Selecting Secondary Treatments ...................... 4-4
Figure 5-1 Information Flow in a TTRMS ................................................................ 5-2
Figure 5-2 The Seven Major Sources (Also Called Factors) Of Nonrecurrent Congestion ....................................................................... 5-3


SHRP 2 Travel Time Reliability Analytical Product Implementation
ES-1
Executive Summary Federal legislation, Moving Ahead for Progress in the 21st Century Act (MAP 21) identifies travel time reliability as an important mobility performance measure for reporting in each state. The Second Strategic Highway Research Program (SHRP 2) has developed a number of products to support estimating, measuring, and managing vehicle performance. SHRP 2 performance measurement emphasis is on estimating travel time reliability, identifying reliability deficiencies and contributing factors, identifying alternative solutions, and analyzing the impacts of these solutions. As a part of the SHRP 2 program, a number of tools have been developed to assess reliability based on a variety of approaches such as sketch planning, analytical analysis, simulation analysis, and travel time monitoring.
SHRP 2 initiated the L38 project to pilot test products from five of the program’s completed projects. The products support utilizing travel time reliability in state transportation agency’s business practices. These products specifically provide data analyses, analytical techniques, and a decision making framework. This document reports on the activities performed as part of the Florida L38 project.
The objectives of this project were to evaluate, use, and begin implementing the SHRP 2 travel time reliability research bundle within Florida. The products evaluated in this project include:
L02: Establishing Monitoring Programs for Travel Time Reliability;
L05: Incorporating Reliability Performance Measures into the TransportationPlanning and Programming Process;
L07: Evaluation of Costs and Effectiveness of Highway Design Features toImprove Travel Time Reliability;
L08: Incorporation of Nonrecurrent Congestion Factors into HighwayCapacity Manual Methods; and
C11: Development of Improved Economic Analysis Tools (by evaluating theeconomic effects of travel time reliability.)
To be relevant, these reliability products should be integrated into FDOT’s business practices, including FDOT’s existing planning and programming processes. With the exception of L08, this project proposes taking the products to full implementation through permanent inclusion in FDOT processes. The recommendations made by SHRP 2 L08 were evaluated in a separate study project. Florida DOT has proposed an alternative set of travel time reliability service measures that differ from the recommended measure provided in L08. The following sections summarize the findings from the rest of L38 project suite.

ES-2
SHRP 2 L05
To begin incorporating travel time reliability into FDOT’s planning process, the project team assessed materials documenting the Department’s planning and programming processes To further integrate travel time reliability into FDOT’s planning the following actions are recommended:
1. Include travel time reliability in key policy statements including the FloridaTransportation Plan, SIS Strategic Plan, and ITS Strategic Plan and Program
2. Establish reliability outreach and education programs through periodicpresentations to FDOT at all levels and other local/regional stakeholders.
3. Develop tools to assess and compare the positive impact of addressingsystem needs through operational vs. capacity improvements.
4. Continue to work with the newly formed Arterial Management office withinTraffic Operations in Central Office to identify funding mechanisms andimprove the process of planning for and funding arterial operations projects.
5. Pursue a policy change regarding the use of SIS funds for non-capacityprojects and continue to find ways to incorporate operational improvementsinto broader capacity projects.
SHRP 2 C11
The C11 Tool provides a simple method for predicting travel time reliability from data that are already available. It functions at a sketch planning level and is suited for systemwide analyses such as the network analysis performed in Long Range Transportation Plans (LRTPs). Hillsborough MPO was selected for this C11 implementation because they were in the process of updating their LRTP. The Post Processor results were used directly in the Hillsborough LRTP Update. For FDOT’s purposes, this experience should be directly transferrable to other MPOs in the state. The project demonstrated that the C11 methods could be successfully applied and practical results obtained. FDOT could also use the methods for statewide planning analysis in conjunction with the Strategic Intermodal Tool (SIT) tool, for example.
Rather than using the standalone spreadsheet developed by Project C11, the methodology deployed in Hillsborough implemented a post-processor to the MPO’s travel demand model. In addition, procedures in the Highway Safety Manual for predicting crashes were added to the C11 Post-Processor. Application of the Post-Processor for the 2040 update to the Hillsborough County transportation plan produced project lists and associated costs for making improvements, as well as the reliability and safety impacts of those improvements. The operations and safety projects identified by the C11 Post-Processor were included in Hillsborough’s LRTP.

SHRP 2 Travel Time Reliability Analytical Product Implementation
ES-3
SHRP 2 L07
There are very few design ideas in the L07 Guide that are not already practiced somewhere in Florida. In addition to the direction provided in the L07 Design Guide, the L07 project developed a spreadsheet for estimating the costs and benefits of various reliability design treatments. Costs included in the L07 tool for the reliability design treatment are simplistic and should not be applied in Florida. The L07 cost/benefit spreadsheet is not ready for adoption by FDOT.
Design treatments included in the L07 Design Guide are intended to improve travel time reliability. The Department should evaluate a process to consider these treatments more often in the design process. The requirement for an evaluation of these treatments should be included in PD&E manual. It is recommended that the Statistics Office coordinate with the Environmental Management office to include these in the next update of the PD&E manual.
SHRP2 L02
A goal of implementing L02 is to improve the ability of FDOT Central Office, FDOT Districts, and MPO’s to monitor reliability trends statewide and within their jurisdiction. The project team believed it would not be valuable to perform head-to-head tests on Florida facilities of a brand new reliability-monitoring database developed per the L02 Guidelines against current Florida monitoring practice. Instead, the team recommended that more recent developments on reliability monitoring be used to develop a Mobility Performance Monitoring System to improve the consistency, quality, completeness, and ultimately, the usefulness of current Florida travel time reliability archival practices and databases, with the L02 Guidebook serving as a starting point for the recommendations, rather than their endpoint.
This effort identified many potential uses for a FDOT Mobility Performance Monitoring System. Such a system will increase the ability of FDOT Districts, MPOs and local agencies to identify reliability problem spots within their system and diagnose their causes in order to suggest possible treatment options. Therefore, it is recommended that the FDOT TranStat office pursue implementation of a decentralized FDOT Mobility Performance Monitoring System by developing a Concept of Operations and detailed design.


SHRP 2 Travel Time Reliability Analytical Product Implementation
1-1
1.0 Introduction The National Strategic Highway Research Program (SHRP2) aims to meet the mobility and economic needs of local communities, states, and regions throughout the country. SHRP2 research focuses on four areas:
Safety - preventing or reducing the severity of highway crashes byunderstanding driver behavior;
Asset management - addressing aging infrastructure through design andconstruction methods that cause minimal disruptions and produce lastingfacilities;
Reliability - reducing congestion through incident reduction, management,response, and mitigation; and
Roadway capacity - integrating mobility, economic, environmental, andcommunity needs in the planning and designing of new transportationcapacity.
This subject of this report is travel time reliability. Travel time reliability is the ability to reach a destination on time and can be assessed through two differing approaches. First travel time reliability can be represented by the percent of trips that succeed in accordance with a predetermined performance standard for time or speed. The second definition of travel time reliability captures the variability of travel times occurring on a facility or a trip over a period of time - frequently used performance measures of variability are median travel time index (TTI50), planning time index (TTI95), and buffer index.
The primary goal of SHRP2 Reliability research is to improve the reliability of highway travel times by minimizing the effects of nonrecurring events that cause travel times to fluctuate. The SHRP2 program developed innovative tools to increase reliability on the nation’s highway network and the products represent state-of-the-art travel time reliability analysis. The tools assist in mitigating unreliable travel times caused by: traffic incidents, work zones, demand fluctuations, special events, traffic control devices, weather, and inadequate base capacity.
Shortly after the SHRP products were released, the Florida Department of Transportation (FDOT) embarked on a study to evaluate the SHRP2 Reliability tools in terms of applicability and implement ability in Florida. FDOT has established an aggressive mobility-monitoring program with travel time reliability as a primary focus. During the past year, FDOT has undertaken several projects aimed to advance mobility monitoring and reliability forecasting activities.
.

SHRP 2 Travel Time Reliability Analytical Product Implementation
1-2
This report summarizes the approach, results, and recommendations for implementing the SHRP2 projects. For each product, the following is provided in the next sections:
Summary of SHRP Guidance;
Applicability of the guidance to FDOT;
Analysis description and results – details are provided for each in anappendix; and
Summary and recommendation for next steps.
.

SHRP 2 Travel Time Reliability Analytical Product Implementation
2-1
2.0 Incorporating Travel Time Reliability into Planning and Programming – SHRP2 Project L05
2.1 SUMMARY OF SHRP GUIDANCE Project L05 provides guidance for transportation planning agencies to help them incorporate travel time reliability performance measures and strategies into the transportation planning and programming process. This will allow operational improvements to be considered alongside more traditional types of capital improvements, and ensure that transportation funds are being used as effectively as possible.
There are two primary documents:
1. A Guide - The purpose of this guide is to help agencies wherever they are inprocess of using of reliability performance measurement to (1) understand and communicate reliability; (2) identify the tools and methods to help them track transportation system reliability; (3) begin to incorporate reliability into their existing analysis tools; and (4) identify emerging analysis tools that will better help them evaluate reliability and make program and project investment choices that address the reliability of the system.
2. Technical Reference - Provides a “how-to” guide for technical staff to selectand calculate the appropriate performance measures to support the development of key planning products, including:
Long-range transportation plans;
Transportation programs (STIPs and TIPs);
Congestion management process;
Corridor planning; and
Operations planning.
2.2 APPLICABILITY OF THE GUIDANCE TO FDOT
Guidance from the SHRP2 L05 Project is applicable to FDOT’s project prioritization and programming processes. More specifically, L05 provides
SHRP 2 Travel Time Reliability Analytical Product Implementation
2-2
direction on identifying points in the prioritization and programming process where reliability measures can be used and operational projects considered. As FDOT moves away from categorical funding silos to a process that allows all types of improvements to be matched with deficiencies, guidance from L05 becomes more advantageous. This includes guidance on 1) including reliability in policy statements, 2) performance measures, and 3) including reliability in analysis tools.
The Florida DOT can directly incorporate guidance from L05 during the update to the Florida Transportation Plan (FTP) and the SIS Strategic Plan. L05 outlines how to track goals and objectives through preferred performance measures. This language could be tailored to address reliability issues through the FTP and SIS Strategic Plan.
Incorporation of L05 is also very timely given the DOT’s emphasis on Transportation System Management and Operations (TSM&O). The vision of TSM&O in Florida is “To operate our transportation system at the highest level of cost effective performance, resulting in reduced excess delay on arterials AND freeways, real-time management and traveller information for all modes, and seamless coordination with ALL operating agencies.” Incorporation of measures to track the benefits of operations projects is a key goal identified in the TSM&O Strategic Plan. The activities described in this section will be very beneficial for linking planning and operations within FDOT.
2.3 ANALYSIS DESCRIPTION AND RESULTS
This section is a summary of research conducted to apply L05 to Florida’s planning and programming processes. The project team first thoroughly inventoried and assessed the Department’s documents describing planning and programming processes. Each document was reviewed in detail, with particular attention paid to the extent the processes outlined in the plan address reliability and incorporates performance measures. The following documents were reviewed during this task:
2060 Florida Transportation Plan
SIS Strategic Plan
Statewide Comprehensive Plan
FDOT Program and Resource Plan
Long Range Program Plan
ITS Strategic Plan
Florida’s Statewide Systems Engineering Management Plan
State Planning and Research Program Plan
Prioritizing Florida’s Highway Investments

SHRP 2 Travel Time Reliability Analytical Product Implementation
2-3
SIS Project Eligibility Matrix
FDOT ITS Performance Measures Quarterly Report
Final Report on Multimodal and Corridor Applications of Travel Time Reliability
Florida Statewide Intelligent Transportation System Architecture
After these documents were reviewed, diagrams were constructed depicting the overall project development, planning, and programming processes within FDOT. These included a high-level diagram mapping these processes from policy, to planning, to program development, and finally to project implementation and illustrating how each program area fits into the larger project development and funding process. This allowed for a high-level overview of the dynamic and complex relationships between these planning and programming areas, and broadly illuminated areas where reliability may be most efficiently incorporated.
Figure 2-1 provides a high-level depiction of the overall Central Office planning and programming processes.


SHRP 2 Travel Time Reliability Analytical Product Implementation
2-5
Figure 2-1 High Level Diagram of Central Office Planning and Programming Processes

SHRP 2 Travel Time Reliability Analytical Product Implementation
2-6
In addition to the high-level diagram, diagrams detailing important sub-processes, process flows, program-specific processes, and planning screens were constructed. These provided a better understanding of how projects are prioritized and the extent that reliability is considered at a much smaller scale, and may better illustrate the specific areas where reliability is under-utilized. The intent of the diagrams was to document where improvements may be made to the process in the form of tools, methods, policy, or procedures.
Upon completion of both the high level and small-scale diagrams, the team began work on a capability maturity matrix capturing FDOT’s progress in meeting requirements of the four steps recommended by the SHRP2 L05 project for incorporating reliability into planning and programming, as well as the specific dimensions of capability associated with each step. These are as follows:
Step 1. Developing and tracking reliability measures. Dimensions of capability include the agency’s use of reliability performance measures to reflect the reliability needs of the system.
Step 2. Addressing reliability in policy statements. Associated dimensions of capability include the degree to which reliability is incorporated into an agency’s vision/mission statements and goals and objectives; the level of planning cooperation/collaboration for reliability; and the organization structure and staffing in place to support reliability.
Step 3. Evaluating reliability needs and/or deficiencies. Dimensions include the agency’s capability to set reliability thresholds, analyze reliability needs/deficiencies, and use of forecasting to identify future deficiencies and related strategies.
Step 4. Incorporating reliability into planning and programming decisions. Dimensions of capability include the degree to which reliability is incorporated into overall agency priority setting, planning and programming decisions, as well as the ability to implement and assess the effectiveness of reliability strategies.
A summary of the capability maturity assessment matrix that considered each step in incorporating reliability measures into the planning and programming processes and evaluated FDOT’s status on each of these steps was prepared.
A table was also created to show a detailed assessment of how FDOT is performing in regards to specific dimensions of capability associated with each step, and includes an assessment of the Department’s stage of maturity, its strengths and weaknesses in support of the dimension, and recommendations on how FDOT may advance to the next level of maturity.

SHRP 2 Travel Time Reliability Analytical Product Implementation
2-7
2.4 SUMMARY AND RECOMMENDATIONS FOR NEXT STEPS
There are a number of actions that FDOT could consider to fully integrate reliability into planning and programming. Appendix A illustrates where specific actions related to collaboration and tool development could occur to incorporate reliability into the overall Central Office policy, planning, program development, and implementation processes. The recommendations provided are items that warrant potential consideration, and these will continue to be refined as the team develops a specific approach on how to best incorporate reliability into FDOT planning and programming.
Based on these recommendations and the inventory of the Department’s current planning and programming workflow, the following high priority actions may best accomplish this integration:
Specifically address how FDOT will monitor reliability in key policy statements. While reliability is emphasized in key documents such as the Florida Transportation Plan, neither specific performance measures nor how reliability will be used to assess system performance are addressed. Policy statements are crucial in that they define a strategic direction and communicate transportation priorities. Ensuring that reliability is addressed in these statements is a critical step towards incorporating reliability into planning and programming processes. The pending updates to the FTP and SIS Strategic Plan present an excellent opportunity to address this action, and reliability champions should be collaborating closely with appropriate staff as the plans develop. The ITS Strategic Plan and Program and Resource Plan are additional opportunities.
Establish reliability outreach and education programs through periodic presentations to FDOT at all levels and other local/regional stakeholders. Having an outreach program not only communicates and better educates and promotes a broader understanding of reliability among staff, it also provides an opportunity to engage with stakeholders and facilitate inter-agency collaboration on data collection and analysis. This action could facilitate the integration of reliability in planning products such as modal plans (e.g., Spaceport Master Plan, Seaport Master Plan, etc.) and MPO Long Range Transportation Plans. Note that this is already underway as part of the Multimodal Mobility Performance Measures program.
Develop tools to assess and compare the positive impact of addressing system needs through operational vs. capacity improvements. A tool that provides the mechanism needed for trade-off analysis would allow users to assess system needs and understand the benefits that are rendered by addressing deficiencies through operational improvements. The SIT plays a vital role in the project prioritization and selection process, but presently can only evaluate projects listed on existing roadways and is not closely linked to

SHRP 2 Travel Time Reliability Analytical Product Implementation
2-8
reliability measures. Better incorporating reliability performance measures in the SIT could strongly affect the project prioritization process and help favor projects featuring operational improvements for inclusion in the Cost Feasible Plan and Work Program. A working group comprised of Planning and Operations staff from Central Office could be formed and tasked with reaching out to District staff and MPOs to ensure they have the tools and expertise necessary to evaluate, prioritize, and select operations projects for inclusion in MPO Transportation Improvement Programs (TIPs), project priority lists, and District/Turnpike Work Programs.
Continue to work with the newly formed Arterial Management office within Traffic Operations in Central Office to identify funding mechanisms and improve the process of planning for and funding arterial operations projects.
Pursue a policy change regarding the use of SIS funds for non-capacity projects and continue to find ways to incorporate operational improvements into broader capacity projects. Statutory obligations currently limit the extent to which operational improvements can be considered in the planning and programming process. SIS funds, which represent 75% of all project funds, are currently defined by statute to be limited to capacity projects. While there are ways of building operational improvements into capacity projects, many of which are being increasingly utilized by the Department, a high-level policy change away from this requirement would be the most effective way to incorporate reliability into all planning and programming processes. The FDOT Program and Resource Plan is the best place to make a change in how operations improvements are funded, as well as legislative budget requests. A reliability champion should be tasked with bringing the issue before Executive Management to make the change.

SHRP 2 Travel Time Reliability Analytical Product Implementation
3-1
3.0 Development of Improved Economic Impact Analysis Tools - SHRP2 Project C11
3.1 SUMMARY OF SHRP2 GUIDANCE SHRP2 Project C11, Development of Improved Economic Impact Analysis Tools,1 focused on assessing the economic benefits of transportation investments beyond the traditional ones of travel time, safety, and vehicle operating costs. One of the impact areas identified was travel time reliability, and an economic analysis tool called the “Reliability Module” was developed to calculate reliability benefits. It is a sketch-planning corridor spreadsheet tool that estimates the benefits of improving travel time reliability for use in benefit/cost analysis. The purpose of the Reliability Module is to allow users to quickly assess the effects of alternative highway investments in terms of both typical travel time and travel time reliability. The procedure is based on making estimates of recurring and nonrecurring congestion, combining them, and using predictive equations to develop reliability metrics.
The tool’s equations are based on a combination of past research efforts, including NCHRP, FHWA, and SHRP2 Project L03. The C11 Module can be used as a standalone tool for doing sketch planning level analysis. However, a more useful application is to integrate it with a travel demand-forecasting model as a post-processor. Currently, the only tool that exists for estimating regional reliability impacts is the ITS Deployment Analysis System (IDAS) and the FITSEval tool, but they are geared only to analyzing ITS and operations strategies. The post-processor envisioned here is much simpler in scale and application. It allows planning agencies to assess the regional impact of long-range transportation plans (LRTPs) on reliability, in the same way that they currently assess regional VMT and delay. It also permits reliability to enter into the development and comparison of alternative improvements strategies, including operations, earlier in the LRTP development process. Finally, the technical relationships in the C11 model are also at the right scale to be incorporated into system planning tools.
1 http://apps.trb.org/cmsfeed/TRBNetProjectDisplay.asp?ProjectID=2350

SHRP 2 Travel Time Reliability Analytical Product Implementation
3-2
3.2 APPLICABILITY OF THE GUIDANCE TO FDOT The C11 Tool is relevant to FDOT because it provides a simple method for predicting travel time reliability from data that are already available. It also provides a means for valuing reliability for travelers, and thus can be used in economic analysis of alternatives. Because the C11 Tool operates at the sketch planning level with a minimum of data, it is ideally suited for systemwide analyses such as the network analysis performed in updating LRTPs.
The Hillsborough MPO was selected for this project because they were in the process of updating their LRTP. Therefore, the timing of the work was perfect, and prevented the effort from being a hypothetical exercise; the results were used directly in the Hillsborough LRTP Update. For FDOT’s purposes, this experience should be directly transferrable to other MPOs in the state. The project demonstrated that the C11 methods could be successfully applied and practical results obtained. FDOT could also use the methods for statewide planning analysis in conjunction with the Strategic Intermodal Tool (SIT) tool, for example.
The Hillsborough MPO was selected for this project because they were in the process of updating their LRTP. Therefore, the timing of the work was perfect, and prevented the effort from being a hypothetical exercise; the results were used directly in the Hillsborough LRTP Update. For FDOT’s purposes, this experience should be directly transferrable to other MPOs in the state. The project demonstrated that the C11 methods could be successfully applied and practical results obtained. FDOT could also use the methods for statewide planning analysis in conjunction with the Strategic Intermodal Tool (SIT) tool, for example.
3.3 ANALYSIS DESCRIPTION AND RESULTS A Post-Processor based on the C11 procedure was constructed. The Post-Processor used output from the Tampa Bay Regional Planning Model (TBRPM) to predict reliability impacts of transportation improvements. In addition, because the MPO wanted to include safety in their analyses, the C11 Post-Processor was extended to estimate the safety impacts of transportation improvements as well.
The C11 Post-Processor was developed to use the forecasted “loaded” network as the base for estimating safety and reliability impacts. The loaded network file was first merged with existing crash data at the link level. This was possible because the Hillsborough MPO had previous matched their model links to the linear referencing used in the crash database.
The safety component adapts procedures from the Highway Safety Manual to forecast future safety conditions. It is based on producing an expected number of crashes using a statistical procedure known as the Empirical Bayes (EB)

SHRP 2 Travel Time Reliability Analytical Product Implementation
3-3
method where total crashes for a facility are a weighted combination of actual crashes and predicted crashes from a safety performance function (SPF), an equation based on the crash experiences of other sites. This method is used to control for the high variability in the number of annual crashes on short and/or low volume segments. Once the base number of crashes is established for 2040, the Post-Processor uses the following steps to identify safety-deficient highway sections for a given investment level.
The reliability post-processor uses relationships from SHRP 2 Project C11 to forecast travel time reliability. The procedure uses the following steps:
Estimate recurring congestion using a volume-delay function;
Estimate incident delay using relationships from the ITS Deployment Analysis System (IDAS), then combine with recurring congestion to get average delay;
Use custom-developed relationships that predict reliability measures as a function of average delay (as described in the C11 procedure).
Several investment scenarios were tested representing low, medium, and high levels of investments. Each investment level was comprised of improvement “bundles” – multiple strategies used in combination. Safety improvements used were traditional highway countermeasures and reliability improvements were operations strategies. For each bundle, unit costs and impact factors were developed from the literature. Deployment strategies for each bundle were also developed to decide which facilities get treatment; this was done at the corridor level rather than the link level to replicate actual project development. The results clearly show the trade-offs between investment levels in terms of value: “what safety and reliability improvements do we get for our money”. As the size of the investment increases, so do both the benefits (as a reduction of congestion and unreliable travel) and costs. The results were used to judge the most cost-effective approach to improving reliability and safety in the LRTP.
Results
For the “Low” and “Medium” investment levels, a fixed budget was used – sections were improved until the budget was expended. For the “High” investment level, no budget was specified – all sections that had crash rates higher than the average rate were scheduled for improvement. Table 3-1 is a summary of costs and benefits, depending on the level of investment. Table 3-2 shows just the crash reductions for each investment level, compared to the 2040 base that assumes no safety improvements take place.

SHRP 2 Travel Time Reliability Analytical Product Implementation
3-4
Table 3-1 Crash Reduction Costs and Benefits
Investment Level Benefits Responsible
Agency Description Annual Cost 20 Year Cost
Level 1
Total crashes are reduced by 4,390 (9%) Total fatal crashes reduced by 13 (9.7%) Bike/pedestrian crashes reduced by 136
Hillsborough Intersections, medians, sidewalks, school safety
$11,315,000 $226,300,000
City of Tampa Sidewalks, bikeways, crosswalks
$5,768,638 $115,372,768
Temple Terrace
Sidewalks, bike lanes, ADA curbs $132,760 $2,655,200
Plant City Intersections, sidewalks $112,000 $2,240,000
FDOT Education, enforcement, grants to local agencies
$7,586,600 $151,732,000
Total $24,914,998 $498,299,968
Level 2
Total crashes are reduced by 9,017 (20.2%) Total fatal crashes reduced by 28 (20.2%) Bike/pedestrian crashes reduced by 294
All
903 intersection treatments: signal adjustments, pedestrian signals & refuge areas, turn lanes/bays, crosswalks
$22,575,000 $451,500,000
Hillsborough County
600 miles of new standard street lights, including operational cost for 20 years
$21,000,000 $420,000,000
All 300 miles of new sidewalks for continuous sidewalk on at least one side of all major roads
$2,400,000 $48,000,000
Total $45,975,000 $919,500,000
Level 3
Total crashes are reduced by 22,722 (50.8%) Total fatal crashes reduced by 68 (50.7%) Bike/pedestrian crashes reduced by 704
All 903 miles of "complete streets" treatments on major roads with above-average crash rate
$87,918,338 $1,758,366,750
Hillsborough County
600 miles of new standard street lights, including operational cost for 20 years
$21,000,000 $420,000,000
All 300 sidewalk miles, for continuous sidewalk on at least one side of all major roads
$2,400,000 $48,000,000
Total $111,318,338 $2,226,366,750
Table 3-2 Crash Reductions Due to Safety Investments (Arterials and Collectors, Hillsborough County)
Expected Number of Crashes in 2040 (% reduction)
Crash Type Investment Level
Base Level 1 ($64M) Level 2 ($320M) Level 3 (Unlimited) Total 44,741 43,122 (-9%) 37,773 (-20%) 22,019 (-51%)
Fatal 134 129 (-10%) 113 (-20%) 66 (-51%)
Bike/Pedestrian 1,387 1,337 (-4%) 1,171 (-16%) 683 (-50%)

SHRP 2 Travel Time Reliability Analytical Product Implementation
3-5
Details of the analysis process and results are found in Appendix B.
3.4 SUMMARY AND RECOMMENDATIONS FOR NEXT STEPS The SHRP2 Project C11 methodology for predicting travel time reliability was successfully implemented for the Hillsborough County MPO. Rather than using the standalone spreadsheet developed by Project C11, the methodology was implemented as a post-processor to the MPO’s travel demand model. In addition, procedures in the Highway Safety Manual for predicting crashes were added to the C11 Post-Processor. Application of the Post-Processor for the 2040 update to the Hillsborough County transportation plan produced project lists and associated costs for making improvements, as well as the reliability and safety impacts of those improvements. The operations and safety projects identified by the C11 Post-Processor have been included in the LRTP.
Several recommendations are made to advance the use of the C11 Post-Processor, and thereby encouraging that reliability and safety can be included in transportation plans:
Develop “user-grade” software. The C11 Post-Processor currently exists as a set of code that can be manipulated by a knowledgeable researcher. However, it is not designed to be user friendly, and its input and output interfaces would have to be improved if it is to operate by planning staff.
Apply the C11 Post-Processor to support another Florida MPO’s long-range transportation plan update. Even if user-grade software is not developed, the C11 Post-Processor can be cost-effectively applied to other MPOs because all of the analytical techniques have been programmed.
Adapt the C11 Post-Processor for statewide planning. While the C11 Post-Processor is set up to work with a travel demand model, it is possible to extract its reliability and safety prediction methods to improve impact analysis in FDOT’s statewide planning.

SHRP 2 Travel Time Reliability Analytical Product Implementation
4-1
4.0 Identification and Evaluation of the Cost-Effectiveness of Highway Design Features to Reduce Nonrecurrent Congestion – SHRP2 Project L07
4.1 SUMMARY OF SHRP GUIDANCE The SHRP2 Project L07 focused on identifying road design treatments for improving the reliability of freeways and arterials. The objectives of that project were to:
Identify the full range of possible roadway design features used by transportation agencies on freeways and major arterials to improve travel time reliability and reduce delays due to key causes of non-recurrent congestion;
Assess their costs and operational and safety effectiveness, and
Provide recommendations for their use and eventual incorporation into appropriate design guides.
The L07 project produced two products that were evaluated here:
Design Guide for Addressing Non-recurrent Congestion (The L07 Guide); and
A Microsoft-based Excel tool for Analysis Tool for Design Treatments to Address Non-recurrent Congestion (The L07 Tool.)
The L07 Design Guide addresses the following design treatments: medians, shoulders, crash investigation sites, right-of-way edge, arterials and ramps, detours, truck incident design considerations, construction, animal-vehicle collision design considerations, weather, lane types and uses, traffic signals and control, technology, and emergency response notification (see Table 4-1).
The Design Guide also includes two decision trees for assisting designers in selecting transportation system management and operations (TSM&O) measures

SHRP 2 Travel Time Reliability Analytical Product Implementation
4-2
for mitigating reliability problems, which will be evaluated here separately from the design treatments contained in the L07 Guide (see Figure 4-1 and Figure 4-2).
The reliability benefits of different design treatments were estimated by the L07 project using reliability prediction equations from SHRP2 L03 that were adapted for use in L07. Safety benefits were predicted as a function of predicted changes in non-recurrent congestion.
The L07 Tool was developed to interactively predict the reliability effects of the design treatments as a function of site conditions and traffic data.
Table 4-1 SHRP2 L07 Reliability Design Treatments Design-Related Treatments Non-Design Treatments
Medians Lane Types and Uses
Emergency crossovers (every 3-4 miles) F/A Contra-flow lanes—evacuation F/A
Moveable traffic barriers F/- Contra-flow lanes—work zones F/A
Controlled/gated turnarounds F/- HOV lanes/HOT lanes F/A
Movable cable median barrier F/A Dual facilities (bypass lanes) F/-
Extra-height median barrier (>42 inches) F/A Reversible lanes F/A
Traversable medians (13-16 ft) -/A Work zone express lanes F/-
Shoulders
Accessible shoulder (12ft) F/A Traffic Signals and Control
Drivable shoulder (12ft) F/A EV Traffic signal preemption F/A
Alternating shoulder (10-12ft) F/A Queue jump lanes F/A
Portable incident screens F/A Traffic signal improvements -/A
Emergency pull-offs/Turnouts (8ft) F/A Signal timing systems -/A
Bus Turnouts (12x60ft) -/A Ramp metering/flow signals F/A
Crash Investigation Sites Temporary traffic signals -/A
Crash investigation sites (30x85ft) F/A Variable speed limit/ reduction F/-
Right-of-way Edge
Locked gate emergency access F/- Technology
Arterials and Ramps Electronic toll collection F/-
Ramp widening (Add lanes) F/- Over-height vehicle detection syst F/A
Ramp closure (time of day, temporary) F/-
Off-Ramp terminal traffic control F/- Emergency Resp. Notification
Ramp turn restrictions (time day, event) -/A Reference location signs F/A
Detours Roadside call boxes F/A
Improvements to detour routes F/A
Truck Incident Design Considerations Weather
Runaway truck ramps F/A Fog detection F/A
Construction Road Weather Info. Syst. (RWIS) F/A
Reduced construction duration F/A Flood warning system F/A

SHRP 2 Travel Time Reliability Analytical Product Implementation
4-3
Design-Related Treatments Non-Design Treatments
Medians Lane Types and Uses
Improved work site access/circulation F/A Wind warning system F/A
Animal-Vehicle Collision Design
Wildlife fencing, over/underpasses F/-
Weather
Snow fences F/A
Blowing sand mitigation F/A
Anti-icing systems F/A
“F/A” means treatment applies to both freeways and arterials.
Adapted from SHRP2 L07 Design Guide
Figure 4-1 L07 Decision Tree for Selecting Reliability Design Treatments
Adapted from Figure 1, SHRP2 L07 Design Guide, Transportation Research Board, Washington, DC 2013
Note: this chart does not address reliability problems caused by demand fluctuations or traffic control device malfunctions.

SHRP 2 Travel Time Reliability Analytical Product Implementation
4-4
Figure 4-2 L07 Decision Tree for Selecting Secondary Treatments
Adapted from Figure 2, SHRP2 L07 Design Guide, Transportation Research Board, Washington, DC 2013
Note: this chart does not address reliability problems caused by demand fluctuations or traffic control device malfunctions.
4.2 APPLICABILITY OF GUIDANCE TO FDOT There are very few design ideas in the L07 Guide that are not already practiced somewhere in Florida. For many of those design ideas that are not practiced in Florida, there are good reasons that those strategies have not been adopted in Florida (as confirmed when evaluating these ideas for the I-95 freeway and Okeechobee Blvd. with District 4 personnel). Yet, as one compares the L07 Guide to the Florida Greenbook (FGB) and the FDOT Plans Preparation Manual (PPM), one can see several opportunities for better highlighting transportation system management and operations (TSM&O) strategies and their effectiveness at increasing the throughput and reliability of FDOT’s highway designs.

SHRP 2 Travel Time Reliability Analytical Product Implementation
4-5
In addition to the direction provided in the L07 Design Guide, the L07 project has developed a spreadsheet for estimating the costs and benefits of various reliability design treatments. Costs included in the L07 tool for the reliability design treatment are simplistic and should not be applied in Florida. The L07 cost/benefit spreadsheet is not ready for adoption by FDOT until its project unit costs and benefit computations are validated..
4.3 ANALYSIS DESCRIPTION AND RESULTS The suitability of the L07 products for use in Florida was evaluated according to the following tasks.
Task 1 –Select Test Sites
The objective of this task was to select two sites (one a freeway, the other a conventional state highway) for field testing the L07 Design Guide and Tool. The criteria for this selection were as follows:
The selected field test freeway and arterial sites must have recurring peak hour congestion.
District staff must be available to meet with consultant team to go over the consultant’s products and provide District perspective on the value of the results obtained using the SHRP2 L07 products and suggestions on how they might be improved for application statewide.
The two sites selected for field testing the L07 Design Guide and Tool were:
The I-95 Freeway in Broward County, between SW 10th Street and West Oakland Park Blvd. interchanges (inclusive of those interchanges), a distance of approximately 10.3 miles.
Okeechobee Blvd. (SR 704) in Palm Beach County from State Route 7 to U.S. 1 in Downtown Palm Beach, a distance of about 9 miles.
Both sites fell within FDOT District 4.
Task 2 –Stakeholders Working Group Kick-off Meeting
Once the freeway and arterial test site selection had been approved by the FDOT task manager, the consultant team worked with the FDOT task manager and the selected agencies to identify Central Office and District members for the stakeholders working group to review the proposed evaluation plan, to review the results of the effort, and to develop suggestions on design treatments appropriate in Florida for improving travel time reliability on Florida state highways.

SHRP 2 Travel Time Reliability Analytical Product Implementation
4-6
Task 3 –SHRP2 L07 Products Field Evaluation Plan
The consultant team conducted a preliminary evaluation of the likely opportunities and challenges of applying the SHRP2 L07 products to the test sites and to Florida freeways and arterials in general. This preliminary evaluation:
Compared the L07 Design Guide to design guides commonly used by FDOT (such as the Plans Preparation Manual and FDOT Standard Index) and to identify differences;
Identified the conditions and situations where application of the SHRP2 product would be most likely to be feasible and yield the greatest benefits to FDOT and its partner agencies; and
Identified the more promising treatments to be evaluated in the field test.
Task 4 –Field Testing of SHRP2 L07 Products
The consultant team applied the L07 Design Guide and the Tool to the selected freeway test site and the selected arterial test site and generated a draft set of conclusions as to the feasibility of implementing the more promising L07 design treatments identified in the previous task.
Task 5 – District Design Engineer Review
The consultant team met with Mr. Richard Creed, PE, District Roadway Design Engineer for District 4, to review the preliminary results and conclusions of the site tests and obtain his insights into the feasibility and desirability of implementing the more promising L07 design treatments in the test corridors.
Appendix C includes a detailed account of the evaluation of the opportunities and challenges for applying the SHRP2 L07 products to Florida DOT’s design practices for freeways and arterials.
This appendix:
1) Compares the L07 Design Guide to design guides commonly used by FDOT (such as the Plans Preparation Manual and FDOT Standard Index) and to identify differences;
2) Identifies the conditions and situations where application of the SHRP2 product would be most likely to be feasible and yield the greatest benefits to FDOT and its partner agencies; and
3) Provides recommendations for incorporating portions of the L07 Design Guide, its Decision Tree for selection reliability improvements, and aspects of its cost-benefit analysis methodology into FDOT’s design and analysis practice.
As the reader goes through the L07 Design Guide and the evaluation below, the reader soon realizes that there are very few ideas in the L07 Guide that are not

SHRP 2 Travel Time Reliability Analytical Product Implementation
4-7
already practiced somewhere in Florida. And for many of those that are not practiced in Florida, there are often good reasons that those strategies have not been adopted in Florida.
4.4 SUMMARY AND RECOMMENDATIONS FOR NEXT STEPS Tables 4-2 and 4-3 summarize the evaluation, conclusions, and recommendations from this section.
Several L07 reliability treatments are already standard FDOT practice as follows:
Accessible shoulders
Bus Turnouts
Ramp widening (Add lanes)
Ramp closure (time of day)
Off-Ramp terminal traffic control
Ramp turn restrictions (time day)
Improvements to detour routes
Reduced construction duration
Improved work site access/circulation
Animal-Vehicle Collision Design
Wildlife fencing, over/underpass
Blowing sand mitigation
A few L07 reliability treatments for mountainous and snow conditions were simply not applicable to Florida, such as runaway truck ramps, snow fences, and anti-icing systems.
A few L07 reliability treatments may be beneficial in Florida after they mature a bit more, such as portable incident screens.
Several L07 reliability treatments did not appear promising for general application but may be worthy of consideration in special cases. FDOT may wish to keep these on its design radar screen so that when the appropriate case comes along, they are not overlooked. They include:
Moveable traffic barriers for facilities with highly directional flows.
Controlled gates turnarounds and movable cable barriers where an emergency crossover would not otherwise be located due to concerns of illegal use by the general public.

SHRP 2 Travel Time Reliability Analytical Product Implementation
4-8
Drivable shoulders in combination with active lane management (variable speed limits using overhead lane closure warning and speed limit signs).
Alternating accessible shoulders when adding an express lane in limited right of way situations.
Locked gate emergency access when other means of emergency access are not feasible to incorporate into the design.
Dual facilities (bypass lanes) as a solution to major facility capacity shortages.
Reversible lanes for where heavy directionality of flows is present.
Transit queue jump lanes on arterial streets where high frequency transit service, available traveled way, and recurring arterial congestion are present.
Variable speed limits in combination with active lane management (overhead gantries identifying closed lanes ahead).
A few L07 reliability treatments are worth modifying current FDOT design guidance to attempt to encourage more frequent application in Florida, such as the following:
Specifying criteria for when emergency crossovers and traversable medians may be appropriate for arterials with long stretches between intersections or median breaks. In this case, FDOT needs to identify the criteria for determining when an emergency crossover or traversable median may be appropriate on a long arterial, and add that guidance to its Greenbook.
Modify guidance to encourage more frequent consideration of inclusion of extra-height median barriers (over 42 inches) in freeway designs.
Include guidance on consideration of emergency pull offs, turnouts, and/or crash investigation sites as a mitigation for narrow shoulder situations.
Finally, the L07 project has developed two tools that are worth consideration for incorporation into FDOT planning and preliminary engineering practice. They are:
The reliability mitigation decision trees are a useful aid in identifying the appropriate design treatments to consider for mitigating particular causes of unreliability.
The benefit estimation assumptions, defaults, and methodology used in the L07 benefit/cost tool to evaluate the benefits of design treatments for reliability improvements should be considered for incorporation into FDOT’s tools for evaluating the benefits of design improvements. This would greatly improve consideration of the non-traditional design treatments for improving reliability.

SHRP 2 Travel Time Reliability Analytical Product Implementation
4-9
Next Steps
More than half of the design improvements identified in the L07 Design Guide are currently utilized in Florida. Design standards for these treatments are documented in the Department’s Plans Preparation Manual (PPM). Some of these improvements could further address Florida’s reliability issues if they were applied more frequently. Examples include extra height median barriers, crash investigation sites (where there are narrow shoulders), and emergency crossovers on arterials with extra-long medians. The complete list of these treatments are identified in the appendix for this section. The Department should evaluate a process to consider these treatments more often in the design process. The requirement for an evaluation of these treatments should be included in PD&E manual. It is recommended that the Statistics Office coordinate with the Environmental Management office to include these in the next update of the PD&E manual.
Several of the L07 reliability treatments not currently utilized by the Department should be considered in the future. To combat unreliable travel, select design alternatives could be advanced for inclusion in the Department’s Plans Preparation Manual and Florida Green Book. Similarly, those design treatments relevant to Express Lanes should be evaluated for inclusion in the Express Lanes Handbook. These include alternating accessible shoulders, locked gate emergency access, variable speed limits, and drivable shoulders. It is recommended that the Statistics Office coordinate with the Design Office to analyze the potential for including these in the PPM. A good approach would be to present the implications of inclusion of such treatments to a broader set of stakeholders such as the District Design Engineers.
Through a second phase of implementation, the project team will link the L07 analysis products to FDOT analysis tools. This will be accomplished through extracting L07’s technical procedures and embedding the code directly into tools used for project development and prioritization. The project team will develop a report documenting how the L07 procedures were implemented in existing analysis tools. This will greatly improve consideration of the non-traditional design treatments for improving reliability.

SHRP 2 Travel Time Reliability Analytical Product Implementation
4-10
Table 4-2 SHRP2 L07 Reliability Treatments Recommendations
Design-Related Treatments Preliminary Evaluation
Freeway Test Site Evaluation
Arterial Test Site Evaluation
District Design Engineer Conclusions
MEDIANS
Emergency crossovers Test benefits of denser spacing at urban freeway site.
More frequent crossovers not feasible for urban freeway, Modest to low B/C
Not needed. Arterial has adequate median breaks and intersections
Not feasible. Keep Current practice
Keep Current Practice. Add maximum spacing recommendation to Florida Greenbook.
Moveable traffic barriers Not Cost Effective - Not generally applicable. Consider on case-by-case basis.
Controlled/gated turnarounds
Test to see if can support more frequent emergency crossovers
More frequent crossovers not feasible for urban freeway, Modest to low B/C
Not needed. Arterial has adequate median breaks and intersections
Not feasible. Keep Current practice,
Not generally applicable. Consider on case-by-case basis.
Movable cable median barrier
Test to see if can support more frequent emergency crossovers
More frequent crossovers not feasible for urban freeway, Modest to low B/C
Not needed. Arterial has adequate median breaks and intersections
Not feasible. Keep Current practice,
Not generally applicable. Consider on case-by-case basis.
Extra-height median barrier Test increased use on freeway site
In place at freeway test site. High potential B/C for sites without it.
Not appropriate for arterial application
Modify guidance to encourage increased use on freeways
Traversable medians Test increased use on arterial site
Not appropriate for urban freeway
Desirable to mitigate long stretch between openings
Good for certain arterial locations.
Modify guidance to encourage increased use on arterials with infrequent median breaks
SHOULDERS
Accessible shoulder Current Practice Current FDOT Practice
Drivable shoulder Test wider shoulders on both sites
Low B/C, Costly Shoulders needed for parking, bike lanes, right turn lanes
Potentially if combined with broader managed lanes strategy (overhead gantries with lane by lane control)
Consider as part of larger managed lane implementation
Alternating shoulder Test as option when full shoulders not feasible
Not needed at test site. Had low B/C
Not needed at test site. Had low B/C
Not generally applicable. Consider on case-by-case basis.
Portable incident screens Too many limitations on use.
Do not adopt portable screens unless limitations can be overcome

SHRP 2 Travel Time Reliability Analytical Product Implementation
4-11
Design-Related Treatments Preliminary Evaluation
Freeway Test Site Evaluation
Arterial Test Site Evaluation
District Design Engineer Conclusions
Emergency pull-offs/Turnouts
Use when standard shoulders not feasible
Test site had adequate shoulders. Potentially high B/C where narrow shoulders
Test site had adequate shoulders – not needed.
Test site had adequate shoulders - not needed.
Identify as potential mitigation for narrow shoulders on freeways
Bus turnouts Current Practice Current FDOT Practice
Crash investigation sites
Crash investigation sites Use when standard shoulders not feasible
Test site had adequate shoulders. Therefore Low to moderate B/C
Test site had adequate shoulders – not needed.
Consider for sites when adequate shoulders cannot be provided.
RIGHT-OF-WAY EDGE
Locked gate emergency access
Not preferred means of access
Not generally applicable. Consider on case-by-case basis.
ARTERIALS AND RAMPS
Ramp widening (Add lanes) Current Practice Current FDOT Practice
Ramp closure (time of day) Current Practice Current FDOT Practice
Off-Ramp terminal traffic control
Current Practice Current FDOT Practice
Ramp turn restrictions (time day)
Current Practice Current FDOT Practice
DETOURS
Improvements to detour routes
Current Practice Current FDOT Practice
TRUCK INCIDENT DESIGN
Runaway truck ramps Not Applicable Not Applicable in Florida
CONSTRUCTION
Reduced construction duration
Current Practice Current FDOT Practice
Improved work site access/circulation
Current Practice Current FDOT Practice
ANIMAL-VEHICLE COLLISION DESIGN
Wildlife fencing, over/underpass
Current Practice Current FDOT Practice

SHRP 2 Travel Time Reliability Analytical Product Implementation
4-12
Design-Related Treatments Preliminary Evaluation
Freeway Test Site Evaluation
Arterial Test Site Evaluation
District Design Engineer Conclusions
WEATHER
Snow fences Not Applicable Not applicable in Florida
Blowing sand mitigation Current Practice Current FDOT Practice
Anti-icing systems Not Applicable Not applicable in Florida
Table 4-3 SHRP2 L07 Reliability Non-Design Treatments Recommendations
Non-Design Treatments Preliminary Evaluation Freeway Test Site Evaluation
Arterial Test Site Evaluation Conclusions
LANE TYPES AND USES
Contra-flow lanes—evacuation Current Practice Current FDOT Practice
Contra-flow lanes—work zones Current Practice Current FDOT Practice
HOV lanes/HOT lanes Current Practice Current FDOT Practice
Dual facilities (bypass lanes) Not practical Not generally applicable. Consider on case-by-case basis.
Reversible lanes Test at 2 sites Site traffic balanced Infeasible Not generally applicable. Consider on case-by-case basis.
Work zone express lanes Current Practice Current FDOT Practice
TRAFFIC SIGNALS AND CONTROL
EV Traffic signal preemption Current Practice Current FDOT Practice
Transit queue jump lanes Test on arterial Not appropriate Feasible some spots
Not generally applicable. Consider on case-by-case basis.
Traffic signal improvements Current Practice Current FDOT Practice
Signal timing systems Current Practice Current FDOT Practice
Ramp metering/flow signals Current Practice Current FDOT Practice
Temporary traffic signals Current Practice Current FDOT Practice
Variable speed limit/ reduction Test at 2 sites May be useful in combination with other treatments
Not likely effective Not generally applicable. Consider on case-by-case basis.

SHRP 2 Travel Time Reliability Analytical Product Implementation
4-13
Non-Design Treatments Preliminary Evaluation Freeway Test Site Evaluation
Arterial Test Site Evaluation Conclusions
TECHNOLOGY
Electronic toll collection Current Practice Current FDOT Practice
Over-height vehicle detection system
Current Practice Current FDOT Practice
EMERGENCY RESP. NOTIFICATION
Reference location signs Current Practice Current FDOT Practice
Roadside call boxes Current Practice Current FDOT Practice being replaced by cell phones.
WEATHER
Fog detection Current Practice Current FDOT Practice
Road Weather Info. Syst. (RWIS) Current Practice Current FDOT Practice
Flood warning system Current Practice Current FDOT Practice
Wind warning system Current Practice Current FDOT Practice
OTHER L07 TOOLS
Reliability Mitigation Decision Tree Review, Edit, and Add to Florida Greenbook
Benefit/Cost Tool Consider adding features to next SIT tool update


SHRP 2 Travel Time Reliability Analytical Product Implementation
5-1
5.0 Establishing Monitoring Programs for Travel Time Reliability – SHRP2 Project L02
5.1 SUMMARY OF SHRP GUIDANCE Project L02 was conducted to create methods for monitoring travel time reliability, evaluating the data, and communicating the results to decision makers and users of the transportation system. L02 focused on how to measure reliability, how to understand what makes a system unreliable, and how to pinpoint mitigating actions.
The project developed guidance for operating agencies about how to put reliability measurement methods into practice by enhancing existing monitoring systems or creating new ones. The project’s main product is a guidebook which describes how to develop and use a Travel Time Reliability Monitoring System (TTRMS). A set of supporting documents provide additional detail not found in the guidebook.
Project L02 produced a guidebook that describes how to develop and use a Travel Time Reliability Monitoring System (TTRMS). It explains why such a system is useful, how it helps agencies do a better job of managing network performance, and what a traffic management center (TMC) team needs to do to put a TTRMS in place.
The SHRP2-L02 TTRMS is designed to be an add-on to an existing traffic management system. It is not a standalone system. A data manager within the TTRMS assembles incoming information coming from the traffic management system (TMS), such as data from traffic sensors, weather data feeds and incident reporting systems. The TTRMS data manager filters and “cleans” the data. The TTRMS computational engine identifies when the system travel times are reliable and when they are not, associating those results with the conditions causing them (e.g. demand, weather, incidents). The TTRMS report generator responds to inquiries from users and uses the computational engine to analyze the data.
Figure 5.1 shows the four key information flow steps a TTRMS must execute to fulfill its purpose as a decision support tool.
First, the TTRMS needs to effectively measure travel times. This is a complex technical topic due to the variability of traveler behavior and the plethora of different measurement sensors. Correctly measuring travel times along a given

SHRP 2 Travel Time Reliability Analytical Product Implementation
5-2
route requires a great deal of systems development effort and statistical knowledge. This guide serves as a primer on how to measure travel times effectively using available technologies and statistical techniques. Measuring an individual travel time is the foundational unit of analysis for reliability monitoring.
Second, the TTRMS needs to clearly characterize the reliability of a given system. This entails taking a set of measured travel times and assembling them into a statistical model of the behavior of a given segment or route. In this guide, regimes refer to the categories of conditions under which the segment, route, or network is operating at a given point in time (or from one time to another). The statistical paradigm outlined in this guide uses probability density functions (PDFs) to characterize the performance of a given segment or route, usually specific to a particular operating regime (a combination of congestion level and nonrecurring event). This guide gives specific advice on the statistical decisions required to effectively characterize the travel times. Characterizing the reliability of a segment or route is fundamental to making good decisions about how to improve the performance of that segment or route.
Third, the TTRMS should identify the sources of unreliability. Once the reliability of a segment or route has been characterized, transportation managers need to understand what caused the unreliability (and how to improve it).
Figure 5-1 Information Flow in a TTRMS
SHRP 2 Travel Time Reliability Analytical Product Implementation
5-3
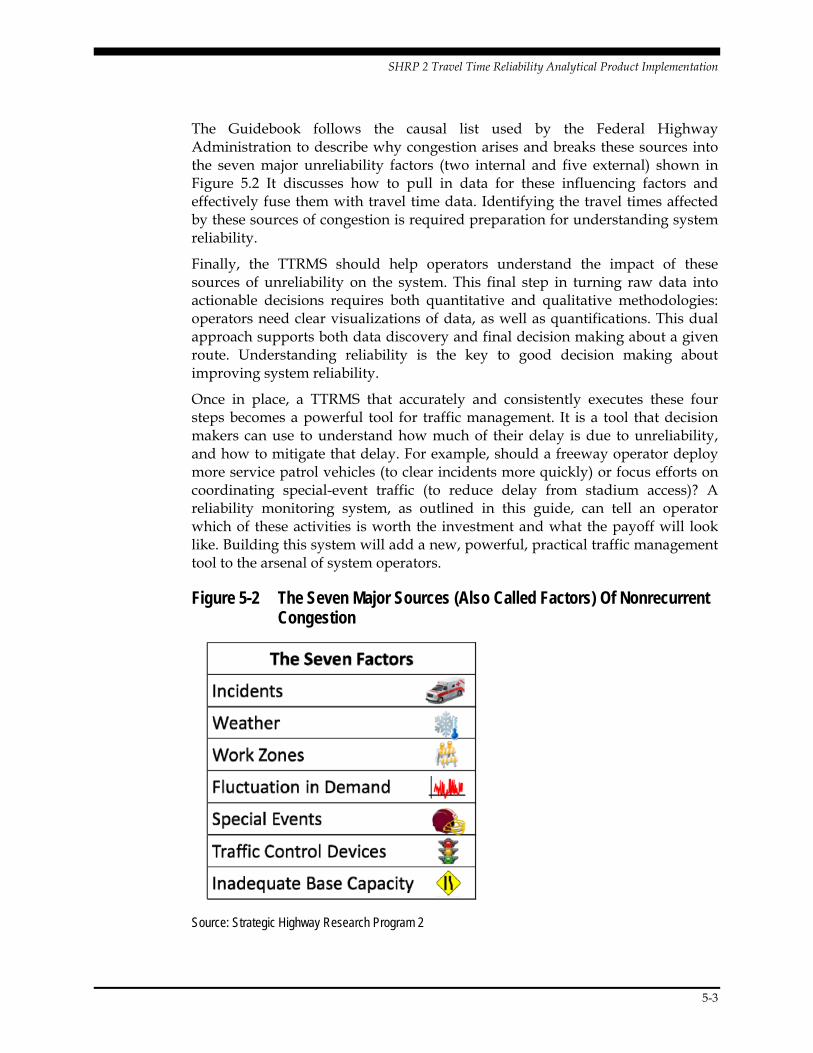
The Guidebook follows the causal list used by the Federal Highway Administration to describe why congestion arises and breaks these sources into the seven major unreliability factors (two internal and five external) shown in Figure 5.2 It discusses how to pull in data for these influencing factors and effectively fuse them with travel time data. Identifying the travel times affected by these sources of congestion is required preparation for understanding system reliability.
Finally, the TTRMS should help operators understand the impact of these sources of unreliability on the system. This final step in turning raw data into actionable decisions requires both quantitative and qualitative methodologies: operators need clear visualizations of data, as well as quantifications. This dual approach supports both data discovery and final decision making about a given route. Understanding reliability is the key to good decision making about improving system reliability.
Once in place, a TTRMS that accurately and consistently executes these four steps becomes a powerful tool for traffic management. It is a tool that decision makers can use to understand how much of their delay is due to unreliability, and how to mitigate that delay. For example, should a freeway operator deploy more service patrol vehicles (to clear incidents more quickly) or focus efforts on coordinating special-event traffic (to reduce delay from stadium access)? A reliability monitoring system, as outlined in this guide, can tell an operator which of these activities is worth the investment and what the payoff will look like. Building this system will add a new, powerful, practical traffic management tool to the arsenal of system operators.
Figure 5-2 The Seven Major Sources (Also Called Factors) Of Nonrecurrent Congestion
Source: Strategic Highway Research Program 2
SHRP 2 Travel Time Reliability Analytical Product Implementation
5-4
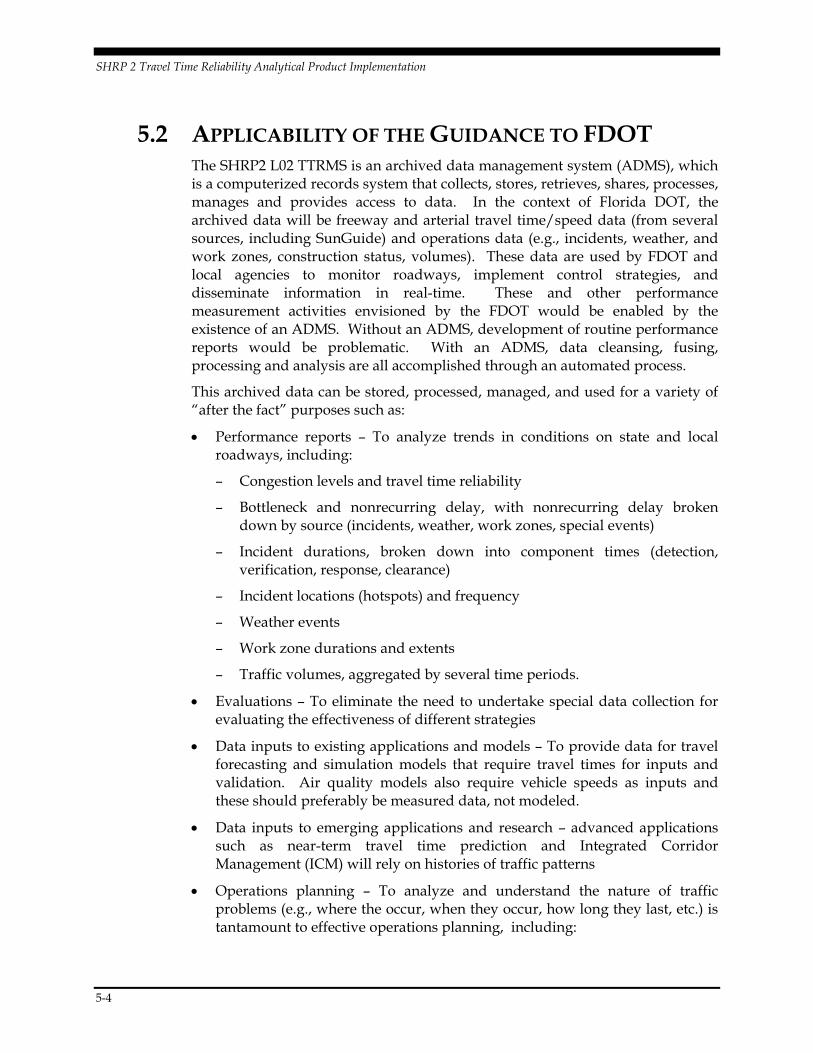
5.2 APPLICABILITY OF THE GUIDANCE TO FDOT The SHRP2 L02 TTRMS is an archived data management system (ADMS), which is a computerized records system that collects, stores, retrieves, shares, processes, manages and provides access to data. In the context of Florida DOT, the archived data will be freeway and arterial travel time/speed data (from several sources, including SunGuide) and operations data (e.g., incidents, weather, and work zones, construction status, volumes). These data are used by FDOT and local agencies to monitor roadways, implement control strategies, and disseminate information in real-time. These and other performance measurement activities envisioned by the FDOT would be enabled by the existence of an ADMS. Without an ADMS, development of routine performance reports would be problematic. With an ADMS, data cleansing, fusing, processing and analysis are all accomplished through an automated process.
This archived data can be stored, processed, managed, and used for a variety of “after the fact” purposes such as:
Performance reports – To analyze trends in conditions on state and local roadways, including:
– Congestion levels and travel time reliability
– Bottleneck and nonrecurring delay, with nonrecurring delay broken down by source (incidents, weather, work zones, special events)
– Incident durations, broken down into component times (detection, verification, response, clearance)
– Incident locations (hotspots) and frequency
– Weather events
– Work zone durations and extents
– Traffic volumes, aggregated by several time periods.
Evaluations – To eliminate the need to undertake special data collection for evaluating the effectiveness of different strategies
Data inputs to existing applications and models – To provide data for travel forecasting and simulation models that require travel times for inputs and validation. Air quality models also require vehicle speeds as inputs and these should preferably be measured data, not modeled.
Data inputs to emerging applications and research – advanced applications such as near-term travel time prediction and Integrated Corridor Management (ICM) will rely on histories of traffic patterns
Operations planning – To analyze and understand the nature of traffic problems (e.g., where the occur, when they occur, how long they last, etc.) is tantamount to effective operations planning, including:

SHRP 2 Travel Time Reliability Analytical Product Implementation
5-5
– Detour planning;
– Ramp meter and DMS deployments;
– Evacuation planning;
– Work zone scheduling and planning; and
– Incident management deployment
The preliminary review of the L02 Guidebook found the following:
It is hard to find guidance in the L02 Guide. It describes various methods for monitoring travel time and therefore travel time reliability, but is ambivalent about conditions when one method may be superior to another. In essence, the Guide presents the readers with many ideas on how to monitor travel time.
The L02 Guide is oriented toward the development and operation of a single global data acquisition program and database. Florida however has several databases, covering different geographic areas of the state, different facilities within each geographic area, and with different parts of the data components necessary for a comprehensive reliability-monitoring program. In addition, some of the data sources used in the different Florida databases overlap each other, and there is varying confidence in some of those data sources.
Chapter 2 of the L02 Guide describes the creation of a database from scratch, which is not realistic for Florida, given the advanced state of many of its performance monitoring databases.
The L02 Guide does not address nor provide guidance on the process for integrating various pre-existing databases. Given that the L02 Guide was published two years ago and undoubtedly reflects the state of the practice three to four years ago, the focus on developing a database from scratch is appropriate for the state of the practice at that time. However, with the development of several new databases (such as NPMRDS) in the meantime, it is necessary to go beyond the L02 Guide for Florida.
5.3 ANALYSIS DESCRIPTION AND RESULTS The goals of this effort were:
To improve the ability of FDOT Central Office, FDOT Districts, MPO’s and local agencies in Florida to monitor reliability trends statewide and within their jurisdiction, and
To increase the ability of FDOT Districts, MPOs and local agencies to identify reliability problem spots within their system and diagnose their causes in order to suggest possible treatment options.
The objectives of the analysis were to determine:

SHRP 2 Travel Time Reliability Analytical Product Implementation
5-6
1. The extent to which application of the SHRP2 L02 product could improve the planning, management, and operations functions of FDOT and its partner agencies,
2. The improvements needed in FDOT’s/Agencies infrastructure to successfully apply the SHRP2 L02 product, and
3. The improvements needed in the SHRP2 L02 product itself for successful application by FDOT and its partner agencies.
The SHRP2 L02 project was initiated with a stakeholder outreach effort. Prior to the stakeholder meeting a memo was developed to provide background for the participating stakeholders. The memo described SHRP2 L02 Guidebook, the causes of unreliability, the desirable attributes of a reliability monitoring system, data sources, data processing issues, and analysis of the unreliability factors. A stakeholder workshop was held on April 30, 2014 in the FDOT District offices in Fort Lauderdale and there were 12 attendees. An overview of the project purpose, scope, and schedules presented along with the objectives, steps, and schedule for stakeholders participation. The proposed test sites: I-95 Freeway in Broward County, and 45th Street in Palm Beach County were identified. Brief highlights of the contents of the SHRP2 L02 (Reliability Monitoring) and L07 (Designing for Reliability) Guides were addressed and some preliminary thoughts on where they might be useful for Florida practice were shared.
As the study team began preliminary evaluation of the L02 Guide, conducted meetings with stakeholders in District 4 and in the Central Office, and continued progress on the TWO 17 (Feasibility of Field Measuring Reliability) and evaluation of the SHRP2 L05 Guide (TWO 22, subtask 3) have suggested some new, more fruitful directions for pursuing the L02 evaluation. A revised scope provided new directions for the L02 evaluation along with the rationale for pursuing them.
In addition, another effort within FDOT was conducted to evaluate the feasibility of using field measured travel time data for calculating mobility performance measures (MPM), and to make recommendations on how to use measured data for future source book editions. FDOT had already evaluated many of the alternative traffic monitoring sources identified in the L02 Guide and has come to the following recommendations for the Florida Source Book on Mobility Performance Measures (many of which are applicable or can be adapted or extended for District and local agency monitoring needs):
1. INRIX data currently available to Florida through the I-95 Coalition agreement is too limited in the facilities it covers.
2. NPMRDS (FHWA’s National Performance Management Research Data Set) does not cover the whole SHS.
3. Continue to use the existing HERE data acquired through the ITS office and accessible in the RITIS system.
a. Assuming gaps identified in the data are filled.

SHRP 2 Travel Time Reliability Analytical Product Implementation
5-7
b. Reconcile TMC configurations for HERE data to RITIS links.
4. Postpone for now acquisition of additional travel time data from additional commercial vendors.
Consequently, the consultant team no longer believed it would be as valuable as initially anticipated to perform head-to-head tests on specific Florida facilities of a brand new reliability-monitoring database developed per the L02 Guidelines against current Florida monitoring practice. Instead, the team recommended that more recent developments on reliability monitoring (both inside and outside of Florida) be used to develop recommendations on how to improve the consistency, quality, completeness, and ultimately, the usefulness of current Florida travel time reliability archival practices and databases, with the L02 Guidebook serving as a starting point for the recommendations, rather than their endpoint.
The revised scope modified two key tasks of the L02 evaluation, the new scope is described below.
Task 1 – Evaluation of Travel Time Data Sources (New)
This new task in essence extended the conclusions regarding data sources for the TranStat Mobility Performance Measures Source Book to address other Central Office monitoring needs, District monitoring needs, and MPO/local agency monitoring needs.
This task involved:
Identifying other Central Office travel time monitoring needs
Identifying MPO/Local/District monitoring needs (arterial and freeway facilities)
Identifying users of a monitoring system
Identifying use cases and potential applications of a travel time monitoring system
Drawing on the information gathered and tests performed as part of TWO 17 to identify the travel time data sources appropriate for other Central Office, District, MPO, and Local monitoring needs. Assess the capabilities of the existing data sources and determine how well these data sources meet the needs of users.
Identifying any potential resource requirements, functional requirements, and other issues with incorporating the data in existing FDOT databases: RITIS and SunGuide.
Determining and describing an appropriate database or databases for archiving the data.

SHRP 2 Travel Time Reliability Analytical Product Implementation
5-8
Preparing a report for stakeholders review on conclusions and revise the report based on comments.
Task 2 – Integration of Unreliability Explanatory Factors into Database(s) (New)
This new task identified the current and best sources of explanatory factors (demand, incidents, weather, work zones, special events) for incorporation into the recommended travel time reliability database(s) identified in the previous task by agency type (Central Office, District, MPO, local) for arterial and freeway facilities on and off of the SHS. The extent to which current databases (RITIS and SunGuide and District) adequately incorporate the explanatory factors will be assessed.
Appendix D presents the mobility performance monitoring feasibility analysis, approach, and results for L02.
5.4 SUMMARY AND RECOMMENDATIONS FOR NEXT STEPS This effort has identified many potential uses for a FDOT Mobility Performance Monitoring System, which is a SHRP2-L02 TTRMS. Such a system will be useful and productive to FDOT. Furthermore, recent advances in information technology have made the development of decentralized systems that integrate various databases for user queries viable and feasible. Therefore, it is recommended that the FDOT TranStat office pursue implementation of a decentralized FDOT Mobility Performance Monitoring System by developing a Concept of Operations and detailed design.
Several components of the MPMS must be developed in the design phase:
1. Develop a MPMS Concept of Operations. The ConOps will include constructive stakeholder participation and will determine:
– the specific databases to be linked to the system,
– the interface requirements for each identified database,
– the communications requirements needed to transport data from each database to a FDOT processing server in near real time,
– the roles and responsibilities of each participating stakeholder,
– the office responsible for developing the MPMS, purchasing equipment/software, system maintenance and quality control, and
– a phasing plan to implement the MPMS in manageable stages.
2. Develop more detailed functional requirements for the MPMS;

SHRP 2 Travel Time Reliability Analytical Product Implementation
5-9
3. Design a processing and storage system that meets the identified functional requirements, the detailed requirements task and the Con Ops;
4. Determine the required output formats for queries;
5. Determine the sufficiency of the data quality controls of each database and identify any needed changes;
6. Conduct a data business plan for the system and define data governance for the system; and
7. Identify the needed information technology hardware and software needed to implement the system.

SHRP 2 Travel Time Reliability Analytical Product Implementation
6-1
6.0 Incorporation of Travel Time Reliability into the Highway Capacity Manual - SHRP2 Project L08
6.1 SUMMARY OF SHRP GUIDANCE SHRP2 Project L08 is developing methods and guidance on incorporating travel time reliability into Highway Capacity Manual (HCM) analyses. The main product of this project will be a guidebook that describes travel time reliability concepts for an HCM audience, provides step-by-step processes for predicting travel time reliability for freeway and urban street facilities, and illustrates example applications of the procedures. When the reliability measures are adopted by the Highway Capacity and Quality of Service Committee and implemented in the HCM they will provide national consistency to evaluating oversaturated conditions. When LOS is based on density, oversaturated conditions result in LOS F. An analyst can examine a volume to capacity (v/c) ratio to guess at the severity of the oversaturated condition. However, there is no nationally accepted guidance on calculating the degree of LOS F using v/c ratios. The reliability measures in the L08 Report, speed and travel time, provide an indication of the severity of oversaturated conditions.
The L08 Report states that useful performance measures should not confuse nontechnical audiences. Some of the suggested reliability measures in the Report are most useful to transportation analyst and are not as useful for decision makers and nontechnical audiences. Measures that provide detailed analytical outputs on facility performance typically do not translate well for non-technical users. The service measures for level of service (LOS) are based on travelers’ perception and are intended to communicate mobility expectations to an average traveler. Traditionally LOS measures for facility performance have served both the needs of decision makers and transportation engineers.
Both the freeway and urban streets reliability methodology are for evaluating a facility’s reliability, in terms of its operational performance over an extended time period. The predictive methodologies use the Highway Capacity Manual 2010 methodologies to predict the operational performance of a facility for each of many small time periods that collectively represent traffic conditions during the extended time period of interest. The predictions are used to describe the distribution of various performance measures, notably travel time, over this time
SHRP 2 Travel Time Reliability Analytical Product Implementation
6-2
period. The distribution provides an indication of the degree to which the facility provides reliable service.
The HCM Volume 4 contains computational software, FREEVAL and STREETVAL, that serve as replacements for the hand calculations within Volumes 2 and 3. The FREEVAL computational engine has a separate version (FREEVAL-RL) for travel time reliability computations. The two FREEVAL-RL reliability performance measures are Travel Time Index (TTI) and Denied Entry Vehicle Queue Length (DEQL). The DEQL identifies severely congested scenarios for further analysis. Since the HCM is not designed to handle these types of conditions, the DEQL can serve as a flag for unrealistic results under severely congested conditions. The HCM shows no capacity reduction on a facility where a bottleneck is present. Unlike the Freeway Chapter within the HCM, FREEVAL-RL reduces the capacity on a freeway segment for bottleneck queue discharge by 5 – 9%. The FREEVAL-RL user interface is not conventional in comparison to other traffic analysis software programs.
6.2 APPLICABILITY OF THE GUIDANCE TO FDOT FDOT is exploring using travel time reliability as the primary service measure for urban freeways. To accomplish this, a methodology predicting the performance of the motorized vehicle traffic stream needs to be adopted. The SHRP2 L08 Report and the HCM procedure for accounting for travel distribution would be appropriate to apply in Florida. To further utilize these tools an analysis of the resources required to implement this SHRP 2 product in Florida is needed. Software requirements of the SHRP2 L08 product are met by the software packages possessed by FDOT, SHRP2 L08 requires Microsoft Excel software. Additional work needed to make these products implementation ready include 1) Default values could be updated to better represent Florida conditions, 2) Improving the software user interface to make it more user-friendly, include Florida-specific reliability measures, and refine reliability report format.
The reliability performance measures must be field-measurable and demonstrate a distribution of travel times that occur over a substantial period of time. Loop detectors cannot account for pure distribution of all travel times because the detectors aggregate too many trips. At each aggregation, variability in measurements is reduced. It is essential, in measuring reliability, that FDOT maintains travel distribution records and accurately accounts for the history of travel times. The SHRP2 L08 Report uses 15-minute averages as the basic unit of measurement used to construct travel time distribution, from which reliability metrics like TTI emerge. The TTI output is useful to FDOT in calculating reliability measures but FDOT already has an alternative method for producing TTI on Florida facilities. Transportation agencies in Florida should not mandate the use of FREEVAL-RL for computing travel time reliability until a comparison between the Florida reliability predictive analysis and FREEVAL-RL is complete.

Memorandum
TO: Doug McLeod
FROM: Anita Vandervalk, Dena Snyder, Tyrone Scorsone, Cambridge Systematics, Inc.
DATE: June 13, 2014
RE: Incorporating Reliability into FDOT Planning and Programming
1. Project Objectives
Following the guidance set forth by SHRP 2 L05, this project seeks to inform the Florida DOT how and where to incorporate reliability and operational improvements into the planning, programming, and budgeting processes. This memorandum documents the work steps and products we have produced to date in support of the L05 portion of the Task Work Order. It includes diagrams of the FDOT project planning and programming processes and an assessment matrix outlining where the Department currently stands in regards to meeting the four key steps for incorporating reliability from SHRP 2 L05. We have produced this work in support of subtask 1 of Task Work Order 22.
2. Summary of Work Steps
We began with a thorough inventory and assessment of documents describing the Department’s planning and programming processes. Each document was reviewed in detail, with particular attention paid to what extent the processes outlined in the plan address reliability and incorporate performance measures. The following documents were reviewed in preparation for this task:
The 2060 Florida Transportation Plan The SIS Strategic Plan The Statewide Comprehensive Plan The FDOT Program and Resource Plan The Long Range Program Plan The ITS Strategic Plan Florida’s Statewide Systems Engineering Management Plan The State Planning and Research Program Plan Prioritizing Florida’s Highway Investments The SIS Project Eligibility Matrix The FDOT ITS Performance Measures Quarterly Report The Final Report on Multimodal and Corridor Applications of Travel Time Reliability
SHRP2 Travel Time Reliability Analytical Product ImplementationAppendix
A-1
A. L05 Analysis and Results Description

- 2 -
The Florida Statewide Intelligent Transportation System Architecture Upon completion of this review, we constructed diagrams that depict the overall project development, planning, and programming processes within FDOT. This includes a high-level diagram that maps these processes from policy, to planning, to program development, and finally to project implementation, and shows how each program area fits into the larger project development and funding process. This allows a “10,000 foot view” of the dynamic and complex relationships between these planning and programming areas, and broadly illuminates areas where reliability may be most efficiently incorporated. In addition to the high-level diagram, diagrams detailing important sub-processes, process flows, program-specific processes, and planning screens were constructed. These provide a better understanding of how projects are prioritized and the extent to which reliability is considered at a much smaller scale, and may better illustrate the specific areas where reliability is under utilized. The intent of the diagram is to document where improvements may be made to the process – in the form of tools, methods, policy or procedures. After work was completed on both the high level and small-scale diagrams, we began work on a capability maturity matrix that captures FDOT’s progress in meeting requirements of the four steps recommended by the SHRP 2 L05 project for incorporating reliability into planning and programming, as well as the specific dimensions of capability associated with each step. These are as follows:
Step 1. Developing and tracking reliability measures. Dimensions of capability include the agency’s use of reliability performance measures to reflect the reliability needs of the system.
Step 2. Addressing reliability in policy statements. Associated dimensions of capability include the degree to which reliability is incorporated into an agency’s vision/mission statements and goals and objectives; the level of planning cooperation/collaboration for reliability; and the organization structure and staffing in place to support reliability.
Step 3. Evaluating reliability needs and/or deficiencies. Dimensions include the agency’s capability to set reliability thresholds, analyze reliability needs/deficiencies, and use of forecasting to identify future deficiencies and related strategies.
Step 4. Incorporating reliability into planning and programming decisions. Dimensions of capability include the degree to which reliability is incorporated into overall agency priority setting, planning and programming decisions, as well as the ability to implement and assess the effectiveness of reliability strategies.
This matrix provides a detailed assessment of how FDOT is performing in regards to specific dimensions of capability associated with each step, and includes an assessment of the Department’s stage of maturity, its strengths and weaknesses in support of the dimension, and recommendations on how FDOT may advance to the next level of maturity.
SHRP2 Travel Time Reliability Analytical Product Implementation Appendix
A-2

- 3 -
3. Evaluation of Planning and Programming Process
Figure 2 provides a high-level depiction of the overall Central Office planning and programming processes. Reading from left to right, the diagram depicts how, on the most broad scale, projects are prioritized through the guiding policies, continuing through both long range and short range planning, and finally how projects are programmed and implemented. The diagram is color-coded by program or process, with purple representing capacity improvement programs; orange modal plans and processes; green preservation programming; red operations and maintenance processes; aqua those plans and processes associated directly with ITS and traffic operations; and blue depicting processes associated with multiple, simultaneous plans or programs. Included are both uni-directional and bi-directional arrows. The directional arrows depict plans or processes that directly inform or give rise to the construction of additional plans or processes. Bi-directional arrows are used when particular processes inform each other simultaneously, or to show plans that are developed in conjunction. The left-most side of the diagram represents the policies that serve as a guide to Central Office programs and plans. These policies are more of a general vision that outline key priorities within the department, and generally do not provide specific recommendations on how these priorities may be implemented. Continuing to the right, the planning stage includes longer-term project priorities and system needs. Many plans and processes in this stage require close coordination between FDOT offices, and between FDOT and local partners and MPOs. This close coordination is represented by a double-sided arrow, which is meant to express that the plans are developed congruently, and project needs and priorities are negotiated and agreed upon by both parties. The program development phase of the overall planning and programming process occurs after the highway and modal plans are completed, and represent the stage in which funding priorities are negotiated and projects are selected. Finally, the last stage is implementation, during which work supporting a project and construction begins. This is also the point in which feedback on the overall project identification and selection process is used to evaluate whether the Department is meeting its overall vision and whether it is necessary to make adjustments to any of the policies guiding the process. Figure 3 depicts the project identification, prioritization, and selection process for SIS capacity improvements. The left-hand side of the diagram depicts the project identification phase, during which needed improvements and system deficiencies are identified by local governments and modal partners, communicated and coordinated through District and Central Office staff, and processed and prioritized using the Strategic Investment Tool (SIT). This provides the basis for the project prioritization phase, during which funding stipulations and projected availability, project timing and phasing, and the geographic distribution of projects are all considered. Finally, as a result of this prioritization, selected projects are incorporated into capacity improvement plans such as the Unfunded Needs Plan, Cost Feasible Plan, and Work Program plans. As we have pointed out on the matrix, the SIT plays a key role in the project selection process, and better incorporating reliability and operational projects into the SIT is one of the most important mechanisms to advance to the next level of maturity.
SHRP2 Travel Time Reliability Analytical Product Implementation Appendix
A-3

- 4 -
The identification and selection process for non-SIS capacity improvement projects is illustrated in Figure 4. In this process, MPOs and local governments in a region are provided discretionary funding based upon a statutory formula giving equal weight to the population and motor fuel taxes collected in the area. During the project identification phase, MPOs provide a prioritization list to local districts, who use it as a basis for their own, district-wide priority list. In the prioritization phases, districts consider the priorities of local partners and MPOs, funding availability, the timing and phasing of projects, and whether a requested project supports or is part of a larger transportation project being developed by the local partner or MPO. All of these factors, in addition to a wide geographic distribution of projects within the district, are used to prioritize projects at the district level. As depicted on the right hand side of this diagram, the result is the non-SIS capacity plans, which are utilized in district work programs. Broadly speaking, the process for non-SIS capacity improvement projects provides an opportunity to incorporate non-SIS highway or arterial capacity improvements that can increase reliability, including new roadways, roadway widening, street connectivity, grade separations, HOV/managed lanes, and multimodal corridors. Two processes specific to Traffic Operations and Intelligent Transportation Systems are illustrated in Figures 5 and 6, which provide some insight into how this Office identifies and determines which operational improvements to fund. Figure 5 provides an overview of the process as a whole, illustrating how various plans and studies (e.g., Regional/State ITS Plans, Corridor Plans, Congestion Management Plans, ITS Feasibility Plans) inform the development of the Regional/State Intelligent Transportation System Architecture (RITSA/SITSA), which identifies short- and long-term ITS project priorities that have been identified to support user needs and selected market packages in the ITS architecture. Projects in the RITSA/SITSA are included in the MPO Long Range Transportation and Cost Feasible Plans, which are programmed at the statewide level through the FDOT 5-Year State Transportation Improvement Plan. Figure 6 provides further detail on the integration of the ITS plan and regional architecture into the development of the MPO Needs Plan and Long Range Transportation Plan. National, statewide, and regional ITS strategic plans provide guidance that local partners use to define their ITS needs, visions, goals, and objectives. As a result of this, each partner agency provides a list of their ITS project priorities, which is next incorporated into the RITSA. The olive-colored boxes are used to represent the public participation process, in which the MPO evaluates each all the ITS projects input by their local partners and assesses needs for the MPO area as a whole. These projects are ultimately used in the creation of the MPO’s Needs and Long Range Transportation plans, during which the MPO and all interested parties are kept up to date on project lists and priorities through drafts of the plans.
4. Assessment of Capability Maturity in Incorporating Reliability into Planning and Programming Processes
Table 1 provides a capability maturity assessment matrix that considers each step in incorporating reliability measures into the planning and programming processes and evaluates
SHRP2 Travel Time Reliability Analytical Product Implementation Appendix
A-4

- 5 -
FDOT’s current status on each of these steps. The table is organized around the four steps recommended by SHRP 2-L05 for incorporating reliability into planning and programming, each of which are listed in the “key step” column, as well as specific dimensions that are necessary to fully meet the objectives of the step. Each dimension of capability is evaluated, and we provide a bullet-point list of what we see as FDOT’s strengths and weaknesses in the particular area in the third and fourth columns of the table. Considering both the strengths and weaknesses, the fifth column provides our assessment of the level of maturity FDOT is currently displaying for each step or dimension. The levels of maturity are defined in Figure 1 below, and range from a level one to four, defined as follows:
Level 1: Ad Hoc. At level 1, an agency has no formal process for incorporating reliability into planning or programming; rather it is performed at an ad-hoc or opportunistic basis.
Level 2: Developing. By level 2, an agency begins to acquire the capabilities to better incorporate reliability, and processes/methods of assessing and tracking reliability have been identified.
Level 3: Specified. In level 3, reliability measures are on the path towards integration. At this stage, processes are documented, and an agency and its partners are in agreement on the specific measures and how they’ll be utilized, but reliability has not yet been fully integrated.
Level 4: Mainstreamed. Full integration of reliability measures occurs at level 4, which features formal programs, partnerships, and incorporation into all levels of policy, strategy, and project planning.
The final column contains our recommendations on how FDOT could advance each step or dimension into the next level of maturity. The recommendations we provide are items that warrant potential consideration, and these will continue to be refined as we develop a more specific approach on how to best incorporate reliability into FDOT planning and programming.
SHRP2 Travel Time Reliability Analytical Product Implementation Appendix
A-5

- 6 -
Figure 1. Levels of Maturity
5. Recommended Actions to Advance to the Next Level of Maturity
Table 1 provides a number of actions that FDOT could consider to more fully integrate reliability into planning and programming. Based on these recommendations and our inventory of the Department’s current planning and programming work flow, we believe the following high priority actions may best accomplish this integration:
Specifically address how FDOT will monitor reliability in key policy statements. While reliability is emphasized in key documents such as the Florida Transportation Plan, neither specific performance measures nor how reliability will be used to assess system performance are addressed. Policy statements are crucial in that they define a strategic direction and communicate transportation priorities. Ensuring that reliability is addressed in these statements is a critical step towards incorporating reliability into planning and programming processes. The pending updates to the FTP and SIS Strategic Plan present an excellent opportunity to address this action, and reliability champions should be collaborating closely with appropriate staff as the plans develop. The ITS Strategic Plan and Program and Resource Plan are additional opportunities.
Establish reliability outreach and education programs through periodic presentations to FDOT at all levels and other local/regional stakeholders. Having an outreach program not only communicates and better educates and promotes a broader understanding of reliability among staff, it also provides an opportunity to engage with stakeholders and facilitate inter-agency collaboration on data collection and analysis. This action could facilitate the integration of reliability in planning products such as modal plans (e.g., Spaceport Master Plan, Seaport Master Plan, etc.) and MPO Long
SHRP2 Travel Time Reliability Analytical Product Implementation Appendix
A-6

- 7 -
Range Transportation Plans. Note that this is already underway as part of the Multimodal Mobility Performance Measures program.
Develop tools to assess and compare the positive impact of addressing system needs through operational vs. capacity improvements. A tool that provides the mechanism needed for trade-off analysis would allow users to assess system needs and understand the benefits that are rendered by addressing deficiencies through operational improvements. The SIT plays a vital role in the project prioritization and selection process, but presently can only evaluate projects listed on existing roadways and is not closely linked to reliability measures. Better incorporating reliability performance measures in the SIT could strongly impact the project prioritization process and help favor projects featuring operational improvements for inclusion in the Cost Feasible Plan and Work Program. A working group comprised of Planning and Operations staff from Central Office could be formed and tasked with reaching out to District Staff and MPOs to ensure they have the tools and expertise necessary to evaluate, prioritize and select operations projects for inclusion in MPO Transportation Improvement Programs (TIPs), project priority lists, and District/Turnpike Work Programs.
Pursue a policy change regarding the use of SIS funds for non-capacity projects and continue to find ways to incorporate operational improvements into broader capacity projects. Statutory obligations currently limit the extent to which operational improvements can be considered in the planning and programming process. SIS funds, which represent 75% of all project funds, are currently defined by statute to be limited to capacity projects. While there are ways of building operational improvements into capacity projects, many of which are being increasingly utilized by the Department, a high-level policy change away from this requirement would be the most effective way to better incorporate reliability into all planning and programming processes. The FDOT Program and Resource Plan is the best place to make a change in how operations improvements are funded, as well as legislative budget requests. A reliability champion should be tasked with bringing the issue before Executive Management to make the change.
Figure 7 depicts where specific actions related to collaboration and tool development could occur to incorporate reliability into the overall Central Office policy, planning, program development, and implementation processes.
SHRP2 Travel Time Reliability Analytical Product Implementation Appendix
A-7

Figure 2: High Level Diagram of Central Office Planning and Programming Processes
SHRP2 Travel Time Reliability Analytical Product Implementation Appendix
A-8

Figure 3: SIS Capacity Improvement Program
SHRP2 Travel Time Reliability Analytical Product Implementation Appendix
A-9

- 10 -
Figure 4: Capacity Improvement Process for Non-SIS Projects
SHRP2 Travel Time Reliability Analytical Product Implementation Appendix
A-10

- 11 -
Figure 5: Traffic Operations/ITS Project Identification and Funding Process
SHRP2 Travel Time Reliability Analytical Product Implementation Appendix
A-11

Figure 6: Integration of ITS into the MPO Planning Process
SHRP2 Travel Time Reliability Analytical Product Implementation Appendix
A-12
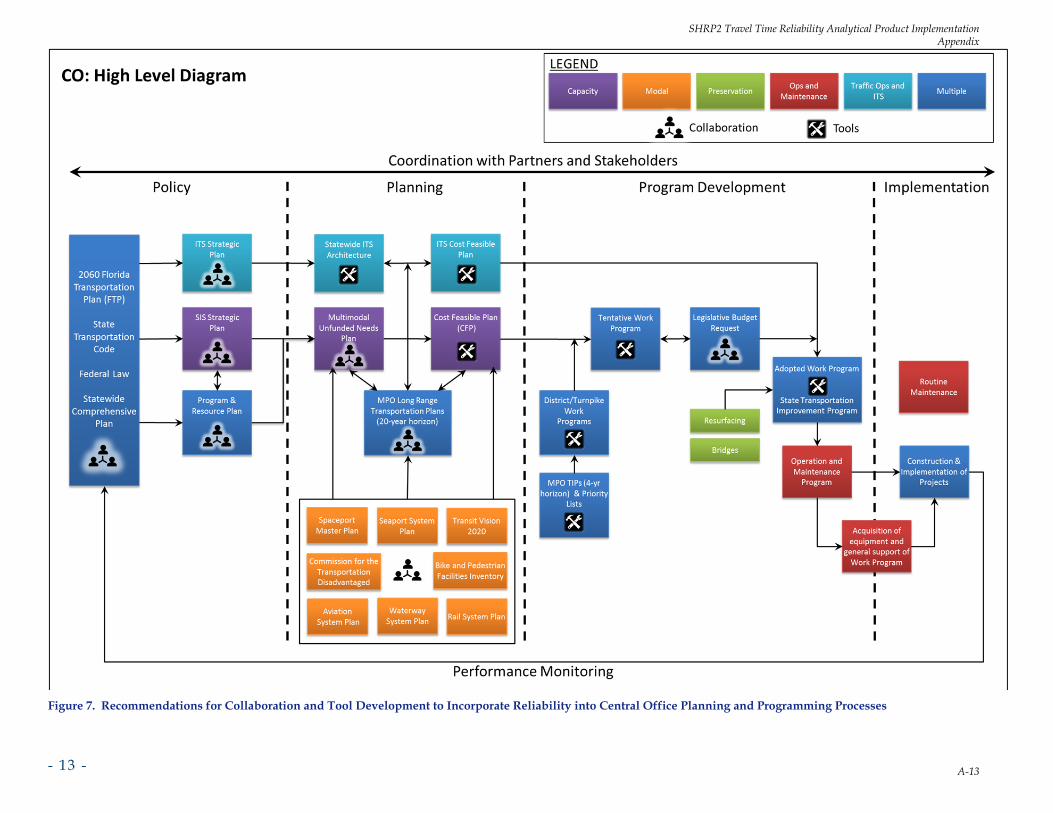
- 13 -
Figure 7. Recommendations for Collaboration and Tool Development to Incorporate Reliability into Central Office Planning and Programming Processes
SHRP2 Travel Time Reliability Analytical Product Implementation Appendix
A-13

Table 1: Assessment of FDOT’s Maturity in Incorporating Reliability into Planning and Programming Processes
Key Step from SHRP 2 L05
Dimension of Capability
Strengths Weaknesses Assessment of Maturity Recommendations to Advance to Next Level of Maturity
Step 1: Developing and tracking travel time reliability measures
Reliability Performance Measurement
Staff are experienced and have many years working with travel time reliability concepts
FDOT has a comprehensive, well developed matrix of mobility measures including people and freight and encompassing all modes
FDOT has developed travel time reliability model post-processing to calculate and predict reliability on all freeways; model considers recurring congestion, incidents, weather, and work zones
Reliability used for evaluating statewide reporting, ITS program, and system level project prioritization
For operations, reliability monitored using ITS instruments, including roadside detectors and vehicle probe data, to measure speed and travel time
Reliability results are reported annually in FTP Scorecard, which documents short-term objectives, strategies, and progress towards 2060 FTP goals/objectives
In large part because of Florida’s geographic diversity, performance measures that report on a statewide level may underestimate or obscure reliability problems
Reliability measures may not take into account differences in user perceptions of system performance. Communication of measures is somewhat confusing – several sources with different measures
No visual methods for reporting on travel time reliability
Level 2: Developing – Output data reported from monitoring and utilized in reliability strategy improvement
Develop a plan for measuring/determining travel time and speed data on designated roadway networks (underway)
Establish data archive – coordinating between planning and operations
Ensure a consistent strategy for communicating performance measures across dashboards, Planning and ITS reporting
Develop travel time reliability performance measures to report in the Performance Dashboard on both a program and network level
Focus on a few key measures that best capture reliability and are meaningful to system users
Add performance description to measure results, such as “good”, “fair”, and “poor”
In addition to reporting reliability statewide, measures should capture areas which are representative of Florida’s diverse transportation network and differences in user needs in order to provide a clear picture of reliability needs in the state
Apply performance measures for development/evaluation/ planning/programming of reliability improvements
Establish Source Book as sole source for TTR measures
SHRP2 Travel Time Reliability Analytical Product Implementation Appendix
A-14

- 15 -
Key Step from SHRP 2 L05
Dimension of Capability
Strengths Weaknesses Assessment of Maturity Recommendations to Advance to Next Level of Maturity
Step 2: Addressing reliability in policy statements
Reliability Goals and Objectives
Reliability emphasized within the Florida Transportation Plan at multiple levels, including its vision, goals, objectives, and strategies
Long term agency objectives in regards to reliability are broadly defined. For example, one of the long range objectives included in the 2060 Florida Transportation Plan (FTP) is to “increase the efficiency and reliability of travel for people and freight”
Operational improvements are emphasized in 2060 FTP; system maintenance and operations one of the goals of the FTP
2060 FTP includes the following implementation strategy: “emphasize transportation systems management and operations strategies to optimize performance of existing facilities”
While reliability is recognized in key policy statements, neither specific performance measures nor how reliability will be used to assess system performance are addressed
While reliability performance measures are well-defined by the Department, these measures are not specifically reflected in policy language
Policy statements and implementation strategies regarding reliability are generalized and do not consider factors specific to the state of Florida or the different needs of regions within Florida
Level 2: Developing – Reliability and related objectives understood/ incorporated as agency policy objective
Specifically address how FDOT will monitor reliability in key policy statements
Develop Florida-specific “causes of congestion” pie chart tool and models
Incorporate specific performance measures in the pending updates to the FTP and SIS Strategic Plan; outline how the preferred measures will be tracked to assess whether the transportation system is reliable
Tailor language regarding performance measures in the FTP and SIS Strategic Plan to address the causes of poor reliability and reliability issues specific to Florida
Address the specific freight/people reliability concerns of regional partners/stakeholders during the update cycle of the FTP and SIS Strategic Plan by creating a focus group consisting of individuals from partner agencies with reliability expertise
Planning Cooperation/ Collaboration for Reliability
The Florida Transportation Plan and SIS Strategic Plan emphasize the importance of regional and statewide coordination between FDOT and other state agencies, local governments, and stakeholders
No policies currently address how the reliability needs of a particular partner/stakeholder will impact planning or budgeting of projected system needs
Level 1: Ad Hoc – No formal planning or programming for reliability
Establish reliability outreach and education program through periodic presentations to FDOT at all levels
Create policy goals that outline how FDOT and other key stakeholders will coordinate and gain consensus on preferred key performance measures which adequately address both local and statewide needs
Define how to measure reliability performance to address the specific needs of local/regional partners and stakeholders
Clearly define, document, and
SHRP2 Travel Time Reliability Analytical Product Implementation Appendix
A-15

- 16 -
Key Step from SHRP 2 L05
Dimension of Capability
Strengths Weaknesses Assessment of Maturity Recommendations to Advance to Next Level of Maturity
communicate preferred measures of system performance and the importance of reliability both internally and externally
In cooperation/ coordination with MPOs and planning offices, identify ongoing planning-related activities as framework for integration of reliability (local, regional, statewide)
Establish reliability improvement strategies as viable alternative in PD&E studies
Organizational Structure and Staffing for Reliability
Strong technical capabilities among Central Office staff
No accountability mechanisms (dashboard) for reliability
Lack of District champions
Level 2: Developing – Needed staff capabilities for planning identified and specified
Identify logical functional coordination and accountability relationships
Train key Central Office and District staff on using the SIT for analyzing operational improvements
Investigate opportunities to integrate key Central Office and District reliability staff into the project selection process
Create a reliability training program/training opportunities
Assign a reliability champion in each District
Step 3: Evaluating reliability needs and/or deficiencies
Reliability Needs/ Deficiency Analysis and Forecasting
FDOT is currently in the process of linking TTR measures into the Strategic Investment Tool (SIT), which will allow testing of projects support system reliability and the degree to which they support the goals and objectives of the 2060 FTP
The FTP scorecard clearly illustrates mobility and connectivity measures in a manner which is easily accessible
The Map-21 Performance Report
The FTP Scorecard includes neither the travel time or planning index, the two performance measures officially used FDOT’s definition of travel time reliability
While reported, currently reliability performance is not tied to a way to translate deficiency into tangible need
No tool currently exists that evaluates the potential impact of operational versus capacity improvements; the SIT may develop this ability in time
The SIT can only evaluate and
Level 2: Developing – Rules of thumb used to identify remediable reliability-related deficiencies
Develop tool to assess and compare the positive impact of addressing system needs through operational vs. capacity improvements
Integrate tools that analyze operational improvements into all aspects of the planning and programming process
Develop and apply analyses and related mechanisms needed for trade-off analysis (modes, capacity/ operations, demand management)
Develop approach for benefit/cost or
SHRP2 Travel Time Reliability Analytical Product Implementation Appendix
A-16

- 17 -
Key Step from SHRP 2 L05
Dimension of Capability
Strengths Weaknesses Assessment of Maturity Recommendations to Advance to Next Level of Maturity
assesses and reports upon annual reliability performance
FDOT is currently exploring ways to set performance targets that will be used to report upon annual system performance
When TTR measures are fully integrated into the SIT, projects can be weighted to provide greater weight to the Maintenance and Operations goal of the FTP
prioritize projects located on existing roadways
There is not a clear connection to the causes of unreliability
net percent value assessment and adopt on all projects
Tie the results of the annual reliability report into specific areas of the planning and programming process; ensure annual results have a specific consequence on project funding and prioritization
Amend the FTP scorecard to use officially adopted performance measures, consistent with the Map 21 Performance Report
Instead of a simple report of system performance, set annual reliability performance targets
Step 4: Incorporating reliability into planning and programming decisions
Inform agency investment decisions
There are significant indicators that system reliability is receiving increasing emphasis as a means to improve performance in a more economical manner (e.g. the incorporation of TTR into the SIT)
The Office of Policy Planning is developing a benefit/cost tool which, when complete, provide a means to calculate return on investment for projects
The versatility of the SIT and the ability to tweak the weight given to certain factors allows for the possibility to prioritize projects supporting reliability
SIS funds, which account for approximately 75% of all project funding, are designated for capacity improvements only and cover what?
FDOT does not have a means to directly compare the operational and capacity improvements and their impact on reliability given a fixed budget
FDOT has not fully incorporated reliability performance measures and operations investments into a benefit/cost analysis tool
Operational improvements will likely prove difficult to incorporate into the current methodological framework of the B/C tool
FDOT currently lacks a specific mechanism to assess how much an operations budget would contribute to reliability
Level 1: Ad Hoc – Reliability improvements committed on opportunistic basis
Pursue a policy change regarding the use of SIS funds for non-capacity projects and continue to find ways to incorporate operational improvements into broader capacity projects
Tweak language of certain operational projects to fall under FDOT definition of capacity improvements
Investigate methods for diverting “off the top” funding from other program areas into operational improvements
Continue to explore mechanisms for applying reliability into the SIT
Incorporate PD&E processes for incorporating reliability
Identify and change policies or statutory obligations regarding SIS project and program funding
Work closely with developers of B/C tool and advocate the importance of operational investments; provide support and guidance on how operations can be integrated into the
SHRP2 Travel Time Reliability Analytical Product Implementation Appendix
A-17

- 18 -
Key Step from SHRP 2 L05
Dimension of Capability
Strengths Weaknesses Assessment of Maturity Recommendations to Advance to Next Level of Maturity
tool
Advocate use of Bluetooth or other real time data collection methods as a means to estimate the cost of an operations program budget and the degree to which program would improve system performance
Reliability Implementation and Feedback
FDOT has no means to track how project investment has impacted reliability performance
Level 2: Developing – Performance reviewed on regular basis and applications adjusted
Identify processes and resources required to achieve appropriate level of effectiveness for state of the practice for each reliability strategy
Investigate methods to chart system performance and use to better model how operational improvements can impact reliability performance
SHRP2 Travel Time Reliability Analytical Product Implementation Appendix
A-18

SHRP2 Travel Time Reliability Analytical Product Implementation Appendix
B-1
B. C11 - Analysis and Results Description Reliability Analysis
Modeling Structure
The C11 Post-Processor is developed as a series of scripts written in the Statistical Analysis System (SAS). It is operated by Cambridge Systematics (CS) staff. It is hoped that under next year’s FDOT work program in the mobility area will include a task to convert the C11 Post-Processor to “user grade” software.
For input, the scripts read the loaded network file as well as a list of safety improvements. The analysis is conducted at the corridor level, using the 192 corridors present in the TBRPM.
Performance Measures
Reliability
– Planning Time Index (95th percentile travel time/free flow travel time)
– Reliability Index (80th percentile travel time/free flow travel time)
Congestion
– Mean Travel Time Index (mean ravel time/free flow travel time)
Methodology
The method in the original C11 tool was adapted as follows.
1. Assign Free Flow Speed (FFS)
o Freeways: 65 mph
o Arterials: 45 mph
o Collectors: 40 mph
o Ramps and local: 35 mph
2. Calculate Travel Time per Unit Distance (travel rate) for the Current andForecast Years
t = {(1+(0.1225*(v/c)8))}/FFS, for v/c <= 1.40
Where: t = travel rate (hours per mile)
v = volume (from loaded network file)
c = capacity (from loaded network file)

SHRP2 Travel Time Reliability Analytical Product Implementation Appendix
B-2
This volume-delay function is different than the one used in the TBRPM. However, it produces more reasonable estimates of speeds.1
3. Compute the Recurring Delay in Hours per Mile
RecurringDelayRate = t – (1/FFS)
4. Compute the Delay Due to Incidents (IncidentDelayRate) in Hours per Mile. The lookup tables from the IDAS User Manual2 are used to calculate incident delay. This requires the v/c ratio, number of lanes, and length and type of the period being studied, which is set at 1-hour. (For rural two-lane highways, use number of lanes = 2.) This is the base incident delay.
If incident management programs have been added as a strategy or if a strategy lowers the incident rate (frequency of occurrence), then the “after” delay is calculated as follows:
Da = Du * (1-Rf) * (1-Rd)2
Where: Da = Adjusted delay (hours of delay per mile).
Du = Unadjusted (base)delay (hours of delay per mile, from the incident rate tables).
Rf = Reduction in incident frequency expressed as a fraction (where Rf = 0 means no reduction, and Rf = 0.30 means a 30 percent reduction in incident frequency).
Rd = Reduction in incident duration expressed as a fraction (where Rd = 0 means no reduction, and Rd = .30 means a 30-percent reduction in incident duration).
Changes in incident frequency are most commonly affected by strategies that decrease crash rates. However, crashes are only about 20 percent of total incidents. Therefore, a 30 percent reduction in crash rates alone would reduce overall incident rates by .30 x .20 = .06.
5. Compute the Overall Mean Travel Time Index (TTIm). which includes the effects of recurring and incident delay:
TTIm = 1 + FFS * (RecurringDelayRate + IncidentDelayRate)
Where: IncidentDelayRate is either Du or Da
1 Cambridge Systematics and JHK, Multimodal Corridor and Capacity Analysis Manual,
NCHRP Report 399, Transportation Research Board, 1998.
2 IDAS User’s Manual, Appendix B, Tables B.2.14 – B.2.18, http://idas.camsys.com/documentation.htm
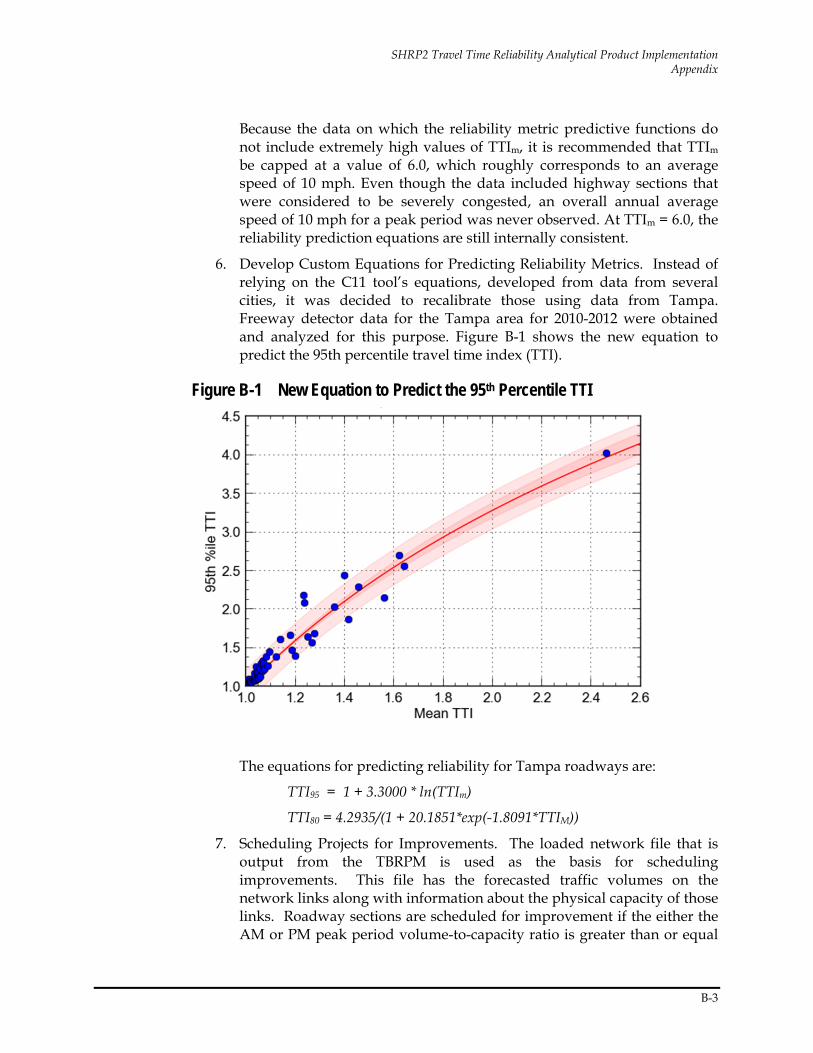
SHRP2 Travel Time Reliability Analytical Product Implementation Appendix
B-3
Because the data on which the reliability metric predictive functions do not include extremely high values of TTIm, it is recommended that TTIm be capped at a value of 6.0, which roughly corresponds to an average speed of 10 mph. Even though the data included highway sections that were considered to be severely congested, an overall annual average speed of 10 mph for a peak period was never observed. At TTIm = 6.0, the reliability prediction equations are still internally consistent.
6. Develop Custom Equations for Predicting Reliability Metrics. Instead of relying on the C11 tool’s equations, developed from data from several cities, it was decided to recalibrate those using data from Tampa. Freeway detector data for the Tampa area for 2010-2012 were obtained and analyzed for this purpose. Figure B-1 shows the new equation to predict the 95th percentile travel time index (TTI).
Figure B-1 New Equation to Predict the 95th Percentile TTI
The equations for predicting reliability for Tampa roadways are:
TTI95 = 1 + 3.3000 * ln(TTIm)
TTI80 = 4.2935/(1 + 20.1851*exp(-1.8091*TTIM))
7. Scheduling Projects for Improvements. The loaded network file that is output from the TBRPM is used as the basis for scheduling improvements. This file has the forecasted traffic volumes on the network links along with information about the physical capacity of those links. Roadway sections are scheduled for improvement if the either the AM or PM peak period volume-to-capacity ratio is greater than or equal
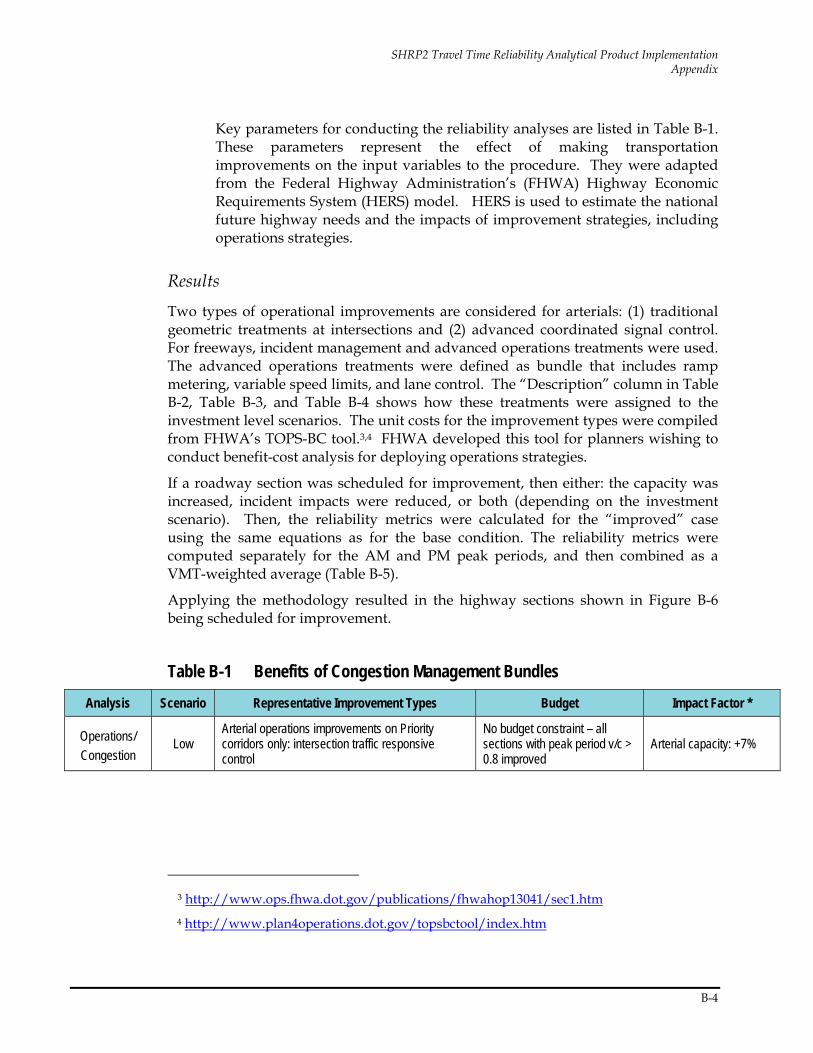
SHRP2 Travel Time Reliability Analytical Product Implementation Appendix
B-4
Key parameters for conducting the reliability analyses are listed in Table B-1. These parameters represent the effect of making transportation improvements on the input variables to the procedure. They were adapted from the Federal Highway Administration’s (FHWA) Highway Economic Requirements System (HERS) model. HERS is used to estimate the national future highway needs and the impacts of improvement strategies, including operations strategies.
Results
Two types of operational improvements are considered for arterials: (1) traditional geometric treatments at intersections and (2) advanced coordinated signal control. For freeways, incident management and advanced operations treatments were used. The advanced operations treatments were defined as bundle that includes ramp metering, variable speed limits, and lane control. The “Description” column in Table B-2, Table B-3, and Table B-4 shows how these treatments were assigned to the investment level scenarios. The unit costs for the improvement types were compiled from FHWA’s TOPS-BC tool.3,4 FHWA developed this tool for planners wishing to conduct benefit-cost analysis for deploying operations strategies.
If a roadway section was scheduled for improvement, then either: the capacity was increased, incident impacts were reduced, or both (depending on the investment scenario). Then, the reliability metrics were calculated for the “improved” case using the same equations as for the base condition. The reliability metrics were computed separately for the AM and PM peak periods, and then combined as a VMT-weighted average (Table B-5).
Applying the methodology resulted in the highway sections shown in Figure B-6 being scheduled for improvement.
Table B-1 Benefits of Congestion Management Bundles Analysis Scenario Representative Improvement Types Budget Impact Factor *
Operations/
Congestion Low
Arterial operations improvements on Priority corridors only: intersection traffic responsive control
No budget constraint – all sections with peak period v/c > 0.8 improved
Arterial capacity: +7%
3 http://www.ops.fhwa.dot.gov/publications/fhwahop13041/sec1.htm
4 http://www.plan4operations.dot.gov/topsbctool/index.htm
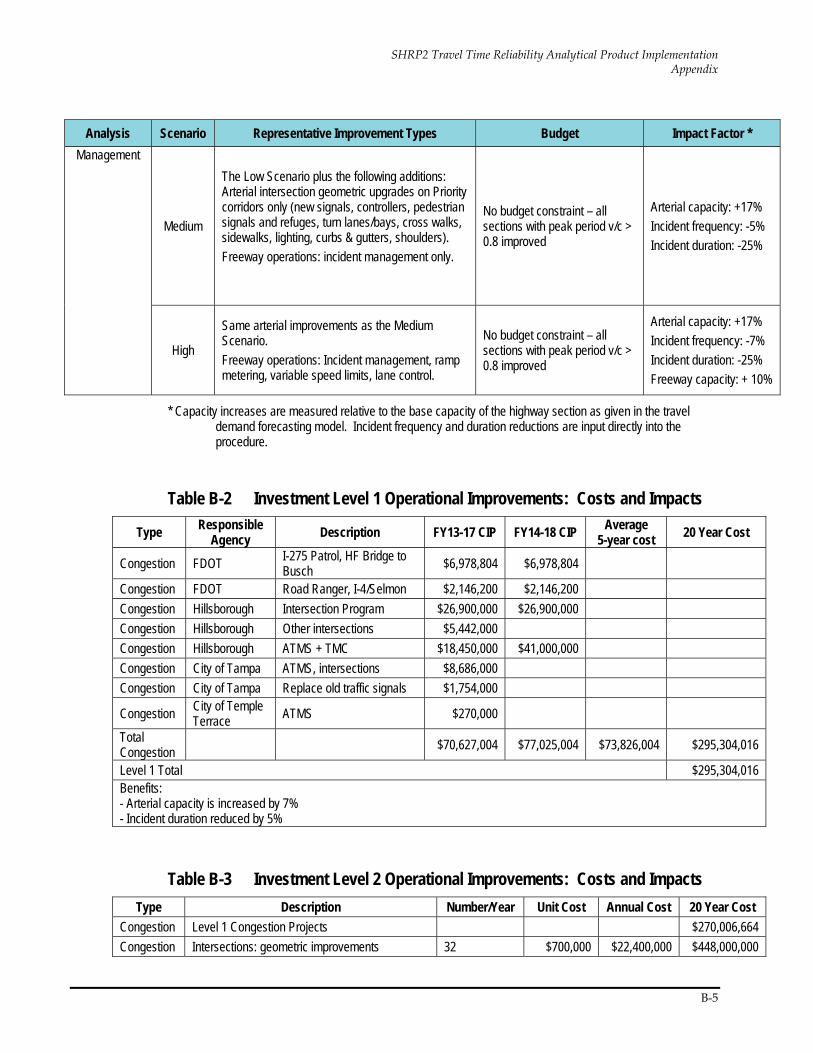
SHRP2 Travel Time Reliability Analytical Product Implementation Appendix
B-5
Analysis Scenario Representative Improvement Types Budget Impact Factor * Management
Medium
The Low Scenario plus the following additions: Arterial intersection geometric upgrades on Priority corridors only (new signals, controllers, pedestrian signals and refuges, turn lanes/bays, cross walks, sidewalks, lighting, curbs & gutters, shoulders).
Freeway operations: incident management only.
No budget constraint – all sections with peak period v/c > 0.8 improved
Arterial capacity: +17%
Incident frequency: -5%
Incident duration: -25%
High
Same arterial improvements as the Medium Scenario.
Freeway operations: Incident management, ramp metering, variable speed limits, lane control.
No budget constraint – all sections with peak period v/c > 0.8 improved
Arterial capacity: +17%
Incident frequency: -7%
Incident duration: -25%
Freeway capacity: + 10%
* Capacity increases are measured relative to the base capacity of the highway section as given in the travel demand forecasting model. Incident frequency and duration reductions are input directly into the procedure.
Table B-2 Investment Level 1 Operational Improvements: Costs and Impacts
Type Responsible Agency Description FY13-17 CIP FY14-18 CIP Average
5-year cost 20 Year Cost
Congestion FDOT I-275 Patrol, HF Bridge to Busch $6,978,804 $6,978,804
Congestion FDOT Road Ranger, I-4/Selmon $2,146,200 $2,146,200
Congestion Hillsborough Intersection Program $26,900,000 $26,900,000 Congestion Hillsborough Other intersections $5,442,000
Congestion Hillsborough ATMS + TMC $18,450,000 $41,000,000
Congestion City of Tampa ATMS, intersections $8,686,000 Congestion City of Tampa Replace old traffic signals $1,754,000
Congestion
City of Temple Terrace ATMS $270,000
Total Congestion
$70,627,004 $77,025,004 $73,826,004 $295,304,016
Level 1 Total $295,304,016 Benefits: - Arterial capacity is increased by 7% - Incident duration reduced by 5%
Table B-3 Investment Level 2 Operational Improvements: Costs and Impacts Type Description Number/Year Unit Cost Annual Cost 20 Year Cost
Congestion Level 1 Congestion Projects
$270,006,664
Congestion Intersections: geometric improvements 32 $700,000 $22,400,000 $448,000,000

SHRP2 Travel Time Reliability Analytical Product Implementation Appendix
B-6
Congestion Intersections: ATMS 32 $70,000 $2,240,000 $44,800,000
Congestion TMC Infrastructure one time cost $4,000,000
$4,000,000
Congestion ATMS Infrastructure & labor one time cost $5,400,000
$5,400,000
Congestion Freeway operations: Incident Management only 6 $260,000 $1,560,000 $31,200,000
Congestion Freeway operations: Incident Management only INFRASTRUCTURE
$3,000,000
$3,000,000
Level 2 Total $806,406,664 Benefits: - Arterial capacity is increased by 17% - Incident frequency is reduced by 5% - Incident duration is reduced by 25%
Table B-4 Investment Level 3 Operational Improvements: Costs and Impacts
Type Description Number/Year Unit Cost Annual Cost 20 Year Cost
Level 1 Congestion Projects
$270,006,664
Intersections: geometric improvements 32 $700,000 $22,400,000 $448,000,000
Intersections: ATMS 32 $70,000 $2,240,000 $44,800,000
Congestion TMC Infrastructure one time cost $4,000,000
$4,000,000
Congestion ATMS Infrastructure & labor one time cost $5,400,000
$5,400,000
Congestion Freeway operations: Infrastructure & Labor one time cost $4,600,000 $4,600,000
Congestion Freeway operations: Incident Management, ramp metering, variable speed limits, lane control
6 $1,500,000 $9,000,000 $180,000,000
Level 3 Total $956,806,664 Benefits: - Arterial capacity is increased by 17% - Incident frequency is reduced by 7% - Incident duration is reduced by 25% - Freeway capacity is increased by 10%
Table B-5 Reliability Analysis Results
Highway Type Mobility Measure 2040 Scenario Scenario
Low Medium High
Freeways
Average TTI Base 1.580 1.580 1.580
With Improvements 1.580 1.418 1.308
80th %ile TTI Base 1.891 1.891 1.891
With Improvements 1.891 1.670 1.504
Planning Time Index5 Base 2.206 2.206 2.206
5 The Planning Time Index is the 95th percentile travel time index

SHRP2 Travel Time Reliability Analytical Product Implementation Appendix
B-7
Highway Type Mobility Measure 2040 Scenario Scenario
Low Medium High With Improvements 2.206 1.944 1.744
Centerline Miles Improved 0 120 120
Arterials
Average TTI Base 1.717 1.717 1.717
With Improvements 1.602 1.487 1.487
80th %ile TTI Base 2.065 2.065 2.065
With Improvements 1.930 1.788 1.788
Planning Time Index Base 2.431 2.431 2.431
With Improvements 2.254 2.074 2.074
Centerline Miles Improved 425 425 425
Intersections Improved 650 650 650
Table B-6 Highway Sections With Congestion Management Improvements FREEWAYS
Corridor Corridor Name From To Improved Miles
(Nonpriority Corridors) N/A N/A 4.35 10 I-4 (Hillsborough Co) I-275 I-75 8.40 11 I-4 (Hillsborough Co) I-75 Hillsborough / Polk County Line 16.48
13 SR 60 / Courtney Campbell Causeway (Hillsborough Co)
Pinellas / Hillsborough Co Line Eisenhower Blvd / Veterans Expwy / SR 589
5.87
14 SR 60 / Kennedy Blvd / Memorial Hwy (Hillsborough Co)
Kennedy Blvd / SR 60 Courtney Campbell Causeway 0.58
25 US 92 / Gandy Blvd (Hillsborough Co) Pinellas / Hillsborough Co Line Dale Mabry Hwy 2.45 48 I-275 (Hillsborough Co) Pinellas / Hillsborough Co Line I-4 8.62 49 I-275 (Hillsborough Co) I-4 Bearss 8.03 50 I-275 (Hillsborough Co) Bearss I-75 N 6.15 51 I-75 (Hillsborough Co) Manatee / Hillsborough Co Line Big Bend Rd 10.91
52 I-75 (Hillsborough Co) Big Bend Rd Leroy Selmon Crosstown Expwy / SR 618 8.75
53 I-75 (Hillsborough Co) Leroy Selmon Crosstown Expwy / SR 618
I-4 3.76
55 I-75 (Hillsborough Co) I-4 I-275 7.44
88 Leroy Selmon Crosstown Expwy (Hillsborough Co) Gandy Blvd Willow Ave 2.01
89 Leroy Selmon Crosstown Expwy (Hillsborough Co) Willow Ave I-75 7.14
93 Veteran Expwy (Hillsborough Co) Hillsborough Ave Veterans Expy Spur 6.05 94 N Suncoast Expwy (Hillsborough) Veterans Expy / SR 589 Lutz Lake Fern 2.94
125 Crosstown / I-4 Connector (Hillsborough Co)
Leroy Selmon Crosstown Expwy / SR 618 I-4
126 Brandon Prkwy (Hillsborough Co) I-75 CR 676 / Lumsden Rd 0.84 127 Veterans Expy Spur Veterans Expy Spur Dale Mabry Hwy N
129 N Suncoast Expwy (Pasco) Lutz Lake Fern Hernando/Pasco CL 1.12 134 Leroy Selmon REL I-75 Downtown 7.55

SHRP2 Travel Time Reliability Analytical Product Implementation Appendix
B-8
FREEWAYS
Corridor Corridor Name From To Improved Miles
505 Hillsborough Ave / SR 580 Dale Mabry Hwy / SR 597 US 301 0.24 521 Eisenhower Blvd Courtney Campbell Cswy Hillsborough Ave / SR 580 0.14 564 Hillsborough Ave / SR 580 US 301 Thonotosassa Rd 0.27
Total Freeways 120.09
ARTERIALS (Priority Corridors)
Corridor Corridor Name From To Improved Miles
Improved Intersections
(Nonpriority Corridors) N/A N/A 139.19 210 1 US 41 (Hillsborough Co) Manatee / Hillsborough Co
Line Big Bend Rd 11.20 17
2 US 41 (Hillsborough Co) Big Bend Rd Selmon Crosstown Expwy 11.11 17 3 US 41 (Hillsborough Co) Busch Blvd Bearss 3.79 6 4 US 41 (Hillsborough Co) Bearss Hillsborough / Pasco Co
Line 5.95 9
14 SR 60 / Kennedy Blvd / Memorial Hwy (Hillsborough Co)
Kennedy Blvd / SR 60 Courtney Campbell Causeway
0.24 1
15 SR 60 / Adamo Dr (Hillsborough Co)
Channelside Dr 50th St 2.79 4
16 SR 60 / Adamo Dr (Hillsborough Co)
50th St US 301 2.95 4
17 SR 60 / Adamo Dr (Hillsborough Co)
US 301 I-75 1.37 2
18 SR 60 (Hillsborough Co) I-75 Turkey Creek Rd 7.57 11 25 US 92 / Gandy Blvd (Hillsborough
Co) Pinellas / Hillsborough Co Line
Dale Mabry Hwy 1.34 2
26 US 92 / SR 574 / MLK Jr Blvd (Hillsborough Co)
I-275 I-4 4.05 6
27 US 92 / SR 574 / MLK Jr Blvd (Hillsborough Co)
I-4 I-75 3.38 5
28 US 92 / SR 574 / MLK Jr Blvd (Hillsborough Co)
I-75 Alexander St 9.09 14
29 US 92 (Hillsborough Co) Alexander St Hillsborough / Polk Co Line 1.54 2 44 SR 580 / Hillsborough Ave
(Hillsborough Co) Pinellas / Hillsborough Co Line
Memorial Hwy 4.83 7
45 SR 580 / Hillsborough Ave (Hillsborough Co)
Memorial Hwy Dale Mabry Hwy 4.67 7
58 Dale Mabry Hwy / US 92 (Hillsborough Co)
Interbay Blvd Kennedy Blvd 4.14 6
59 Dale Mabry Hwy / US 92 (Hillsborough Co)
Kennedy Blvd Hillsborough Ave 3.13 5
60 Dale Mabry Hwy (Hillsborough Co)
Hillsborough Ave US 41 12.15 18
61 Fowler Ave (Hillsborough Co) I-275 I-75 6.69 10 62 US 301 (Hillsborough Co) Manatee / Hillsborough Co
Line Big Bend Road 4.31 7
63 US 301 (Hillsborough Co) Big Bend Road Leroy Selmon Crosstown Expwy / SR 618
9.97 15
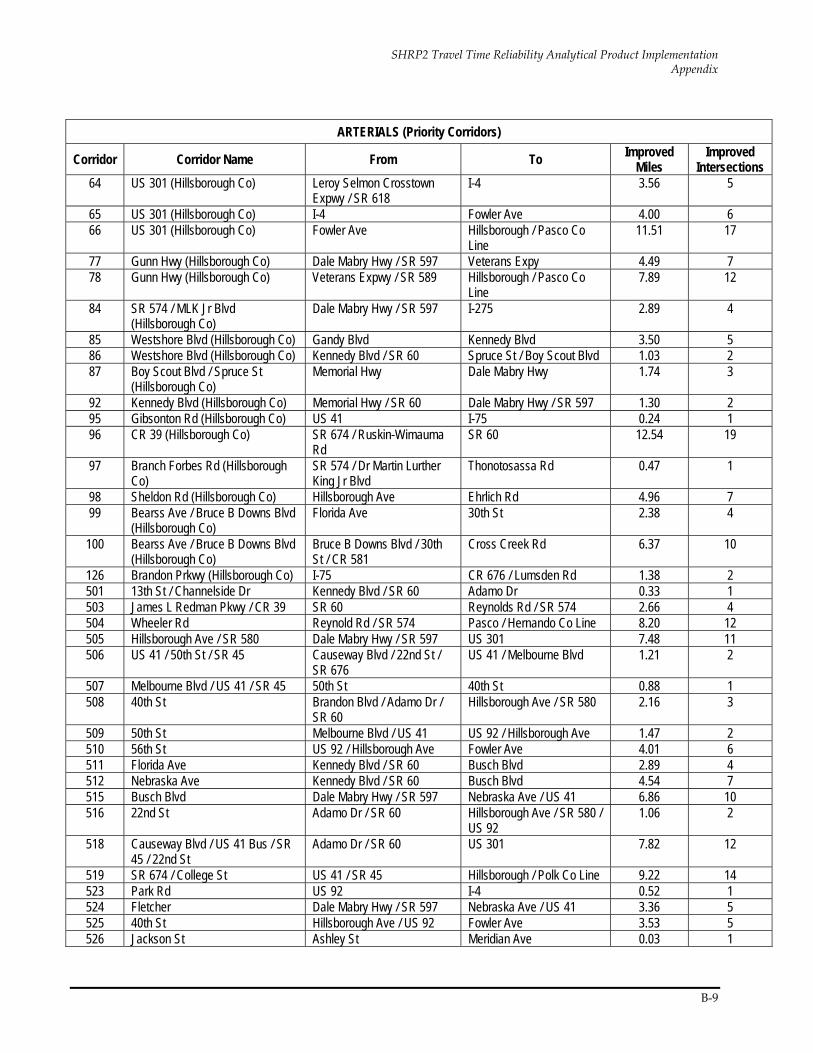
SHRP2 Travel Time Reliability Analytical Product Implementation Appendix
B-9
ARTERIALS (Priority Corridors)
Corridor Corridor Name From To Improved Miles
Improved Intersections
64 US 301 (Hillsborough Co) Leroy Selmon Crosstown Expwy / SR 618
I-4 3.56 5
65 US 301 (Hillsborough Co) I-4 Fowler Ave 4.00 6 66 US 301 (Hillsborough Co) Fowler Ave Hillsborough / Pasco Co
Line 11.51 17
77 Gunn Hwy (Hillsborough Co) Dale Mabry Hwy / SR 597 Veterans Expy 4.49 7 78 Gunn Hwy (Hillsborough Co) Veterans Expwy / SR 589 Hillsborough / Pasco Co
Line 7.89 12
84 SR 574 / MLK Jr Blvd (Hillsborough Co)
Dale Mabry Hwy / SR 597 I-275 2.89 4
85 Westshore Blvd (Hillsborough Co) Gandy Blvd Kennedy Blvd 3.50 5 86 Westshore Blvd (Hillsborough Co) Kennedy Blvd / SR 60 Spruce St / Boy Scout Blvd 1.03 2 87 Boy Scout Blvd / Spruce St
(Hillsborough Co) Memorial Hwy Dale Mabry Hwy 1.74 3
92 Kennedy Blvd (Hillsborough Co) Memorial Hwy / SR 60 Dale Mabry Hwy / SR 597 1.30 2 95 Gibsonton Rd (Hillsborough Co) US 41 I-75 0.24 1 96 CR 39 (Hillsborough Co) SR 674 / Ruskin-Wimauma
Rd SR 60 12.54 19
97 Branch Forbes Rd (Hillsborough Co)
SR 574 / Dr Martin Lurther King Jr Blvd
Thonotosassa Rd 0.47 1
98 Sheldon Rd (Hillsborough Co) Hillsborough Ave Ehrlich Rd 4.96 7 99 Bearss Ave / Bruce B Downs Blvd
(Hillsborough Co) Florida Ave 30th St 2.38 4
100 Bearss Ave / Bruce B Downs Blvd (Hillsborough Co)
Bruce B Downs Blvd / 30th St / CR 581
Cross Creek Rd 6.37 10
126 Brandon Prkwy (Hillsborough Co) I-75 CR 676 / Lumsden Rd 1.38 2 501 13th St / Channelside Dr Kennedy Blvd / SR 60 Adamo Dr 0.33 1 503 James L Redman Pkwy / CR 39 SR 60 Reynolds Rd / SR 574 2.66 4 504 Wheeler Rd Reynold Rd / SR 574 Pasco / Hernando Co Line 8.20 12 505 Hillsborough Ave / SR 580 Dale Mabry Hwy / SR 597 US 301 7.48 11 506 US 41 / 50th St / SR 45 Causeway Blvd / 22nd St /
SR 676 US 41 / Melbourne Blvd 1.21 2
507 Melbourne Blvd / US 41 / SR 45 50th St 40th St 0.88 1 508 40th St Brandon Blvd / Adamo Dr /
SR 60 Hillsborough Ave / SR 580 2.16 3
509 50th St Melbourne Blvd / US 41 US 92 / Hillsborough Ave 1.47 2 510 56th St US 92 / Hillsborough Ave Fowler Ave 4.01 6 511 Florida Ave Kennedy Blvd / SR 60 Busch Blvd 2.89 4 512 Nebraska Ave Kennedy Blvd / SR 60 Busch Blvd 4.54 7 515 Busch Blvd Dale Mabry Hwy / SR 597 Nebraska Ave / US 41 6.86 10 516 22nd St Adamo Dr / SR 60 Hillsborough Ave / SR 580 /
US 92 1.06 2
518 Causeway Blvd / US 41 Bus / SR 45 / 22nd St
Adamo Dr / SR 60 US 301 7.82 12
519 SR 674 / College St US 41 / SR 45 Hillsborough / Polk Co Line 9.22 14 523 Park Rd US 92 I-4 0.52 1 524 Fletcher Dale Mabry Hwy / SR 597 Nebraska Ave / US 41 3.36 5 525 40th St Hillsborough Ave / US 92 Fowler Ave 3.53 5 526 Jackson St Ashley St Meridian Ave 0.03 1

SHRP2 Travel Time Reliability Analytical Product Implementation Appendix
B-10
ARTERIALS (Priority Corridors)
Corridor Corridor Name From To Improved Miles
Improved Intersections
528 Lithia Pinecrest Rd Bloomingdale Ave Brandon Blvd / Adamo Dr / SR 60
3.81 6
530 Armenia Ave Swann Ave Busch Blvd 4.11 6 557 Kennedy Blvd / SR 60 Dale Mabry 13th St / Channelside Dr 2.80 4 564 Hillsborough Ave / SR 580 US 301 Thonotosassa Rd 10.00 15 565 Florida Ave Busch Blvd Nebraska Ave / US 41 5.19 8 566 Fletcher Nebraska Ave / US 41 I-75 4.05 6
Total Arterials 423.88 640
Safety Analysis
Performance Measures
Total crashes reduced
Fatal crashes reduced
Bicycle/pedestrian crashes reduced
Methodology
The basis of the crash prediction methods is the Highway Safety Manual (HSM), a comprehensive set of procedures for analyzing and predicting safety on highway facilities.6 For safety, crashes by daily time period are not computed – the entire day is used. It is based on producing an expected number of crashes using a statistical procedure known as the Empirical Bayes (EB) method where total crashes for a facility are a weighted combination of actual crashes and predicted crashes from a safety performance function (SPF):
Expected Crashes = (w * PredictedCrashes) + {(1-w) * ObservedCrashes}
Where: w is a weighting factor based on the goodness-of-fit of the SPF.
This method is used to control for the high variability in the number of annual crashes on short and/or low volume segments.
The MPO had developed a dataset of crashes linked to the TBRPM network for computing observed crashes in the above equation. However, these included only fatal and incapacitating injuries; minor injuries and property damage only (PDO) crashes are excluded.
6 http://www.highwaysafetymanual.org/

SHRP2 Travel Time Reliability Analytical Product Implementation Appendix
B-11
The first step was to estimate the crashes for these other severity levels. NHTSA’s General Estimate System (GES) for 2012 was analyzed to develop factors for urban crashes.7 Analysis of GES data revealed that 70 percent of urban crashes were PDO, 25 percent of crashes were non-incapacitating or possible injury, and 3 percent were fatal or incapacitating injury. (Two percent had unknown severity.) Therefore, the factors are:
(non-incapacitating + possible injury crashes) = (25/3) * (fatal +incapacitating)
PDO crashes = (75/3) * (fatal +incapacitating)
The next step involved adapting the HSM’s SPFs for the predicted crashes term in the above equation. The SPFs are of the general form:
exp[a + b × ln(AADT) + ln(L)]
Where: L = length of roadway segment (miles)
a, b = regression coefficients that vary with general design parameters
The SPFs that were used are as follows.
Arterials and Collectors
Segment, multiple vehicle, non-driveway
Segment single vehicle, non-driveway
Segment, multiple vehicle, driveway
Intersection, multiple vehicle
Intersection, single vehicle
Entire section, pedestrian
Entire section, bicycle
After total crashes are obtained using the EB formula, a base year crash rate is computed. Future crashes (2040) are calculated by multiplying the future AADT by the base crash rate. Crashes per mile are also calculated.
Once the base number of crashes is established for 2040, the Post-Processor uses the following steps to identify safety-deficient highway sections for a given investment level. Three investment levels are used; Table A-6 defines the investment levels. Only arterials and collectors within the urban area were considered in the safety analysis; freeways and local streets were excluded.
Priority corridors are scheduled first, followed by the remaining arterials, then collectors. The priority corridors were previously defined by MPO and represent sections of major highways in Hillsborough County.
7 http://www.nhtsa.gov/NASS

SHRP2 Travel Time Reliability Analytical Product Implementation Appendix
B-12
Crashes per mile for each roadway section is used to sort the sections in descending order.
Roadway sections are scheduled for improvement if their crashes per mile are higher than the overall average values for Hillsborough County roadways: 21 crashes per mile for arterials and 8 crashes per mile for collectors. The difference in values is due to generally higher traffic on arterials.
The procedure starts at the top of the list and selects roadway sections in order. Once selected, the cost of making the improvement and the number of crashes reduced are calculated using the factors in Table A-6. These are tallied at the end of the selection process to produce total cost and crash reduction values.
Roadway sections are selected from the sorted list until either the total budgets are expended (Investment Levels 1 and 2) or all sections above the crashes per miles thresholds are selected (Investment Level 3).
Results
For the “Low” and “Medium” investment levels, a fixed budget was used – sections were improved until the budget was expended. For the “High” investment level, no budget was specified – all sections that had crash rates higher than the average rate were scheduled for improvement. Table B-8 is a summary of costs and benefits, depending on the level of investment. Table B-9 shows just the crash reductions for each investment level, compared to the 2040 base which assumes no safety improvements take place.
Table B-7 Costs and Benefits of Safety Bundles
Analysis Scenario Representative Improvement Types Improvement Costs
Budget Impact Factor8
Safety
Low Minor intersection upgrades (new signal heads, phasing, signal heads), sidewalks. $200K per mile; crash reduction =10%.
$200,000/mile $64,000,000 CRF = 10%
Medium Major intersection upgrades (new signal heads, controllers, pedestrian signals and refuges, turn lanes/bays, cross walks, sidewalks).
$500,000/mile $320,000,000 CRF = 25%
High
Major intersection upgrades (new signals, controllers, pedestrian signals and refuges, turn lanes/bays, cross walks, sidewalks, lighting, complete streets, hazard removal median treatments, curbs & gutters, shoulders).
$1,000,000/mile
No budget constraint – all sections above the average crash rate are improved.
CRF = 55%
8 CRF = crash reduction factor

SHRP2 Travel Time Reliability Analytical Product Implementation Appendix
B-13
Table B-8 Crash Reduction Costs and Benefits Investment Level
Benefits Responsible Agency Description Annual Cost 20 Year Cost
Level 1
Total crashes are reduced by 4,390 (9%)
Total fatal crashes reduced by 13 (9.7%)
Bike/pedestrian crashes reduced by 136
Hillsborough Intersections, medians, sidewalks, school safety
$11,315,000 $226,300,000
City of Tampa Sidewalks, bikeways, crosswalks $5,768,638 $115,372,768
Temple Terrace Sidewalks, bike lanes, ADA curbs
$132,760 $2,655,200
Plant City Intersections, sidewalks $112,000 $2,240,000
FDOT Education, enforcement, grants to local agencies $7,586,600 $151,732,000
Total $24,914,998.4 $498,299,968
Level 2
Total crashes are reduced by 9,017 (20.2%)
Total fatal crashes reduced by 28 (20.2%)
Bike/pedestrian crashes reduced by 294
All
903 intersection treatments: signal adjustments, pedestrian signals & refuge areas, turn lanes/bays, crosswalks
$22,575,000 $451,500,000
Hillsborough County
600 miles of new standard street lights, including operational cost for 20 years
$21,000,000 $420,000,000
All 300 miles of new sidewalks for continuous sidewalk on at least one side of all major roads
$2,400,000 $48,000,000
Total $45,975,000 $919,500,000
Level 3
Total crashes are reduced by 22,722 (50.8%)
Total fatal crashes reduced by 68 (50.7%)
Bike/pedestrian crashes reduced by 704
All 903 miles of "complete streets" treatments on major roads with above-average crash rate
$87,918,338 $1,758,366,750
Hillsborough County
600 miles of new standard street lights, including operational cost for 20 years
$21,000,000 $420,000,000
All 300 sidewalk miles, for continuous sidewalk on at least one side of all major roads
$2,400,000 $48,000,000
Total $111,318,338 $2,226,366,750
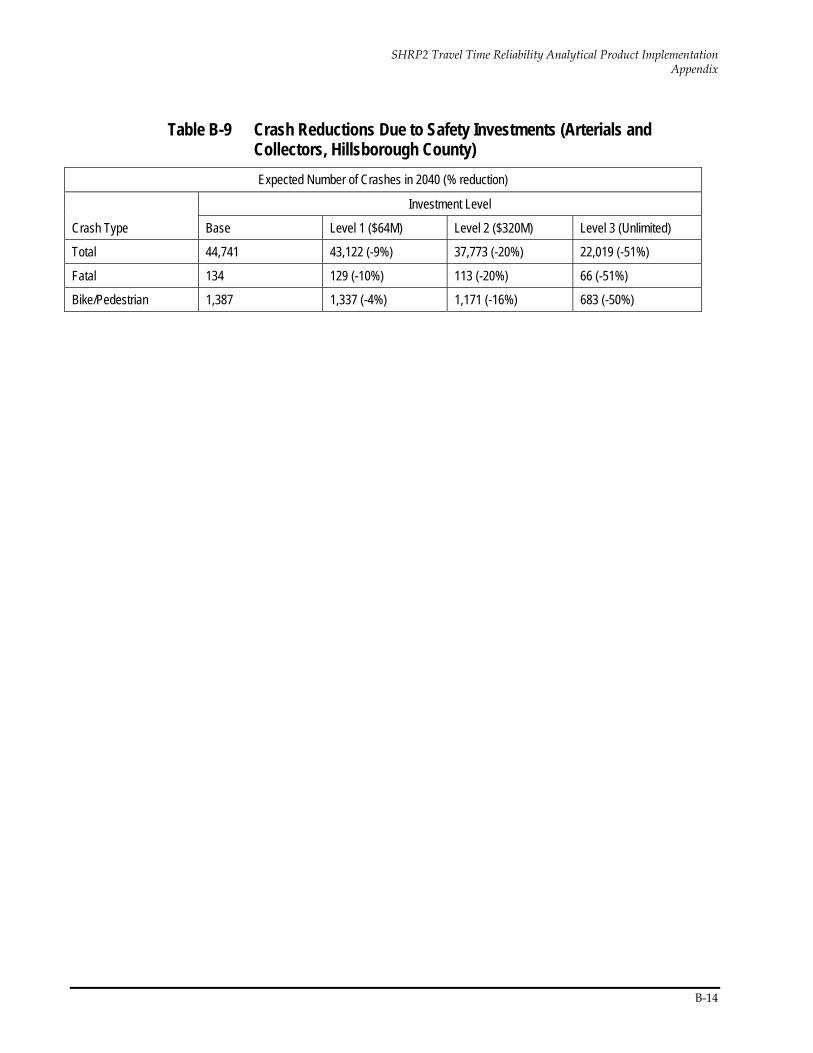
SHRP2 Travel Time Reliability Analytical Product Implementation Appendix
B-14
Table B-9 Crash Reductions Due to Safety Investments (Arterials and Collectors, Hillsborough County) Expected Number of Crashes in 2040 (% reduction)
Crash Type
Investment Level
Base Level 1 ($64M) Level 2 ($320M) Level 3 (Unlimited)
Total 44,741 43,122 (-9%) 37,773 (-20%) 22,019 (-51%)
Fatal 134 129 (-10%) 113 (-20%) 66 (-51%)
Bike/Pedestrian 1,387 1,337 (-4%) 1,171 (-16%) 683 (-50%)
SHRP 2 Travel Time Reliability Analytical Product Implementation Appendix
C-1
C. L07 – Analysis and Results Description
EVALUATION OF THE L07 DECISION TREES The L07 decision trees are useful for identifying solutions to reliability problems on existing facilities. The engineer uses the SHRP-2 L02 system monitoring guidance to determine the major causes of reliability problems on the facility. The engineer then enters the L07 decision trees to identify the more promising design treatments that might be applied to the facility to improve reliability. The L07 Tool is then used to compare the costs and benefits of the candidate treatment options.
The L07 decision trees can be useful to FDOT engineers and planners if the non-applicable treatments are pruned from the trees. It is recommended that the following treatments be struck from the L07 trees for use in Florida (see Figure C-1 and Figure C-2):
1. Runaway Truck Ramps
2. Snow fence
3. Anti-Ice treatment
4. Call boxes
The first three treatments (truck ramps, snow fence, anti-ice) are unlikely to be useful in Florida. The last item, call boxes, is rapidly being made obsolete by cell phones.

SHRP 2 Travel Time Reliability Analytical Product Implementation Appendix
C-2
Figure C-1 Pruned L07 Decision Tree for FDOT Reliability Design Treatments
Adapted from Figure 1, SHRP2 L07 Design Guide, Transportation Research Board, Washington, DC 2013
Note: this chart does not address reliability problems caused by demand fluctuations or traffic control device malfunctions.

SHRP 2 Travel Time Reliability Analytical Product Implementation Appendix
C-3
Figure C-2 Pruned L07 Decision Tree for FDOT Secondary Treatments
Adapted from Figure 2, SHRP2 L07 Design Guide, Transportation Research Board, Washington, DC 2013
Note: this chart does not address reliability problems caused by demand fluctuations or traffic control device malfunctions.
C.1 APPLICABILITY OF L07 DESIGN GUIDE TO FDOT This section compares the SHRP2 L07 recommended design and non-design treatments to:
Florida Green Book 2011 (FGB) (The proposed changes for the 2013 Green Book do not appear to affect the content relevant to the SHRP2 L07 recommendations).
FDOT Plans Preparation Manual (PPM), January 1, 2013, revised January 1, 2014.
FDOT Design Standards (Standard Indexes)
This evaluation presents the treatment classifications identified in the SHRP2 L07 Design Guide, treatments that can be applied under the classification, recommendations for treatment application based on the SHRP2 L07 Design Guide, current FDOT practice, a preliminary evaluation of the treatment from an
SHRP 2 Travel Time Reliability Analytical Product Implementation Appendix
C-4
FDOT perspective, and recommendations for additional consideration in field tests.
L07 Design Treatments include Medians, Shoulders, Crash Investigation Sites, Right-of-way Edge, Arterials and Ramps, Detours, Truck Incident Design Considerations, Construction, and Weather treatments.
L07 Non-Design Treatments include Traffic Signals and Control, Technology, Emergency Responder Notification, and Weather treatments. Note that all of the non-design weather treatments have been grouped with and are discussed together under the design weather treatments.
MEDIANS
Median design treatments include emergency crossovers, moveable traffic barriers, controlled/gated turnarounds, movable cable median barrier, extra-height median barrier (>42 inches), and traversable medians (13-16 feet).
Emergency Crossovers
The L07 Guide defines an emergency crossover as “a median opening on a divided highway segment for crossing by emergency, law enforcement, maintenance, and traffic service vehicles.” The Guide states that emergency crossovers reduce the lane blocking time of an incident by enabling emergency vehicles to more quickly access the incident scene, and reduce the demand volume queued at the incident by allowing responders the option of diverting traffic through the median crossover to make a U-turn.
SHRP2 L07 Recommendation
L07 identifies emergency crossovers for use in rural freeway sections and on arterials to improve reliability by facilitating emergency response (improves access to a crash site) and enabling rerouting of traffic. It quotes the AASHTO Green Book regarding the placement of emergency crossovers between interchanges on rural freeways every 3 to 4 miles. It does not provide a recommended spacing for emergency crossovers on non-freeways.
Current FDOT Practice
Section 2.2.2, Multilane Facility Median Policy of Volume 1 of the Plans Preparation Manual (PPM) states that:
All multilane SIS facilities shall be designed with a raised or restrictive median, and
Facilities having design speeds of 40 mph or less are to include sections of raised or restrictive median for enhancing vehicular and pedestrian safety, improving traffic efficiency, and attainment of the standards of the Access Management Classification of the highway.
SHRP 2 Travel Time Reliability Analytical Product Implementation Appendix
C-5
Section 2.14 (Vol 1 PPM) sets the criteria for locating median openings crossovers on limited access facilities:
They should not be spaced closer than 3 miles apart or farther than 5 miles apart (this maximum distance applies only if a continuous median barrier is present).
They should not be located within 1.5 miles of any interchange.
They should not be located on medians under 40 feet in width.
They should not be located within urban areas.
With typical spacings of interchanges in urban areas of between 1 and 2 miles, the PPM guidance generally precludes the use of emergency crossovers on limited access facilities in urban areas.
The 2011 Florida Greenbook (FGB) gives the following guidance regarding crossovers and median breaks:
Section 3.c.7e identifies the facility types (freeways and streets/roads with 4 or more travel lanes and a design speed of 40 mph or greater) when a median separation is required.
Section 3.c.8.b.2 (Spacing of Access Points) recommends avoiding frequent median openings, but does not recommend a maximum spacing for emergency access or traffic rerouting.
Section 3.c.9.e.3 addresses median openings for at-grade intersections, specifying that they should be no less than 40 feet in length.
Preliminary Evaluation
FDOT practice for emergency crossovers on rural freeways appears to meet the recommendations given in the L07 Design Guide. There are opportunities for reducing incident response times by incorporating more guidance on emergency crossover spacings in the PPM and FGB.
FDOT may wish to consider if controlled emergency crossovers on freeways (using one of the gated treatments described later) might be appropriate for urban areas to reduce incident response times. (This would require modifying or overriding the PPM guidance for spacing from nearest interchange for controlled access facilities).
FDOT may wish to consider if recommendations for median breaks and emergency crossover spacings should be included in the FGB.
Recommendation for Field Evaluation
The potential costs and benefits of more frequent emergency crossovers on an urban freeway should be evaluated.
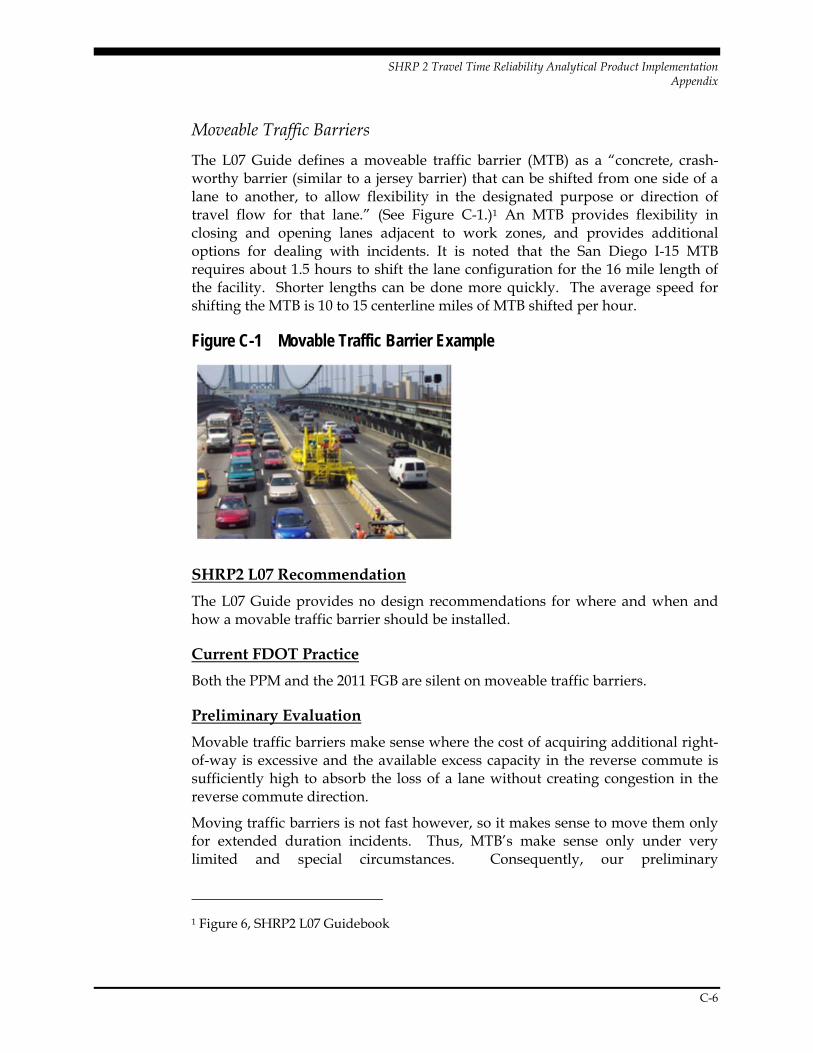
SHRP 2 Travel Time Reliability Analytical Product Implementation Appendix
C-6
Moveable Traffic Barriers
The L07 Guide defines a moveable traffic barrier (MTB) as a “concrete, crash-worthy barrier (similar to a jersey barrier) that can be shifted from one side of a lane to another, to allow flexibility in the designated purpose or direction of travel flow for that lane.” (See Figure C-1.)1 An MTB provides flexibility in closing and opening lanes adjacent to work zones, and provides additional options for dealing with incidents. It is noted that the San Diego I-15 MTB requires about 1.5 hours to shift the lane configuration for the 16 mile length of the facility. Shorter lengths can be done more quickly. The average speed for shifting the MTB is 10 to 15 centerline miles of MTB shifted per hour.
Figure C-1 Movable Traffic Barrier Example
SHRP2 L07 Recommendation
The L07 Guide provides no design recommendations for where and when and how a movable traffic barrier should be installed.
Current FDOT Practice
Both the PPM and the 2011 FGB are silent on moveable traffic barriers.
Preliminary Evaluation
Movable traffic barriers make sense where the cost of acquiring additional right-of-way is excessive and the available excess capacity in the reverse commute is sufficiently high to absorb the loss of a lane without creating congestion in the reverse commute direction.
Moving traffic barriers is not fast however, so it makes sense to move them only for extended duration incidents. Thus, MTB’s make sense only under very limited and special circumstances. Consequently, our preliminary
1 Figure 6, SHRP2 L07 Guidebook

SHRP 2 Travel Time Reliability Analytical Product Implementation Appendix
C-7
recommendation is that movable traffic barriers are not worth evaluating further. Consideration of MTB’s should be done on a specific case-by-case basis.
Recommendation for Field Evaluation
No further evaluation of movable traffic barriers is recommended.
Controlled/Gated Turnarounds
The L07 Guide describes a gated median barrier as consisting of “adding a gated section within a continuous median barrier. Typically, these gates, which may be manually or automatically operated, provide access to maintenance personnel, emergency responders, and other authorized users.” The purpose of gated median barriers is to provide quicker access for emergency responders to the incident scene, with less risk of illegal use by non-authorized vehicles. (see Figure 4-6.)2
Figure C-1 Example Gated Median Barrier
SHRP2 L07 Recommendation
The L07 Guide refers to an FHWA report and an NCHRP report for guidance on the design of the gates. The Guide does not specifically address recommended spacing of the gated median barriers, but readers can refer back to the section on recommended spacings for non-gated emergency crossovers.
Current FDOT Practice
Neither the FGB nor the PPM currently addresses gated median barriers.
2 Taken from Figure 8, SHRP2 L07 Guidebook

SHRP 2 Travel Time Reliability Analytical Product Implementation Appendix
C-8
Preliminary Evaluation
The L07 Guide identifies gated barriers as an option for speeding emergency responder access to incident scenes. Gated barriers would seem to be an option for overcoming the misuse of emergency crossovers in an urban setting, but the L07 Guide does not provide guidance on spacing of the gates.
Recommendation for Field Evaluation
See earlier recommendation for the field evaluation of emergency crossovers. Gated median barriers may overcome concerns with employing emergency crossovers in an urban setting.
Movable Cable Median Barrier
The L07 Guide defines a movable cable median barrier as involving “construction of a specially designed wire cable barrier system that can be removed to allow median crossovers. The system is constructed such that the cables can be detached from the posts individually and the posts can be removed from their base. This deconstruction can be done over a short segment of the length of the cable to provide a temporary median opening for emergency vehicles in the event of a crash or other major incident. This machine- and tool-free process is designed such that the cable median barrier can be reassembled with minimal effort to restore the barrier system to its permanent state.” (See Figure 4-7.)3
The purpose of movable cable median barriers is to reduce emergency response time to reach the incident scene.
3 Taken from Figure 9, SHRP2 L07 Guide

SHRP 2 Travel Time Reliability Analytical Product Implementation Appendix
C-9
Figure C-1 Example Movable Cable Median Barrier
SHRP2 L07 Recommendation
The L07 Guide does not specify situations when movable cable median barriers may be more appropriate than traditional fixed barriers.
Current FDOT Practice
Current practice is to favor jersey style median barriers over cable barriers because of their lower maintenance requirements and the consequent reduction in the exposure of maintenance personnel.
Preliminary Evaluation
It is not clear that the use of movable cable barriers in-lieu of fixed concrete barriers would provide a net benefit to Florida. The movable cable barriers would facilitate quicker emergency response to incidents, but that benefit would be traded off against greater exposure of maintenance personnel and the traveling public to the more frequent work zones needed to maintain the cable barriers.
Where other conditions warrant the installation of a flexible barrier in-lieu of a fixed barrier (see Section 4.e of FGB), then it may be appropriate to consider movable cable barrier in-lieu of the traditional cable barrier to improve emergency response times and thereby improve reliability.
Recommendation for Field Evaluation
No further evaluation is recommended for movable cable barriers.
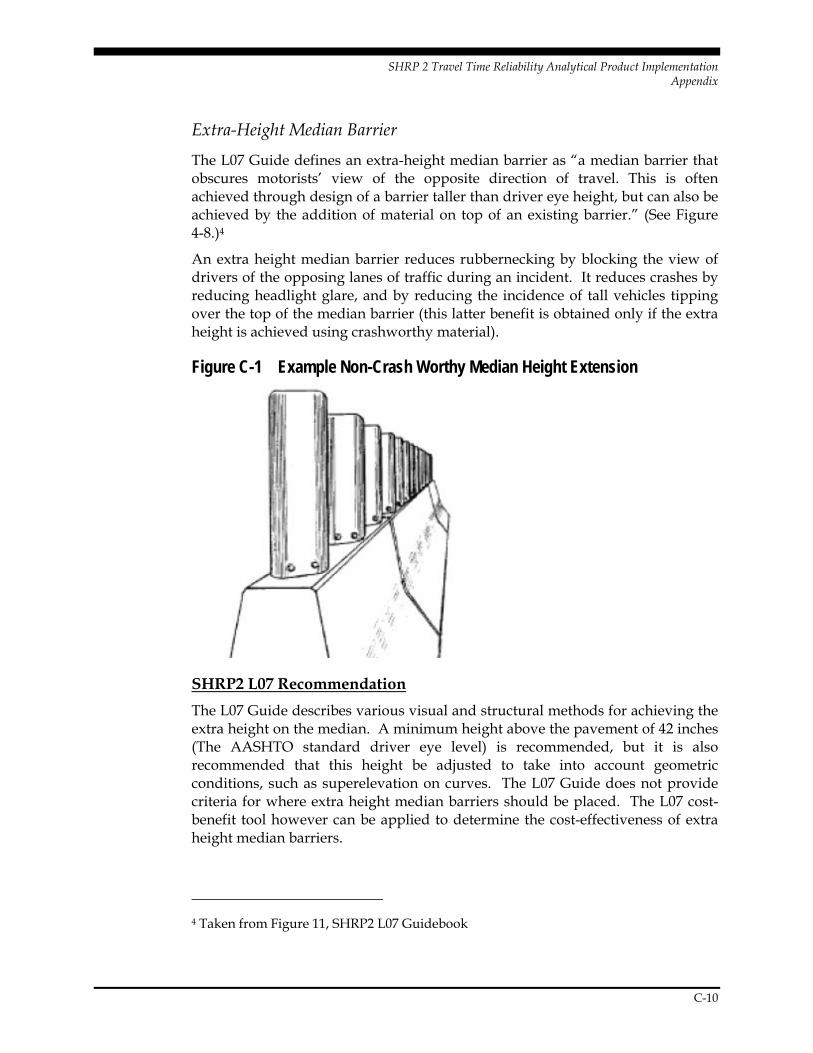
SHRP 2 Travel Time Reliability Analytical Product Implementation Appendix
C-10
Extra-Height Median Barrier
The L07 Guide defines an extra-height median barrier as “a median barrier that obscures motorists’ view of the opposite direction of travel. This is often achieved through design of a barrier taller than driver eye height, but can also be achieved by the addition of material on top of an existing barrier.” (See Figure 4-8.)4
An extra height median barrier reduces rubbernecking by blocking the view of drivers of the opposing lanes of traffic during an incident. It reduces crashes by reducing headlight glare, and by reducing the incidence of tall vehicles tipping over the top of the median barrier (this latter benefit is obtained only if the extra height is achieved using crashworthy material).
Figure C-1 Example Non-Crash Worthy Median Height Extension
SHRP2 L07 Recommendation
The L07 Guide describes various visual and structural methods for achieving the extra height on the median. A minimum height above the pavement of 42 inches (The AASHTO standard driver eye level) is recommended, but it is also recommended that this height be adjusted to take into account geometric conditions, such as superelevation on curves. The L07 Guide does not provide criteria for where extra height median barriers should be placed. The L07 cost-benefit tool however can be applied to determine the cost-effectiveness of extra height median barriers.
4 Taken from Figure 11, SHRP2 L07 Guidebook

SHRP 2 Travel Time Reliability Analytical Product Implementation Appendix
C-11
Current FDOT Practice
The standard concrete barrier wall height is 32 inches above the pavement (FDOT 2015 Design Standards, Index 410, Sheet 1). The index 461 (FDOT 2015 Design Standard) describes the opaque visual barrier as a visual screen, not intended to resist vehicle impact loads nor to restrain, contain or restrict vehicles or cargo, but designed to withstand zone wind loading and strikes by light debris; and, designed to yield to exceptional strikes by vehicles or cargo, and to contain ruptured segments of the screen when yielding to such strikes. An opaque visual barrier is 46 inches high above pavement.
Preliminary Evaluation
The selective and more frequent application of extra height median barriers appears to be a potentially beneficial treatment for Florida controlled access facilities (freeways or arterials). It should be considered for application where other considerations do not preclude it and where a cost-benefit analysis indicates it is more cost-effective than other possible reliability treatments.
Recommendation for Field Evaluation
It is recommended that the extra height median barrier treatment be evaluated for its cost-effectiveness (in comparison to other potential reliability treatments) at the freeway test site. This treatment does not appear appropriate for evaluation at the arterial test sites (because the arterial sites selected are NOT controlled access facilities).
Traversable Medians
The L07 Guide defines mountable/traversable medians as “medians that do not physically prevent vehicles from crossing from one direction of travel to the other. Examples of this treatment include:
Flush or painted medians,
Two-way left-turn lanes (TWLTL),
Raised (but traversable) medians.”
The purpose of mountable/traversable medians is to provide better access by emergency responders to incident sites.
SHRP2 L07 Recommendation
The L07 Guide identifies three types of mountable/traversable medians:
Flush Medians of between 4 and 13 feet in width,
Flush TWLTL (two way left turn lanes) of between 10 and 16 feet in width, and

SHRP 2 Travel Time Reliability Analytical Product Implementation Appendix
C-12
Traversable TWLTL employing 2-inch high curbs to delineate the edges of the median.
The L07 Guide does not provide positive guidance on where traversable medians should be used, but does provide a cost-benefit analysis tool for evaluating their application.
Current FDOT Practice
The PPM identifies a minimum width of 10 feet for continuous TWLTL (table 23.9.2). The FGB requires median separations for all streets and highways with 4 or more travel lanes with a design speed of 40 mph or greater (Section 3.c.7.e). Paved medians of at least 10 feet in width may be used for two-way turn lanes when design speeds are 40 mph or less (Table 3-11, FGB). Neither the PPM nor the FGB provide positive guidance on where mountable/traversable medians should be used.
Preliminary Evaluation
Current FDOT practice appears to be consistent with the L07 Guidebook. The L07 Cost/Benefit tool provides the option of assessing the costs and benefits of incorporating TWLTL into an arterial design, in-lieu of an unpaved median. It is unclear if the tool also assesses the safety (and implicitly the reliability) tradeoffs of a median barrier versus a TWLTL.
Recommendation for Field Evaluation
It is recommended that the concept of traversable median treatments be evaluated for one of the arterial test sites.
SHOULDERS
Shoulder design treatments include Accessible Shoulders, Drivable Shoulders, Alternating Shoulders, Portable incident screens, Emergency pull-offs/Turnouts (8ft), and Bus Turnouts (12x60ft)
Accessible Shoulder
The L07 Guide defines an accessible shoulder as “a wider shoulder or an improvement to the surface of an existing shoulder (e.g., replacing a gravel shoulder with at paved shoulder) such that the shoulder can serve in one or both of the following functions:
As a pull-off for disabled or incident-involved vehicles, and/or
As a “bypass lane,” allowing emergency responders to go around queued mainline traffic, thereby reaching the incident scene more quickly.”
An accessible shoulder can be used as an extra lane during an incident, it reduces the time that lanes are blocked by enabling emergency responders to arrive at the

SHRP 2 Travel Time Reliability Analytical Product Implementation Appendix
C-13
site more quickly, and according to the AASHTO Highway Safety Manual, reduces crash frequencies.
Current FDOT Practice
The FGB recommends 10-foot shoulders, but allows for narrower widths as dictated by circumstances (FGB Section 3.c.7.c.1, Table 3-8, Table 3-9).
The PPM sets desired minimum 10-foot shoulders on freeways and 5-foot shoulders on non-freeways for new construction (Section 2.3). Tables 2.3.1 to 2.3.4 provide specific requirements for specific circumstances.
SHRP2 L07 Recommendation
The L07 Guide recommends paved 10 foot shoulders to implement this treatment.
Preliminary Evaluation
For freeways, current FDOT policy is to achieve paved 10 foot shoulders wherever feasible, but with smaller widths allowed under certain circumstances. Current FDOT practices are, in essence, consistent with the SHRP2 L07 Guide recommendations, so no evaluation is required as part of this task order.
Recommendation for Field Evaluation
No further evaluation required.
Drivable Shoulder
The L07 Guide defines drivable shoulders as “shoulders that can be temporarily used by mainline traffic as a travel lane.”
SHRP2 L07 Recommendation
The L07 Guide recommends a minimum 9-foot paved shoulder with 12-foot width being optimal. The Guide does not provide guidance on where drivable shoulders should be implemented.
Current FDOT Practice
See prior section on “Accessible Shoulders” for current FDOT practice.
Preliminary Evaluation
The optimal width of 12 paved feet for a drivable shoulder exceeds current FDOT practice. For urban arterials, 12 foot paved shoulders are likely to be highly expensive due to right of way costs.
SHRP 2 Travel Time Reliability Analytical Product Implementation Appendix
C-14
Recommendation for Field Evaluation
It is recommended that the likely benefits and costs of going to 12 foot paved shoulders on urban freeways be assessed for the freeway test site.
Alternating Shoulder
The L07 Guide describes alternating shoulders as a design treatment “used on roadways without sufficient width to provide full shoulders on both sides of the roadway. Instead of providing narrow shoulders on both sides of the roadway, a full width shoulder is provided for one direction of travel for a specified length of roadway, and then provided for the other direction of travel for the next segment of roadway.” Such a treatment is expected to: reduce the frequency of crashes, and accelerate the clearance of lane blocking incidents by enabling disabled vehicles to be moved to the widened shoulder.
SHRP2 L07 Recommendation
The L07 Guide recommends the use of alternating full size shoulders when available right of way does not allow the provision of full size shoulders simultaneously on both sides of the traveled way.
Current FDOT Practice
Alternating shoulders are not covered in the PPM or FGB.
Preliminary Evaluation
The use of alternating shoulders is an innovative treatment for overcoming otherwise insurmountable right of way constraints that force substandard shoulders.
Recommendation for Field Evaluation
It is recommended that the use of alternating shoulders be evaluated for the freeway test site, for situations where shoulder widths are constrained by right of way limitations.
Portable Incident Screens
The L07 Guide describes this treatment as “placing a portable screening device around an incident (typically along the roadside) to obscure motorists’ view of the incident and reduce congestion caused by rubbernecking (or “gawking”).”
SHRP2 L07 Recommendation
The L07 Guide identifies the following conditions for when it might be appropriate to set up a portable incident screen:
The incident is likely to take more than three hours to clear.

SHRP 2 Travel Time Reliability Analytical Product Implementation Appendix
C-15
The incident is likely to cause secondary congestion due to “rubbernecking”…and it is considered that deployment of the incident screen is likely to reduce this.
Traffic volumes on the opposite roadway from the incident are expected to be relatively high or expected to become high during the anticipated duration of the incident.
It is possible to deploy the incident screen while maintaining at least 3.9 ft (1.2 m) between the incident screen and traffic lanes.
It is possible to maintain an incident side safety zone of at least 3.9 feet (1.2 m) from the screen at all times while the screen is being setup, is in place, and is being dismantled. (Vehicles and personnel should not enter the safety zone except in an emergency or to maintain the screen. If the safety zone cannot be provided, the screen should not be deployed.)
Weather conditions are appropriate for the use of the screen. In particular, the screen should not be deployed in conditions of snow, ice, poor visibility, or high winds exceeding the maximum wind speed permitted for the stability classification of the screen.
The police must confirm that they do not consider that use of the screen would disrupt their operations.
The ambulance, fire and rescue services must agree to the use of the screen in the situation in question.
The emergency services must confirm that it is not expected that a helicopter will land in the vicinity of the incident.
The presence of the incident screen must present no hazard to or interfere with the work of the emergency services (including any operations of the air ambulance service), all other incident-related activity, or any ongoing work activities.
Current FDOT Practice
Florida Highway Patrol generally does not currently employ portable incident screens. FDOT does not provide specifications for their design or use.
Preliminary Evaluation
Given the many caveats identified by the L07 Guide, it does not appear that portable incident screens are likely to be valuable in Florida for reducing the reliability effects of incidents.
Recommendation for Field Evaluation
No further evaluation of portable incident screens is recommended.

SHRP 2 Travel Time Reliability Analytical Product Implementation Appendix
C-16
Emergency Pull-Offs/Turnouts
The L07 Guide describes emergency pull-offs and vehicle turnouts as “short sections of shoulder provided on routes that have either no shoulder or very narrow shoulders. Vehicle turnouts allow a disabled or crash-involved vehicle to pull completely out of the travel way. Vehicle turnouts are typically at least 8-ft wide” and are employed when the available paved shoulder is less than 8 feet.
Emergency pullouts can reduce the lanes blocked by an incident (by providing a place to relocate disabled vehicles).
SHRP2 L07 Recommendation
According to the L07 Guide, “Turnouts are often provided in rural locations when queues of traffic typically form behind slow-moving vehicles, causing impeded vehicles to make risky passing maneuvers which may result in crashes. In urban and suburban areas, turnouts are often provided in locations that have experienced a high number of incidents resulting from vehicles blocking all or part of a travel lane. They may also be located along freeways and ramps to accommodate maintenance vehicles during roadway maintenance activities. Turnouts may also be provided as a low-cost alternative to providing or widening a shoulder.”
Current FDOT Practice
The FGB does not currently address emergency pullouts or turnouts. The PPM addresses bus pullouts (Section 8.10.2 Street-Side Facilities), but does not address emergency pullouts.
Preliminary Evaluation
Short emergency pullouts appear to be a highly cost effective treatment for situations with less than desirable shoulders.
Recommendation for Field Evaluation
It is recommended that the costs and benefits of adding emergency pullouts be evaluated for the freeway and arterial test sites.
Bus Turnouts
The L07 Guide describes bus turnouts as “designated paved area to the side of the roadway for buses to stop to pick up and drop off passengers. The turnout allows vehicles on the roadway to continue without obstruction of a stopped or idling bus.” Bus turnouts can reduce the frequency of lane blocking incidents when a bus stops to pick up/drop off passengers, and can reduce the frequency of incidents.

SHRP 2 Travel Time Reliability Analytical Product Implementation Appendix
C-17
Current FDOT Practice
The FGB provides guidance for Bus Bays (pullout or turnout bays) (Section 13.C.5). The PPM provides similar guidance (Section 8.10.2).
Preliminary Evaluation
FDOT practice is consistent with L07 Guidebook recommendations.
Recommendation for Field Evaluation
No further evaluation is required.
CRASH INVESTIGATION SITES
The L07 Guide describes crash investigation sites as “paved areas provided near highways to allow the relocation of crash-involved vehicles from the crash site to a safer area out of the way of traffic where crash investigations can be conducted.” These sites may be used to make cell-phone calls and change a tire. They reduce non-recurrent congestion by reducing the time a disabled vehicle is blocking a travel lane.
SHRP2 L07 Recommendation
The L07 Guide recommends sites on the order of 30 feet wide by 85 feet long. The Guide does not recommend spacing for crash investigation sites.
Current FDOT Practice
Crash investigation sites are not currently addressed by the FGB and PPM.
Preliminary Evaluation
Crash investigation sites appear to be a cost effective treatment for facilities with inadequate shoulders. These sites are a minor variation on emergency pullouts (described earlier) and should be evaluated at the same time that emergency pullouts are evaluated.
Recommendation for Field Evaluation
It is recommended that crash investigation sites be evaluated at the same time as emergency pullouts are evaluated.
RIGHT-OF-WAY EDGE
Right-of-way edge treatments consist of Locked Gate Emergency Access.
SHRP 2 Travel Time Reliability Analytical Product Implementation Appendix
C-18
Locked Gate Emergency Access
The L07 Guide describes locked gate emergency access as a direct but gated connection between a limited access facility and the local street system that is located in between interchanges. These access points may be used for maintenance access as well as for emergency response. These access points may shorten emergency response times to the incident scene.
SHRP2 L07 Recommendation
Locked gate access points may be useful where interchange spacing is relatively long. These access points may be useful for diverting traffic to local streets during an incident.
Current FDOT Practice
The FGB and PPM do not address locked gate emergency access points to controlled access facilities.
Preliminary Evaluation
Locked gate access does not appear to be an appropriate treatment to improve reliability on controlled access facilities in Florida.
Recommendation for Field Evaluation
No further evaluation is recommended.
ARTERIALS AND RAMPS
Arterial and ramp treatments include Ramp widening (Add lanes), Ramp closure (time of day, temporary), Off-Ramp terminal traffic control, and Ramp turn restrictions (time day, event).
Ramp Widening
The L07 Guide describes ramp widening as adding lanes to increase the capacity of the ramp. This treatment is intended to be applied to off-ramps to reduce the chances of off-ramp queues backing up onto the freeway. It may also be useful to reduce the incidence of crashes on the off-ramp.
Current FDOT Practice
Current FDOT practice is to provide adequate ramp capacity where feasible.
Preliminary Evaluation
FDOT practice is consistent with L07 Guide recommendations

SHRP 2 Travel Time Reliability Analytical Product Implementation Appendix
C-19
Recommendation for Field Evaluation
No further evaluation required.
Ramp Closure
The L07 Guide discusses temporary ramp closures in response to (1) major incidents, (2) work zones, (3) special events, or (4) inclement weather conditions for the purposes of addressing non-recurrent congestion. Such temporary closures reduce mainline demand, thus reducing non-recurring congestion. This treatment should be implemented in conjunction with improvements to detour routes (described later).
Current FDOT Practice
FDOT will close ramps as part of a Maintenance of Traffic Plan for a work zone. The FGB and the PPM do not provide guidance on repeated temporary ramp closures to address recurring special events or inclement weather.
FDOT does not have specific ramp closure procedures; rather it is included in lane closures. District one has lane closure policy and procedure5 outlining general requirements and lane closure policy for interstate highways, other state highways, emergency conditions, and other conditions. For all lane closures exceeding two hours a minimum of one week (two weeks is recommended) advance notification must be provided. This policy notes lane closures along ramps is limited to 11:00PM to 5:00AM with special requests that deviate from the referenced time periods to be approved by the Director of Transportation Operations or his designee.
Florida’s Turnpike Enterprise (FTE) permit office also has a policy for lane closures which applies to ramps. Any closure requires submittal of a Lane Closure Request Form a minimum of two weeks prior to proposed lane closure to be reviewed and approved.
The Standard Index 655 on traffic pacing describes ramp closure by police officer on the second sheet of the index (2015 FDOT Design Standards).
Preliminary Evaluation
FDOT already has a process in place for considering temporary ramp closures as part of incident management, work zone management, weather management,
5
http://www.dot.state.fl.us/construction/DistrictOffices/d1web/ContractAdministration/Lane%20closure%20policy/District%20One%20Lane%20Closure%20Policy%20%20Procedures%20Apr_2010.pdf
SHRP 2 Travel Time Reliability Analytical Product Implementation Appendix
C-20
and special event planning. The current FDOT practice is consistent with L07 Guide recommendations.
Recommendation for Field Evaluation
No further evaluation recommended.
Off-Ramp Terminal Traffic Control
The L07 Guide describes off-ramp terminal traffic control as design treatments to increase the traffic capacity of the ramps. These improvements include:
Installation of signals
Improved signal timings
Installation of a roundabout
Installation of turn lanes
Changes to signing, striping or signals used at the ramp terminal to control the movement of traffic
Manual traffic control by law enforcement (most commonly used during a special event)
Current FDOT Practice
All of the L07 recommended ramp capacity improvements appear to be standard FDOT practice.
Preliminary Evaluation
FDOT practice is consistent with the L07 Guide recommendations.
Recommendation for Field Evaluation
No further evaluation required.
Ramp Turn Restrictions
The L07 Guide describes ramp turn restrictions as turn restrictions to prevent arterial traffic from entering an on-ramp. The purpose is to redirect traffic to other routes so as to avoid excessive queuing on the ramp and in the arterial turn lanes feeding the on-ramp.
Current FDOT Practice
FDOT current practice is to implement ramp turn restrictions on a case by case basis. Ramp turn restrictions come primarily in the form restrictive left turn signals.

SHRP 2 Travel Time Reliability Analytical Product Implementation Appendix
C-21
Preliminary Evaluation
FDOT currently considers turn restrictions as part of its incident management, work zone management, and weather management/emergency evacuation planning. FDOT practice is consistent with L07 Guide recommendations.
Recommendation for Field Evaluation
No further evaluation required.
DETOUR IMPROVEMENTS
For the purposes of improving reliability, a detour is a set of designated roadways for temporarily carrying traffic along a secondary route to bypass temporary traffic congestion on the primary facility that may be the result of work zones, incidents, or special events. The treatment consists of capacity and operational improvements to the detour route(s) to provide acceptable level of service on the secondary route.
SHRP2 L07 Recommendation
Detour improvements include restriping or temporarily designating lanes to allow vehicles to utilize shoulders or on-street parking on an arterial. A detour using a controlled access facility may incorporate improvements that modify the lane management protocol on the facility (e.g. opening HOV lane to all drivers, opening a shoulder lane to travel, etc.)
Current FDOT Practice
The PPM provides for narrower lane widths (11 feet) for off-system detours to enable the temporary provision of more travel lanes in a restricted right of way (Table 2.1.2 PPM). Detours and detour improvements are regularly addressed as part of the Temporary Traffic Control (TTC) Plans required for work on state facilities by Florida statute and Federal regulations (10.3.1.1 PPM). The PPM also identifies traffic operations strategies for increasing the productivity of detour routes and work zones (10.3.1.2 PPM). These strategies include Demand Management Strategies, Corridor/Network Management Strategies, Work Zone Safety Management Strategies, and Traffic/Incident Management and Enforcement Strategies.
Preliminary Evaluation
FDOT practice is equivalent to the L07 Guide recommendations.
Recommendation for Field Evaluation
No further evaluation required.
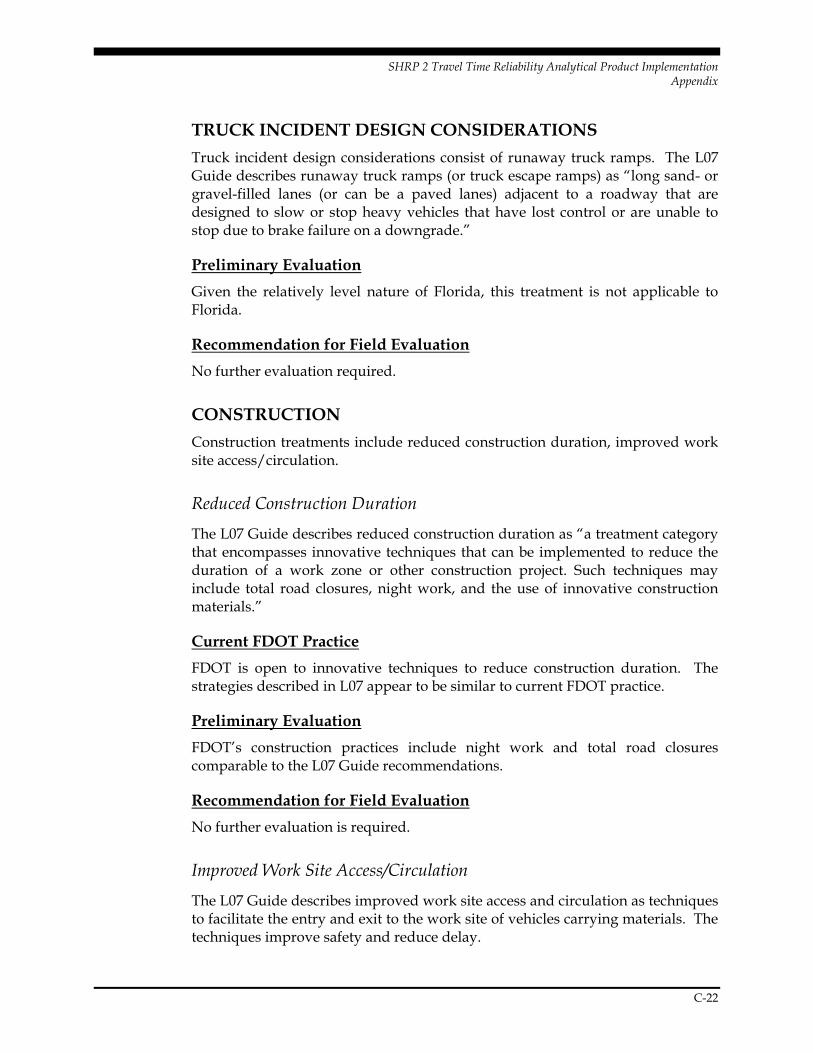
SHRP 2 Travel Time Reliability Analytical Product Implementation Appendix
C-22
TRUCK INCIDENT DESIGN CONSIDERATIONS
Truck incident design considerations consist of runaway truck ramps. The L07 Guide describes runaway truck ramps (or truck escape ramps) as “long sand- or gravel-filled lanes (or can be a paved lanes) adjacent to a roadway that are designed to slow or stop heavy vehicles that have lost control or are unable to stop due to brake failure on a downgrade.”
Preliminary Evaluation
Given the relatively level nature of Florida, this treatment is not applicable to Florida.
Recommendation for Field Evaluation
No further evaluation required.
CONSTRUCTION
Construction treatments include reduced construction duration, improved work site access/circulation.
Reduced Construction Duration
The L07 Guide describes reduced construction duration as “a treatment category that encompasses innovative techniques that can be implemented to reduce the duration of a work zone or other construction project. Such techniques may include total road closures, night work, and the use of innovative construction materials.”
Current FDOT Practice
FDOT is open to innovative techniques to reduce construction duration. The strategies described in L07 appear to be similar to current FDOT practice.
Preliminary Evaluation
FDOT’s construction practices include night work and total road closures comparable to the L07 Guide recommendations.
Recommendation for Field Evaluation
No further evaluation is required.
Improved Work Site Access/Circulation
The L07 Guide describes improved work site access and circulation as techniques to facilitate the entry and exit to the work site of vehicles carrying materials. The techniques improve safety and reduce delay.

SHRP 2 Travel Time Reliability Analytical Product Implementation Appendix
C-23
SHRP2 L07 Recommendation
The L07 Guide recommends that adequate acceleration and deceleration areas for trucks to safely enter and exit work areas be provided. The Guide recommends that the access points be clearly signed and/or delineated. Truck drivers should be briefed on how to access the project site.
Current FDOT Practice
Current FDOT practice is to provide safe and easily accessible work zone entry and exit points for materials delivery and removal. A work area access plan is one of the required elements of a Temporary Traffic Control Plan for work zones (10.3.1.1 PPM).
Preliminary Evaluation
FDOT practice is superior or equivalent to the L07 Guide recommendations.
Recommendation for Field Evaluation
No further evaluation is required.
ANIMAL-VEHICLE COLLISION DESIGN
Animal-vehicle collision design treatments consist of wildlife fencing and over/underpasses.
Current FDOT Practice
FDOT currently employs animal-vehicle collision reduction design treatments as needed. The PPM (Chapter 33) currently addresses the use of culverts for wildlife crossings. One example is the Key Deer wildlife protections on U.S. 1 on Big Pine Key (undercrossings, fencing, and lowered speed limits). FDOT has developed guidelines to determine the appropriateness of including wildlife crossings (upland or wetland) and/or exclusionary devices (fencing, walls, temporary barriers, etc.) in consultation with the Florida Fish and Wildlife Conservation Commission (FWC). To determine if such crossings or devices are appropriate, the Districts are required to coordinate with the FWC or the United States Fish and Wildlife Service (USFWS) and to follow their recommendation. If appropriate, the crossing has to be designed in coordination with FWC or USFWS.

SHRP 2 Travel Time Reliability Analytical Product Implementation Appendix
C-24
Figure C-1 Prefabricated Concrete Box Culvert Along SR 46 In Seminole County, Florida
Source: http://www.bda-inc.com/wordpress/BDA-
Resources/FINAL_BDA%20Wildlife%20Crossings%20Handbook_032510.pdf
Preliminary Evaluation
FDOT practice is equivalent to the L07 Guide recommendations.
Recommendation for Field Evaluation
No further evaluation is required.
WEATHER
Weather design treatments include Snow fences, Anti-icing systems, Blowing sand mitigation, Fog Detection, Road Weather Information System, Flood Warning, and Wind/Hurricane Warning. Snow fences are not expected to be applicable in Florida. Anti-icing systems are only rarely applicable in Florida. Blowing sand mitigation may be appropriate in beach environments.
Blowing Sand Mitigation
The L07 Guide describes blowing sand treatments as:
Structures that trap sand and dirt
Berms

SHRP 2 Travel Time Reliability Analytical Product Implementation Appendix
C-25
Fences
Treatments that help hold soil in place during high winds
Plantings
Irrigation systems
Blowing sand warning systems
These treatments are designed either to reduce the prevalence of blowing sand, or to warn drivers of the conditions.
Current FDOT Practice
FDOT practice is to implement these treatments on a case-by-case basis.
Preliminary Evaluation
FDOT practice is equivalent to the L07 Guide recommendations.
Recommendation for Field Evaluation
No further evaluation is required.
Fog Detection
The L07 Guide describes fog detection systems, which “automatically detect the presence of fog and then post warning messages on dynamic message signs upstream of the fog detector to notify drivers that they are entering a portion of roadway where fog is present.”
Current FDOT Practice
FDOT has a fog detection and warning system in place on I-75, north of Gainesville. FDOT is working on a fog warning system that will automatically detect fog and warn motorists.6 There will be different ways of warning motorists: flashing beacons attached to static signs that read “Fog Ahead When Flashing” or dynamic message signs posting “Fog Advisory Ahead”. The warning should occur without operator intervention given the fact that fog can happen quickly. FDOT is enhancing its SunGuide software, which already reads information from road weather information system (RWIS) devices and displays weather conditions to the operator, to fulfill the objectives of a fog warning system. SunGuide will automatically post warning messages on DMS and to automatically flash beacons. The software will use the existing alerting and event management subsystems of the TMC. The operator will be able to immediately respond to the alert and fine-tune the response to motorists if needed.
6 http://www.dot.state.fl.us/TrafficOperations/Newsletters/2014/2014-Feb.pdf

SHRP 2 Travel Time Reliability Analytical Product Implementation Appendix
C-26
Preliminary Evaluation
FDOT practice is equivalent to or superior to the L07 Guide recommendations.
Recommendation for Field Evaluation
No further evaluation is required.
Road Weather Info. Syst. (RWIS)
The L07 Guide describes a Road Weather Information System (RWIS), which “gathers meteorological information and relays it to highway agency and maintenance personnel. RWIS is comprised of Environmental Sensor Stations (ESS) in the field, a communication system for data transfer, and central systems to collect field data from numerous ESSs. An ESS measures atmospheric, pavement and/or water level conditions. Atmospheric data include air temperature and humidity, visibility distance, wind speed and direction, precipitation type and rate, tornado or waterspout occurrence, lightning, storm cell location and track, as well as air quality. Pavement data include pavement temperature, pavement freeze point, pavement condition (e.g., wet, icy, flooded), pavement chemical concentration, and subsurface conditions (e.g., soil temperature). Water level data include tide levels (e.g., hurricane storm surge) as well as stream, river, and lake levels near roads. Central RWIS hardware and software are used to process observations from ESS to develop forecasts, and display or disseminate road weather information in a format that can be easily interpreted by a manager.”
Current FDOT Practice
FDOT has installed a number of Road Weather Information System (RWIS) stations. The locations of the stations are displayed in Figure 4-11.

SHRP 2 Travel Time Reliability Analytical Product Implementation Appendix
C-27
Figure C-1 RWIS Stations in Florida
Ten of these stations include an anemometer, a visibility sensor, a rain gauge, a barometer, and a temperature and relative humidity sensor. The data is transmitted to the University of North Florida.
Four stations, measuring only wind speed and direction, are deployed on bridges. The data from the anemometer was transmitted via a wireless system to a nearby station with an existing connection to the FDOT network.7
Preliminary Evaluation
FDOT practice is equivalent to the L07 Guide recommendations.
Recommendation for Field Evaluation
No further evaluation is required.
7 http://ops.fhwa.dot.gov/publications/fhwahop08050/chap_11.htm

SHRP 2 Travel Time Reliability Analytical Product Implementation Appendix
C-28
Flood Warning System
The L07 Guide describes Flood warning systems that “automatically warn motorists of potentially hazardous flood conditions on the roadway ahead. There are two types of flood warning systems: active and passive. Passive systems consist of warning signs indicating a location on the roadway that may flood or be susceptible to standing water during heavy rains. Active warning systems consist of a sensor to detect high water levels or water on the roadway and a variable message sign (or flashing lights on a static sign) to warn motorists. Some flood warning systems include the capability of closing the roadway with physical barriers, which consist of either automated railroad crossing-type gates or manually placed barricades.”
Current FDOT Practice
FDOT currently includes flood warning systems as part of its emergency evacuation program for hurricanes.
Preliminary Evaluation
FDOT practice is comparable to the L07 Guide recommendations during hurricanes.
Recommendation for Field Evaluation
No further evaluation is required.
Wind Warning System
The L07 Guide describes wind warning systems which “warn motorists of potentially hazardous wind conditions along the roadway ahead.” Wind warning systems may be static signs warning of high wind areas, static signs with flashing lights, or dynamic/changeable/extinguishable message signs that may warn drivers of temporary high wind conditions and possibly prohibit certain high profile vehicle types from using the facility during high wind conditions.
Current FDOT Practice
FDOT has deployed a high-wind alert system for road bridges. The system provides real-time wind speed status information during severe weather events. Bridge closure decisions are made from this information collected from each monitored structure.8
8 http://ops.fhwa.dot.gov/publications/fhwahop12046/rwm09_florida1.htm

SHRP 2 Travel Time Reliability Analytical Product Implementation Appendix
C-29
Preliminary Evaluation
FDOT practice is equivalent to the L07 Guide recommendations.
Recommendation for Field Evaluation
No further evaluation is required.
Hurricane Warning and Emergency Evacuation System
The L07 Guide does not describe Hurricane Warning Systems. Hurricane warning and emergency evacuation systems give residents advance notice of approaching hurricanes and advises or requires residents to evacuate. The system also provides for emergency evacuation routes with special controls and personnel to facilitate one-way travel on two-way facilities.
Current FDOT Practice
FDOT has a Hurricane Warning and Emergency evaluation system in place.
Preliminary Evaluation
FDOT practice is superior to the L07 Guide recommendations.
Recommendation for Field Evaluation
No further evaluation is required.
LANE TYPES AND USES
Lane types and uses include contra-flow lanes for emergency evacuation, contra-flow lanes for work zones, HOV/HOT lanes, Bypass Lanes, Reversible Lanes, and Work Zone Express Lanes.
Contra-Flow Lanes—Evacuation
The L07 Guide describes contra flow lanes for emergency evacuations “as lanes that have been borrowed from one direction of travel to add capacity to the other direction of travel. This can be accomplished using overhead lane designations, static and dynamic signing, police traffic control, interchange gates or barriers or other means. Contraflow lanes can be used to accommodate emergency evacuations, most commonly in anticipation of hurricanes.”
Current FDOT Practice
FDOT has plans in place to implement contra flow lanes for emergency evacuations. Florida changed the terminology from “contra-flow” to “reverse lanes” for this procedure in 2007. Florida put in place reverse lanes plans in 2000 after Hurricane Floyd in 1999 and reviewed them in 2005, following the

SHRP 2 Travel Time Reliability Analytical Product Implementation Appendix
C-30
hurricanes of the summer of 2004. A series of recommendations resulted from the comprehensive review. The report was published in June 2005 under the title "Contraflow Plan for the Florida Intrastate Highway System".9
Preliminary Evaluation
FDOT practice is equal to or superior to the L07 Guide recommendations.
Recommendation for Field Evaluation
No further evaluation is required.
Contra-Flow Lanes—Work Zones
The L07 Guide describes contraflow lanes as a nonrecurrent congestion treatment for work zones.
Current FDOT Practice
Section 10.3.1.1 PPM specifies the content and considerations for Temporary Traffic Control Plans.
Preliminary Evaluation
FDOT practice is equal to or superior to the L07 Guide recommendations.
Recommendation for Field Evaluation
No further evaluation is required.
HOV Lanes/HOT Lanes
High occupancy vehicle (HOV) lanes and HOT (High Occupancy Toll or express lanes) are an element of a managed lanes strategy.
Current FDOT Practice
FDOT currently plans, designs, and implements express lanes.
Preliminary Evaluation
FDOT practice is equal to or superior to the L07 Guide recommendations.
Recommendation for Field Evaluation
No further evaluation is required.
9 http://www.dot.state.fl.us/trafficoperations/traf_incident/ContraFlow.shtm

SHRP 2 Travel Time Reliability Analytical Product Implementation Appendix
C-31
Dual Facilities
The L07 Guide describes dual facilities as providing “additional freeway-managed lanes, not simply set aside by striping or barriers, but a second set of mainline facilities that are separate, parallel, and adjacent to the primary freeway. A “dual-dual” configuration may allow trucks and passenger cars to utilize separate facilities within the same freeway envelope. The inner roadway may be dedicated to passenger cars and light vehicles whereas the outer roadway is available to all vehicles, including heavier trucks and buses. Each separate roadway has its own entrance and exit ramps.”
Current FDOT Practice
FDOT does not currently have guidelines for implementing dual facilities.
Preliminary Evaluation
Dual facilities require a great deal of right of way. The more congested freeways in Florida that might be able to take advantage of the capacity and operations benefits of dual facilities are located in corridors with severely restricted right of ways. This does not appear to be a practical treatment for Florida.
Recommendation for Field Evaluation
No further evaluation is required.
Reversible Lanes
Reversible lanes take advantage of underutilized capacity in the reverse direction. They may be facilitated with movable traffic barriers (described earlier). Note that use of reversible lanes for work zones and emergency evacuations have been discussed earlier.
Current FDOT Practice
Neither the PPM nor the FGB currently address the use or design of reversible lanes on arterials.
Preliminary Evaluation
Reversible lanes work best when the directional traffic flow is on the order of 2:1 (66%:34% during special events or peak periods). The conditions when reversible lanes might work are therefore limited.
Recommendation for Field Evaluation
The costs and benefits of reversible lanes for recurring congestion, and special events should be assessed for the test sites.

SHRP 2 Travel Time Reliability Analytical Product Implementation Appendix
C-32
Work Zone Express Lanes
The L07 Guide describes work zone express lanes as “lanes that bypass a freeway work zone without any additional entry or exit points. The targeted application of this treatment is in freeway environments when entire directions of travel must be closed in order to allow for new roadway construction and improvements. Because of the limited access of this treatment, it is naturally complemented with exterior frontage roads to handle traffic that has entry or exit needs within the work zone area.”
“The objective of the work zone express lanes is to allow traffic to move through a work zone area without being inhibited by an arterial street environment. When extensive construction exists along a freeway, traffic must either be diverted to local streets or directed along specially designated express lanes.”
Current FDOT Practice
The PPM provides for the development of Temporary Traffic Control Plans (10.3.1.1) and identifies HOV lanes as a potential demand management strategy for transportation operations within the Temporary Traffic Control Plan (10.3.1.2).
Preliminary Evaluation
The potential of bypass lanes around a construction site is an option already routinely considered in the development of Temporary Traffic Control Plans. FDOT practice is equal or superior to the L07 Guide recommendations.
Recommendation for Field Evaluation
No further evaluation recommended.
TRAFFIC SIGNALS AND CONTROL
Traffic signal and control treatments include Emergency Vehicle Signal Preemption, Queue Jump Lanes, Traffic Signal Improvements, Signal Timing Systems, Ramp Metering/Flow Signals, Temporary Traffic Signals, and Variable Speed Limits/Reductions.
Emergency Vehicle Traffic Signal Preemption
The L07 Guide describes emergency vehicle traffic signal preemption as “a system that allows the normal operation of traffic signals to be interrupted. Typically, traffic signal preemption systems give priority to emergency vehicles by changing traffic signals in the path of the approaching emergency vehicles to green (or in some cases, flashing green) and stopping cross traffic. The objective of traffic signal preemption systems is to reduce the response time of emergency

SHRP 2 Travel Time Reliability Analytical Product Implementation Appendix
C-33
vehicles. Preemption systems also reduce the likelihood of a secondary incident involving an emergency vehicle en route to an incident.”
Current FDOT Practice
Section 7.4.6 of the PPM identifies Department Procedure 750-030-002 regarding signalized intersection locations that should be considered for signal preemption.
Preliminary Evaluation
FDOT practice is equivalent to or superior to the L07 Guide recommendations.
Recommendation for Field Evaluation
No further evaluation required.
Queue Jump Lanes
The L07 Guide describes queue jump lanes as extra lanes “built at congested intersections or ramps for the purpose of allowing transit vehicles, HOVs, or toll-paying vehicles to bypass the queue at the signal or ramp meter.” (see Error! Reference source not found.)10
Current FDOT Practice
The PPM and the FGB do not address the design or application of queue jump lanes.
10 Taken from Figure 69, SHRP2 L07 Design Guide
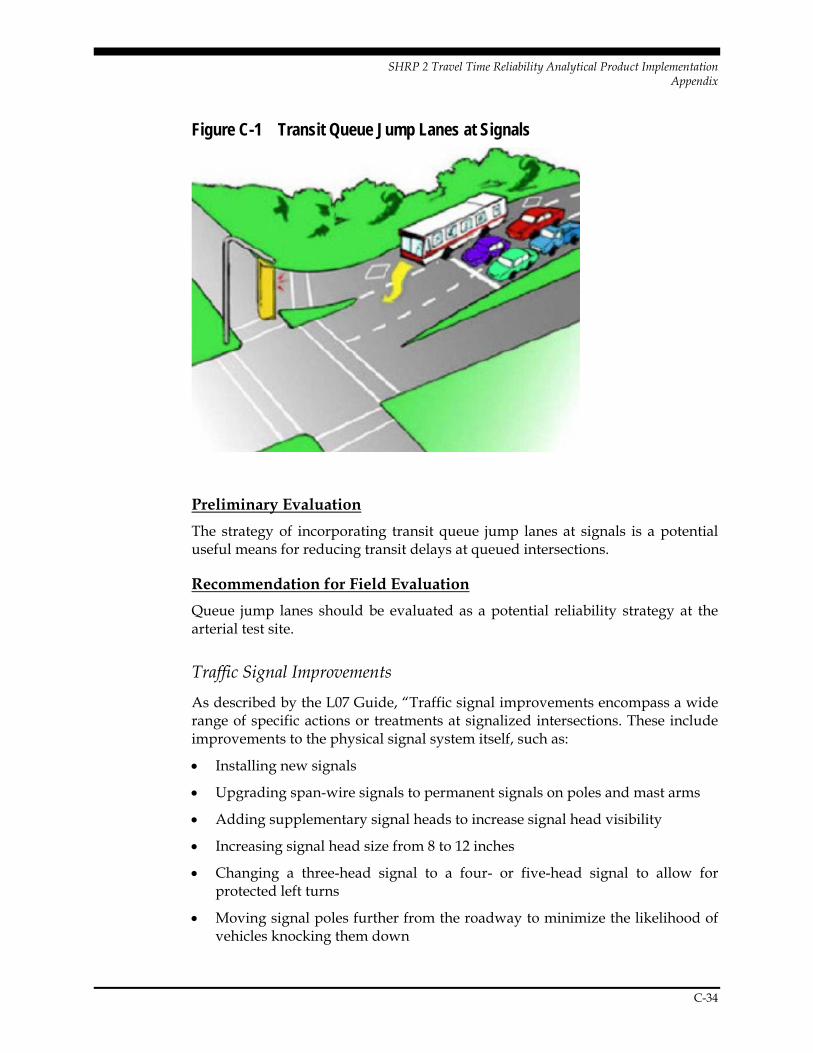
SHRP 2 Travel Time Reliability Analytical Product Implementation Appendix
C-34
Figure C-1 Transit Queue Jump Lanes at Signals
Preliminary Evaluation
The strategy of incorporating transit queue jump lanes at signals is a potential useful means for reducing transit delays at queued intersections.
Recommendation for Field Evaluation
Queue jump lanes should be evaluated as a potential reliability strategy at the arterial test site.
Traffic Signal Improvements
As described by the L07 Guide, “Traffic signal improvements encompass a wide range of specific actions or treatments at signalized intersections. These include improvements to the physical signal system itself, such as:
Installing new signals
Upgrading span-wire signals to permanent signals on poles and mast arms
Adding supplementary signal heads to increase signal head visibility
Increasing signal head size from 8 to 12 inches
Changing a three-head signal to a four- or five-head signal to allow for protected left turns
Moving signal poles further from the roadway to minimize the likelihood of vehicles knocking them down

SHRP 2 Travel Time Reliability Analytical Product Implementation Appendix
C-35
Upgrading to signal controllers that can handle closed-loop, responsive, or adaptive signal timing plans
Installing or upgrading vehicle detection at intersections (inductor loops or cameras)
Treatments may also include improvements to the signal timing plan, such as:
Improving clearance intervals to maximize efficiency while taking safety concerns into consideration
Changing phasing to add or remove protected left turns
Implementing or improving coordination plans along a corridor
Implementing responsive or adaptive signal timing systems
Adjusting timing elements such as min green, max green, gap time, overlaps, etc.
Providing pedestrian phases with pedestrian push buttons and signal heads
In addition, automated enforcement for red-light running or speed violations are signal-related improvements that may be implemented to reduce incidents caused or related to these violations.”
Current FDOT Practice
FDOT already employs these signal improvement strategies to improve safety, reduce delay, and improve reliability.
Preliminary Evaluation
FDOT practice is equivalent or superior to the L07 Guide recommendations.
Recommendation for Field Evaluation
No further evaluation required.
Signal Timing Systems
The L07 Guide describes traffic responsive signal timing systems that can dynamically change timing plans in response to varying traffic conditions. The signal timing plans in this case have been prepared in advance for anticipated traffic conditions.
Traffic adaptive signal timing systems dynamically vary their timing in response to and in anticipation of varying traffic conditions.

SHRP 2 Travel Time Reliability Analytical Product Implementation Appendix
C-36
Current FDOT Practice
Florida has implemented traffic responsive and traffic adaptive signal timing systems. One example is the Smart Tracs systems on U.S. 19 and SR 60 in Pinellas County.
Preliminary Evaluation
FDOT practice is equivalent or superior to the L07 Guide recommendations.
Recommendation for Field Evaluation
No further evaluation required.
Ramp Metering/Flow Signals
Ramp meters are traffic signals on ramps used to control the flow rate for vehicles entering a controlled access facility at an on-ramp. Ramp meters increase the through capacity on the freeway at the ramp merge point by smoothing out and spacing of merging vehicles from the on-ramp.
Current FDOT Practice
The FGB does not currently address ramp signals as an access control strategy (see Section 3.C.8, Access Control). The PPM does not currently address ramp signals (ramp metering). Ramp signals are used only on I-95 in Miami. Phase 1A of the ramp metering system is located along the northbound entrance points from NW 62nd Street north to NW 167th Street on I-95. Phase 1B added signals along southbound entrance points from Ives Dairy Road to NW 62nd Street, as well as two more on I-95's northbound side (at Miami Gardens Drive and Ives Dairy Road). The statistics of the ramp signals are accessible to the public on a dashboard on FDOT ramp signaling program page.11
Preliminary Evaluation
Florida already implements ramp signals at locations it deems appropriate. The I-95 freeway in Miami-Dade County is one example. FDOT practice is equivalent to the L07 Guide recommendations.
11
http://www.sunguide.info/sunguide/index.php/services/services/traffic_management/60/ramp_signaling. http://www.dot.state.fl.us/trafficoperations/Newsletters/2013/2013-May.pdf. dashboard: http://sunguide.info/sunguide/index.php/road_stats

SHRP 2 Travel Time Reliability Analytical Product Implementation Appendix
C-37
Recommendation for Field Evaluation
Since Florida already implements ramp signals where it believes appropriate, no further evaluation is required to help FDOT decide whether or not ramp signals should be included in its list of TSM&O strategies for improving reliability.
Temporary Traffic Signals
The L07 Guide describes temporary traffic signals as being “provided at intersections for a limited period of time.” Temporary signals may be set up for the duration of a construction project, or during an emergency such as a power outage or an emergency evacuation. The objective of temporary traffic signals is to temporarily increase the intersection capacity during a work zone or an emergency.
Current FDOT Practice
The PPM describes in chapter 10.3.1.1 Temporary Traffic Control (TTC) plans as sets of specific plan sheets, references to standard layouts, and/or notes on roadway plans describing how traffic will be controlled through a work zone. A TTC plan is a component of a Transportation Management Plan (TMP). It describes measures to be used for facilitating road users through a work zone, an incident area, or another temporarily disrupted area. The TTC plan is a reference to specific Design Standard Index drawing(s) or is designed specifically for the project. 12
The 2015 FDOT Design Standards describes the use of portable signals in the context of work zone in the Index 606 on Two-Lane, Two-Way, Work Within The Travel Way – Signal Control. Index 600 gives general information on temporary traffic control devices.
Preliminary Evaluation
FDOT practice is equivalent or superior to the L07 Guide recommendations.
Recommendation for Field Evaluation
No further evaluation required.
Variable Speed Limit/Reduction
Variable speed limit or speed harmonization systems seek to reduce crash frequencies by harmonizing the speeds of vehicles on the facility, and giving drivers advanced warning of queues ahead.
12 http://www.dot.state.fl.us/rddesign/PPMManual/2012/Volume1/Chap10.pdf

SHRP 2 Travel Time Reliability Analytical Product Implementation Appendix
C-38
Figure C-1 Example of Lane by Lane Variable Speed Limits
Source: Figure 83, SHRP2 L07 Guide.
Current FDOT Practice
In 2008, FDOT implemented Variable Speed Limit (VSL) system on the I-4 corridor in Orlando. Since its implementation, it was noticed that the majority of traffic exceeds the speed limit by more mph when the speed limit is reduced versus when it is at the baseline level. The VSL system currently operating on I-4 is not improving traffic safety in terms of rear-end collisions. Because the motorists are not respecting the reduced speeds, the full benefit of the VSL system cannot be evaluated and cannot reach its full potential. The University of Florida conducted a study on VSL for FDOT and came up with recommendations for better VSL management practice. 13
Preliminary Evaluation
FDOT has limited experience with lane-by-lane speed harmonization and advanced queue warning. This strategy would be worth evaluating to determine if it should be considered for wider application in Florida, especially in combination with other lane management strategies such as temporary shoulder lane use.
Recommendation for Field Evaluation
Variable speed limits and advanced queue warning should be evaluated on the freeway test site using the L07 Cost Benefit tool. However, the L07 Tool does not currently have cost and benefit assessment capabilities for variable speed limits. Consequently no tests were performed.
13 http://ntl.bts.gov/lib/45000/45900/45901/FDOT_BDK77_977-11_rpt.pdf

SHRP 2 Travel Time Reliability Analytical Product Implementation Appendix
C-39
TECHNOLOGY
Technology treatments include electronic toll collection, and over-height vehicle detection systems.
Electronic Toll Collection
Electronic toll collection reduces or eliminates toll plaza congestion, delays, and crashes.
Current FDOT Practice
FDOT has extensive experience with electronic toll collection.
Preliminary Evaluation
FDOT practice is equal to or superior to the L07 guidance.
Recommendation for Field Evaluation
No further evaluation required.
Over-Height Vehicle Detection System
An over-height vehicle detection system is installed upstream of an oncoming overhead height restriction (could be an overpass, tunnel, etc.). The detector, when activated, causes a beacon to flash warning the driver that the vehicle height exceeds that of an oncoming height restriction. When installed sufficiently upstream, the beacon can advise drivers to take an alternate route. Closer to the restriction, the beacons warn the driver to exit the facility.
Current FDOT Practice
Florida is using light beam type of Early Warning Detection Systems (EWDS) to warn over-height vehicles. Over-height vehicle detectors are used for the Port of Miami Tunnel. Seven over-height vehicle detectors were put in place by SICE.14
14 ftp://ftp.dot.state.fl.us/LTS/D6/Professional%20Services/Fiscal%20Year%202013-2014/14638%20-%20251156-5-72-01/Final%20Selection/Presentations/CSA%20Central.pdf. http://www.dot.state.fl.us/structures/DesignConf2006/Presentations/session66/Final-66Piedrahita.pdf. http://www.sice.com/contenidos/noticias/trafico/12_12_12_Tunel_Miami.html http://www.miamidade.gov/portmiami/library/brochures/tunnel.pdf

SHRP 2 Travel Time Reliability Analytical Product Implementation Appendix
C-40
Preliminary Evaluation
Over-height vehicle detection systems are potentially a useful device to reduce the occurrence of vehicle-structure collisions, especially on routes with substandard clearances or routes with heavy truck volumes.
Recommendation for Field Evaluation
No further evaluation recommended.
EMERGENCY RESPONDER NOTIFICATION
Emergency responder notification treatments include reference location signs, and roadside call boxes.
Reference Location Signs
Reference location signs provide precise location information to road users, emergency responders and maintenance personnel. By reducing confusion as to incident locations, the signs can improve incident response times.
Current FDOT Practice
FDOT provides mile marker signs on the state highway system.
Preliminary Evaluation
FDOT practice is consistent with L07 recommendations.
Recommendation for Field Evaluation
No further evaluation is recommended.
Roadside Call Boxes
Roadside call boxes are telephone boxes located next to the roadway. They can reduce the time needed for some drivers to report an incident.
SHRP2 L07 Recommendation
Roadside call boxes may be most beneficial where cell phone coverage is poor.
Current FDOT Practice
FDOT had 2,752 push button type call boxes, 58 base stations and 5 consoles. Call boxes were located every mile on Florida’s Turnpike. Due to a significant decline in the use of call boxes over the years and the development of its ITS Program, FDOT decided to remove all call boxes, which belong to an antiquated technology. Call boxes should have been removed by January 31, 2014 according to FDOT plans. The removal of the concrete pad should occur by August, 2014.

SHRP 2 Travel Time Reliability Analytical Product Implementation Appendix
C-41
Consoles should be disposed of once the last call box is removed, while the base stations will remain in place in standby mode until their license expires or another need is found.15
Preliminary Evaluation
Given the generally good cell phone coverage in Florida and the prevalence of cell phones, call boxes do not appear to provide any benefit to Florida, in terms of reduced incident reporting times and improved reliability.
Recommendation for Field Evaluation
No further evaluation is recommended.
FIELD TESTS OF L07 GUIDANCE The previous evaluation of the L07 Guide against FDOT design guidance identified the following L07 treatments for further evaluation for specific freeway and arterial facilities:
Implementation of more frequent emergency cross overs with controlled gates on freeways in urban areas.
Extra height median barriers on freeways and suburban arterials.
Drivable shoulders on freeways.
Alternating shoulders on freeways with right of way constraints.
Emergency pull-offs and crash investigation sites on freeways with right of way and shoulder constraints.
Reversible lanes on arterials and freeways with high peak hour directional factors.
Transit queue jump lanes on arterials.
Variable speed limits (Speed Harmonization) on freeways to reduce crashes and improve reliability.
These design treatments are highlighted in Table 4-2.
15 Sources:
http://www.dot.state.fl.us/trafficoperations/its/Projects_Telecom/MAS.shtm http://www.news4jax.com/blob/view/-/22354928/data/1/-/us34roz/-/FDOT-chart-on-call-box-calls.pdf http://en.wikipedia.org/wiki/Florida's_Turnpike#Call_boxes

SHRP 2 Travel Time Reliability Analytical Product Implementation Appendix
C-42
Table C-1 SHRP2 L07 Reliability Treatments for Field Evaluation Design-Related Treatments Eval? Non-Design Treatments Eval?
Medians Lane Types and Uses Emergency crossovers Yes Contra-flow lanes—evacuation No Moveable traffic barriers No Contra-flow lanes—work zones No Controlled/gated turnarounds for Urban Ap Yes HOV lanes/HOT lanes No Movable cable median barrier No Dual facilities (bypass lanes) No Extra-height median barrier Yes Reversible lanes Yes Traversable medians Yes Work zone express lanes No Shoulders Accessible shoulder No Traffic Signals and Control Drivable shoulder Yes EV Traffic signal preemption No Alternating shoulder Yes Transit queue jump lanes Yes Portable incident screens No Traffic signal improvements No Emergency pull-offs/Turnouts Yes Signal timing systems No Bus Turnouts No Ramp metering/flow signals No Crash Investigation Sites Temporary traffic signals No Crash investigation sites Yes Variable speed limit/ reduction Yes Right-of-way Edge Locked gate emergency access No Technology Arterials and Ramps Electronic toll collection No Ramp widening (Add lanes) No Over-height vehicle detection system No Ramp closure (time of day, temporary) No Off-Ramp terminal traffic control No Emergency Resp. Notification Ramp turn restrictions (time day, event) No Reference location signs No Detours Roadside call boxes No Improvements to detour routes No Truck Incident Design Considerations Weather Runaway truck ramps No Fog detection No Construction Road Weather Info. Syst. (RWIS) No Reduced construction duration No Flood warning system No Improved work site access/circulation No Wind warning system No Animal-Vehicle Collision Design Wildlife fencing, over/underpasses No Weather Snow fences No Blowing sand mitigation No Anti-icing systems No
“No” means either that current FDOT practice is currently superior or equal to the L07 recommendation, or that that particular design treatment is not applicable in Florida.

SHRP 2 Travel Time Reliability Analytical Product Implementation Appendix
C-43
Evaluation Approach
The purpose of the field tests of some of the L07 treatments was to obtain more site specific information on the likely benefits and difficulty of implementing them on typical FDOT facilities. The evaluation proceeded as follows:
Assemble freeway and arterial data.
Identify feasible locations on each facility for L07 treatments that are not already implemented on the facility.
Field inspect facilities.
Review results with District Roadway Design Engineer.
Test freeway L07 treatments in L07 tools, where feasible.
Compare predicted benefit/cost ratios.
The field evaluations were conducted on the I-95 freeway and Okeechobee arterial sites shown in Error! Reference source not found. and .
Freeway Site – I-95 (SR 9)
The freeway site selected is I-95 in Broward County starting with, and including, the Oakland Park Boulevard interchange through the SW 10th Street interchange, a distance of approximately 10.3 miles. I-95 is a core-urbanized freeway facility with 4 general use lanes and one time-restrictive high occupancy vehicle (HOV) lane in each direction. The I-95 study limits are shown in Error! Reference source not found..
Arterial Site – Okeechobee Boulevard (SR 704)
The arterial site selected is Okeechobee Boulevard in Broward County from SR 7 to U.S. 1 in downtown Palm Beach, a distance of approximately 9 miles. Okeechobee Boulevard has an 8-lane cross section with designated bike lanes. The section from SR 7 to Jog Road has a 4-foot outside shoulder, designated as a bike lane, with no curb. The section from Jog Road to U.S. 1 has a 4-foot outside shoulder, designated as a bike lane, with curb and gutter.
The Okeechobee Boulevard study limits are shown in Figure 4-15.

SHRP 2 Travel Time Reliability Analytical Product Implementation Appendix
C-44
Figure C-1 Broward I-95 Freeway Study Limits

SHRP 2 Travel Time Reliability Analytical Product Implementation Appendix
C-45
Figure C-2 Okeechobee Blvd. Study Limits
Source for Base Map: Google Maps
Screening Approach
The treatments recommended for field investigation were reviewed against aerial and street view imagery (e.g. Google Earth). Features in the aerial images were measured to verify the feasibility of the treatments along the various corridors.
Both of the test corridors have been driven to verify that the aerial and street view images being used represent current conditions.
District 4 personnel conducted a review of the Preliminary Evaluation of SHRP2 L07 Design Guide and Field Evaluation Plan and the findings presented earlier in this section. Their feedback and inputs have been provided in the following paragraphs of this section.
I-95 (SR 9) EVALUATION
Emergency Crossovers
All interchanges in the I-95 study section offer direct connections (i.e. not system interchanges) and therefore and U-turns at interchanges are possible. Additionally, the PPM states that emergency crossovers should not be located within urban areas nor within 1.5 miles of any interchange.
As the I-95 study section is in an urban area and the interchanges are spaced such that Emergency Crossovers would create spacing issues as it relates to the PPM, this site is not a good candidate for this treatment.

SHRP 2 Travel Time Reliability Analytical Product Implementation Appendix
C-46
Controlled/Gated Turnarounds
Similar to Median Crossovers, the interchanges within the I-95 study section offer direct connections and are spaced such that an uncontrolled opening would create spacing issues as it relates to FDOT guidelines. However, as Controlled/Gated Turnarounds are not addressed in the FDOT PPM or Green book, there may be flexibility to perform a pilot study within the study section.
The cross-street spacing of the interchanges, from south to north, of the I-95 study area are shown below in Table 4-3. Mile Posts are taken from FDOT Straight Line Diagrams.
Table C-1 Interchange Cross Street Spacing I-95
Segment Number
From To Distance (mi)
1 Oakland Park Blvd (MP 13.453) Commercial Blvd (MP 15.090) 1.637
2 Commercial Blvd (MP 15.090) Cypress Creek Rd (MP 16.287) 1.197
3 Cypress Creek Rd (MP 16.287) Atlantic Blvd (MP 18.391) 2.104
4 Atlantic Blvd (MP 18.391) Copans Rd (MP 20.453) 2.062
5 Copans Rd (MP 20.453) Sample Rd (MP 21.601) 1.148
6 Sample Rd (MP 21.601) SW 10th St (MP 23.674) 2.073
Providing a Controlled/Gated Turnaround between interchanges spaced more than 2 miles apart may be an option for speeding emergency responder access to incident scenes. From the above information, the candidate sites are:
Segment 3 –Cypress Creek Road to Atlantic Boulevard
Segment 4 – Atlantic Boulevard to Copans Road
Segment 6 – Sample Road to SW 10th Street
Screening mid-way points on the segments shows that several have an overpass or underpass at or near the mid-way point between interchanges. Shifting the Controlled/Gated Turnaround to be in a practical location may reduce the benefit by making it significantly closer to one interchange than another. With that in mind, the best candidate site in the I-95 study is:
Segment 3 –Cypress Creek Road to Atlantic Boulevard
District Roadway Design Engineer Review: Upon discussion with FDOT D4 Design staff, it was determined this location would not be a good candidate, as the spacing standard set for emergency crossovers would most likely be applied.

SHRP 2 Travel Time Reliability Analytical Product Implementation Appendix
C-47
Extra Height Median Barrier
The median for the entire length of the I-95 study section is currently a jersey-style median barrier with a non-crash worthy median height extension installed on top of the concrete barrier. At this point, it is unknown if any before/after or benefit-cost studies have been carried out as part of its installation.
Although the treatment is in place, this location would be a candidate for hypothetical evaluation of the benefits of extra height median barriers.
Traversable Medians
As per L07 recommendations, Traversable Medians are not appropriate for freeways. Please refer to the Controlled/Gated Turnarounds section for a freeway treatment intended to provide better access by emergency responders to incident sites.
Drivable Shoulder
The typical width of the paved shoulder through the study section of I-95 is 10 feet or greater and can be considered as allowable for temporary use by mainline traffic as a travel lane. Allowing traffic to drive on the shoulder can reduce the overall delay during incidents or evacuations.
Design Considerations
Depending on the intended use and frequency of use of drivable shoulders several design considerations should be assessed.
Widening the shoulders to the optimal 12 feet may not be cost-feasible through interchanges or at bridges. The structural and geotechnical costs associated with providing the extra width are likely prohibitive. At some locations, there may be opportunity to reduce the width of one shoulder to shift traffic and create a 12 foot shoulder on the existing pavement.
It is not current FDOT practice to provide full depth pavement for shoulders on freeways. Allowing heavy vehicles to run on the current shoulders may lead to rapid structural failure of the pavement. Therefore, allowing heavy vehicles to run on the shoulders may not be allowable during incidents. Installing full-depth 12-foot shoulder should be considered during a project’s design phase. Retro-fitting full-depth pavement is likely cost prohibitive.
Similarly, the super-elevation of the shoulder is often different from the mainline, and will be expected to have reverse super-elevation around curves based on the FDOT Standard Indexes. If it is intended for hard-shoulder running to be permitted at or near the posted speed limit, super-elevation changes, and any subsequent changes to the drainage, will need to be considered.

SHRP 2 Travel Time Reliability Analytical Product Implementation Appendix
C-48
Sight distance around horizontal curves should be considered before implementing drivable shoulders. A detailed review may find the shoulders can only safely be driven on at slower speeds. Similarly, if driving on the outside shoulder is permitted, the created short merge lengths at ramp merges requires additional consideration. Therefore, drivable shoulders may only be practical when speed limits have been lowered through work zones, variable speed limits, or other special traffic control.
District Roadway Design Engineer Review: Upon discussion with FDOT D4 Design staff, shoulders are currently kept clear for emergency vehicles or moving disabled vehicles during incidents. Drivable shoulders would need to be considered in conjunction with emergency pull-offs and/or crash investigation sites and a managed lane implementation with overhead gantries for dynamically designating and warning drivers of upcoming lane closures (see discussion under variable speed limit treatment).
Alternating Shoulder
The typical width of the paved shoulder through the study section of I-95 is 10 feet or greater. The L07 Guide describes alternating shoulders as a design treatment “used on roadways without sufficient width to provide full shoulders on both sides of the roadway.” The study section of I-95 is currently able to provide full shoulders and is not a good candidate site for this treatment.
Emergency Pull-Offs / Turnouts
The L07 Guide describes emergency pull-offs and vehicle turnouts as “short sections of shoulder provided on routes that either have no shoulder or very narrow shoulders”. The typical width of the paved shoulder through the study section of I-95 is 10 feet or greater, which is wider than the typical 8-feet wide vehicle turnouts. The study section of I-95 is currently able to provide full shoulders and is not a good candidate site for emergency pull-offs as a stand-alone treatment.
There is adequate right-of-way along the study section between interchanges, that would allow for emergency pull-offs in conjunction with drivable shoulders. Therefore, this study section of I-95 is a good candidate site for emergency pull-offs when considered in conjunction with drivable shoulders.
Crash Investigation Sites
Similar to the above, crash investigation sites are a cost effective treatment for facilities with inadequate shoulders. The typical width of the paved shoulder through the study section of I-95 is 10 feet or greater. The study section of I-95 is currently able to provide full shoulders and is not a good candidate site for this treatment.

SHRP 2 Travel Time Reliability Analytical Product Implementation Appendix
C-49
Summary of Shoulder and Crash Investigate Site treatments
For the study section of I-95, these treatments are not currently appropriate. However, these treatments could be considered in conjunction with future improvements (e.g. upcoming I-95 Interchange Master Plan Improvements or I-95 Express) at locations where additional pavement width is not cost feasible.
Reversible Lanes
Reversible lanes work best when the directional traffic flow is on the order of 2:1 (66%:34%) during special events or peak periods. The planning level design hour D factor for the study section of I-95 is 50.60%. Therefore, the split between northbound and southbound traffic is likely not high enough to support reversible lanes.
Also, express lanes in the median are currently being planned for this section of I-95, that will be 1-lane in each direction. For the purposes of special events or hurricane evacuation, controlled/gated barrier sections between the express lanes could be considered.
Transit Queue Jump Lanes
The L07 Guide describes queue jump lanes in the context of freeways as extra lanes on or at ramps for the purpose of allowing transit vehicles, HOVs, or toll-paying vehicles to bypass the queue at the signal or ramp meter. The on-ramps along I-95 do not currently have ramp signals. Ramp signals are being proposed as part of the Atlantic Boulevard, Copans Road, Sample Road System Interchange Modification Report (SIMR).
Additionally, as per the Preliminary Evaluation of SHRP2 L07 Design Guide and Field Evaluation Plan, the queue jump lanes should only be evaluated at the arterial site.
This study section of I-95 is not a good candidate site for this treatment.
Variable Speed Limit/Reduction
Variable speed limit (VSL), or speed harmonization, systems seek to reduce crash frequencies by harmonizing the speeds of vehicles on the facility, and giving drivers advanced warning of queues ahead. This can also aid in reducing secondary crashes in a similar manner.
The VSL system on I-4 in Orlando has not shown improved traffic safety in terms of rear-end crashes because the motorists are not respecting the speeds. The University of Florida conducted a study on VSL for FDOT and developed recommendations for better VSL management practice. The recommendations pertain to changes in the VSL algorithms, sign locations, and detector locations.

SHRP 2 Travel Time Reliability Analytical Product Implementation Appendix
C-50
The study section regularly experiences congestion and incidents, and is therefore a good candidate site for this treatment and should be evaluated using the L07 Cost Benefit tool. However, this tool does not currently provide costs and benefit defaults for evaluating VSL. Consequently, VSL was not evaluated at this time.
OKEECHOBEE BOULEVARD (SR 704)
Emergency Crossovers
The L07 Guide identifies Emergency Crossovers on arterials to improve reliability by facilitating emergency response and enabling rerouting of traffic. The LO7 Guide, Plans Preparation Manual, AASHTO Greenbook and Florida Greenbook does not provide a recommended spacing for emergency crossovers on non-freeways.
There are regular signalized intersections and directional median openings along the SR 704 study corridor, with approximately 0.6 miles being the greatest distance between U-turn opportunities. The study section of SR 704 is currently able to provide regular crossover opportunities and is not a good candidate site for this treatment.
The cross-street spacing of the signalized intersections, from west to east, of the Okeechobee Blvd study area are shown below in Error! Reference source not found.. Mile Posts are taken from FDOT Straight Line Diagrams.
Controlled/Gated Turnarounds
There are regular signalized intersections and directional median openings along the SR 704 study corridor, with approximately 0.6 miles being the greatest distance between U-turn opportunities. Similar to Emergency Crossovers, the study section of SR 704 is currently able to provide regular crossover opportunities and is not a good candidate site for this treatment.
Extra Height Median Barrier
The median along SR 704 is a raised median with curb that varies between concrete and landscaping as the median element. Additionally, the SR 704 corridor is relatively straight. Also, as per the Preliminary Evaluation of SHRP2 L07 Design Guide and Field Evaluation Plan, this treatment does not appear appropriate for evaluation at the arterial test sites. This is not a good candidate site for this treatment.

SHRP 2 Travel Time Reliability Analytical Product Implementation Appendix
C-51
Traversable Medians
The average median opening spacing along the corridor is less than 0.2 miles, with approximately 0.6 miles being the greatest distance between U-turn opportunities. This site is a good candidate for testing the L07 cost/benefit analysis tool for testing traversable median treatments. The purpose of the evaluation would be to assess whether the tool is appropriate for this kind of median type analysis, and that the tool adequately incorporates the safety differences between non-traversable and traversable medians.
District Roadway Design Engineer review: Upon discussion with FDOT D4 staff, one location along the corridor that may be a good candidate for a traversable median, is between the I-95 northbound off-ramp and the directional median opening across from the West Palm Beach Marriott. Currently there is no break in the median in that 0.6 mile section. The median is a raised median with landscaping and F-type curb. Based on aerial images, there are locations in the median where a mountable curb (i.e. D-type) could be installed with articulated blocks to reinforce the soil median and allow emergency vehicles to pass over the median. Articulated blocks are used at other grass medians in the District to provide a stable driving surface, but allows grass to grow between blocks, hiding the appearance of a crossing to general motorists.
Table C-1 Signalized Intersection Cross Street Spacing on Okeechobee Okeechobee
Blvd Segment Number
From To Distance (mi)
1 SR 7 (MP 0.00) Flagler Parkway (MP 0.689) 0.689 2 Flagler Parkway (MP 0.689) Sansburys Way (MP 1.141) 0.452 3 Sansburys Way (MP 1.141) Nerean Chistian / Andros Isle (MP 1.557) 0.416 4 Nerean Chistian / Andros Isle (MP 1.557) Benoist Farms Rd (MP 1.913) 0.356 5 Benoist Farms Rd (MP 1.913) Golden Lakes Blvd (MP 2.161) 0.248 6 Golden Lakes Blvd (MP 2.161) Skees Rd (MP 2.670) 0.509 7 Skees Rd (MP 2.670) Jog Rd (MP 3.034) 0.364 8 Jog Rd (MP 3.034) Vista Parkway (MP 3.388) 0.354 9 Vista Parkway (MP 3.388) FL Turnpike Ramps (MP 3.650) 0.262 10 FL Turnpike Ramps (MP 3.650) Meridian Road (MP 4.164) 0.514 11 Meridian Road (MP 4.164) Haverhill Rd (MP 5.053) 0.889 12 Haverhill Rd (MP 5.053) Military Trail (MP 5.564) 0.511 13 Military Trail (MP 5.564) Biscayne Blvd (MP 5.764) 0.200 14 Biscayne Blvd (MP 5.764) Indian Rd (MP 5.980) 0.216 15 Indian Rd (MP 5.980) Palm Beach Lakes Blvd (MP 6.214) 0.234 16 Palm Beach Lakes Blvd (MP 6.214) Spencer Dr (MP 6.643) 0.429 17 Spencer Dr (MP 6.643) Loxahatchee Dr (MP 6.854) 0.211 18 Loxahatchee Dr (MP 6.854) Congress Ave (MP 7.092) 0.238 19 Congress Ave (MP 7.092) Chillingworth Dr (MP 7.352) 0.260 20 Chillingworth Dr (MP 7.352) I-95 SB Off Ramp (MP 7.609) 0.257 21 I-95 SB Off Ramp (MP 7.609) I-95 NB Off Ramp (MP 7.881) 0.272 22 I-95 NB Off Ramp (MP 7.881) Parker Ave (MP 8.601) 0.720 23 Parker Ave (MP 8.601) Sapodilla Ave (MP 8.778) 0.177

SHRP 2 Travel Time Reliability Analytical Product Implementation Appendix
C-52
Okeechobee Blvd Segment
Number From To Distance
(mi) 24 Sapodilla Ave (MP 8.778) Rosemary Ave (MP 8.881) 0.103 25 Rosemary Ave (MP 8.881) Quadrille Blvd (MP 9.011) 0.130
Drivable Shoulder
The study section of Okeechobee Blvd has an 8-lane cross section with designated bike lanes, curb and gutter, and posted speed limits of 50 and 45 (and very short section at 35 mph). There is no paved right-hand shoulder on Okeechobee Blvd. As per the Preliminary Evaluation of SHRP2 L07 Design Guide and Field Evaluation Plan, a 12 foot paved shoulder for urban arterials is likely to be cost prohibitive due to right of way costs. Therefore, this study section of SR 704 is not a good candidate site for this treatment.
Alternating Shoulder
Similar to Drivable Shoulders, a full size shoulder for urban arterials is likely to be cost prohibitive due to right of way costs. Therefore, this study section of SR 704 is not a good candidate site for this treatment.
Emergency Pull-Offs / Turnouts
The current outside shoulder (which is used by the bike lane) is approximately 4 feet. Vehicle turnouts are typically at least 8 feet wide. An additional 4 feet would be needed in locations identified for emergency pull-offs and vehicle turnouts. Currently, bus turnouts exist between Benoist Farms Rd and Congress Ave. There is no guidance on spacing of pull-offs relative to bus turnouts, turning bays, or driveways. There may be opportunity for Emergency Pull-Offs between SR 7 and Benoist Farms Rd.
District Roadway Design Engineer review: Upon discussion with D4 Design staff, it was determined this was not a good candidate site due to the bike lane on the shoulder and relatively frequent driveway access points.
Crash Investigation Sites
Similar to the above, crash investigation sites are a cost effective treatment for facilities with inadequate shoulders. From SR 7 to Jog Road, there is a 4-foot paved shoulder with bike-lane designation. There is no curb and some locations appear to have adequate space for a 30 foot wide and 85 foot long crash

SHRP 2 Travel Time Reliability Analytical Product Implementation Appendix
C-53
investigation site. Therefore, this study section of SR 704 is a good candidate site for this treatment.
The study section from Jog Road to U.S. 1 also has a 4-foot paved shoulder with bike-lane designation. However, its edge of pavement is treated with curb and gutter. This section is relatively constrained and does not appear to be a good candidate for this treatment.
Reversible Lanes
Reversible lanes work best when the directional traffic flow is on the order of 2:1 (66%:34%) during special events or peak periods. The planning level design hour D factor for the study section of S.R 704 is 60.60%. In addition, the median and left turn pockets would make implementation of a reversible center lane difficult.
Transit Queue Jumps
The L07 Guide describes queue jump lanes in the context of arterials as extra lanes at congested intersections for the purpose of allowing transit vehicles, HOVs, or toll-paying vehicles to bypass the queue at the signal. There are currently no transit queue jump lanes or transit signal priority along Okeechobee Blvd. Transit signal priority is planned for SR 704 from SR 7 to Benoist Farms Rd.
There appears to be available right of way along the corridor from SR 7 to Military Trail that would allow for an additional auxiliary lane to accommodate transit queue jumps. Alternatively, several intersections have right-turn only lanes. Allowing busses to use the right-turn only lane as the queue jump lane at intersections and providing a receiving auxiliary through lane is an additional alternative to implementing this treatment.
East of Military Trail, the signalized intersections would not be good candidate sites as it does not appear there is sufficient available ROW to accommodate a new transit queue jump lane or a receiving auxiliary through lane.
This study section of SR 704 from SR 7 to Military Trail is a good candidate site for this treatment. However, Palm Tran service is non-existent west of Benoist Farms Road. East of that point, Palm Tran Route 43 operates 2 buses per hour. Palm Tran Route 44 also operates 2 buses per hour on a short stretch of Okeechobee Blvd. between Jog Road and Drexel Road. At these low frequencies, a transit queue jump lane is likely to be cost ineffective, unless it can be accomplished by restriping and signing an existing turn lane.
Variable Speed Limit/Reduction
As per the earlier preliminary evaluation, this treatment has its greatest safety and non-recurrent congestion effects on high speed facilities. Thus, it is most applicable to freeways and less applicable to arterials. Therefore, this study section of SR 704 is most likely not a good candidate site for this treatment.

SHRP 2 Travel Time Reliability Analytical Product Implementation Appendix
C-54
EVALUATION OF LO7 B/C TOOL This section summarizes the testing and evaluation of the L07 benefit/cost (b/c) spreadsheet tool. The tool was tested on the nine design and non-design treatments identified earlier for field testing.
Highlights of the SHRP2 L07 Benefit Cost Tool
The SHRP2 Project L07 Analysis Tool (L07 Tool) is designed to use a reliability framework to analyze the effects of highway geometric design treatments on nonrecurrent congestion. This tool is designed to analyze a generally homogenous segment of a freeway (with successive interchanges). The input data for the software includes: geometries, demand, incident, weather, special event, work zones and treatment options – of these, defaults are sometimes available. Based on these data, the tool calculates base reliability conditions. The user can then analyze the effectiveness of a variety of treatments by choosing from a list with default treatment effects and cost parameters (options to define different treatments with their own parameters are also available).
The tool predicts cumulative Travel-Time Index (TTI) curves for each hour of the day, from which other reliability variables are computed and displayed. The tool also calculates cost-effectiveness by assigning monetary values to delay and reliability improvements, and comparing these benefits to expected cost over the life of each treatment.
The L07 tool uses the reliability equations from SHRP2 L03 to estimate the effects of various treatments on travel time reliability. Its methodology and assumptions are documented in the SHRP2 L07 report, “Identification and
Evaluation of the Cost-Effectiveness of Highway Design Features to Reduce Nonrecurrent Congestion,” available on the SHRP2 website.
It uses a number of lookup tables to estimate the benefits for a number of types of treatments (use of shoulder, temporary detours, runaway truck ramp, etc.)
The L07 tool converts the estimates into an annual benefit stream to do the B/C analysis
The L07 tool accounts for the following costs:
Capital costs
O&M costs
Delay
Reliability
Safety
Other user-specified costs; these have to be entered directly

SHRP 2 Travel Time Reliability Analytical Product Implementation Appendix
C-55
The L07 tool does not explicitly account for other costs (although the user could separately estimate these costs and enter them directly into the box provided):
Health effects of criteria pollutants
Greenhouse gas emissions
The L07 tool uses standard B/C methods (discounting, etc.) to develop an overall B/C measure. The default discount rate of 7.00% in the L07 tool is far above the generally acceptable value for long-term investments.
The L07 tool allows for modeling only one set of treatments at a time, as a scenario. It does not appear possible to use the tool to directly make side-by-side comparisons of benefits and costs of different treatment packages.
Reliability costs are estimated as follows:
The L03 equations are used to estimate the effects of whatever treatments are selected on various TTI percentiles
These estimates are used to calculate a standard deviation of travel time
A reliability ratio – input by the user (a default is provided) – is used to calculate the value of changes in reliability
The L07 tool is currently not designed to evaluate arterial improvements, so testing of the L07 tool on the arterial site could not be performed.
Application of L07 B/C Tool To Test Sites
This section documents the experience of using the SHRP2 Project L07 Analysis Tool to evaluate treatment options on a stretch of I-95 Freeway in Broward County, between and including SW 10th Street and West Oakland Park Blvd interchanges (approximately 10.3 miles).
Data Requirement
Table 4-5 lists the input data called for by the L07 Tool and whether default values are available.
Input data was gathered and inputted into the L07 Tool for the study segments on I-95 shown in Table 4-6.
Table C-1 SHRP2 Project L07 Analysis Tool Data Needs Data Type Need Available
Geometry Length Free-flow speed can be automatically calculated from the rest of the geometric inputs
Terrain Area Type Lanes Lane Width

SHRP 2 Travel Time Reliability Analytical Product Implementation Appendix
C-56
Data Type Need Available Right-side lateral clearance Interchange per mile FFS
Demand Hourly volume for 24 hours Default values available for percentage trucks and RVs %Trucks (each hour for 24 hours)
%RVs (each hour for 24 hours) 30th highest hour of the year excluding weekends and holidays for each of the 24 hour time-slice.
Incident Crashes per year (by severity type) Can estimate the numbers of non-crash incidents base on relations to crash percentages
Non-crash incidents per year (by incident type) Crash cost by severity type
Weather Average hourly precipitation throughout the year for rain and snow
Annual precipitation values are available in absence of detailed weather data at weather stations across the US, including Fort Lauderdale (closet site). A 10-year average is used which was collected from 2001-2010.
Special Event Can enter up to 9 event types and frequency (in number of days/year) for each event
Omission allowed when no data is available - not critical for the tool to work Each event type: enter % demand increase for each affected
hour (within 24 hours) Work Zones – Short Term (<30 days)
Can enter up to 9 work zone types and number of active days per year
Omission allowed when no data is available - not critical for the tool to work Each work zone type: enter number of lane closed for each
affected hour (within 24 hours) Work Zones – Long Term (>30 days)
Can enter 1 long term work zone for each site within a year Omission allowed when no data is available - not critical for the tool to work
o Duration of work zone (days/year) o Number of lane closed o Lateral clearance from edge of travel lane to work zone (ft.) o % traffic diversion for each affected hour (within 24 hours)
Treatments Can evaluate up to 10 treatments simultaneously Defaults available for most treatment options. For each treatment type:
o % crash reduction (by severity) o Treatment service life (years) o Construction cost ($) o Annual maintenance cost ($)
Table C-2 I-95 Study Segments I-95 Segment
Number From To Distance (mi)
1 Oakland Park Blvd (MP 13.453) Commercial Blvd (MP 15.090) 1.637
2 Commercial Blvd (MP 15.090) Cypress Creek Rd (MP 16.287) 1.197
3 Cypress Creek Rd (MP 16.287) Atlantic Blvd (MP 18.391) 2.104
4 Atlantic Blvd (MP 18.391) Copans Rd (MP 20.453) 2.062
5 Copans Rd (MP 20.453) Sample Rd (MP 21.601) 1.148

SHRP 2 Travel Time Reliability Analytical Product Implementation Appendix
C-57
I-95 Segment Number From To Distance
(mi)
6 Sample Rd (MP 21.601) SW 10th St (MP 23.674) 2.073
Data Challenges
For this stretch of I-95, the posted speed limit is 65, and under Florida convention, free-flow speed (FFS) is estimated by adding 5 miles per hour to the posted speed limit. Therefore the free-flow speed is estimated to be 70, which is inputted into the software directly under “Measured FFS, mph” within the Geometry Inputs. Even though this FFS of 70 is not measured, this is the only way to put in a customized FFS without using the tool’s calculated FFS value, which comes out to 75 mph in our case.
Of the six study segments presented above in Table 4-6, only Segment 6 has a continuous count station capable of providing the hourly directional traffic data that the L07 Tool requires. From the continuous data, for each of the 24 hours, the 30th highest hourly volume (excluding weekend and holidays) for all of 2013 is selected for input into the software. The other segments each only have a summary of data in the form of AADT by direction, K factor, D factor, and T (truck percentage) factor for every year from 1998 to 2013. Since 2013 AADT is available for all six study segments, a set of relative factors is developed and applied to the hourly volumes of Segment 6 to estimate the sets of hourly volumes for the other segments by direction.
Because of the way incident data is presented/classified in Florida, injuries are not separated by minor and major. Thus for the category of “Major Injury & Fatal”, only fatal incidents are counted; and for “Minor Injury”, all incidents with injuries are counted. In addition, since the Florida data does not identify “Property Damage Only” incidents specifically, their total is assumed to be the remainder of subtracting fatal and injury incidents from the total number of crash incidents for each segment. Since each incident is also described by a post mile and a direction of travel for each vehicle involved, the incidents can be grouped into each study segment by direction.
As for the Event input, after thoroughly examining the continuous demand data of Segment 6, the events related to Fridays at the beginning of various schools’ Spring Breaks are deemed to be the most significant for this stretch of I-95. This traffic-increasing event occurs approximately three days in the year during March. A set of adjustment factors is developed from these data and inputted into the L07 software for all 24 hours.
The L07 Tool also provides a list of 19 treatments available with default parameters, seven of which overlap with the ones recommended for this stretch of I-95. Four of the recommended treatments are not available with default values in the L07 Tool (see Table 4-7 below). For these four, the tool allows users
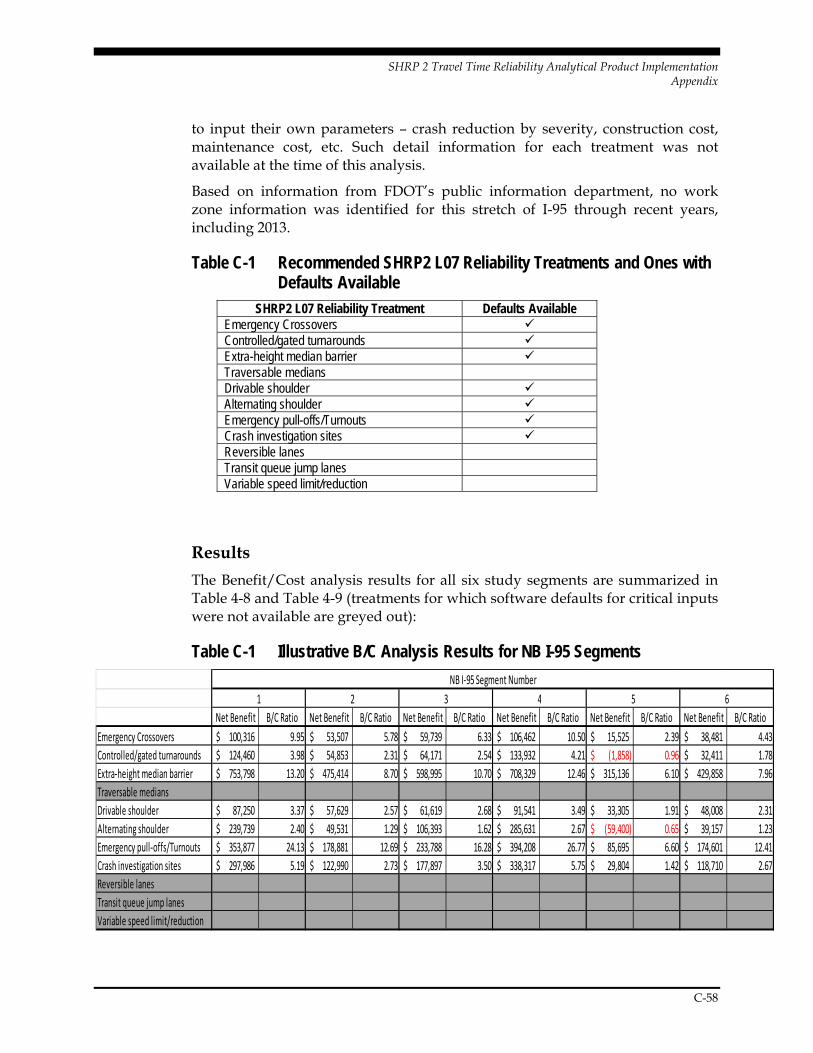
SHRP 2 Travel Time Reliability Analytical Product Implementation Appendix
C-58
to input their own parameters – crash reduction by severity, construction cost, maintenance cost, etc. Such detail information for each treatment was not available at the time of this analysis.
Based on information from FDOT’s public information department, no work zone information was identified for this stretch of I-95 through recent years, including 2013.
Table C-1 Recommended SHRP2 L07 Reliability Treatments and Ones with Defaults Available
SHRP2 L07 Reliability Treatment Defaults Available Emergency Crossovers Controlled/gated turnarounds Extra-height median barrier Traversable medians Drivable shoulder Alternating shoulder Emergency pull-offs/Turnouts Crash investigation sites Reversible lanes Transit queue jump lanes Variable speed limit/reduction
Results
The Benefit/Cost analysis results for all six study segments are summarized in Table 4-8 and Table 4-9 (treatments for which software defaults for critical inputs were not available are greyed out):
Table C-1 Illustrative B/C Analysis Results for NB I-95 Segments
Net Benefit B/C Ratio Net Benefit B/C Ratio Net Benefit B/C Ratio Net Benefit B/C Ratio Net Benefit B/C Ratio Net Benefit B/C Ratio
Emergency Crossovers 100,316$ 9.95 53,507$ 5.78 59,739$ 6.33 106,462$ 10.50 15,525$ 2.39 38,481$ 4.43
Controlled/gated turnarounds 124,460$ 3.98 54,853$ 2.31 64,171$ 2.54 133,932$ 4.21 (1,858)$ 0.96 32,411$ 1.78
Extra‐height median barrier 753,798$ 13.20 475,414$ 8.70 598,995$ 10.70 708,329$ 12.46 315,136$ 6.10 429,858$ 7.96
Traversable medians
Drivable shoulder 87,250$ 3.37 57,629$ 2.57 61,619$ 2.68 91,541$ 3.49 33,305$ 1.91 48,008$ 2.31
Alternating shoulder 239,739$ 2.40 49,531$ 1.29 106,393$ 1.62 285,631$ 2.67 (59,400)$ 0.65 39,157$ 1.23
Emergency pull‐offs/Turnouts 353,877$ 24.13 178,881$ 12.69 233,788$ 16.28 394,208$ 26.77 85,695$ 6.60 174,601$ 12.41
Crash investigation sites 297,986$ 5.19 122,990$ 2.73 177,897$ 3.50 338,317$ 5.75 29,804$ 1.42 118,710$ 2.67
Reversible lanes
Transit queue jump lanes
Variable speed limit/reduction
6
NB I‐95 Segment Number
1 2 3 4 5

SHRP 2 Travel Time Reliability Analytical Product Implementation Appendix
C-59
These examples are illustrative of the L07 tool and are not intended to represent actual cost estimates for specific improvements.
Table C-2 Illustrative B/C Analysis Results for SB I-95 Segments
These examples are illustrative of the L07 tool and are not intended to represent actual cost estimates for
specific improvements.
Findings/Recommendations
Based on the results of this test application of the L07 Tool, the length of the segment and the number of crashes appear to be the inputs with significant effects on the Net Present Benefits and the B/C Ratios of many treatments. Thus, it is important for this set of inputs to be as accurate as possible.
The tool asks for the 30th highest hour in a year for each of the 24 hours excluding weekends and holidays, not to be confused with the average.
Even though the User’s Guide of the L07 Tool states up to 10 treatments can be selected at a time, the software tool often becomes unstable when the number of treatments selected approaches seven. In addition, the software may crash when many treatments are selected and the user is switching between scenarios. One should try to save often when using this L07 Tool.
According to the User’s Guide, the L07 Tool should be used in conjunction with the Project L07 Final Report and Project L07 Treatment Guidebook.
For the L07 Tool to work, Excel 2007 or a later version is required. The privacy/security setting needs to be set to allow macros. All other Excel files should be closed prior to opening this tool; after this tool is opened, the user can then open up another session of Excel if desired.
Net Benefit B/C Ratio Net Benefit B/C Ratio Net Benefit B/C Ratio Net Benefit B/C Ratio Net Benefit B/C Ratio Net Benefit B/C Ratio
Emergency Crossovers 52,338$ 5.67 21,639$ 2.93 118,705$ 11.59 64,116$ 6.72 2,406$ 1.21 64,162$ 6.73
Controlled/gated turnarounds 53,143$ 2.27 7,974$ 1.19 152,218$ 4.64 70,701$ 2.69 (21,448)$ 0.49 70,744$ 2.69
Extra‐height median barrier 691,918$ 12.20 359,344$ 6.82 770,913$ 13.48 533,864$ 9.64 218,092$ 4.53 470,903$ 8.62
Traversable medians
Drivable shoulder 56,876$ 2.55 37,220$ 2.01 99,382$ 3.70 62,362$ 2.70 24,903$ 1.68 63,532$ 2.73
Alternating shoulder 117,180$ 1.68 (50,301)$ 0.71 288,982$ 2.69 31,699$ 1.19 (99,962)$ 0.42 48,231$ 1.28
Emergency pull‐offs/Turnouts 250,790$ 17.39 92,147$ 7.02 391,984$ 26.62 168,848$ 12.04 50,256$ 4.29 177,738$ 12.62
Crash investigation sites 194,899$ 3.74 36,256$ 1.51 336,093$ 5.72 112,957$ 2.59 (5,635)$ 0.92 121,847$ 2.71
Reversible lanes
Transit queue jump lanes
Variable speed limit/reduction
6
SB I‐95 Segment Number
1 2 3 4 5

SHRP 2 Travel Time Reliability Analytical Product Implementation Appendix
C-60
Future versions of this tool should consider making available even more treatment options with default parameter values for critical inputs.

Subtask 4 and Subtask 5 report
SHRP 2 L02 Evaluation
Evaluation of Travel Time Data Sources
and
Integration of Unreliability Explanatory Factors into a Database
prepared for
Florida Department of Transportation
prepared by
Cambridge Systematics, Inc. 1566 Village Square Boulevard, Suite 2 Tallahassee, FL 32309
and
Kittelson & Associates, Inc.
date
November 05, 2014
D. L02 - Analysis and Results Description
D-1
SHRP 2 Travel Time Reliability Analytical Product ImplementationAppendix
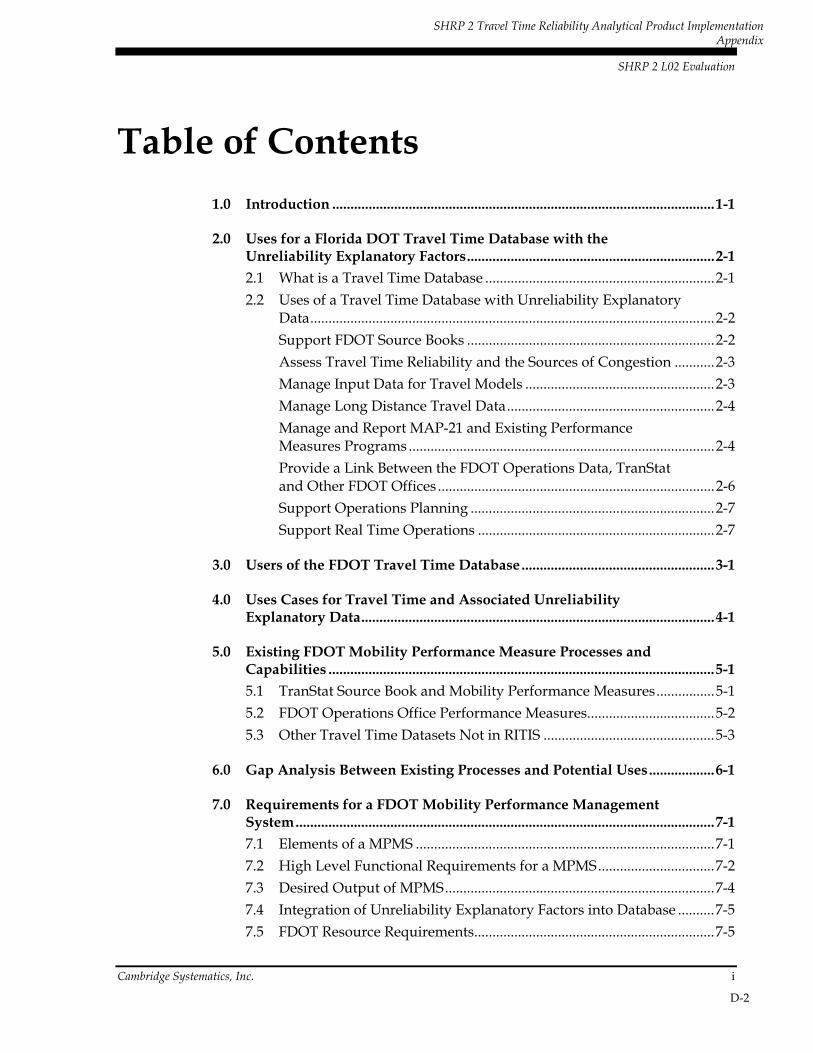
SHRP 2 L02 Evaluation
Cambridge Systematics, Inc. i
Table of Contents 1.0 Introduction ......................................................................................................... 1-1
2.0 Uses for a Florida DOT Travel Time Database with the Unreliability Explanatory Factors .................................................................... 2-1 2.1 What is a Travel Time Database ............................................................... 2-1
2.2 Uses of a Travel Time Database with Unreliability Explanatory Data ............................................................................................................... 2-2
Support FDOT Source Books .................................................................... 2-2
Assess Travel Time Reliability and the Sources of Congestion ........... 2-3
Manage Input Data for Travel Models .................................................... 2-3
Manage Long Distance Travel Data ......................................................... 2-4
Manage and Report MAP-21 and Existing Performance Measures Programs .................................................................................... 2-4
Provide a Link Between the FDOT Operations Data, TranStat and Other FDOT Offices ............................................................................ 2-6
Support Operations Planning ................................................................... 2-7
Support Real Time Operations ................................................................. 2-7
3.0 Users of the FDOT Travel Time Database ..................................................... 3-1
4.0 Uses Cases for Travel Time and Associated Unreliability Explanatory Data ................................................................................................. 4-1
5.0 Existing FDOT Mobility Performance Measure Processes and Capabilities .......................................................................................................... 5-1 5.1 TranStat Source Book and Mobility Performance Measures ................ 5-1
5.2 FDOT Operations Office Performance Measures ................................... 5-2
5.3 Other Travel Time Datasets Not in RITIS ............................................... 5-3
6.0 Gap Analysis Between Existing Processes and Potential Uses .................. 6-1
7.0 Requirements for a FDOT Mobility Performance Management System ................................................................................................................... 7-1 7.1 Elements of a MPMS .................................................................................. 7-1
7.2 High Level Functional Requirements for a MPMS ................................ 7-2
7.3 Desired Output of MPMS .......................................................................... 7-4
7.4 Integration of Unreliability Explanatory Factors into Database .......... 7-5
7.5 FDOT Resource Requirements .................................................................. 7-5
D-2
SHRP 2 Travel Time Reliability Analytical Product ImplementationAppendix
Table of Contents, continued
ii Cambridge Systematics, Inc.
7.6 Data Governance ........................................................................................ 7-6
8.0 Mobility Performance Monitoring System Implementation Plan ............ 8-1
D-3
SHRP 2 Travel Time Reliability Analytical Product ImplementationAppendix

SHRP 2 L02 Evaluation
Cambridge Systematics, Inc. iii
List of Tables Table 1 Uses and Users of Travel Time Data in FDOT ....................................... 3-1
Table 2 Identified Use Cases for Travel Time and Unreliability Explanatory Data ..................................................................................... 4-1
Table 3 Source Book Data Sources ......................................................................... 5-1
D-4
SHRP 2 Travel Time Reliability Analytical Product ImplementationAppendix

SHRP 2 L02 Evaluation
Cambridge Systematics, Inc. 1-1
1.0 Introduction This report describes the work of two subtasks in the SHRP 2 L02 Evaluation for Florida DOT. The original goals of the L02 evaluation subtask were:
To improve the ability of FDOT Central Office, FDOT Districts, MPO’s and local agencies in Florida to monitor reliability trends statewide and within their jurisdiction, and
To increase the ability of FDOT Districts, MPOs and local agencies to identify reliability problem spots within their system and diagnose their causes in order to suggest possible treatment options.
The LO2 evaluation was re-scoped in July, 2014 to add three new tasks as follows:
Task 4 – Evaluation of Travel Time Data Sources - This new task was to extend the TWO 17 conclusions regarding data sources for the Transtat Mobility Performance Measures Source book to address other Central Office monitoring needs, District monitoring needs, and MPO/local agency monitoring needs. This task involved identifying any potential resource requirements and other issues with incorporating the data in existing FDOT databases: RITIS and SunGuide and determining appropriate database or databases for archiving the data.
Task 5 – Integration of Unreliability Explanatory Factors into Database(s) - This new task identified the current and best sources of explanatory factors (demand, incidents, weather, work zones, special events) for incorporation into the recommended travel time reliability database(s) identified in the previous task by agency type (central office, district, MPO, local) for arterial and freeway facilities on and off of the SHS. It included the extent to which current databases (RITIS and SunGuide and District) adequately incorporate the explanatory factors would be assessed.
Task 6 – Resource Requirements and Implementation Plan - This task identified the appropriate steps, roles and responsibilities, time line, and funding requirements for implementing the recommended reliability database(s) improvements identified in the prior two tasks (Task 4 and 5).
Tasks 1,2,3 and 6 will be summarized in a separate report documenting all results of Task Work Order 22.
Unreliability explanatory factors are the seven sources of congestion, listed below.
Traffic incidents,
D-5
SHRP 2 Travel Time Reliability Analytical Product ImplementationAppendix

SHRP 2 L02 Evaluation
1-2 Cambridge Systematics, Inc.
Weather,
Work zones,
Special events,
Traffic control devices,
Fluctuation in demand, and
Inadequate base capacity
Collecting field data on these factors will enable FDOT operations staff and planners to determine the location, extent, cause, and potential mitigation strategies for traffic congestion problems.
A travel time database including unreliability explanatory factors will support the FDOT Source Book, facilitate coordination of data management among various FDOT offices and automate many current manual data management processes.
The ideal outcome of this report is demonstration of the feasibility of an automated system that receives collected data from many different sources, stores that data in a geo-referenced archive, allows queries and data mining from different data sources and provides output in a range of graphical and tabular formats. Multiple functional areas within FDOT desire such a system. For example, the Freight Logistics and Passenger Operations is proposing using such a system for bottleneck, corridor, and intermodal logistic center connector studies. Development of database systems should be closely coordinated among offices.
This report focuses on the highway modes. The highway modes are methods of motorized and non-motorized travel that may utilize a highway, specifically auto, bicycle, bus, pedestrian, and truck. However, the primary focus of this evaluation is the auto highway mode.
The remainder of this paper describes:
Uses for a FDOT travel time database with the unreliability explanatory factors (Section 2.0),
Identification of FDOT users of the travel time database (Section 3.0),
Identification of use cases and potential applications of the travel time database (Section 4.0),
Assessment of the existing FDOT data sources to meet the needs and use cases (Section 5.0),
A gap analysis between the existing process and the potential use cases (Section 6.0),
Identification of issues and resources regarding the implementation of an automated data collection system (Section 7.0), and
D-6
SHRP 2 Travel Time Reliability Analytical Product ImplementationAppendix

SHRP 2 L02 Evaluation
Cambridge Systematics, Inc. 1-3
Recommendations for next steps to implement a FDOT travel time databasewith the unreliability explanatory factors that will provide querying and datamining capabilities (Section 8.0).
The recommendation of this report is the develop a data collection, storage, calculation, and reporting system to meet the needs of the uses identified in this document. This system will be referred to as the FDOT Mobility Performance Management System (MPMS).
D-7
SHRP 2 Travel Time Reliability Analytical Product ImplementationAppendix

SHRP 2 L02 Evaluation
Cambridge Systematics, Inc. 2-1
2.0 Uses for a Florida DOT Travel Time Database with the Unreliability Explanatory Factors
2.1 WHAT IS A TRAVEL TIME DATABASE A travel time database is a stored database of field measurements of travel time and speed data along road segments in a highway network. Roadway segment lengths and data collection device locations are also be associated spatially with the travel time or speed data in such a database.
It is also recommended that Florida DOT consider including the unreliability explanatory factors in the database. These factors include incidents, construction work zones, special events, weather, traffic signal timing data and fluctuations in traffic volumes. These data must also be spatially related to the travel time or speed data. As explained in the following sections these unreliability factors can be used to explain where and when the highway network breaks down (traffic congestion) and why it is over capacity.
In order to meet the requirements for the uses described the FDOT travel time database should include the following data elements:
Travel times – auto and freight,
Speeds – autos and freight,
Traffic volumes – autos and freight,
Roadway segment lengths,
Data collection device locations,
Incidents,
Construction work zones,
Special events,
Weather, and
Roadway capacity.
D-8
SHRP 2 Travel Time Reliability Analytical Product ImplementationAppendix

SHRP 2 L02 Evaluation
2-2 Cambridge Systematics, Inc.
2.2 USES OF A TRAVEL TIME DATABASE WITH UNRELIABILITY EXPLANATORY DATA
This analysis identified eight uses for a well-designed travel time database with the unreliability explanatory factors. These uses and the subsequent objectives of developing a FDOT travel time database with unreliability explanatory factors (referred to as the travel time database) are described in the sections below.
Support FDOT Source Books
One of the primary purposes of a travel time database is to support and enhance the FDOT Source Book. The FDOT Office of Transportation Statistics (TranStat) produces two Source Books annually, Multimodal Mobility Performance Measures Source Book, and a companion General Interest Highway Statistics Source Book. The Multimodal Mobility Performance Measures Source Book is intended to be the primary source of mobility performance measure results for the State of Florida. It includes data and analysis for the State Highway System (SHS) and the Strategic Intermodal System (SIS). Major modes considered in this Source Book are automobile, aviation, bicycle, pedestrian, transit, and truck. Future editions are anticipated to include expanded multimodal performance measures to more comprehensively describe mobility in Florida. Various offices within FDOT have defined many uses of the data developed in the Source Book; these are detailed in Sections 3.0 and 4.0 of this report. While the Multimodal Mobility Performance Measures Source Book and its processes are the focus of this paper, data processed needed to support the General Interest Highway Statistics Source Book will also be enhanced by the development of the travel time database.
The current FDOT Source Book processes and procedures are described in Section 5.0. These processes are primarily manual and many measures rely on modeled data rather than observed data collected in the field. The FDOT Office of Traffic Operations has a number of automated data collection, archiving, and processing procedures in place. The operations data could enhance the current Source Book data with an automated stream of data that covers a large portion of the SHS and SIS. This report also describes the uses and advantages of the operations data in the Source Book processes at a high level.
In a separate task the project team evaluated the use of multiple data sources for monitoring mobility performance. The task focused on using field measures data to create the performance measures reported in FDOT’s Source Book. The existing Source Book processes take several months to prepare for each annual update at considerable cost. An automated travel time database would provide continuous updates to performance measures with less labor than is required to provide many of the current measures.
D-9
SHRP 2 Travel Time Reliability Analytical Product ImplementationAppendix
SHRP 2 L02 Evaluation
Cambridge Systematics, Inc. 2-3
Assess Travel Time Reliability and the Sources of Congestion
One purpose of this effort is to monitor travel time reliability throughout Florida and be able to identify problem areas and solutions to areas having poor reliability. Currently the Systems Planning, Policy Planning, and ITS Offices use travel time reliability as one factor when evaluating or prioritizing projects. These offices use the data developed by the Source Book when conducting project evaluations. The travel times and the unreliability explanatory factors are modeled as part the Source Book development process. The use of historic field collected data will provide much more accurate analysis and more detail than can be obtained with modeled data alone. Specifically, collecting field data on unreliability explanatory factors, as described earlier will enable FDOT operations staff and planners to determine the location, extent, cause, and potential mitigation strategies for traffic congestion problems.
The use of field collected travel time and unreliability explanatory factors will provide for additional analyses that are not currently available. The use of historic field collected data will enable:
Planning to improve the robustness of its designs providing operating control features that will extend the service lives of capacity investments,
Planning to budget and plan for retrofitting operating improvements (like dynamic tolling, speed harmonization, ramp signals, etc.) to its existing facilities,
District Traffic Operations to assess, design and implement Transportation System Management and Operations (TSM&O) strategies, and
Transportation Management Centers (TMCs) to evaluate their performance and improve it.
Manage Input Data for Travel Models
The travel time database will provide a common database for data needed as input to statewide and regional highway travel models. It is intended that the travel time database will incorporate data streams from sources for data of the following types:
Traffic volumes,
Speeds collected from FDOT roadside detectors,
Travel times collected from probe data vendors or toll tags,
Origin-destination data,
Truck data in each category of truck sizes, and
Roadway characteristics data.
D-10
SHRP 2 Travel Time Reliability Analytical Product ImplementationAppendix

SHRP 2 L02 Evaluation
2-4 Cambridge Systematics, Inc.
The data will include observed data (field collected) as well as modeled data where field collected data is not available or when modeled data is desired by FDOT to be archived.
The models may include the statewide FDOT travel demand model, regional travel demand models maintained by MPOs, statewide and regional freight models, regional and local mesoscopic and microscopic simulation models and transit models.
Manage Long Distance Travel Data
The travel time database will provide a common database for data needed as input to statewide long distance travel analysis conducted by the Systems Planning and TranStat Offices, that is, intra-regional travel between major urban areas. This data will include both passenger and freight demand needed for statewide planning and SIS analysis.
Manage and Report MAP-21 and Existing Performance Measures Programs
FDOT offices currently report performance measures on many of the Department’s programs. Source Book data is used to report performance for system wide performance for congestion, travel time reliability, freight mobility and numerous other factors. The ITS Office reports on travel time reliability and incident duration on the portion of Florida freeways that are instrumented with ITS devices. These programs will continue. Additionally, the U.S. DOT is requiring that performance be measured and reported as part of the MAP-21 funding program. The MAP-21 requirements are not yet set, however the rule-making process is underway and should be completed in 2015. A description of the current Federal information on the MAP-21 performance program is detailed in this section.
The cornerstone of MAP-21’s highway program transformation is the transition to a performance and outcome-based program. States will invest resources in projects to achieve individual targets that collectively will make progress toward national goals.
The FDOT travel time database should be designed to support five of the MAP-21 performance areas. Each of these performance areas are briefly described in the following paragraphs:
Safety. The goal of the safety area is to reduce roadway fatalities and seriousinjuries. To measure these goals the following data are needed:
– Number of fatal and injury crashes;
– Location of fatal and injury crashes; and
D-11
SHRP 2 Travel Time Reliability Analytical Product ImplementationAppendix

SHRP 2 L02 Evaluation
Cambridge Systematics, Inc. 2-5
– External factors at crash location – i.e. weather, pavement condition,proximity to another incident, roadway geometry, lighting, and vehicletypes involved (trucks).
– There is a current NPRM out for comment on Safety performancemeasures. The measures under consideration are:
Number of Fatalities
Rate of Fatalities per 100 million VMT
Number of Serious Injuries
Rate of Serious Injuries per 100 million VMT
Congestion Reduction. The goal of the congestion reduction area is toreduce congestion on the National Highway System (NHS). To measure thisgoal the following data are needed:
– Free flow speed;
– Speed by time of day;
– Delay; and
– Volume by time of day.
System Reliability. The goal of the system reliability area is to improve theefficiency of the surface transportation system. The MAP-21 Notice ofProposed Rulemaking for system reliability and congestion reduction thatwill define the appropriate performance measures for congestion andreliability will not be out until February 2015, at the soonest. Since this iswritten in advance of the NPRM, reasonable assumptions are made aboutwhat is likely to be included in the final rule. To measure this goal it isexpected that the following data will be needed:
– Travel time by time of day on all roads;
Freight Movement and Economic Vitality. The goal of the freightmovement area is to improve the national freight network. To measure thisgoal the following data are needed.
– Travel time for commercial vehicles;
– Delay for commercial vehicles;
– Commercial vehicle volumes; and
– Commercial vehicle origins and destinations.
Environmental Sustainability. The goal of the environmental sustainabilityarea is to enhance the performance of the transportation system whileprotecting and enhancing the natural environment. These measures are notdirectly related to the reliability; however, the travel time data can be used to
D-12
SHRP 2 Travel Time Reliability Analytical Product ImplementationAppendix

SHRP 2 L02 Evaluation
2-6 Cambridge Systematics, Inc.
calculate the environmental sustainability factors. To measure this goal, the following data is needed:
– Reduction in petroleum based fuels used for transportation; and
– Reduction in air quality pollutants produced by vehicles.
Provide a Link Between the FDOT Operations Data, TranStat and Other FDOT Offices
Currently the ITS Office collects and saves FDOT detector data along with incident data from TMC operator logs. The ITS Office also is purchasing vendor probe from HERE. The FDOT Systems Planning Office purchased a historical dataset from INRIX. In preparing for this task it was determined that TranStat, planning offices and the ITS Office were not familiar with the data that other offices were collecting or had purchased. Having a common Department-wide database will enhance coordination among the FDOT offices. Following is a description of the data that is available at FDOT.
The FDOT Office of Operations collects and stores operations data from FDOT District Traffic Management Centers (TMCs). At this time, FDOT has a contract with the University of Maryland Center for Advanced Transportation Technology (CATT) Laboratory to collect, store and manage this data in a data management system called RITIS. RITIS receives operations data from the SunGuide software systems in each District and the Turnpike Enterprise and from private probe data vendors INRIX and HERE. The data included in RITIS covers roadway segments (primarily freeways) that are instrumented with ITS devices and detectors. The coverage as of December 2013 is 1296 centerline miles of limited access highways in Florida or about 62% of limited access FIHS roads. The data stored in RITIS includes:
Travel times,
Speeds,
Incidents – including crashes, debris, work zones, and
Weather.
Additional coverage is being implemented throughout Florida and additional data items such as volumes and truck data may be included in the future, if they are provided by the private data vendors.
The SunGuide systems in each District also receive HERE measured/real time traffic data for use in managing real time operations. This real time data is not currently being saved for historic analysis by the SunGuide systems.
Currently the RITIS operations data is not available to TranStat. The travel time database will provide an access point for TranStat and other FDOT offices to query historic operations data for their use.
D-13
SHRP 2 Travel Time Reliability Analytical Product ImplementationAppendix
SHRP 2 L02 Evaluation
Cambridge Systematics, Inc. 2-7
The FDOT Systems Planning Office purchased a statewide set of historic travel time data from INRIX in 2011. No additional years were purchased and this data is available to other offices upon request.
Support Operations Planning
Travel time data and the associated unreliability explanatory data are used by District operations to conduct planning studies for freeways and arterials. The TMCs use travel time data to assess the effectiveness of their activities, to develop strategies for mitigating congestion and bottlenecks on the freeway network, and to plan for deployment of service patrols (Road Rangers), DMS locations, and extensions of ITS coverage areas. The District Traffic Operations staff, often working with local traffic engineering staff, uses arterial travel time data to conduct traffic signal timing studies and develop strategies to mitigate arterial congestion. MPOs can also use travel time data for traffic analysis and as input data to models.
Support Real Time Operations
The FDOT District Transportation Management Centers (TMCs) use real time travel time data to conduct real time operations on freeways in Florida. The data is collected as spot speeds from roadside or in-pavement loop detectors and transmitted to the TMC for operators to detect congestion, to post messages on dynamic message signs, to post travel time messages on the signs and to provide travel time and congestion information to the 511 system. Additionally, the measured travel times are used by District 6 to adjust the toll rates on the 95 Express Lanes in Miami (and will soon be expanded to Fort Lauderdale in District 4). This data is then saved in the SunGuide system at each District TMC and is now being archived by RITIS. The TMCs also have access to the real time probe data purchased statewide by the ITS Office for use in real time operations on roads not managed by the ITS.
D-14
SHRP 2 Travel Time Reliability Analytical Product ImplementationAppendix

D-15
SHRP 2 Travel Time Reliability Analytical Product ImplementationAppendix

SHRP 2 L02 Evaluation
Cambridge Systematics, Inc. 3-1
3.0 Users of the FDOT Travel Time Database Section 2.0 of this report addressed the FDOT department-wide uses for a common travel time database. This section addresses the question of who needs this database (users) and for what purpose (use). There are many uses for travel time data and many different users of the data within FDOT. Table 1 lists them.
Table 1 Uses and Users of Travel Time Data in FDOT Data Usage and Purpose (Use Category) Users Support Source Book development (SD)* TranStat Assess Travel Time Reliability and the Sources of Congestion (AR)
TranStat, Systems Planning, Policy Planning, Freight & Logistics, Traffic Operations/ITS, Design, Performance Management, Districts
Provide Input Data for Travel Models (IM) Systems Planning, Districts Provide Long Distance Travel Data (LD) Systems Planning, TranStat Provide Data for MAP-21 Performance Measures and Existing FDOT Performance Measurement Programs (MM)
TranStat, Systems Planning, Freight & Logistics, Maintenance & Operations, Traffic Operations/ITS, Performance Management, Safety, Districts, Transportation Commission
Provide a Link Between the FDOT Operations Data, TranStat and Other FDOT Offices (LM)
TranStat, Systems Planning, Freight & Logistics, Maintenance & Operations, Traffic Operations/ITS, Performance Management, Safety, Districts, Transportation Commission
Support Operations Planning (OP) Traffic Operations/ITS, District Traffic Operations and TMCs
Support Real-time Traffic Operations (RT) Traffic Operations/ITS, District Traffic Operations and TMCs
*The two letter use category code is used for the use case identifier in Section 4.0
Outside of the FDOT Central Office, there are other potential users of the travel time data and the associated unreliability explanatory data, these potential users include:
FDOT District planning staff and consultants,
FDOT District Traffic Management Center (TMC) operations staff,
Metropolitan Planning Organization (MPO) transportation and freight planning staff and consultants,
U.S. Department of Transportation (DOT) planning staff,
University researchers, and
Private travel information vendors.
D-16
SHRP 2 Travel Time Reliability Analytical Product ImplementationAppendix

SHRP 2 L02 Evaluation
3-2 Cambridge Systematics, Inc.
It will be determined later, who and how users outside the FDOT Central Office will be allowed access to the travel time and the associated unreliability explanatory database.
D-17
SHRP 2 Travel Time Reliability Analytical Product ImplementationAppendix

SHRP 2 L02 Evaluation
Cambridge Systematics, Inc. 4-1
4.0 Uses Cases for Travel Time and Associated Unreliability Explanatory Data Sections 2.0 and 3.0 addressed the needs for a department-wide travel time database and who needs that database. Section 4.0 describes why the users need the database. In other words, what are the specific uses of travel time data that the system will provide. Development of use cases is a method of describing how data will be used by the identified users to obtain desired results. Forty-eight FDOT use cases were identified for travel time and unreliability explanatory data. Table 2 shows the users, the use category, and detailed purposes. The use case identification number (ID #) is shown to identify a specific use case for the functional requirements development and detailed design tasks that may occur as follow-on projects later. The two-letter code is described in Table 1. There is a number for each case defined within that use category (i.e. SB = Support Source Book Development, AR = Assess Travel Time Reliability and the Sources of Congestion, etc.)
Table 2 Identified Use Cases for Travel Time and Unreliability Explanatory Data
Use Case ID# User Use Category Detailed Purpose
SB1 TranStat Support Source Book development Calculate vehicle miles traveled SB2 TranStat Support Source Book development Calculate person miles traveled SB3 TranStat Support Source Book development Calculate combination truck miles traveled SB4 TranStat Support Source Book development Calculate truck miles traveled SB5 TranStat Support Source Book development Calculate % travel meeting LOS criteria SB6 TranStat Support Source Book development Calculate & miles meeting LOS criteria SB7 TranStat Support Source Book development Calculate travel time reliability SB8 TranStat Support Source Book development Calculate travel time variability SB9 TranStat Support Source Book development Calculate vehicle hours of delay SB10 TranStat Support Source Book development Calculate average travel speed SB11 TranStat Support Source Book development Calculate combination truck hours of delay SB12 TranStat Support Source Book development Calculate combination truck average travel
speed SB13 TranStat Support Source Book development Calculate % miles severely congested SB14 TranStat Support Source Book development Calculate vehicles per lane mile SB15 TranStat Support Source Book development Calculate % travel severely congested SB16 TranStat Support Source Book development Calculate hours severely congested AR1 TranStat Assess travel time reliability Generate trends over time for travel time
reliability AR2 TranStat Assess travel time variability Generate trends over time for travel time
variability
D-18
SHRP 2 Travel Time Reliability Analytical Product ImplementationAppendix

SHRP 2 L02 Evaluation
4-2 Cambridge Systematics, Inc.
Use Case ID# User Use Category Detailed Purpose
AR3 Systems Planning
Assess travel time reliability Calculate travel time reliability for a corridor study, project development and PD&E*
AR4 Systems Planning
Assess sources of congestion Calculate sources of congestion for a corridor study*
AR5 Policy Planning Assess travel time reliability Calculate travel time reliability for statewide, a district, urban area or corridor study*
AR6 Freight & Logistics
Assess travel time reliability Calculate travel time reliability for a truck study, project development and PD&E**
AR7 Traffic Operations/ITS
Assess travel time reliability Generate trends over time for travel time reliability for project development and PD&E*
AR8 Design Assess travel time reliability Generate solutions to mitigate bottleneck locations for project development and PD&E*
AR9 Performance Management
Assess travel time reliability Calculate travel time reliability for statewide, a district, urban area or corridor*
AR10 Districts Assess travel time reliability Calculate travel time reliability for statewide, a district, urban area or corridor*
AR11 Districts Assess travel time reliability Generate solutions to mitigate bottleneck locations for project development and PD&E*
IM1 Systems Planning
Provide input data for statewide travel models
Generate speed, travel time, travel reliability and delay data for model input and calibration
IM2 Districts Provide input data for regional and local travel models
Generate speed, travel time, travel reliability and delay data for model input and calibration
SD1 Systems Planning
Provide long distance travel data Calculate travel time reliability between urban areas statewide
MM1 Performance Management
Provide data for MAP-21 performance measures
Calculate Map-21 safety goal area measures
MM2 Performance Management
Provide data for MAP-21 performance measures
Calculate Map-21 congestion reduction goal area measures
MM3 Performance Management
Provide data for MAP-21 performance measures
Calculate Map-21 system reliability goal area measures
MM4 Performance Management
Provide data for MAP-21 performance measures
Calculate Map-21 freight movement goal area measures
MM5 Performance Management
Provide data for MAP-21 performance measures
Calculate Map-21 environmental sustainability goal area measures
LM1 TranStat Provide Data for Existing Performance Measure Programs
Report statewide travel time reliability
LM2 TranStat Provide Data for Existing Performance Measure Programs
Report statewide travel time variability
LM3 Freight &Logistics
Provide Data for Existing Performance Measure Programs
Report system performance measures on SIS roadways and statewide
LM4 Maintenance & Operations
Provide Data for Existing Performance Measure Programs
Report incident duration and RISC performance measures statewide
LM5 Traffic Operations/ITS
Provide Data for Existing Performance Measure Programs
Report travel time reliability and incident duration performance measures by district
LM6 Performance Management
Provide Data for Existing Performance Measure Programs
Report system performance statewide
LM7 Safety Provide Data for Existing Performance Measure Programs
Report crash data statewide
LM8 Districts Provide Data for Existing Performance Measure Programs
Report travel time reliability, incident duration, and system performance data for the district
LM9 Transportation Provide Data for Existing Review and validate statewide system
D-19
SHRP 2 Travel Time Reliability Analytical Product ImplementationAppendix

SHRP 2 L02 Evaluation
Cambridge Systematics, Inc. 4-3
Use Case ID# User Use Category Detailed Purpose
Commission Performance Measure Programs performance data OP1 Traffic
Operations/ITS Support operations planning Monitor and manage operations strategies
and services statewide OP2 Districts Support operations planning Monitor and manage operations strategies
and services in each district RT1 Traffic
Operations/ITS Monitor real time traffic Provide real time operations, incident
management and traveler information in each district
*Note that all of the SB factors (SB1-SB16) can be calculated to assess travel time reliability and used to conduct analysis of selected geographic areas.
The list of potential use cases indicates there are six primary applications for the travel time and unreliability explanatory database:
Calculating performance measures based on travel time or speed,
Tracking trends in network performance,
Conducting analysis to locate bottlenecks in the network,
Evaluating congestion mitigation strategies,
Providing input data for travel demand and microsimulation models, and
Conducting real time traffic and incident management operations.
D-20
SHRP 2 Travel Time Reliability Analytical Product ImplementationAppendix

D-21
SHRP 2 Travel Time Reliability Analytical Product ImplementationAppendix

SHRP 2 L02 Evaluation
Cambridge Systematics, Inc. 5-1
5.0 Existing FDOT Mobility Performance Measure Processes and Capabilities Section 5.0 examines two FDOT mobility data management programs: the TranStat Source Book and the FDOT Office of Operations RITIS database. These two sources currently furnish the travel time, speed, and reliability data used by other offices and districts within FDOT.
5.1 TRANSTAT SOURCE BOOK AND MOBILITY PERFORMANCE MEASURES
The Florida DOT Multimodal Mobility Performance Measures Source Book is a compendium of current and historical data and analysis describing the performance of Florida’s transportation system. Its purpose is to be the primary source of mobility performance measure results for the State of Florida. These mobility performance measures are used to report system performance to FDOT management, FHWA and the public. The measures and derived data are also used by other FDOT offices to conduct capacity analysis, assess project impacts, and refine project design.
This Source Book is published annually and represents data and analysis for the State Highway System (SHS), which includes the Strategic Intermodal System (SIS). The latest edition was published in 2013. Major modes considered in this Source Book are automobile, aviation, bicycle, pedestrian, transit, and truck. Future editions are anticipated to include expanded multimodal performance measures to more comprehensively describe mobility in Florida.
The Source Book defines four dimensions of mobility and groups the measures into these dimensions. The four dimensions of mobility in the Source Book are quantity, quality, accessibility, and utilization.
Table 3 shows these highway mobility measures, the calculation formula and their current data sources.
D-22
SHRP 2 Travel Time Reliability Analytical Product ImplementationAppendix

SHRP 2 L02 Evaluation
Cambridge Systematics, Inc. 5-1
Table 3 Source Book Data Sources Dimension of Mobility Mobility Measure Calculation Data Sources
Quan
tity o
f Tra
vel
Vehicle Miles Traveled Σ(Segment Length × Volume) Volume – derived from Statewide ATRs, in TCI Segment length - RCI
Person Miles Traveled Σ(Segment Length × Volume × Average Vehicle Occupancy)
Volume – derived from Statewide ATRs, in TCI Segment length – RCI Vehicle Occupancy - U.S. DOT National Household Travel Survey 2009 – Florida Add-On
Combination Truck Miles Traveled
Σ(Segment Length × Combination Truck Volume) Segment length – RCI Combination truck volume - derived from Statewide ATRs, in TCI
Truck Miles Traveled Σ(Segment Length × Volume × T Factor) Volume – derived from Statewide ATRs, in TCI Segment length – RCI T factor – average % trucks in each road segment
Quali
ty o
f Tra
vel
% Travel Meeting LOS Criteria
Σ(VMT|Peak Hour Volumes < Acceptable LOS Volume Threshold)/Σ(VMT) × 100
Volume – derived from Statewide ATRs, in TCI Acceptable LOS volumes - FDOT Generalized Service Volume Tables 2012
% Miles Meeting LOS Criteria
Σ (Segment Length|Peak Hour Volumes < Acceptable LOS Volume Threshold)/Σ(Segment Length) × 100
Volume – derived from Statewide ATRs, in TCI Segment length – RCI Acceptable LOS volumes - FDOT Generalized Service Volume Tables 2012
Travel Time Reliability Σ (VMT | Travel Speed > 45mph)/ Σ (VMT) × 100
Volume – derived from Statewide ATRs, in TCI Segment length – RCI Travel Speed – FDOT Travel Time Reliability Model, supplemented by crash data from CARS
Travel Time Variability (95% Travel Time Index)
TTI95 = Travel Time95th percentile / Travel Timefree−flow
Free flow speed – speed limit by segment in TCI Travel Time – FDOT Travel Time Reliability Model, supplemented by crash data from CARS
Quali
ty o
f Tra
vel
Vehicle Hours of Delay Σ (Daily or Peak Period / Hour Travel Time − Travel Time at LOS B) X volume
Volume – derived from Statewide ATRs, in TCI Travel Time – FDOT Travel Time Reliability Model, supplemented by crash data from CARS
Average Travel Speed Σ (VMT × Average Travel Speed) / Σ (VMT)
Volume – derived from Statewide ATRs, in TCI Segment length – RCI Travel Speed – FDOT Travel Time Reliability Model, supplemented by crash data from CARS
Combination Truck Hours of Delay
Σ(Daily Combination Truck Travel Time − Travel Time at LOS B)
Combination truck volume/total truck volume - derived from Statewide ATRs, in TCI T factor – average % trucks in each road segment
D-24
SHRP 2 Travel Time Reliability Analytical Product ImplementationAppendix

SHRP 2 L02 Evaluation
5-2 Cambridge Systematics, Inc.
Dimension of Mobility Mobility Measure Calculation Data Sources
Travel Time – FDOT Travel Time Reliability Model, supplemented by crash data from CARS
Combination Truck Average Travel Speed
Σ(CTMT × Combination Truck Average Travel Speed) / Σ(CTMT)
Combination truck volume/total truck volume - derived from Statewide ATRs, in TCI T factor – average % trucks in each road segment Travel Speed – FDOT Travel Time Reliability Model, supplemented by crash data from CARS Free flow speed – speed limit by segment in TCI
Utiliz
atio
n
% Miles Severely Congested
Σ (Segment Length|Peak Hour Volumes > LOS E Volume Threshold) / Σ (Segment Length) × 100
Volume – derived from Statewide ATRs, in TCI Segment length – RCI Acceptable LOS volumes - FDOT Generalized Service Volume Tables 2012
Vehicles Per Lane Mile Σ ( Volume / Number of Lanes) × (Lane Miles) / Σ (Lane Miles)
Volume – derived from Statewide ATRs, in TCI Number of lanes – RCI Lane miles - RCI
% Travel Severely Congested
Σ (VMT|Peak Hour Volumes > LOS E Volume Threshold) / Σ (VMT) × 100
Volume – derived from Statewide ATRs, in TCI Segment length – RCI Acceptable LOS volumes - FDOT Generalized Service Volume Tables 2012
Hours Severely Congested Σ 1| Hourly Volume > LOS E Threshold x 24 (for daily) Volume – derived from Statewide ATRs, in TCI Acceptable LOS volumes - FDOT Generalized Service Volume Tables 2012
Notes: TCI is the FDOT Traffic Characteristics Inventory
RCI is the FDOT Road Characteristics Inventory
Combination truck is FHWA classifications 8-13 (single or double trailer with 3 or more axles)
CARS is the FDOT Crash Analysis Reporting System
D-25
SHRP 2 Travel Time Reliability Analytical Product ImplementationAppendix

SHRP 2 L02 Evaluation
Cambridge Systematics, Inc. 5-1
Table 3 includes sixteen mobility measures. In order to calculate the sixteen measures, twelve data items are needed. Summarizing the data sources and the current data management process from the table, the twelve data items are:
1. Volume – traffic volumes are obtained from 300+ permanent automated traffic recorder (ATR) stations and thousands of temporary ATRs across Florida. The traffic count data is summarized by road segment and reported annually. The annual traffic count data is stored in the Traffic Characteristics Inventory database and it available on-line at http://www2.dot.state.fl.us/FloridaTrafficOnline/viewer.html.
2. Segment length – The Road Characteristics Inventory database includes analysis segments defined by the statewide linear referencing system.
3. Vehicle occupancy – Vehicle occupancy data is obtained from the U.S. DOT National Household Travel Survey 2009 – Florida Add-On and the data is stored in the Traffic Characteristics Inventory database.
4. Acceptable LOS volumes – Level of Service volumes thresholds are calculated and stored in the FDOT Generalized Service Volume Tables database
5. Travel time – Travel time is calculated by the FDOT Travel Time Reliability Model. The Reliability Model is supplemented by crash data from the FDOT Crash Analysis Reporting System (CARS) database.
6. Travel speed - Travel speed is also calculated by the FDOT Travel Time Reliability Model. The Reliability Model is supplemented by crash data from the FDOT Crash Analysis Reporting System (CARS) database.
7. Free flow speed – Free flow speed is defined as the posted speed limit plus 5 mph. The posted speed limit and free flow speed for each road segment is stored in the Traffic Characteristics Inventory database.
8. Number of lanes - The number of travel lanes for each road segment is stored in the Road Characteristics Inventory database.
9. Lane miles – Lanes miles is the product of the segment length and the number of lanes. Lane miles are stored in the Road Characteristics Inventory database.
10. Combination truck volume – The FDOT permanent and temporary traffic count (ATR) stations also collects vehicle classification data and report volumes for each classification. The combination trucks are defined as FHWA classification types 8-13. Truck volume data is stored in the Traffic Characteristics Inventory database.
11. Total truck volume - The FDOT permanent and temporary traffic count (ATR) stations also collects vehicle classification data and report volumes for each classification. The total trucks are defined as all FHWA classification
D-26
SHRP 2 Travel Time Reliability Analytical Product ImplementationAppendix

SHRP 2 L02 Evaluation
5-2 Cambridge Systematics, Inc.
types 4-13. Truck volume data is stored in the Traffic Characteristics Inventory database.
12. T factor – The T factor is defined as the average percent that trucks comprise of the total traffic volume. T factor data is stored in the Traffic Characteristics Inventory database.
5.2 FDOT OPERATIONS OFFICE PERFORMANCE MEASURES
The FDOT Operations Office has been collecting operations data for the past 10 years. Beginning in 2004 the Operations Office initiated the ITS Performance Measures Program by collecting available output data, Road Ranger stops, 511 calls and ITS miles managed from each District. As the statewide SunGuide software was installed in the District TMCs in 2006, the Operations Office began to collect measured data and report three outcome measures: travel time reliability, incident duration and customer satisfaction. From 2006 through 2012, the SunGuide data produced by the Districts were stored in a University of Florida prototype database called STEWARD. The ITS Office produced quarterly and annual reports with the results of the output and outcome performance data. In 2013 the ITS Office contracted with the University of Maryland Center for Advanced Transportation Technology (CATT) Laboratory to use their RITIS software to display and store the District ITS data. Currently RITIS is archiving, processing, and storing incident duration and travel time reliability data from the FDOT Districts. The ITS coverage as of December 2013 is 1296 centerline miles of limited access highways in Florida or about 62% of limited access FIHS roads. In 2014 the ITS purchased HERE probe data, which covers the entire SHS and SIS.
The operations data that is relevant to the Mobility Performance Management System is the real time speed and travel time data and the incident timeline data.
Travel Speed– detector data from roadside field devices deployed by the FDOT Districts is collected as spot speed data. The speed data is collected by the SunGuide software in each District TMC, it is quality checked, translated into travel times for use in real time operations and stored. The speed and travel time data is summarized into 5-minute bins and then stored in a historic data file within RITIS. RITIS uses that historic data to display travel speed, travel time, congestion and delay information. This data is available on 62% of the limited access highways in Florida. Recently RITIS has begun to store the HERE real time data purchased by the ITS Office and any INRIX data purchased through the I-95 Corridor Coalition.
Travel Time – The I-95 Corridor Coalition, which includes FDOT, has purchased vehicle probe data from a private vendor, INRIX. This travel time data is available for most, but not all, of the State Highway System (SHS).
D-27
SHRP 2 Travel Time Reliability Analytical Product ImplementationAppendix

SHRP 2 L02 Evaluation
Cambridge Systematics, Inc. 5-3
Incident Timeline – TMC operators note activities in the incident response process as the incident is happening. The operators observe responder arrivals, departures, lane closings, and openings. The operators enter data into the SunGuide software, which automatically time stamps each entry. The response vehicles have GPS and the precise location of the incident is saved. The FDOT Road Rangers, working with the TMC operators, also note roadway and weather conditions at the incident scene. This data is stored in the SunGuide system for use in real time operations and afterward it is sent to RITIS for storage in a historic database.
Additional Data in RITIS – In addition to the travel speed and travel time data and the incident timeline data, RITIS stores data on work zone locations and duration, special events location and duration, and weather conditions, including precipitation, temperature, humidity, and wind speed.
5.3 OTHER TRAVEL TIME DATASETS NOT IN RITIS Florida DOT currently holds several travel time datasets that that have been collected or purchased by various offices within the FDOT Central Office, these include:
Traffic volume data collected statewide from permanent and temporary count stations and maintained by TranStat,
HERE NPMRDS data available to FDOT agency-wide,
2011 INRIX historical data purchased by the Systems Planning Office, and
Road characteristics data (centerline miles, number of lanes, etc.) maintained by TranStat.
These databases are stored and managed by the offices that purchased them; they are not easily accessible to other offices.
D-28
SHRP 2 Travel Time Reliability Analytical Product ImplementationAppendix

D-29
SHRP 2 Travel Time Reliability Analytical Product ImplementationAppendix

SHRP 2 L02 Evaluation
Cambridge Systematics, Inc. 6-1
6.0 Gap Analysis Between Existing Processes and Potential Uses The FDOT TranStat office produces travel times and speeds using various models. These simulated travel times are used in the Source Book as well as ad hoc reports for FDOT executives and in preparation for MAP-21 reporting. Previous work in Task 17 –Use of Multiple Data Sources produced detailed descriptions of the methodologies and compared these methodologies to methodologies for using measured travel time data by the FDOT ITS Office. Many of these advantages and disadvantages of use of modeled versus measured data were reported in the Task 17 documentation.
Regardless of the use of modeled or measured data, a travel time database id needed. It will be particularly valuable with the use of measured data because it will enable more direct measurement of many of the Source Book measures that are currently estimated from basic volume data. The foundation of the Source Book will be significantly widened and strengthened by the database.
Once the system to collect, store, calculate and report the measured data is completed, updates will require only system maintenance efforts to prepare the performance analysis. The time and cost should be only a small portion of the current Source Book development effort.
A comparison of the existing processes conducted by TranStat for developing the annual FDOT Source Book and the processes identified in the 48 use cases in Table 2 indicates that there are gaps between the existing systems and the desired uses of travel time data by the various FDOT offices. Issues that have been identified as gaps are listed below.
Travel time and speed are currently calculated through a modeling process and the measured travel time data is not being used (likely due to inability to access),
Requests for travel time data to TranStat are handled manually, users cannot query a database,
A request for travel time or reliability data on a road segment or for a district may take several days to complete if the data in not readily available or models need to be run to respond to the request,
The manual process to calculate travel time makes conducting trend analysis difficult, except on a very broad scale,
D-30
SHRP 2 Travel Time Reliability Analytical Product ImplementationAppendix

SHRP 2 L02 Evaluation
6-2 Cambridge Systematics, Inc.
The current process for calculating performance measures using modeled data is time consuming and expensive.
Currently FDOT offices often do not have access to or sometimes even knowledge of a dataset being used by another office and
Currently the Source Book and the ITS performance measures are based on two different datasets. Having a single database used by all FDOT offices will provide more consistent data and performance measures across the Department.
There are also gaps between the existing processes used by the ITS Office for the data stored in RITIS and some of the desired uses identified in the use cases, these are:
Currently there is not a good method to query RITIS by FDOT users; the query process needs to be upgraded,
The RITIS data does not include traffic volumes, the detectors and probes used to collect travel time data are currently not accurate enough for collecting volume data,
Truck data is difficult to break out of the total traffic data for some of the probe datasets, and
It has been found that matching the probe data to FDOT roadway links is difficult and currently not all links can be matched.
D-31
SHRP 2 Travel Time Reliability Analytical Product ImplementationAppendix

SHRP 2 L02 Evaluation
Cambridge Systematics, Inc. 7-1
7.0 Requirements for a FDOT Mobility Performance Management System Section 7.0 describes a data collection, storage, calculation, and reporting system that can be developed to meet the needs of the users for the uses identified earlier in this document. This system will be referred to as the FDOT Mobility Performance Management System (MPMS).
It should be noted that while the RITIS database will perform a number of the functions described by the functional requirements listed in Section 7.1, the RITIS database is controlled by the Center for Advanced Transportation Technology (CATT) at the University of Maryland. The CATT lab has many other system users in addition to Florida DOT, which means that the lab cannot always provide data in formats that are immediately compatible with other FDOT generated data. Also the CATT lab is unlikely to agree to house other needed datasets such as volumes and the FDOT RCI data without additional compensation. This will make data integration and data mining activities more complicated. While direct use of RITIS as the FDOT travel time could save development effort, the use of a travel time database not under control by FDOT Planning or TranStat is not desirable. This report therefore focuses on the development of a new travel time database for FDOT.
7.1 ELEMENTS OF A MPMS The ideal FDOT Mobility Performance Management System (MPMS) will produce much of the data required to develop the annual Multimodal Mobility Performance Measures Source Book for FDOT TranStat automatically. The FDOT MPMS will initially focus on the automobile and truck modes, the other modes may be added to the system in the future.
Such a system will require:
Automated data collection process from various sources in FDOT,
Storage capability to store and maintain large amounts of data,
Processing capabilities that will provide data quality checks, perform needed calculations and provide capabilities to access and manipulate data from the different sources,
D-32
SHRP 2 Travel Time Reliability Analytical Product ImplementationAppendix

SHRP 2 L02 Evaluation
7-2 Cambridge Systematics, Inc.
Query and reporting capabilities that will provide information in formats required by the Source Book and other customized formats needed by various users, and
A maintenance process to maintain the software and hardware. In addition, since numerous data sources are being assessed the links to the sources may change, which will require updating of the data collection module.
7.2 HIGH LEVEL FUNCTIONAL REQUIREMENTS FOR A MPMS
The following is a list of high-level functional requirements for a MPMS. As the system moves to design and implementation, a more detailed listing of requirements must be developed.
The key functions of a MPMS are as follows:
Aggregate total volume, combination truck volume and total truck volume data from the Traffic Conditions Inventory to an intermediate format suitable for the most common queries,
Aggregate travel time data from probe data sources to an intermediate format suitable for the most common queries,
Aggregate speed data from the RITIS raw detector results to an intermediate format suitable for the most common queries,
Allow users to build queries about detector data without knowledge of structured languages or database schemas,
Return information about detector volume, speed and occupancy as a result of executing user-submitted queries,
Allow users to define sets of detectors and store those sets for future use,
Aggregate the Road Characteristics Inventory data (specifically segment length, number of lanes, lane miles, speed limit) to an intermediate format suitable for the most common queries,
Aggregate the Traffic Characteristics Inventory data (vehicle volumes and truck factors) to an intermediate format suitable for the most common queries,
Aggregate RITIS incident data (specifically location, type, lane closings and openings, responders arrivals and departures, time stamps, and road conditions such as geometrics and weather) to an intermediate format suitable for the most common queries,
Aggregate RITIS weather data (specifically temperature, precipitation and wind speed) to an intermediate format suitable for the most common queries,
D-33
SHRP 2 Travel Time Reliability Analytical Product ImplementationAppendix

SHRP 2 L02 Evaluation
Cambridge Systematics, Inc. 7-3
Aggregate RITIS work zone data (specifically location, lane closures, duration) to an intermediate format suitable for the most common queries,
Aggregate RITIS special event data (specifically location, event start and end times, expected volumes) to an intermediate format suitable for the most common queries,
Allow users to request data from multiple sources and output tabular and graphical overlays of the requested data,
Provide a query process to create and submit a query and retrieve the query results,
Allow users to submit queries for immediate execution,
Allow users to schedule queries for periodic background execution,
Support use of Structured Query Language (SQL) code to perform customized complex queries not suitable for automation through the standard MPMS query interface,
Provide query results in formats suitable for analysis in other systems, such as Access, Excel and user defined formats,
Identify potential issues with data quality, but without taking action to correct the data,
Tabulate the following performance metrics (metadata) for each set of aggregated data (and, if selected as an option, include the appropriate performance metrics as part of the query results):
– Percentage of time periods where no data was found; and
– Percentage of time periods where data were out of bounds of a time-specific threshold configured by FDOT management.
Present all metadata measures in an integer range from 100 (no issues found) to zero (completely unreliable),
Provide a set of fixed management reports about the system and its data,
Support five user roles for access control:
– FDOT Standard Users;
– FDOT Power Users;
– FDOT Management;
– FDOT Data Administration and Security.
– External Users – partner agencies, MPOs, consultants
Allow users to access the system through an appropriate link on the FDOT homepage or another homepage or by entering the full address of the MPMS login page,
D-34
SHRP 2 Travel Time Reliability Analytical Product ImplementationAppendix

SHRP 2 L02 Evaluation
7-4 Cambridge Systematics, Inc.
Allow FDOT Data Administration users to establish and maintain all user accounts and
Allow FDOT maintenance process to maintain hardware, software, data quality, and links to data sources.
7.3 DESIRED OUTPUT OF MPMS A primary purpose of the MPMS is to automate the process of producing the annual Multimodal Mobility Performance Measures Source Book through a systematic data collection, storage, management and reporting system. The MPMS will be developed with this purpose in the forefront. While the development of the Source Book will be a major purpose, the MPMS will serve many other uses for FDOT staff, such as those described in Table 1. It should be noted that while the MPMS can support real time operations by providing historical data on travel times, incident duration and traveler information messages, the actual real time operations would continue to be managed through the SunGuide software at District TMCs.
Beyond the outputs required to develop the Source Book the MPMS that can produce additional outputs to meet the needs identified in earlier sections of this report without significant additional effort. By collecting and storing data on travel times and the causes of congestion (e.g. – incidents, work zones, weather, and special events), the MPMS can provide useful information on travel time reliability, congestion and delay. This data can provide a number of products that will meet the objectives of the SHRP 2 L02 Performance Monitoring Systems, such as:
Urban area travel time and reliability monitoring,
MAP-21 performance requirements for travel time reliability,
Bottleneck identification and analysis,
Long distance (city-to-city) travel times and reliability monitoring,
Freight travel time and reliability,
Freight bottleneck identification and analysis, and
Congestion mitigation strategy analysis.
Additionally having a single location for all the data needed to develop the annual Source Book and to conduct planning activities will provide a simpler, less time consuming process for gathering information and developing the mobility measures.
D-35
SHRP 2 Travel Time Reliability Analytical Product ImplementationAppendix

SHRP 2 L02 Evaluation
Cambridge Systematics, Inc. 7-5
7.4 INTEGRATION OF UNRELIABILITY EXPLANATORY FACTORS INTO DATABASE
There are several unreliability explanatory factors collected by the ITS Office, including:
Crash incident data,
Other incident data, such as debris in the roadway and flooding,
Work zone data,
Special event data, such as major sports events, festivals and concerts, and
Weather data.
For freeways, the crash, other incidents, work zone, and special event data are all collected by the FDOT Districts through their SunGuide software and archived statewide by RITIS. The weather data is collected directly by RITIS from the National Weather Service and archived in RITIS. Crash data is also by the FDOT Safety Office in a system called CARS. CARS covers crashes on all roadways in Florida. This data is often not available for a year after the crash actually occurred.
Currently, for the most part, these unreliability explanatory factors, except the crash data, are not collected for arterials in Florida (or anywhere, for that matter).
7.5 FDOT RESOURCE REQUIREMENTS There are generally two methods for archiving data and making that data available for user queries, a centralized data archive system and a decentralized data archive system.
A centralized system will draw the complete dataset from the various databases in the system and store that entire database for immediate use for queries. This type of system requires a very large amount of storage and significant processing power for managing the several large databases. Particular care must be designed into the system in order to maintain real time version control for each database. A decentralized system will draw only the data requested in the query for use in that query only. The decentralized system will process the query; including integrating data from several databases, and provide the output to the user. This type of system will require a large amount of RAM storage but only a small amount of long-term storage – primarily for storing query templates or common data request formats. This system will require a high bandwidth communications between the data source and the server that will manage the queries and reporting for the MPMS that will allow near real time downloads of data so that queries can be processed quickly. The processing power for
D-36
SHRP 2 Travel Time Reliability Analytical Product ImplementationAppendix

SHRP 2 L02 Evaluation
7-6 Cambridge Systematics, Inc.
managing the data is the same as in the centralized system. Version control problems are eliminated in the decentralized system since the query will use the latest version of each accessed database.
Since the FDOT offices managing the individual data sources will be reluctant to give up control of their data and systems, and high bandwidth communications are available to FDOT and the resource requirements are smaller, the decentralized system is recommended to be pursued for this project.
7.6 DATA GOVERNANCE A data governance plan defines the roles and responsibilities of the data collection, data storage, and management of the database for a data management system. The ideal MPMS will include a process for data governance. The data governance process should include a stakeholder process that includes all the owners of databases that will be accessed by the system. In this case, FDOT TranStat as owners of the RCI and TCI databases, and FDOT Generalized Service Volume Tables database, the FDOT ITS Office as owners of the RITIS database, and the FDOT Safety Office as the owner of the CARS database. In addition, the FDOT Systems Planning Office may be included because they have purchased an INRIX vehicle probe dataset and they would be a significant user of the MPMS. A data business plan for the MPMS should be developed, which includes a mission or vision, goals, objectives, selecting measures, selecting targets, developing processes to manage the database and developing performance reports. Among the decisions that must be made are:
Who is responsible for operating, maintaining, and funding the system?
Who is the system administrator?
Who will have access to the system?
What are the roles of the database and data owners?
What are the data quality procedures and how is quality reported? and
What is the format of performance reporting and documentation?
There are two primary options for the governance of the MPMS, one is for FDOT TranStat to manage and fund the system while operating through agreements with the other FDOT stakeholder’s offices, or creating a MPMS Board with representatives of each stakeholder office that would jointly manage the system. The determination of the best option can be made in the implementation phase of the MPMS.
D-37
SHRP 2 Travel Time Reliability Analytical Product ImplementationAppendix

SHRP 2 L02 Evaluation
Cambridge Systematics, Inc. 8-1
8.0 Mobility Performance Monitoring System Implementation Plan This report has identified many potential uses for a FDOT Mobility Performance Monitoring System. Such a system will be useful and productive to FDOT. Furthermore, recent advances in information technology have made the development of decentralized systems that integrate various databases for user queries viable and feasible. Therefore, it is recommended that the FDOT Transtat office pursue implementation of a decentralized FDOT Mobility Performance Monitoring System by developing a Concept of Operations and detailed design.
Several components of the MPMS must be developed in the design phase:
1. Develop a MPMS Concept of Operations. The ConOps will include constructive stakeholder participation and will determine:
– the specific databases to be linked to the system,
– the interface requirements for each identified database,
– the communications requirements needed to transport data from each database to a FDOT processing server in near real time,
– the roles and responsibilities of each participating stakeholder,
– the office responsible for developing the MPMS, purchasing equipment/software, system maintenance and quality control, and
– a phasing plan to implement the MPMS in manageable stages.
2. Develop more detailed functional requirements for the MPMS;
3. Design a processing and storage system that meets the functional requirements in Section 7.2 of this report, the detailed requirements task and the Con Ops;
4. Determine the required output formats for queries;
5. Determine the sufficiency of the data quality controls of each database and identify any needed changes;
6. Conduct a data business plan for the system and define data governance for the system; and
7. Identify the needed information technology hardware and software needed to implement the system.
D-38
SHRP 2 Travel Time Reliability Analytical Product ImplementationAppendix