should there be lower taxes on patent income? · should there be lower taxes on patent ... sullivan...
TRANSCRIPT

Should there be lower taxes on patent income?
IFS Working Paper W18/19 Fabian GaesslerBronwyn H. HallDietmar Harhoff

1
Shouldtherebelowertaxesonpatentincome?
FabianGaessler,*BronwynH.Hall,†andDietmarHarhoff‡
July2018
Abstract
A“patentbox”isatermfortheapplicationofalowercorporatetaxratetotheincomederivedfromtheownershipofpatents.Thistaxsubsidyinstrumenthasbeenintroducedinanumberofcountriessince2000.UsingcomprehensivedataonpatentfilingsattheEuropeanPatentOffice,includinginformationonownershiptransferspre‐andpost‐grant,weinvestigatetheimpactoftheintroductionofapatentboxoninternationalpatenttransfers,onthechoiceofownershiplocation,andoninventionintherelevantcountry.Wefindthattheimpactontransfersissmallbutpresent,especiallywhenthetaxinstrumentcontainsadevelopmentconditionandforhighvaluepatents(thosemostlikelytohavegeneratedincome),butthatinventionitselfisnotaffected.Thiscallsintoquestionwhetherthepatentboxisaneffectiveinstrumentforencouraginginnovationinacountry,ratherthansimplyfacilitatingtheshiftingofcorporateincometolowtaxjurisdictions.
JELcodes:H32,H34,K34,O34
Keywords:patentbox,IPbox,innovationtax,BEPS,EPO,inventionincentive,patentownership
Acknowledgements:WewouldliketothankseminaraudiencesattheOECD,theMannheimTaxSummerSchool2017,theINNOPAT2017Conference,HarvardBusinessSchool,andthe72ndAnnualCongressoftheInternationalInstituteofPublicFinance(LakeTahoe)forhelpfulcomments.ParticularthanksgotoJostHeckemeyer,DeborahSchanz,JoelSlemrod,MehmetTosun,andAlfonsWeichenrieder.
*MaxPlanckInstituteforInnovationandCompetition,Munich.†MaxPlanckInstituteforInnovationandCompetition,Munich,UniversityofCaliforniaatBerkeley,NBER,andIFS‐London.‡MaxPlanckInstituteforInnovationandCompetition,Munich.
2
1. Introduction
Duringthepast15yearsseveralcountrieshaveintroducedspecialtreatmentforthetaxationofcorporateincomethatderivesfromtheownershipofpatentsor,insomecases,otherIP.Thispolicyinstrument(oftencalleda“patentbox”)isgenerallyintendedtoencouragethelocationofinnovativeactivitybymultinationalsinthecountrythatintroducesit.However,manyeconomistsandotheranalystshaveexpressedskepticismaboutitseffectiveness,giventhemultipleavenuesavailabletosuchcompaniesfortheshiftingofincomeassociatedwithintangibleassets(Griffithetal.2014;Sullivan2015).Thepatentboxcreatesanothersuchavenueforshiftingincome,becausetransferringownershipofapatentfromonecountrytoanotherthathasmorefavorabletaxtreatmentisastraightforwardandrelativelylowcostprocedure.
GiventhewidespreaduseofR&Dtaxcreditstoincentivizeinnovativeactivity,onemaywellaskwhethertheadditionofapatentboxisnecessaryorworthwhile.ClearlytherearedifferencesbetweensubsidizingR&Dandsubsidizingtheincomefrompatents:thefirstisanexanteincentivethattargetsadecisionvariableofthefirm,whereasthesecondisexpostandwillonlybeusedwhenR&Dhasbeeninsomesensesuccessful.Klemens(2016)pointsoutanumberofwaysinwhichanexanteincentivemaybemoredesirable.Theseincludefewerincentivesforshiftingexpensestothehighertaxratearea,difficultiesinallocatingincometothepatent,andlessdistortiontowardsincrementaldevelopmentthatgeneratesincomeonthewholeproductversusinventionofacompletelynewproduct.TothisonecouldaddthatapatentboxprovidesanextraincentiveforthekindofR&Dthatleastneedsencouragement:R&Dwhosereturnsareappropriableviathepatentsystem.IftheargumentforsubsidizingR&Dandinnovativeactivitiesisthattheycreatespilloversandpublicgoodsintheformofknowledge,itseemsoddtoencouragefirmstodirecttheireffortstowardpatentableinventions.
AmoresubstantivedifferencebetweenR&DtaxincentivesandpatentboxesisthatR&Dcoversalimitedrangeofinnovativeactivitiesthataremoreorlesstechnological,andsomesuccessfulpatentedinnovationsarelikelytocomefromotheractivities,especiallyintheservicesector.Ontheotherhand,alimitationofthepatentboxisthatitrequiresapatentorpatentsandsomedesirableinnovativeactivitiesmaynotbepatentable.Afinalobjectionisthatencouragingfirmstopatentsolelyinordertoreceiveataxsubsidyisperverseinanenvironmentwheretheremayalreadybetoomanypatents,inthesensethatsomeofwhichwouldbefoundinvalidifchallenged(USFTC2016andreferencestherein).AsKlemens(2016)says,“Thepatentboxthusgivesnewlifetozombiepatents,”bywhichhemeanspatentsthatwouldnotsurviveifchallenged.1
Oneofthewaysinwhichthepatentboxmayinducenonproductivecorporatebehavioristhatitmayencouragefirmstotransfersomeoralloftheirpatentstojurisdictionsthatofferfavorabletaxtreatmenttoincomederivedfrompatents.InthispaperweinvestigatetheextenttowhichthishashappenedfollowingtheintroductionofapatentboxinseveralEuropeancountries.Welookcloselyatthreequestions:
1Presumablythetaxauthoritieswouldnotwanttogetintothebusinessofchallengingpatentboxpatentsforvalidity.

3
1. Whenatransferofpatentownershipoccursbetweencountries,isthechoiceoftargetcountryaffectedbythedifferenceintaxtreatmentinthetwocountriesandthepresenceofapatentbox?Thatis,werelatetheprobabilityofanownershiptransfertothedifferenceinthemarginaltaxratesfacedbycorporateincomegeneratedbypatentsinthetwocountries.
2. Isthechoiceofprioritycountryinfluencedbythatcountry’streatmentofpatentincome?Wearemotivatedtosomeextentbytheobservationthattheshareofpatentswithaprioritycountrythatdiffersfromthelocationoftheinventionhasrisenintherecentpast.
3. Doespatentableinventioninacountryincreaseaftertheintroductionofapatentbox?Thatis,doesthispolicyinstrumenthavethedesiredeffect?
Inaddition,wehypothesizethatmorevaluablepatents(thatis,patentsthataremorelikelytogenerateincome,viaownprofitsorlicensing)aremorelikelytobesubjecttotransfer.
Toexaminethesequestions,weuseanewdatasetcreatedbyGaesslerandHarhoff(2018)thatcontainsallregisteredpatentownershipinformationchangesofpatentsgrantedorvalidatedinGermanybetween1981and2014.GiventhehighGermanvalidationandrenewalrates,thisdataseteffectivelycapturesallpatenttransfersinEuropeduringtheperiodandwefocusouranalysisonthetransfersofgrantedEuropeanpatents(whichwillalsobeGermanpatentswithveryhighprobability).WecombinethesedatawithpatentdatafromPatstat(April2017edition)anddetaileddataonthevariouspatentboxmeasuresthathavebeenintroducedinEuropeancountriesduringthepasttwodecades.Usingthesedata,welookattheimpactofcorporatetaxesandthepatentboxontwochoices:whethertotransferpatentsacrosscountriesandwhethertochooseaprioritycountryforpatentingthatdiffersfromthecountryofinventorresidence.Wearguethatthelatterchoicemaybedrivenbyapreferencetopatentinacountrywithfavorabletaxtreatmentofpatentincome.Weperformbothanalysesattheaggregate(country)levelandalsoatthelevelofindividualpatents,wherewearealsoabletousepatentcharacteristicstoexaminewhichpatentsaretransferred.Inaddition,welookatwhetherthepresenceofapatentbox(andthereforeanimplicitsubsidytoinnovation)increasesinventiveactivityinacountry.
2. Taxtreatmentofinnovation
Duringthepastdecades,anumberofcountrieshaveintroducedarangeofpoliciesdesignedtoencourageinnovativeactivitybyfirmsresidentinthecountry.Thispolicyfocushasbeendrivenbyincreasedawarenessoftheimportanceofinnovationforeconomicgrowthandargumentsthatfirmslefttotheirowndeviceswouldnotinvestenoughininnovationfromsociety’spointofview(Westmore2013).Amongthesepoliciesareseveralthatmakeuseofthetaxsystem.TheoldestimplicitsubsidyiswidespreadduetobeingincorporatedinstandardaccountingpracticessuchastheUSGenerallyAcceptedAccountingPrinciples(GAAP)2andvariousInternationalAccountingStandardsBoard(IASB)standards:3R&Disgenerallyexpensed,whichcorrespondstoaccelerateddepreciationgivenitseconomiclife(Hall2005,interalia).Inadditiontothis,anumberofcountrieshaveintroducedanR&DtaxcreditthatprovidesareductioninthecostofperformingR&D.For2http://www.fasb.org/home
3https://www.iasplus.com/en/resources/ifrsf/iasb‐ifrs‐ic/iasb
4
detailsonthistaxinstrument,seevariouspublicationsbytheOECD4andforevidenceonitseffectiveness,seeHallandVanReenen(2000)andAppeltetal.(2016).AppendixTableA1indicateswhichofthecountriesinoursamplecurrentlyhavesomekindofR&Dtaxcredit.
Inoursampleof51countries(thelistisshowninAppendixTableA1),thereare13thathaveintroducedsomekindofIPorpatentboxbetween1971and2014,andone(Ireland)thathasdiscontinuedit.5ThepotentialeffectivenessofanIPorpatentboxdependsonitsdesign,andonitsinteractionwiththerestofthecorporatesystem.Thismakestheanalysisofitseffectssomewhatchallenging,asthesamplesizeisrathersmallonceallthedesignfeaturesarecontrolledfor.Evers,MillerandSpengel(2014)andAlstadsæteretal.(2018)reviewtheprovisionsoftheregimeforthe13countries.Thefactthatthesereviewsdonotalwaysagreepreciselyastothedetailsofthepatentboxindicateshowcomplextheinstrumentcanbe.Theimportantdistinctionsarethefollowing:
1. Coverage–insomecases,allformsofintellectualpropertyincomearecovered,ratherthansimplypatents.Thiscouldincludesoftware,copyrights,trademarks,utilitymodels,andeventradesecretsaswellasknow‐howinafewcases.Thereisalsovariationincoverageoverroyaltiesfromothers’useofthefirm’sIPandcapitalgainsfromtheirsale.
2. Grossornetincome–Belgium,Hungary,andPortugalallowIP‐relatedexpensestobedeductedfromordinaryincome,whichisasubstantialtaxadvantage.MostschemesrequiretheseexpensestobedeductedandthereducedtaxrateappliedtothenetincomefromIP.
3. ExistingIP–schemesvaryinwhethertheycoverexistingpatentsoronlythosenewlyobtained,insomecasesrequiringfurtherdevelopmentoftheIPwithintherelevantcountry.
4. AcquiredIP–similarly,thereisvariationinthecoverageofIPacquiredfromothers,andinwhetherthereisafurtherdevelopmentrequirement.
Becauseofthefearthattheintroductionofpatentboxeswouldleadtowastefultaxcompetitionamongcountrieswithoutaconcomitantincreaseininnovativeactivity,theOECDBaseErosionandProfitShifting(BEPS)projectrecommendedin2015thattherebealocaldevelopmentrequirementforthepatenttobeeligible.BEPSreferstosucharequirementasa“nexus”requirement,thatis,arequirementforsignificanteconomicpresenceinthecountry.InthecaseoftheIPorpatentbox,thisisinterpretedasrequiringsomefurtherdevelopmentinthecountryinquestionfortheincomeassociatedwiththepatenttobeeligibleforareducetaxrate.Although2015islaterthantheperiodwestudyhere,severalcountriesinoursamplealreadyhadsuchafurtherdevelopmentrequirementifincomefromthepatentwastobeeligible:Belgium,Spain,theUK,theNetherlands,andPortugal.
Anotherfeatureofmanytaxsystemsthatwillaffecttheabilityofmultinationalstousepatentboxestoreducetheirtaxburdenaretherulesrelatedtocontrolledforeigncompany(CFC)income
4http://www.oecd.org/sti/rd‐tax‐stats.htm
5TheIrishpatentboxwasdiscontinuedaspartofthenationalrecoverybillfollowingthe2008crisis.Anew“knowledgebox”thatiscompliantwithOECD’sBEPS(BaseErosionandProfitShifting)wasintroducedin2015,afteroursampleends.Seehttp://www.oecd.org/tax/beps/formoreinformationonBEPSpolicies.

5
(Deloitte2014).Theserules,whicharecommoninlargedevelopedeconomies,requirethatifaforeigncompanyis50%ormoreownedbyadomesticcompany,itsincomeshouldbetaxedatthedomesticcompanyrateiftheforeigntaxrateislessthanthedomestictaxratebysomeamount.Thecutoffvariesbycountry,butitisusuallybetweenhalfandthreequartersofthedomesticrate.TherulessurroundingtheCFCregimescanbeverycomplex,specifyingtypesofincomeaffected,ownershiprules,etc.TwothingsregardingtheCFCrulesareworthnoting:First,whenacountryhasaCFCregime,therulesusuallyproduceablacklistthatcontainsallofthe“taxhavens”inoursample,attheveryleast.Second,followingaCourtofJusticeoftheEuropeanUniondecisionin2006,theserulescannotbeappliedwithintheEuropeanEconomicArea(EU28plusNorway,Iceland,andLiechtenstein).Bräutigametal.(2017)containsausefuldiscussionofhowthisimpactedtheIPboxes.MuttiandGrubert(2009)explainhowanMNCcanmitigatetheimpactoftheUSCFCrules.
3. Literaturereview
Overthepastyears,aconsiderablenumberofcontributionshavestudiedtherelationshipbetweentaxationandpatentsempirically.Asmallernumberhavefocusedspecificallyontheimpactofapatentboxonthelocationofpatents.Almostnonehaveexaminedotherconsequencesofthepatentbox.Inthissectionwerevieweachofthesegroupsofstudies.Tables1aand1bprovideanoverviewoftheempiricalstudiesthatwefounddirectlyrelevanttothestudyofpatentboxes.Theseanalysesdifferalonganumberofdimensions.Themajorityhavebeendoneatthefirmlevel,andafewatthecountryorpatentlevel.Twolookwithinfirmorcountryatthedifferencesacrosstechnologies.Theyearscoveredaregenerallywithinthe1995‐2015period,whichistheperiodwhenmostoftheIPboxeshavebeenintroduced.Therearerelativelyfewpapersthatincorporateapatentboxintotheanalysisandtheresultsaresomewhatmixed,althoughgenerallypositivebothforthelocationofpatents,andforR&D.Wereviewaselectionofthemostrelevantpapersinthissectionofthepaper.

6
Table1a:Literatureoncorporatetaxationandpatentlocation
CorporatetaxationandpatentliteratureThefirstgroupofpapersfocusesontheimpactofcorporatetaxationsystemsonthefirm’schoiceofpatentsystemandfilinglocation.KarkinskyandRiedel(2012)areamongthefirsttostudypatentfilingbehaviorofmultinationalenterprises(MNEs)withrespecttotaxdifferences.GiventhatpatentsaccountforasizableshareoftheassetvalueofatypicalMNEandthattransfersoftheseassetsaredifficultfortaxauthoritiestoobserveandmonitor,theyrepresentamajoropportunityforprofitshiftingacrosstaxjurisdictions.Hence,MNEsshouldhavestrongincentivestolocatetheownershipofpatentsinalow‐taxcountryandmayevenhaveincentivestolocatethecreationoftheassociatedinventioninthesamecountry,assumingthatthelocusofcreationcanbeshiftedeasily.6Ifshiftingthecreationandownershipofpatentsisnotconstrained,thencorporatepatentingshouldbemorelikelytheloweristhecorporatetaxrate.Moreover,astheseauthorspointout,inhigh‐taxcountriesthesefirmsmaybemorelikelytousetradesecrecy,becausethereisnotaxadvantagetohavingclearlyidentifiableroyaltyincomefrompatents.7Thiswouldagainimpactthenumberofpatentsfiledwhentaxratesarehigh.Astheypointout,theabsolutelevelof6ForasurveyofevidenceonR&Dlocationchoice,seeHall(2011).
7Theargumentwithrespecttotradesecretsisfairlyweak,becausetherearecountervailingeffectssuchasthedangeroflosingsecrecyifthetradesecretisspreadtoother(evenmultiple)taxlocations.Inparticular,ifthetechnologyistobeusedinmultiplesites,therewouldbeatendencytowardspatentinginordertohavebetterlegalrecourse.Therearealsosubstantialdifferencesintradesecrecylegislationacrosscountries.
Paper Data Level #Obs Years Obs/yearDependent
variable(s)Independent variables Method
Dischinger &
Riedel (2011)
European MNEs
with intang.
group
member6,223
1995‐
2005566
intangible
assets (D and
log ratio to
sales)
corp tax rate, tax diff btwn sub
and parent, log sales, pop, R&D,
GDP, growth in GDP per cap,
corruption index, unemployment
logit FE; OLS FE;
IV and GMM on
first differences
Ernst & Spengel
(2011)
EP apps;
AMADEUS
match
firm 80,4841998‐
20078,048 EP patent fi l ings
corp tax, EATR, B‐index, GDP per
cap, pubRD, Tertiary ed, GP
index, Openness, Hi tech exports,
Emply, assets
logit FE ; neg bin
FE
Karkinsky &
Riedel (2012)
EP apps;
AMADEUS
match; 18 EU
countries
firm affi liate 64,0611995‐
20037,118 EP patent fi l ings
corp tax rate, tax diff btwn sub
and parent, royalty rate, CFC
rules, R&D, GDP,corruption
index, IP strength
OLS FE
Griffith, Miller
& O'Connell
(2014)
EP apps;
AMADEUS
match; 18 EU
countries
patent 379,8491985‐
200518,088
fil ing country
choice
GDP, RD/GDP, inventor presence,
tax rate, patent box rate, IP
strength, industry‐location‐firm
size dummies
random
coefficient
mixed logit
Boehm,
Karkinsky,
Knoll, & Riedel
(2015)
EP apps ‐
corporate;
match to
AMADEUS
patent 530,8051978‐
200618,304
applicant/invent
or divergence at
pat level
corp tax rate, pat quality, rule of
law, corruption, GDP and GDP
per cap; CFC; year country
industry FE
probit FE
Dinkel & Schanz
(2015)
worldwide
patstat ‐ MNEs
matched to
AMADEUS
group‐
country62,717
2005‐
20127,840
D(pat abroad)
D (country)
N pats in
country
Tax attractiveness (corp tax rate,
royalty rate, witholding roy rate,
all scaled); D(RD tax), D(transfer
price), CFC, sales, GDP, RD per
cap, distance, app‐reg, emp‐
inventors
probit FE (ind &
year)
neg bin FE
Dudar, Spengel
& Voget (2015)
royalty
payments
country
pairs~20,000
1990‐
2012
~900
~60
countries
royalty streams
royalty tax, tax difference,
corporate tax, IP box dummies,
CFC rules, TP rules, R&D, GDP,
POP in recipient country, trade
between
Poisson PML

7
taxtariffsmaynotbedecisiveasfirmswilloptimizepatentingwithintherangeoftaxsystemstheyareoperatingin.Hence,thedifferencesbetweentaxtariffsacrossthecountriesinwhichafirmisoperatingshouldbeanimportantdeterminantofthelocationofpatenting.Moreover,thelocationrationalemayalsobeaffectedbywithholdingtaxesonroyaltypaymentsforpatentuseandalsobyControlledForeignCompany(CFC)rules,whichtypicallyallowforrecaptureoftaxonpassiveincomegeneratedindesignatedtaxhavencountries(Griffithetal.2014,Boehmetal.2015).Theycontrolfortheserulesintheempiricalexercise.
KarkinskyandRiedelmatchPATSTATpatentdata(October2007version)toinformationonownershipstructureswithinMNEscompiledbyBureauvanDijkintheAMADEUSdata‐base.Thematcheddatacomprisespatentapplicationsfiledbyfirmsfrom18Europeancountries:Belgium,CzechRepublic,Denmark,Finland,France,Germany,Greece,Ireland,Italy,Luxembourg,Netherlands,Norway,Poland,Portugal,Spain,Sweden,Switzerland,andtheUnitedKingdom.Theireconometricspecificationfocusesonthetaxdeterminantsofthepatentapplicationcountbyamultinationalaffiliateiinyeart.AscontrolstheyuselogGDP,lognumberofresearchersintherespectivecountry,indicatorsforthestrengthofpropertyrights(GinarteandPark2007),forthelackofcorruptionandlognumberofemployeesoftheaffiliate.Byusingpanelestimators,theycancontrolforaffiliateandyearfixedeffects.Theresultssuggestthatthecorporatetaxrate(relativetothetaxratesofothergroupmembers)impactspatentapplicationsfiledbyamultinationalaffiliatenegatively.Theeffectisrelativelylargeandappearstoberobusttoanumberofchecks.Invariousspecifications,theresultsindicatethatanincreaseinthecorporatetaxrateofonepercentisassociatedwithareductioninthenumberofpatentapplicationsof3.5%to3.8%.
Boehmetal.(2015)addtotheunderstandingofthepatentlocationdecisionbystudyingthedivergencebetweeninventorandapplicantcountryusingfilingdatafromtheEPOfor1990‐2007.TheystudythedecisiontofileapatentforaninventionthatwasmadeinanEUorOECDcountryinadifferentcountryasafunctionofpatentqualityandtheapplicantcountrytaxrate,aswellastheprobabilitythathigherqualitypatentsarethoseappliedforfromtaxhavencountries.Theyshowthatlow‐taxcountriestendtoattractforeign‐ownedpatentsandthathigh‐taxcountriesaremorelikelytofiletheirpatentsintaxhavencountries,especiallyifthepatentsareof“highquality”bytheusualmeasures.Lowtaxcountriesincludevariousislandtaxhavens,Ireland,Liechtenstein,Luxembourg,andSwitzerland.Theeffectsarerelativelysmallbutsignificant,andarereducedslightlyinthecasewheretheinventorcountryhasimplementedCFCrules.Notethatalthoughtheydistinguishbetweentaxhavensandothercountriesasapplicantlocations,theydonotanalyzethefulldestinationchoicedecision.
Incontrasttotheaboveanalysis,Griffithetal.(2014)areabletodistinguishamongdifferentlocationchoicesforthepatentapplicationbyusingarandomcoefficientslogitmodeltostudyafirm’sdecisionaboutthelocationofpatentownership.Theowneraffiliatecancontract(exante)withtheinventorlocationforR&Dservices,beartheriskoftheR&Dprocessandretainownershipofitsoutput.RightstotheuseofthepatentedinventionarethenlicensedtotheR&D‐performingandotheraffiliatesinexchangeforlicensingfees.Griffithetal.modelthequasi‐rentthattheparentfirmgetsfromselectingaparticularlocationforownershipasafunctionofthetaxrate,thequalityoftheidea,thestrengthofIPrightsintherespectivecountry,thesizeofthelocalmarket,andthe

8
levelofinnovativenessofthecountryinwhichownershipofthepatentresides.Theeconometricmodelisamixedlogit,wherelocationchoicecanalsobeallowedtodependontheunobservedcharacteristicsoftheideaandthelocation.Thefirm’staxrateisnotonlyaffectedbytimeandtargetcountry,butalsobyitshomelocation,sinceControlledForeignCompany(CFC)rulesintroduceaninteractionbetweenthetargetandthehomecountry.Theauthorsusedataonthestatutorycorporatetaxrate(whichisarguedtobeclosetotheeffectivetaxrate)andtheirsampleconsistsofabout1,000ofthelargestpatentingfirmsattheEPOduringtheperiod1985to2005,coveringabout70%ofcorporatepatentapplications.
Aparticularadvantageofthiseconometricsetupisthecomputationofcountry‐specifictaxelasticities.Forexample,theauthorsestimatethattheshareofpatentslocatedinLuxembourghasasemi‐elasticityof3.9%withrespecttothetaxrate,whileGermanyhasamuchloweroneof0.5%.Ingeneral,ownsemi‐elasticitiesaremorepronouncedforsmallerthanforlargercountries.Theauthorsprovideresultsforasimulationexerciseinwhichtheintroductionofpatentboxesisconsidered.Theyfindthatwhilepatentboxesattractpatentincome,theyalsoleadtoasubstantialreductionintaxrevenues.Countriesthatintroducepatentboxesinthetimeperiodconsideredattractmorenewpatents,buttheincreasedshareofpatentfilingsisnotsufficienttooutweightheeffectofthelowertaxrate.
PatentboxliteratureWenowturntothosepapersthatexplicitlyanalyzetheimpactofthepatentboxinstrumentonpatentlocationandtransfer,showninTable1b.Alstadsæteretal.(2018)analyzetheuseofpatentboxregimesbythe2,000largestcorporateR&Dperformersworldwidefortheperiod2000‐2011.Theirsamplecomprises33countries(theEU28,theUSA,Canada,Switzerland,theRepublicofKorea,andChina)andthefirmsaccountforalmost90%ofglobalR&Dspending.Firmsactiveinthreebroadlydefinedsectors(pharmaceuticals,motorvehicles,andinformationandcommunicationtechnologies)areincluded.Usingvariousnegativebinomialmodelsforthenumberofpatentsofaparticulartechnologytypelocatedinacountrybyeachofthesemultinationals,theyfindthatthetaxadvantageofapatentboxdoesinducefirmstolocatetheirpatentsinacountry.However,interpretationoftheregressionsisproblematic,sincetheyincludebothadummyforthepresenceofapatentboxandthetaxadvantageofsuchabox.Thesevariablesareveryhighlycorrelatedandareessentiallytwodifferenterror‐riddenindicatorsofthesameunderlyingconcept.Aspredicted,thebettermeasureenterspositivelyandtheothernegatively(Hall,2004).

9
Table1b:Literatureonpatentboxes
Alstadsæteretal.(2018)alsoexaminetheimpactofthedetailedprovisionsofthepatentbox,findingsomewhatinconsistentresultsacrosstechnologies.Broaderscopeofpatentboxbenefitsmakesaffiliatelocationsmoreattractive,andhigh‐valuepatentsaremoreimpactedthanlow‐valueones.Whiletheauthorsfindataxadvantageforthefirmusingpatentboxes,therearesmallnegativeeffectsonlocalinvention.However,ifthereisalocaldevelopmentrequirement,thispreventspurelyopportunisticshiftingofpatentfilingsandinthiscasepatentboxeshaveasubstantialpositiveimpactondomesticinventions.
BösenbergandEgger(2017)lookatpatentfilingsandpatenttrade(ownershiptransfer)asafunctionofallthepossibletaxincentivesthataffectpatenting.Tothisend,theyconstructacountryleveldatasetwithcomprehensiveinformationonR&Dtaxincentivesfor106countriesbetween1996and2012.ThetwomainmeasurestheycreatearetheeffectivemarginalR&Dcostduetoitsspecialtaxtreatment(EMTR,widelyknownasthe“Bindex”,Warda2002)8andtheeffective
8Technically,theB‐indexistheratiooftheafter‐taxcostofR&Dtotheafter‐taxprofitsofthefirm,soitisequaltounitywhenthereisnospecialtaxtreatmentforR&D,andislessthanoneinthecaseofspecialR&Dtreatment.ThusitisnotreallytheeffectivemarginaltaxrateonR&D(inspiteoftheterminologyusedbyBösenbergandEgger2017),butisnegativelyrelatedtoit.Thisimpliesthattheexpectedimpactoftheb‐
Paper data level #obs years obs/yeardependent
variable(s)independent variables method pat box result
Alstadsaeter,
Barrios,
Nicodeme,
Skonieczna and
Vezzani (2018)
EP apps; ORBIS
data for EU
scoreboard
firms in 33
countries
firm‐
technology‐
industry
~160,0002000‐
20114444? EP patent fi l ings
GDP, inventor presence, tax rate,
patent box rate, triadic pats, IP
strength, country dummies
random effects
neg binomial; R
coeff mixed logit
fi l ings wrt box:
‐5.0 (semi‐
elasticity)
Bösenberg &
Egger (2017)
EP apps; 106
countries
country‐
technology639; 9425
1996‐
201249; 2600
fil ings and
transfers
B‐index, EATR, pat box dummy;
researchers per cap, GDP, avg pat
characteristics
Poisson FE
(year)
seller: 0.43***
buyer: 0.23***
Bradley, Duchy,
and Robinson
(2015)
worldwide
patstat countries 1,487
1990‐
2012
~70
countries
inventor patent
apps; owner
patent apps;
pats with inv
country not
owner country,
etc
Patent box, pat box rate, other
tax vars, GDP, population, patent
system quality
Panel OLS
domestic
inventing
increases if
rate falls; no
impact on
mismatch
owner‐inventor
Dudar, Spengel
& Voget (2015)
royalty
payments
country
pairs~20,000
1990‐
2012
~900
~60
countries
royalty streams
royalty tax, tax difference,
corporate tax, IP box dummies,
CFC rules, TP rules, R&D, GDP,
POP in recipient country, trade
between
Poisson PML
Royalties
increase i f IP
box covering
acquired and
self‐generated
patents
Koethenbuerger,
Liberini &
Stimmelmayr
(2016)
MNCs from
Orbissubsidiaries
85,944
(30,798
matched)
2007‐
2013
12,715
(4,498
matched,
2,942
patenters)
stated profit
before tax
D(patent box),(new pat entrant),
and interactions; assets, leverage
diff‐in‐diff; ind‐
year, ctry‐year
Fes
pat box used
for profit
shifting
Schwab &
Todtenhaupt
(2016)
MNCs from
Orbis/AMADEUS
with sub in
patent box
country match
to PAtSTAT
firm 271,2512000‐
201220,865
worldwide pat
grants
patent box, R&D/GDP, GDP per
cap, corp tax, GDP growth R&D
user cost. Real interest rate, firm
age, assets, work cap, capital
intensity
Poisson FE (firm
& year)
pat box in
other countries
has positive
spillovers on
domestic R&D
Ciaramella
(2017)EP apps firm 329,398
1997‐
2015~16,000
patent transfers
during the exam
phase at the EPO
pat box, corp tax rate, CFC; log
GDP, distance, language, RD/GDPNeg Bin FE (year)
buyer: 1.2***
seller: insig
Mohnen, Vankan
& Verspagen
(2017)
Dutch firm data firm2007‐
2013~15,000
R&D person‐
hoursuse of patent box diff‐in‐diff
pat box
positive for
domestic R&D

10
averagetaxrate(EATR)ontheprofitfromR&D,whichincludesinformationonthecorporatetaxrate.Theyalsoincludedummiesforthepresenceofataxholiday,grant,and/orpatentbox.Notably,theydonotincorporatethepatentboxrateintotheEATRonR&Dprofits.
Theempiricsinthepaperrelatepatentfilingsandpatenttradeacrosscountriestothetaxvariables,patentcharacteristics,countrycharacteristicsanddistancesbetweencountries.TheyfindthatfilingsinacountryrespondtoEATRbutnottotheB‐indexorthepresenceofapatentbox,althoughthesignsofthesecoefficientsareasexpected.PatenttraderespondstotheEATRinthesendingcountryandtotheB‐indexinbothcountries,withanambiguoussignontheB‐indexforthedestinationcountry.9Italsoappearsthatmorevaluablepatentsaremorelikelytobetransferred.Notethatthepatenttrademeasureinthispaperisbasedmainlyontransferspriortograntbyapplicantcountry.However,focusingonlyonpre‐granttransfersmaylimitapplicability.AsGaessler(2016)shows,manytransfersoccurpost‐grant,henceitisuncleartowhatextenttheresultspresentedbyBösenbergandEgger(2017)areaffectedbyselectionissues.Giventhepatentrenewalevidencethatitmaytakeyearstodeterminewhetherapatentableinventionisvaluable,post‐granttransferssuggestthatfirmswaitinordertodeterminewhichpatentstotransfer.
Dudaretal.(2015)usedataon61countriesworldwide1990‐2012toexamineroyaltyflowsbetweencountriesinresponsetotaxdifferences.Theyfindalargeeffect,inthataonepercentdeclineintaxratesbetweenjurisdictionsleadstoa6percentincreaseinroyaltyflows,whichislargerthanmostoftheresultsforpatentsintheliterature.Theyarguethatthisisconsistentwiththeideathathigherqualityintangiblesintheformofpatentsaremorelikelytobetransferred.Astopatentboxes,theyfindthatwhentheyapplytoacquiredandself‐generatedIPintherecipientcountry,royaltypaymentstothatcountrydoincrease.
Bradleyetal.(2015)examineworldwidepatentapplicationsbyinventorsandapplicantsinacountryasafunctionofthepatentboxanditsassociatedtaxratebetween1990and2012.Thistimeperiodmeansthattheyhaverelativelyfewpatentboxobservations(about12percent)andtheydonothavetransferdata,sotheyinfertheimpactontransfersfromchangesinthemismatchbetweeninventorandpatentownercountry.Theyfindthatalowerpatentboxtaxrateisassociatedwithanincreaseindomesticinventorpatenting,butnotwiththepropensityforinventorandownercountriestodiffer.TheyalsofindthatregimesallowingtheuseofacquiredIPlowerdomesticinventoractivity,suggestingsomekindofsubstitutionbetweendomesticinventionactivityandtheuseofacquiredIPfromothercountries,althoughthisconclusionisfairlyspeculative.
Koethenbuergeretal.(2016)looksatwhethermultinationalswhowereabletobenefitfromtheintroductionofapatentboxbecausetheyownedpatentssucceededinincreasingtheiraffiliateprofitsinthepatentboxcountry,whencomparedtomultinationalaffiliatesinthesamecountry
indexandtheEATRonR&Darethesame.Alowerb‐indexisexpectedtoencourageR&D,asdoesalowereffectiveaveragetaxrateontheprofitsfromR&D.
9Theregressionsshowsignsofmisspecification,asthePoissonandnegativebinomialresultsdiffergreatlyintheircoefficients.Forconsistency,itwouldhavebeenbettertoreportPoissonresultswithrobuststandarderrorestimates,sincethenegativebinomialmodelismoresubjecttoinconsistencyofthemeanestimate.

11
whoseparentsdidnothavepatents.Theyuseadifference‐in‐differenceanalysiswithacarefullychosencontrolsampleofmultinationals.Theyalsofindthatthisprofit‐shiftingbenefitwasconfinedtoaffiliatesincountrieswhereexistingand/oracquiredpatentswerecoveredbytherespectivepatentbox.Theirresultdoessuggestthatintheabsenceofthenexusrequirement,profitshiftingviapatenttransferdoestakeplaceinresponsetotheintroductionofthepatentbox.
Inaninterestingstudy,SchwabandTodtenhaupt(2018)lookatadifferentconsequenceoftheintroductionofapatentbox.TheyarguethatbecauseapatentboxinoneofthecountriesinwhichtheyhaveaffiliatesiseffectivelyareductioninthecostofR&Dcapitalthattheyface,itshouldincreasetheirR&Dactivityoverall.TheyconfirmthisideausingapanelofmultinationalfirmsactiveinEuropeduringthe2000‐2012period.Firmsthatareexposedtoapatentboxforoneoftheiraffiliatesincreasetheirpatentoutputbyabout15percent,butonlyifthepatentboxisnotsubjecttoanexusrequirement,consistentwiththeresultsofAlstadsæteretal.andKoethenbuergeretal.UsingconfidentialGermandata,theyarealsoabletolookattheR&DspendingchoicebyGermanmultinationalsandfindthatthistoorespondstotheintroductionofapatentboxwithoutanexusrequirement.Unfortunately,thecountrieswithoutanexusrequirementarearathersmallset:France,Hungary,Malta,andCyprus.Likemanyofthestudies,includingours,identificationnecessarilyrestsonthevariationinpatentboxdesignacrossonlyafewcountries.
LikeBösenbergandEgger(2017),Ciaramella(2017)studiesthetransferofEPpatentsduringtheexaminationphaseattheEPOinresponsetotheintroductionofthepatentbox,butatthefirmlevelandforthe1997‐2015period.Restrictingtheanalysistotransfersmadebeforethepatentsaregrantedcoversabout60percentofalltransfersbyhercomputations.Theresultssuggestthataonepercentincreaseinthetaxrebateassociatedwiththepatentboxwouldinduceabouta10percentincreaseinpatenttransferstothatcountry,andthattheresponseofhigherqualitypatentswouldbeslightlyhigher.Shealsoconfirmsthatpatentboxdesignmatters:restrictingtheuseofacquiredandexistingpatentsandrequiringfurtherdevelopmentofthepatentedinventionbothdiscouragepatenttransfersinresponsetotheavailabilityofalowertaxrate.Theeffectivepatentboxcoefficientisinsignificantlydifferentfromzerowhenfurtherdevelopmentisrequired.
InoneoftheonlypaperstolookattheimpactofthepatentboxonR&Dspending,Mohnenetal.(2017)studytheimpactoftheDutchpatentboxonR&Dperson‐hoursinthefirmsthattakeitup.Theyuseadifferences‐in‐differencesapproachandfindanincreaseinR&Dinresponsetothepatentbox,althoughbytheirestimatestheincreaseisabouthalfofthelosttaxrevenue.ThismakesitasomewhatlessattractivepolicyforinducingR&DwhencomparedtotheapproximatelyunitelasticityestimatesfortheR&Dtaxcredit(HallandVanReenen,2000).
4. Models
Afirminvestingininnovationfacesanumberofdecisions:1)thelocationchoiceforitsR&Dinvestments,2)whethertofileforpatentsontheresult,3)ifso,thelocationofthefirstfiling,4)thelocationofownershipofthepatents,and5)anyotherlocationsinwhichtofile.ThetaxtreatmentofR&Dandpatentswillaffectallthesedecisionstovaryingdegrees.TheR&Dlocationdecisionislikelytobemostsensitivetotheavailabilityofskilledpersonnel,themarketsizeinthecountry,and

12
possiblythe(tax)costofdoingR&D.UnlessthepatentboxhasastrongrequirementthattheassociatedR&Dbedoneinthecountry,thisdecisionisunlikelytobedrivenbyitsavailability.10Similarly,patentcoveragebyitselfisdrivenbytheneedtoexcludeothersinthecountryinquestion,thecostofsuchexclusion,theadequacyofpatentenforcementinthecountry,theavailabilityofadequatetradesecretprotection,andthelike.Conditionalontheexistenceofpatentableinventions,theavailabilityofapatentboxshouldmattermainlyforthelocationofownershipofthepatentandtheabilitytoattachrevenuetothatownership.Thatis,patentingisdrivenbyasetofconsiderationsthatarefairlyorthogonaltothechoiceoflocusforpatentownership,withoneexception.Theexceptionisthatmoreprofitablepatentswillbepreferredfortransfertoalowertaxjurisdiction.
Ouranalysisisperformedattwolevelsofaggregation:countrylevelandpatentlevel.Thefirst,whichaggregatesalltransferstothesendingcountry‐receivingcountry‐yearlevel,allowsustoexaminetheimpactofthetaxvariablesandothercountry‐levelvariablesonthreelocationdecisions:wheretoapplyforthefirst(priority)patentonaninvention,thelocationoftheapplicantcountrywhenapatentisappliedfor,andwhereandwhentotransferownershipofpatents.11Thesecondallowsustoexaminethechoicesattheindividualpatentlevel,whichmeansthatwecanincludepatentcharacteristicsinouranalysis.
Intheaggregateanalysis,weestimateacountdatamodelforthenumberofpatentstransferredfromcountryStocountryBinyeart(orinventedincountrySbutcountryBischosenasthepriorityapplicationorasthelocationoftheapplicant):
(# | , ) ( , )St Bt S B t St BtE transfersS B X X f X X
Thefunctionf(.,.),whichisintendedtocapturetherelativeattractivenessofcountrySandcountryBasalocationfortheprofitsfrompatents,isproxiedbyarangeofvariablesthatdescribethechangingtaxenvironmentinbothcountriesovertime,aswellasothercountrycharacteristics.Weuseagravitymodelofthechoice,wherethedependentvariableisthenumberofpatentsappliedforthatyearbytheinventor‐priority/applicantcountrypair,controllingforcountryandyearfixedeffectsaswellasthetwocountry’sGDP,population,R&D,andpatentingactivity.
Thegeneralformofagravitymodelisthefollowing:
k kijt i j t kit kjt ijt
k k
Y X X
10However,itisinterestingtonotethattheDutchinnovationboxallowsitsuseinthecasewherethefirmhasobtainedanR&Dcertificate,whichisneededtousetheR&Dtaxcredit(BongaertsandIjzerman,2016)reportthatthevastmajorityofDutchfirmsusingtheinnovationbox(82%)makeuseofthisfeatureratherthanusingincomefromapatent.ThisfactalonesuggeststhatpatentboxschemesareunlikelytobeasusefulasR&DtaxcreditsinstimulatingR&D.
11Althoughthetransferchoiceandprioritychoiceareopentoanyapplicant,presumablyonlyapplicantswithlocationsinmultiplecountriesarefreetochoosethecountryfromwhichtheyapply.

13
Inourcasei,jdenotesellerandbuyercountryrespectivelyandtistheyearofpatenttransfer.Yisthenumberofpatentstransferred,XiandXjarethecharacteristicsofcountriesiandj,andηisadisturbance,whichmaybeheteroskedastic.Forestimation,andassumingthatthedisturbanceηisindependentoftherighthandsidevariables,theequationistransformed:
exp ln ln ln ln ln
and E[ | , , ] exp ln ln ln ln ln
ijt i j t k kit k kjt ijtk k
ijt it jt i j t k kit k kjtk k
Y X X
Y i j X X X X
AssuggestedbySantos‐SilvaandTeneyro(2006),thismodelcanbeestimatedbypseudo‐maximumlikelihood,thatis,Poissonwithrobuststandarderrors.Theyshowthatthisestimatorispreferredforgravitymodelsintermsofbiasandhastheadditionalbenefitthatzeroesinthedependentvariableareallowed,whichisnottrueoftheusualloglineartreatmentofthegravityequation.Seethatreferencefordetails.WeusearandomeffectsPoissonmodelwithrobuststandarderrorsclusteredonthebuyer‐sellercountrycombinationsforestimation.Thatis,therearefixedcountryeffects,butrandomeffectsforthecountry(buyer‐seller)combinations.Thismodelismorerobusttomisspecificationthanthealternativenegativebinomialmodel,andthestandarderrorestimatesallowfortheoverdispersion,whichisclearlypresent.Experimentswiththenegativebinomialmodelanditsrandomeffectsversionproducedunstableresults,supportingtheviewthatthisdistributionalassumptionwasnotjustified.
Theaboveanalysisistosomeextentsimplydescriptive,ratherthanbeingderivedfromtheapplicant’schoiceproblem.Amorecompletemodelwouldneedtobeanalyzedatthefirmorpatentlevel.Atanyperiodintime,thefirmfacesthechoiceofkeepingthepatentwhereitisortransferringittoanothertaxjurisdiction.Thereasonsfortransferincludemergers/acquisitions,assetsales,ortaxconsiderations.Ourfocusisthelatter,andweareforcedtoassumethatthetaxeffectisroughlyorthogonaltotheothercausesoftransfer,duetotheabsenceofaccuratedataontheseothercauses.AnalternativeinterpretationisthatourestimatesencompassanytaxadvantagemotivationsderivingfromM&Aactivity.Weaddressthisquestionlaterwhenwefocusinourempiricalworkonintra‐grouptransfersacrosscountries,whicharearguablypurelytaxmotivated.
Oursecondempiricalmodelexaminesthechoiceofwhichpatenttotransfer.Inprinciple,afirmconsideringtransferringownershipofapatentacrosscountriesfacesamultitudeofchoices,andwouldchoosebasedonthetaxrateonpatentincome,thetransfercost,andwhetherithadasubsidiaryinthecountry.Thissuggeststhatachoicemodelsuchaslogitwouldbetheappropriatewaytoanalyzethechoiceofthecountrytowhichtotransferthepatent.However,estimationofsuchamodelwouldbedifficult,giventherelativefewactualobservationsavailableforidentification(IPtaxchangesin12countriesduringtheperiod,withvaryingrules).Thereforewefocusonthechoicetotransferasafunctionofpatentandownercharacteristics,usingalogitmodelwithstandarderrorsclusteredatthepatentlevel.Wethenexplorehowthetypeoftransfer(toatax‐favoredjurisdiction,orwithinagroup)varieswiththesecharacteristics.

14
5. Data
Thereareapproximately1.2millionregisteredownershiptransfersofEuropeanpatents(EP)intheMPI2018patenttransferdatabase.12Abouttwo‐thirdsofthesetransfersarewithinagroupoffirms,whileonlyabout12percentareacrosscountries.ThemostcommontransfersaretoandfromGermanyandtheUnitedStatesandSwitzerland.Grantedpatentsarefarmorelikelytobetransferredandtransferredpatentsareuniformlydistributedacrosstechnologyarea.Formoredetailontherawdata,seeGaesslerandHarhoff(2018).
Forthestudyhere,werestrictthesampletotransfersamong51countriesforwhichwehavetaxinformation.OursampleincludesalmostallEuropeancountries,theUS,Canada,Mexico,Chile,Australia,NewZealand,Japan,Korea,and14“taxhaven”countriesorjurisdictions,mostlyintheCaribbean.Itincludes95percentoftheinternationaltransfersinthedatabase.13ThecompletecountrylistisshowninAppendixTableA1,andthelistofthepatentboxcountriesonlyinAppendixTableA2.
WecombinethesedatawithtaxdatafromAlstadsæteretal.(2018),Eversetal.(2015),andtheOECDoncorporatetaxationandthetaxtreatmentforintangibleassetsincludingpatentboxes.14Figure1ashowsthedistributionofcorporatetaxratesduringthe2000‐2014periodforthe37countrieswhichhavecorporatetaxation(thatis,excludingthe14taxhavens)andFigure1bshowsthedistributionofthewedgebetweentherateonordinaryincomeandthatonpatent‐generatedincomeforthosecountriesthathaveapatentbox.Themediancorporatetaxrateis28percentandthemedianreductionforpatentsisaround18percent.Themediantaxrateonpatent‐relatedincomeforthosecountriesandyearsthathaveapatentboxis7percent.
12TheMaxPlanckInstituteforInnovationandCompetitionPatentTransfersData2018.
13101,091transfersoutof106,642overthe2000‐2014period.
14Wecheckedthecodingoftheexisting/acquiredIPexclusionsandthedevelopmentconditionsattachedinvarioussources.DeterminingtheprecisedefinitionofeligibleIPturnsouttobedifficult,andthereissomeconflictamongthevariousresearchpapers.Inaddition,giventheabilityoffirmstocreatelocalsubsidiaries,itisnotclearthattheserestrictionsbiteinsomecases.Unfortunatelyusingmorenuanceddefinitionsofthesevariablesleavesuswithnodegreesoffreedomtoidentifytheireffects.

15
Figure1
6. Aggregateanalysis
InternationalpatenttransfersOurinitialexploratoryanalysisisattheaggregatelevel.Weobservethenumberofpatenttransfersfromeachof51countriestotheother50countries(excludingwithincountrytransfers).Forestimation,werestrictthetransfersampleto2000‐2014,whichiswhenmostofthepatentboxeswereintroduced.15Thetotalnumberofobservationsinourdataistherefore38,250=15*50*51.16Figure2showstheaggregateEPpatenttransfersintothecountriesthatintroducedthepatentboxduringthe2000‐2014period,asafunctionofthenumberofyearsbeforeandafteritsintroduction.ThefigurealsoshowsthetransfersofEPpatentsrestrictedtobewithinafirmgroup.Bothcurvesshowtheexpectedincreaseintransfersduringthetwoyearsfollowingthepatentboxintroduction,withthewithingroupcurveincreasingsomewhatmore.Theeffectdiminishesafter2years,probablybecausethedesiredtransfershavebeencompleted.Thereisalsoahintofpatentboxanticipationthreeyearspriortoitsintroduction.Itisdifficulttogetprecisedatesforallthe
15Therearetwoexceptions:France(1971‐)andIreland(1973‐2010,2015‐).Asourtransferdatabeginsonlyin1981,Francedoesnotcontributetoidentification,andforIrelandidentificationcomesfromtheboxremovalratherthanintroduction.Therecentlyre‐introducedpatentboxinIrelandisoutsideoursampleyears.
16Twoofthetaxhavenjurisdictions(JerseyandAruba)havenopatentstotransfer,sothetotalnumberofobservationsisactually49*50*15=36,750.Inaddition,Francehasapatentboxduringtheentireestimationperiod,whichmeansitwillnotcontributetoidentificationofthepatentboximpactinthepresenceofthecountrydummy.

16
countriesastowhenthepatentboxfirstbecamearealprobability,butwedoknowthatfortheUK,thelegislationwasactuallyinplacelongbeforethedatewhencoveragebegan(2013).17
Figure2
Asdescribedinsection4,weestimateacountdatamodelforthenumberofpatentstransferredfromcountryStocountryBinyeart.Weincludearangeofvariablesthatdescribethechangingtaxenvironmentinbothcountriesovertime,aswellassomeothercountrycharacteristics.ThestatutorycorporatetaxrateofS(sellercountry)andB(buyercountry)isincludedinmostregressions.Thisrateexcludesanyadvantageduetothepatentbox.Tomodelthepatentbox,weusedeitheradummyforitspresence,orthemagnitudeofthereductionfromthecorporatetaxrate(corporatetaxratelessthetaxrateonincomeattributedtopatents).Theothercountrycharacteristicsincludedarepopulation,realGDPpercapita,EPpatentapplicationspercapita,andtheR&D‐GDPratioplusadummyforthosefewobservationswhereR&Dspendingwasunobtainable.ThepopulationandGDPnumberscomefromthePennWorldTables8.1(Feenstraetal.2015),whiletheR&DfigurescomefromtheUNESCOInstituteforStatisticsdatabaseandarealsoavailablefromtheInternationalMonetaryFundstatisticaldatabase.
Inpracticewefoundthatexcludingthe14taxhavencountriesfromthesamplemadelittledifferencetotheestimates,sowefocushereontheresultsthatarebasedonthe37countrysample,
17Seehttps://www.gov.uk/guidance/corporation‐tax‐the‐patent‐box.Thisdocument,datedJanuary2007,describesthepatentboxtobeintroducedin2013.

17
whichincludesall13countriesthathaveintroducedapatentboxby2014.18TheseresultsareshowninTables2aand2b.Resultsforthe51countrysampleareshowninAppendixTablesB1andB2.
ThefirstthreecolumnsofTable2ashowthebasicresultsforPoissonrandomeffectsestimationofthenumberofinternationalpatenttransfersfromonecountrytoanotheronthetaxvariablesandcompletesetsofdummiesforbuyerandsellercountriesaswellasyeardummies,whilethenextthreecolumnsaddthevariouscountrycharacteristics.19Thecountrydummiesalreadycontroltosomeextentforthefactthattheaveragenumberofpatents,thesizeoftheeconomyanditstechnologicalintensityvaryenormouslyacrosscountries,soaddingthesecharacteristicstotheregressiononlycontrolsfortheirchangeovertime.Wefoundthatonlythebuyercountrypopulationandpercapitalpatentingenteredtheregressionsignificantly.
Columns1and4inTable2includethecorporatetaxratesandthemagnitudeofthedifferencebetweenthecorporatetaxrateandthepatentboxrateforbothcountries.Theoverallcorporatetaxratesdonotentertheregressionsignificantly,althoughwedofindsomeevidenceforpatentboximpactonpatenttransfers.Thepresenceofapatentboxissignificantlynegativefortheseller(sending)countrybutnotforthebuyer(receiving)country.Thusoncewecontrolforseller,buyer,andyear,onlychangesinthepotentialseller’staxrateshaveanynoticeableeffectonthenumberofpatentstransferred,withthelowertaxratesonpatentboxincomeinthesellercountrydiscouragingthetransferofpatents.
AsFigure2suggests,wewouldexpectthatthepatentboximpactonpatenttransfermightbetransitory,becausepatentapplicationsaftertheintroductionofapatentboxwillsimplybemadefromtherelevantjurisdiction.Incolumns2and5ofTable2,thisideaisexploredbyincludingpatentboxdummiesorthepatentboxtaxwedgeonlyinyears0,1,and2followingthepatentboxintroduction.Theresultsshowthatthereisatransitoryimpactofthepatentboxontransferstoacountrywhichisstrongestinyear2.Thatis,ittakessometimeafterthepatentboxintroductionfortransferstothatcountrytorespond.
Columns3and6ofTable2ashowestimateswherewerestrictthetransferstothosethatarewithinthegroup,thatis,transferswithinamultinationalfirm.Inthiscasetheresultsareevenstronger,aswemightexpectgiventhatthetaxbenefitsareentirelywithinthefirm.Thesumofthecoefficientsonthepatentboxwedgeis4or5,whichimpliesthatachangeof10percenttothewedge(e.g.,movingfrom10percentto20percentdifferencefromthecorporatetaxrate)isassociatedwithafourtofive‐foldincreaseinthenumberofpatentstransferred.
18Thesampleis27Europeancountries,Australia,Canada,Chile,Israel,Japan,SouthKorea,Mexico,NewZealand,Turkey,andtheUS.
19Weclusterthestandarderrorsbyorigin‐destinationcountrypairs.Ourestimationstrategymeansthattheaveragetransfereffects(toandfrom)foreachcountryaretreatedasfixedeffects,whiletheaveragetransfereffectbetweenspecificpairsofcountriesistreatedasarandomeffect,conditionaloneachcountry’sownaveragetransferprobability.

18
Table2a
InprinciplethedecisiontotransferIPfromonejurisdictiontoanothershoulddependprimarilyonthedifferenceintaxratesinthetworegimes,ratherthanontheirabsolutelevel.Suchanapproachisalreadysuggestedbythenonsignificanceofbuyercorporatetaxrateandsomeofthesellerpatentboxvariablesinthepreviousmodels.Denotingthestatutorycorporatetaxrateasτandthetaxrateonpatentincomeasρ,wedefinethefollowingvariables:
( ) ( ) ( ) ( )S B
B B S S S B S B
difftax
diffbox
Thesevariablesaredefinedinsuchawaythattheirexpectedcoefficientsarepositive(thegreaterthesellertaxrateisrelativetothebuyertaxrate,thehigherthelikelihoodofatransfer).
Table2bshowstheresultsofestimationwiththesevariables,andadditionalresultsareshowninAppendixTableB3.Neitherdifftaxnordiffboxissignificantbyitselfinpredictingpatenttransfers.Thevariablediffboxisalsointeractedwithseveralotherfeaturesofthetaxsystemintheregressionsfollowing:1)whetherexistingpatentsareeligible(showninTableB3);2)whetheracquiredpatentsareeligible(showninTableB3);3)whetherthereisrequirementoffurther
All All
Within
group All All
Within
group
Variable (1) (2) (3) (4) (5) (6)
Buyer corporate tax rate 0.81 1.07 0.24 ‐1.02 ‐0.71 ‐1.34
(1.28) (1.33) (1.83) (1.25) (1.28) (1.59)
Buyer patent tax rate wedge ‐0.04 ‐0.29
in all years after introduction (0.76) (0.67)
Buyer patent tax rate wedge 0.18 0.17 ‐0.12 ‐0.14
in year of introduction (0.67) (0.87) (0.63) (0.79)
Buyer patent tax rate wedge 1.07 1.59 0.83 1.41
in year after introduction (1.40) (1.53) (1.35) (1.41)
Buyer patent tax rate wedge 2.41* 3.41** 2.05* 3.07**
two years after introduction (1.27) (1.45) (1.21) (1.32)
Seller corporate tax rate 1.11 1.17 0.88 0.59 0.63 0.00
(1.03) (1.00) (1.27) (1.44) (1.43) (1.88)
Seller patent tax rate wedge ‐1.52** ‐1.43** ‐2.01*** ‐1.38** ‐1.33** ‐2.09***
(0.63) (0.62) (0.76) (0.66) (0.67) (0.70)
Chi‐squared 4191.5 4110.5 3139.6 4486.2 4473.0 12817.9
Degrees of freedom 92 94 94 102 104 104
Inter‐country patent transfer flowsDependent variable: Number of patents transferred from seller country to buyer country during the
year
Regressions in columns 4‐6 also include the buyer and seller aggregate patent applications, population, GDP per
capita, and R&D intensity, all in logs.
19,980 observations on 1,332 country pairs, 2000‐2014
Poisson random effects panel regression with standard errors clustered on buyer‐seller country pairs.
Coefficient significance is denoted by * p<0.1, ** p<0.05, *** p<0.01.
All regressions include complete sets of dummies for the 37 buyer and seller countries and years.

19
developmentoftheinventioninthecountry;4)whetherCFCrulesapplybetweenthesellerandbuyercountry.Measuringtheimpactofalltheseresultsischallengingduetoanabsenceofsufficientvariationacrosscountries(seeTableA1).Thereforeweexaminethemoneatatime.Allowingexistingand/oracquiredpatentstobenefitfromthepatentboxdoesnothaveasignificantimpactonthenumberoftransferstothatcountry,althoughthelargestandarderrorsdonotwarrantstrongconclusions.
Incontrast,therequirementforfurtherdevelopmentofthepatentedinventioninthebuyercountrysubstantiallyreducestransfers,whilecountrieswithoutthatrequirementseeanincreaseintransfersfromthepatentbox.Wecancomputethepotentialimpactofachangeinthepatentboxtaxadvantageforsystemswithandwithoutthisfeature,findingthattheresponsetoa10percentincreaseinthetaxadvantagefromapatentboxisassociatedwithanincreaseofabout14percent(standarderror6percent)ifexistingand/oracquiredpatentsareincludedandminus6percent(standarderror10percent)iftheyareexcluded.Thisresultisconsistentwiththeprofit‐shiftingresultsofKoethenbuergeretal.(2016).
CFCrequirementsimposedonthebuyercountrybythesellercountryalsoreducethelikelihoodoftransferringpatents,althoughifthegapincorporatetaxratesislargeenough,itisabletooverridethisimpact.ThepointatwhichtheCFCimpactturnspositiveisacorporatetaxratedifferenceofabout11percent,soitiswellwithinourdata.Again,wecautionthattheconfidenceintervalforthispointisquitebroad,giventhestandarderrors.
Columns4and8inTable2bshowtheresultsforwithin‐grouptransfers,asinTable2a.Theyarequitesimilartothoseforalltheinternationaltransfers,withtheexceptionoftheCFCrules,whichhaveasomewhatstrongerimpactwheninteractedwiththepatentboxdifferentialandaweakerimpactinteractedwiththeoverallcorporatetaxdifferential.

20
Table2b
Theseresultsleadustotwoconclusions.Overall,thepresenceofapatentboxdoesseemtoinducesometransferstothejurisdiction,albeitwithabitoflag.Theresultsalsoshowthatifacountry’spatentboxdoesnotrequirefurtherdevelopmentoftheinventioninthecountry,morepatenttransfertothecountrywillbeinduced.AlongwithCFCrules,thedevelopmentrequirementismoreimportantinourdatathanwhetherornotpre‐existingoracquiredpatentsareincludedamongthepatentseligibleforspecialtaxtreatment.
ChoiceofprioritycountryWenowturntothechoiceofwheretofileforapatentfirst(prioritychoice)andthequestionofwhichcountrywillbechosenasthecountryofownership.Obviouslythislatterquestionaffectsmainlymultinationalfirmsthathavesubsidiariesinseveralcountries.Figure3illustratestheglobalizationtrendsinpatentfilingattheEPO.In1980,thevastmajorityoffilingsweremadefromthecountryoftheinventorresidence,whichispresumablythecountryinwhichtheresearchleadingtotheinventionwasperformed.Thereisasustainedriseincaseswherethechosenprioritycountrywasdifferentfromthatoftheinventor,from5percenttoalmost14percent,andinitialrisefollowedbyalevelingoffincaseswherethecountryoftheapplicant(patentowner)wasdifferentfromthatoftheinventor.Weknowthatoneofthereasonsforthesechangesistheincreasingglobalizationofpatents,withanincreaseinthenumberofjurisdictionsforwhichprotectionforan
All All All
Within
group All All All
Within
group
Variable (1) (2) (3) (4) (5) (6) (7) (8)
Difference: 0.18 0.35 ‐0.31 0.29 0.80 0.79 0.70 0.94
seller corp tax‐buyer corp tax (0.88) (0.90) (0.95) (1.24) (0.98) (0.97) (0.98) (1.30)
Difference: 0.60 1.35** 0.33 0.40 0.39 0.67 0.08 0.30
buyer‐seller patent tax wedge (0.49) (0.63) (0.55) (0.74) (0.49) (0.59) (0.56) (0.69)
D (dev condition on use)*buyer‐ ‐1.95* ‐0.67
seller patent tax wedge (1.03) (0.94)
D (CFC rules apply to buyer) ‐0.37** ‐0.22 ‐0.40*** ‐0.27
(0.17) (0.27) (0.15) (0.21)
D (CFC) * seller‐buyer corp 3.31*** 1.20 2.40* 0.75
tax difference (1.13) (1.77) (1.34) (1.65)
D (CFC) * buyer‐seller patent 1.27 2.22* 1.71* 2.47**
box difference (1.04) (1.26) (0.99) (1.18)
Chi‐squared 4,054.3 4,072.5 4,175.9 3,095.2 4,342.6 4,359.7 4,470.2 11,753.1
Degrees of freedom 90 91 93 93 100 101 103 103
Inter‐country patent transfer flows ‐ exploring tax variables
Dependent variable: Number of patents transferred from seller country to buyer country during the year
Poisson random effects panel regression with standard errors clustered on buyer‐seller country pairs.
19,980 observations on 1,332 country pairs, 2000‐2014
Coefficient significance is denoted by * p<0.1, ** p<0.05, *** p<0.01.
All regressions include complete sets of dummies for the 37 buyer and seller countries and years.
Regressions in columns 5‐8 also include the buyer and seller aggregate patent applications, population, GDP per capita, and R&D
intensity, all in logs.

21
inventionisdesired(Finketal.,2016).Itmayalsobethecasethatfirmsincreasinglyincludethelocationofitspatentfilingsinitstaxplanning.
Figure3
Ifthisisthecase,wewouldexpectthatthedecisiontofilethepriority(first)filinginacountryotherthanthatofinventorresidencemightdependonthepresenceofapatentbox.Similarly,wheretheapplicantlocationdiffersfromtheinventorlocation,itmaybebecausethefirmhaslocatedpatentownershipinamorefavorablejurisdictionfortaxpurposes.WeexplorethesehypothesesinTable3,usingasimilarmodelasintheprevioussection,butwherethe“seller”countryistheinventorcountryandthe“buyer”countryisthepriorityorapplicantcountry.Forconsistencywiththeremainderofthisstudy,weconfinethedatatoEPpatentapplications,whichmayhaveprioritypatentsorapplicantsoutsidethecountriesthatarememberoftheEPC.
ThefirstthreecolumnsinTable3arefortheinventor‐prioritycombinationandthenexttwoarefortheinventor‐applicantcombination.IneachcaseweshowPoissonestimatesofthemodelwherewedonotincludecaseswheretheinventorcountryisthesameastheprioritypatentorapplicantcountry.Columns1and4controlonlyforthetaxdifferencesbetweenthetwocountries,whilecolumns2,3,and5addtheusualgravitymodelvariablesGDPandpopulation,aswellastwovariablesthataretailoredtothesettinghere,R&Dspendingandpatentingintherelevantcountries.
0%
5%
10%
15%
20%
25%
1980 1982 1984 1986 1988 1990 1992 1994 1996 1998 2000 2002 2004 2006 2008 2010 2012 2014
EP patent filing globalization
Priority country different from inventor country
Applicant country different from inventor country
Either different from inventor country

22
Table3
Welooksfirstatthequestionofwhetherthechoiceofprioritycountrydependsonitstaxratesrelativetothetaxratesinthecountrywheretheinventorislocated.Incolumns1and2,wefindthathighertaxratesintheinventorcountryrelativetoprioritycountrydepressthechoiceofprioritycountry,whichiscontrarytoone’sintuition.However,column3,whereweestimateaseparateeffectfortheUnitedStates,showsthatthisresultisanartifactofthepreferenceofEPapplicantsfortheUnitedStatesasaprioritycountry,inspiteofitshighcorporatetaxrateduringtheperiod.Weconcludethatthepresenceorabsenceofapatentboxhaslittleimpactontheprioritycountrychoice.However,othervariablesintheregressiondomatterfortheinventor‐prioritychoice:patentingpercapitainbothcountries,thesizeoftheprioritycountry,theGDPpercapitaoftheinventorcountry,andtheGDPoftheprioritycountry(negatively).Itisimportanttokeepinmindthatthesevariablesareidentifiedbychangesovertime,sincethereareacompletesetofinventorandprioritycountrydummiesintheregressions.
Dependent variable:
Difference in corp tax rate ‐2.05*** ‐1.83*** 0.36 0.13 0.17 ‐0.29
inventor less prior/app country (0.56) (0.46) (0.40) (0.43) (0.31) (0.33)
D (US priority) * diff in corp tax rate ‐3.60*** 1.66***
inventor less prior/app country (0.78) (0.58)
Difference in pat box wedge 0.09 0.34 0.44 ‐0.03 ‐0.09 ‐0.09
prior/app less inventor (0.38) (0.32) (0.29) (0.26) ‐0.24 ‐0.22
Log patent apps per capita 0.52*** 0.51*** 0.47*** 0.49***
in inventor country (0.09) (0.08) ‐0.07 ‐0.07
Log patent apps per capita 0.54*** 0.54*** 0.56*** 0.55***
in prior/app country (0.09) (0.08) ‐0.07 ‐0.07
Log real GDP per capita 0.77** 0.54 0.03 0.07
in inventor country (0.35) (0.35) ‐0.14 ‐0.13
Log real GDP per capita ‐0.80** ‐0.61* ‐0.01 ‐0.04
in prior/app country (0.35) (0.35) ‐0.14 ‐0.13
Log population (millions) ‐0.44 ‐1.02* 0.43 0.55
in inventor country (0.64) (0.52) ‐0.44 ‐0.44
Log population (millions) 1.26* 1.71*** 0.63 0.54
in prior/app country (0.69) (0.57) ‐0.45 ‐0.45
Log R&D researchers per M pop 0.34 0.38 ‐0.08 ‐0.09
inventor country (0.31) (0.31) ‐0.14 ‐0.14
Log R&D researchers per M pop ‐0.30 ‐0.34 0.07 0.08
prior/app country (0.30) (0.29) ‐0.14 ‐0.14
Observations 19,980 19,980 19,980 20,535 20,535 20,535
Country pairs 1,332 1,332 1,332 1,369 1,369 1,369
Chi‐squared 7,059.6 78,915.3 81,916.1 10,892.7 100,239.4 111,650.0
Number of coefficients 88 98 99 89 99 100
# The dependent variable is number of patents with the inventor country‐priority/applicant country combination.
Number of patents from an inventor
country with chosen priority country#
Number of patents from an inventor
country with chosen applicant country#
Inventor country to priority/applicant country flows 2000‐2014
Poisson random effects panel regression with standard errors clustered on buyer‐seller country pairs. * p<0.1, ** p<0.05, ***
p<0.01.
All regressions include complete sets of dummies for the 37 inventor and priority/applicant countries, and years 2000‐2014. One
country has no priority apps and is dropped in those regressions.

23
Turningtotheinventor‐applicantcombinations,recallthatonlyapplicantswithapresenceinmultiplecountrieswillbeabletochooseamongthemasalocationfromwhichtofile,whichmayleadtosomewhatweakeffectsinanaggregateregressionthatincludespatentapplicationsownedbyallapplicants.Indeed,wedofindthattheonlysignificantpredictorsoftheinventor‐applicationchoicearethepatentingpercapitainthetwocountries.WhenweaddtheUS‐corporatetaxdifferentialtotheequation,wefindthatapplicantshaveasignificantpreferenceforfilingfromtheUnitedStateswhentheinventorcountrycorporatetaxrateishigh.
Theconclusionfromtheseaggregateresultsisthatthereislittleevidencethatthelocationofpatentfilingsisaffectedbythepresenceofapatentbox,althoughthereisfairlystrongevidencethatthereexistsapreferencefortheUSasthelocusofownershipandprioritypatentinginspiteofthehighstatutorytaxrateinthatcountry(39percentinourtimeperiod).
InventionThepolicyargumentfortheintroductionofapatentboxisthatitshouldencourageinventionandinnovativeactivityintherelevantcountry.Althoughwedonot(yet)havethedatathatwouldallowustoinvestigateinnovativeandR&Dactivitybroadly,withthecurrentdatawecanlookatchangesinthelevelofpatentedinventionsinacountryafterapatentboxisintroduced.Wefirstshowthesimpletrendsaroundaccessiontimeforthe12countriesinourdatasetthathaveintroducedapatentbox.Giventhewiderangeofpatentingactivityacrosscountries,weshowtwofigures,oneforthe6largercountries,andanotherforthe6smallercountries(notethatthescalesdifferbyafactorof50).
Figure4a

24
Figure4b
BecauseofpatentdatatruncationduetolagsinPATSTAT(April2017edition),thefilingsin2015and2016areincomplete.Thismeansthatthewindowwecanexamineendsin2014andthefiguresshowclearlythatforsomecountries(notablytheUK,Switzerland,Cyprus,andPortugal),thereisalmostnotimeafterthepatentboxisintroducedsothepowerofanytestswillbeweak.InthecaseofFrance,thereisnopre‐patentboxdata.ButthemainfindinginthesegraphsisastrongupwardtrendinEPpatentfilingsoverallwhichshowslittlesignsofchangearoundthedatewhenthepatentboxisintroduced.
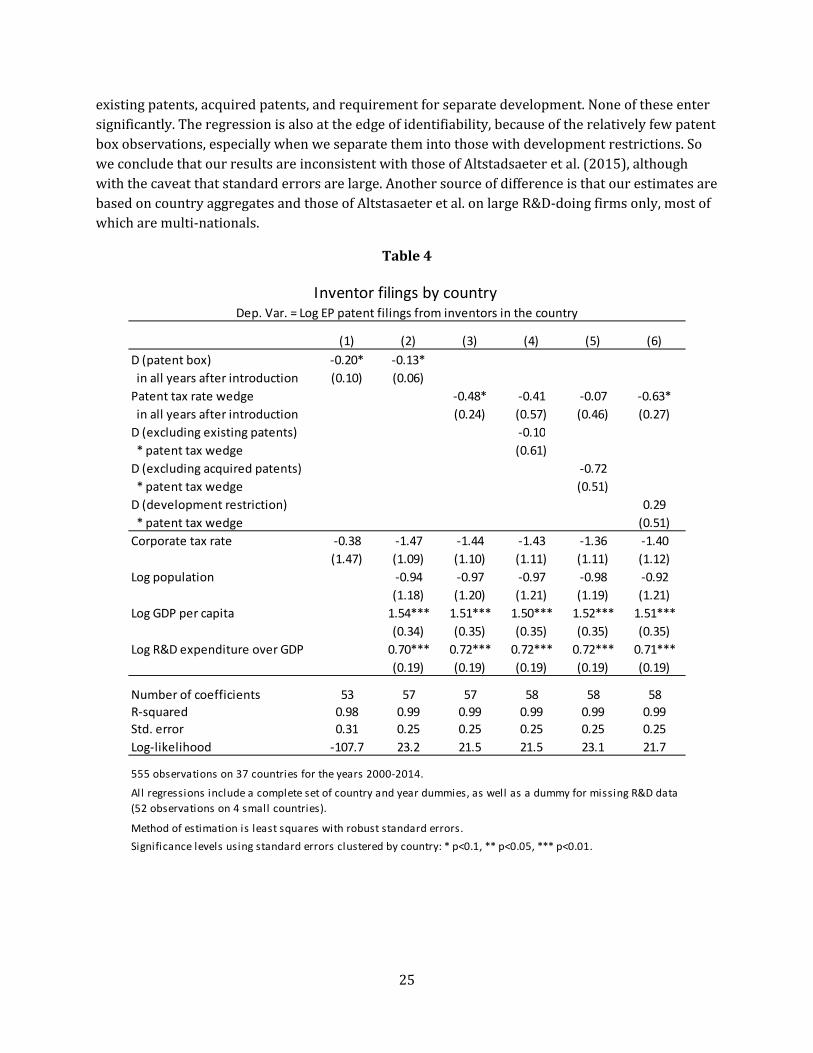
Toconfirmthevisualevidence,weestimatesomesimpleaggregatepatentregressionsforthelogoffilingsbyinventorsinacountryasafunctionoftheexistenceofapatentbox,thestatutorycorporatetaxrate,thepopulation,realGDP,andR&D‐GDPratioofthecountry,andasetofcountryandyeardummies.Inthiscase,themethodofestimationisordinaryleastsquares,becausemostcountry‐yearcellshavealargenumberofcountsandtherearenozeroes.TheestimationresultsareshowninTable4.Theyarefairlyclear:inventorfilingsdependpositivelyGDPpercapitaandR&Dintensityandinsignificantlynegativelyonthecountry’scorporatetaxrate.Thetwopatentboxvariablesareslightlysignificant,butwiththewrongsign:ifanything,thepresenceofapatentboxreducespatentableinventioninthecountry.
Asmentionedearlier,Altstadsaeteretal.(2015)lookatthechangeinthenumberofinventorsinhostanddestinationcountryinresponsetopatenttransfersatthecompanylevel,andfindthatinventorsinthedestinationcountryaremorelikelytoincreasewhenthereisafurtherdevelopmentrequirementfortheuseofapatentboxwithexistingpatentsthataretransferred.Weprobethisfurtherinincolumns4to6ofTable4,whichaddthedummiesfortheinclusionof
25
existingpatents,acquiredpatents,andrequirementforseparatedevelopment.Noneoftheseentersignificantly.Theregressionisalsoattheedgeofidentifiability,becauseoftherelativelyfewpatentboxobservations,especiallywhenweseparatethemintothosewithdevelopmentrestrictions.SoweconcludethatourresultsareinconsistentwiththoseofAltstadsaeteretal.(2015),althoughwiththecaveatthatstandarderrorsarelarge.AnothersourceofdifferenceisthatourestimatesarebasedoncountryaggregatesandthoseofAltstasaeteretal.onlargeR&D‐doingfirmsonly,mostofwhicharemulti‐nationals.
Table4
(1) (2) (3) (4) (5) (6)
D (patent box) ‐0.20* ‐0.13*
in all years after introduction (0.10) (0.06)
Patent tax rate wedge ‐0.48* ‐0.41 ‐0.07 ‐0.63*
in all years after introduction (0.24) (0.57) (0.46) (0.27)
D (excluding existing patents) ‐0.10
* patent tax wedge (0.61)
D (excluding acquired patents) ‐0.72
* patent tax wedge (0.51)
D (development restriction) 0.29
* patent tax wedge (0.51)
Corporate tax rate ‐0.38 ‐1.47 ‐1.44 ‐1.43 ‐1.36 ‐1.40
(1.47) (1.09) (1.10) (1.11) (1.11) (1.12)
Log population ‐0.94 ‐0.97 ‐0.97 ‐0.98 ‐0.92
(1.18) (1.20) (1.21) (1.19) (1.21)
Log GDP per capita 1.54*** 1.51*** 1.50*** 1.52*** 1.51***
(0.34) (0.35) (0.35) (0.35) (0.35)
Log R&D expenditure over GDP 0.70*** 0.72*** 0.72*** 0.72*** 0.71***
(0.19) (0.19) (0.19) (0.19) (0.19)
Number of coefficients 53 57 57 58 58 58
R‐squared 0.98 0.99 0.99 0.99 0.99 0.99
Std. error 0.31 0.25 0.25 0.25 0.25 0.25
Log‐likelihood ‐107.7 23.2 21.5 21.5 23.1 21.7
555 observations on 37 countries for the years 2000‐2014.
All regressions include a complete set of country and year dummies, as well as a dummy for missing R&D data
(52 observations on 4 small countries).
Significance levels using standard errors clustered by country: * p<0.1, ** p<0.05, *** p<0.01.
Method of estimation is least squares with robust standard errors.
Inventor filings by country Dep. Var. = Log EP patent filings from inventors in the country

26
7. Patentlevelanalysis
Wenowturntoananalysisofthechoiceofpatentstotransfer.Oursampleistheapproximately1,200,000EPpatentsfiledbetween2000and2012thathavebeengrantedasof2014,ofthesepatents5.6percentweresubjecttoanownershiptransferacrosscountries.20Wefocusonthefirsttimethatthepatentistransferred,droppingthefewcaseswherethereismorethanonetransfer.Figure5showstheshareoftransfersasafunctionofthefilingdateofthepatent,togetherwiththenumberofEPpatentstransferredbytransferyear,forbothapplicationsandgrantedpatents.Weusethe2000‐2014periodbecausetherewereveryfewpatentboxcountriespriortothosedates.
Figure5
Wemodelthedecisiontotransferapatentusinglogitprobabilitymodels.Thisapproachhastheadvantagethatitallowsustoeasilyincorporatethechoiceofestimationofdifferenttypes(withingroupornot,toataxhavenornot).Ascontrolvariables,weincludeboththecharacteristicsofthepatenttobetransferredandalsothoseofthepatentowner,whichweexpecttoinfluencebothitstaxstatusandthecostsoftransfer.Thepatentcharacteristicsweincludearethosethathavebeenshowninpreviousworktobeassociatedwithpatentvalue:
20Notallpatentapplicationsintherecentyearsthatwilleventuallybegrantedhavebeengrantedby2014,ofcourse.Yearofapplicationdummiesareincludedinallmodelstocontrolforanydifferencesintransferduetothisfact.
0
2000
4000
6000
8000
10000
12000
0.0%
2.0%
4.0%
6.0%
8.0%
10.0%
12.0%
14.0%
1991 1993 1995 1997 1999 2001 2003 2005 2007 2009 2011 2013
International transfers of EP patents
Share of EP patents transferred, by filing date
Transfers in current year (RHS)
Transfers of granted patents (RHS)

27
Patentfamilysize(docdbmeasure)–largersizesareassociatedbothwithapplicationinmultiplejurisdictionsandwithmorecomplexcontinuation/divisionalstructures,usedbyfirmsthatanticipatevaluefromtheapplication.
Numberofclaims–frequentlypositivelyassociatedwithvalue,althoughresultscanbeambiguous,asdependentclaimsmayalsorepresentbreadthrestrictions.
Numberofforwardcitations(5‐year)–thenumberoftimesthepatenthasbeencitedinsubsequentpatentfilingsattheEPOduringthefirst5yearsaftertheapplication.
Numberofinventorsnamedonthepatent–alargernumberofinventorsmayimplygreaterexpensedevotedtotheinvention.
Numberofpatentowners(applicants)–however,oftenmultinationalsapplyunderboththeirownnameandthenameoftheirlocalaffiliate,whichmeansthatthisvariablemayinsomecasesproxyformultinationalownership.
Totheseweaddtheageofthepatent.Wehavealimitednumberofapplicantcharacteristics,astheyareentirelybasedonthepatentdata.Theyarethefollowing:
Thesizeoftheapplicant’spatentportfolioatthetimeofthecurrentpatentapplication. AnMNCdummyforwhethertheapplicantisresearchactiveinmorethanonecountry(as
indicatedbypatentingfromthatcountryatleastonceduringtheentireperiod). Adummyforwhethertheapplicantisacorporation(asopposedtoanindividual,
university,non‐profit,orgovernmentalentity).ThisdummyexcludestheMNCdummyabove,whichalsoindicatesacorporation.
Allofthesecharacteristics(withtheexceptionofpatentage)arenon‐time‐varying,whichmakesestimationstraightforwardandallowsustouseamultinomiallogitmodeltoinvestigatethetypeoftransfer.Insomeoftheestimation,wealsoincludedummiesfortheapplicantcountry,thetechnologyareaofthepatentatthe34arealevel,andyeareffectsforthepatentapplicationyear.Testingrevealedthatthecountrydummieswerethemostimportantofthesepredictors,whilethetechnologyareadummieswerelessimportant,withtheexceptionthattheyweakenedthesignificanceoftheclaimsandforwardcitationcoefficients,reflectingthefactthatthesevariablesvarybytechnologyarea.
SimplestatisticsforthesevariablesareshowninAppendixTableA3.Usinganon‐parametricranksumtest,wefindthatinallcasesthedistributionofthevariablesforthepatentsthataretransferredissignificantlytotherightofthatforpatentsthatarenottransferred.Thetransferredpatentsareclearlydifferent,inwaysthatwemightexpectiftheyaremorehighlyvalued.Alsonotethatbecausethedistributionoftheindependentvariablesisquiteskew,weuselogarithmsofthevariablesinalltheestimations(withtheexceptionofthedummies).CorrelationmatricesforthevariablesareshowninAppendixTableA4,withandwithouttheyear,country,andtechnologymeansremoved.Thesecorrelationsarenotespeciallylarge,withtheexceptionofthatbetweenthedummyformultinationalpatentingcorporationsandcumulativepatentholdings,andthedummiesreducethemslightly.
TheresultsofestimatingasimplelogitmodelfortheinternationaltransfersofallEPOpatentsappliedfor2000‐2012thataregrantedby2014areshowninTable5.Duetothelargesizeofthe

28
sample,andthelowprobabilityofatransferinanyyear(about0.3%),wedrawarandom10percentsampleofthenon‐transferredpatents.KingandZeng(2001),amongothers,showsthatwithknownsamplingprobability,logitcoefficientestimatesareunaffectedbythisprocedure,withtheexceptionoftheintercept.Aconsistentestimateoftheinterceptisgivenbythefollowing:
0 0
1ˆ log1
y
y
where 0̂ istheestimatedintercept,ψisthepopulationshareoftransferredpatents,and y isthe
shareofthetransferredpatentsinthesample.Forour10percentsample,thiscorrectionfactorisequalto2.3.21Notethatforrareevents,thecorrectionfactorisapproximatelyequaltothelogoftheoversamplingprobability.
Table5showsthemarginalimpact(inpercentageterms)ontheprobabilityofatransferforeachvariable,whichismoreinterpretablethanthecoefficients.Thisquantitydoesrequirecorrectionforthebiasintheinterceptestimate,ascanbeseentheequationbelow,whereF(.)isthelogitprobability:
( )
(1 exp( ))(1 exp( ))k
F x
x x x
Table5showstheaverageofthisquantityforeachvariablexk.Eachcolumnaddsanothersetofdummies:none,countrydummiesonly,countryandyeardummies,andcountry,year,andtechnologyareadummies.Resultsdonotchangemuchasdummiesareadded,althoughtheeffectsweakensomewhat.Theresultsonpatentvaluelargelysupporttheideathathighervaluepatentsaretransferred,withpositivecoefficientsforfamilysize,numberofclaims,forwardcitations,andnumberofinventors.Whatdoespredictmorestronglythatapatentwillbetransferredisitsownership:whethertheownerhaspatentingactivityinmultiplecountries,andwhetherthefirmisacorporation,evenifitisnotacorporationdoingmultinationalresearch.Patentsthatarepartoflargerportfoliosareslightlylesslikelytobetransferred,whichisplausible,asmanyofthesepatentswillbepartofapatentportfoliostrategythatdependsonquantityratherthanquality.
Itisworthnotingthattheseregressionshaveverylittleexplanatorypower,asthepseudoR‐squaresarealllessthan0.06,evenwhenweincludecountry,year,andtechnologydummies.Sothereremainanumberoffactorsthataffectthechoiceofwhichpatentstotransferthatareunknown.Nevertheless,thecombinedimpactofincreasingthevariouspatentcharacteristicsbyonestandarddeviationistoraisetheprobabilitythatapatentistransferredby0.11%onabaseof0.31%,anincreaseofone‐third.Apatentownedbyamultinationalthatisresearchactiveinmultiplejurisdictionsismuchmorelikelytobetransferredwithanincreaseinprobabilityof0.26%,nearlydoubletheaverage.
21Log[((1‐.00317)/.00317)(0.0309/(1‐0.0309))]=Log(315.5*.0317)=2.302.

29
Table5
Table6exploresthevariationacrossthedifferenttypesoftransfers.Wedefineintra‐grouptransfersthosethataredependentorhierarchicalinGaesslerandHarhoff(2018),andtax‐motivatedtransfersasthosethatareeithertothe14taxhavencountries,ortocountriesthathaveimplementedapatentbox.Thesetwovariablesaretheninteractedtoproduce4possibletransfertypes,andamultinomiallogitmodelisestimatedforthechoiceoftype(theleft‐outcategoryisnotransfer).Themodelisestimatedwithcountryandyeardummies,butwithouttechnologyareadummies,andwefindthatitsexplanatorypowerisslightlyhigherthanthemodelsinTable5.
Variable (1) (2) (3) (4)
Patent family size (docdb) 0.086 0.063 0.063 0.067
(0.001) (0.001) (0.001) (0.002)
Number of claims 0.036 0.021 0.022 0.016
(0.001) (0.001) (0.001) (0.001)
Number of forward citations (5yrs) 0.009 0.010 0.011 0.005
(0.001) (0.001) (0.001) (0.001)
Number of inventors 0.026 0.040 0.040 0.039
(0.002) (0.002) (0.002) (0.002)
Number of patent holders ‐0.069 ‐0.039 ‐0.040 ‐0.030
(0.008) (0.008) (0.008) (0.008)
Age of the patent ‐0.141 ‐0.139 ‐0.139 ‐0.137
(0.001) (0.001) (0.001) (0.001)
Applicant's patent portfolio size ‐0.056 ‐0.040 ‐0.040 ‐0.044
(0.000) (0.001) (0.001) (0.001)
Multinational research activity 0.330 0.270 0.271 0.260
(countries per applicant >1) (0.002) (0.003) (0.003) (0.003)
Patent holder a corporation, ‐0.038 ‐0.021 ‐0.022 ‐0.024
but not an MNC (0.003) (0.003) (0.003) (0.003)
Applicant country dummies no yes yes yes
Year dummies no no yes yes
Technology area dummies no no no yes
Log likelihood ‐454,600.7 ‐447,887.5 ‐447,489.5 ‐445,836.4
Chi‐squared 62,462.0 77,041.4 78,537.5 84,702.0
Degrees of freedom 9 44 57 90
Pseudo R‐squared 0.034 0.048 0.049 0.052
Probability of international patent transfer 2000‐2014Dependent variable: Dummy for first International transfer of patent (mean = 3.07%)
Sample is all granted EP patents with fi l ing date between 1990 and 2014 that are transferred between
2000 and 2014 and a 10 per cent sample of patents not transferred.
Estimates shown are the average marginal impact on the probability in percentage terms. Standard errors
are clustered by patent. * p<0.1, ** p<0.05, *** p<0.01.
All right hand side variables are in log form, with the exception of the multinational and corporation
dummies.
3,428,110 observations on 343,154 patents; 104,664 transfers

30
Therearesomedifferencesinthepatentvaluationcoefficientsacrossthedifferenttypesoftransfers,butnothingterriblysystematic,althoughpatentvalueindicatorsseemtomatterlessforthenon‐grouptax‐motivatedtransfers.Withingrouptransfersalsotendtobeofmuchyoungerpatentsthantheothers.Thenumberofpatentholdersisquitenegativeforallthetransfers,possiblybecauselargenumbersimpedethepursuitoftaxstrategiesinvolvingpatents,duetocoordinationfailurebetweenmultipleindependententitieswhentryingtosellthepatent.Restrictingtointra‐grouptax‐motivatedtransferschangesthesignofthecoefficient:thesetransfersarepositivelyassociatedwiththenumberofpatentholders.Thismaybebecausesuchpatentstendtobeheldbyseveralmembersofthegroup,eventhoughtheyareundercontrolofasingleultimateentity.Relatedtothisisthenon‐MNCcorporationeffect,whichpredictsintra‐grouptax‐motivatedtransfers,butnototherinternationaltransfers.Thesetransfersarethosewithinagroup,wherethegroupisnotnecessarilyresearch‐activeinmorethanonelocation(hencetheMNCdummyiszero).

31
Table6
Ournotverysurprisingconclusionfromexaminingthepatentleveldecisiontotransferownershipinternationallyisthatmorevaluablepatents(byconventionalmeasures)aremorelikelytobetransferred,regardlessofwhetherthetransferistax‐motivatedornot.
Variable
Not a group,
no tax
Group,
no tax
Not a group,
tax Group, tax
Patent family size (docdb) 0.200 0.183 0.176 0.220
(0.009) (0.008) (0.016) (0.012)
Number of claims 0.141 0.086 ‐0.078 0.030
(0.009) (0.008) (0.015) (0.009)
Number of forward citations (5yrs) 0.047 0.033 0.004 0.032
(0.007) (0.006) (0.012) (0.009)
Number of inventors 0.064 0.292 0.033 ‐0.055
(0.012) (0.010) (0.022) (0.016)
Number of patent holders ‐1.047 ‐0.695 ‐1.158 1.547
(0.060) (0.051) (0.117) (0.032)
Age of the patent ‐0.090 ‐0.622 ‐0.117 ‐0.766
(0.005) (0.004) (0.009) (0.005)
Applicant's patent portfolio size ‐0.154 ‐0.085 ‐0.128 ‐0.177
(0.003) (0.003) (0.006) (0.004)
Multinational research activity 0.454 0.947 0.681 1.515
(countries per applicant >1) (0.016) (0.015) (0.027) (0.022)
Patent holder a corporation, ‐0.117 ‐0.272 ‐0.097 0.708
but not an MNC (0.016) (0.017) (0.033) (0.039)
Log likelihood
Chi‐squared
Degrees of freedom
Pseudo R‐squared
A complete set of country and year dummies are included in the estimation.
Coefficient estimates are shown. Standard errors are clustered by patent. * p<0.1, ** p<0.05, *** p<0.01.
The types of transfer are defined by the interaction of the group membership dummy and whether or not the
transfer is to a patent box or tax haven country. The left‐out category is no transfer
3,428,110 observations on 343,154 patents; 104,664 transfers
Multinomial Logit Estimation
Type of international patent transfer 2000‐2014Dependent variable: type of first International transfer of patent (1‐4)
All right hand side variables are in log form, with the exception of the multinational and corporation
dummies.
Sample is all granted EP patents with fi l ing date between 1990 and 2014 that are transferred between 2000
and 2014 and a 10 per cent sample of patents not transferred.
144,019.7
0.064
‐566,537.2
224

32
8. Conclusions
Thispaperreportsonacomprehensiveanalysisoftheeffectsoftheintroductionofalowercorporatetaxrateonpatent‐relatedincomein13Europeancountriesduringthe2000‐2014period,whenthemajorityofthesetaxincentiveswereintroduced.Althoughthischangetothecorporatetaxsystemsdidseemtoincreasetheinternationaltransferofpatentsintoajurisdiction,atleastwhentherewasnorequirementforfurtherdevelopmentdomestically,wefoundrelativelylittleresponsivenessoverall.Thechoiceofpriorityorapplicantcountrywasunaffected,andpatentedinventionsdidnotincreaseinthecountriesofferingapatentbox.Thislastresultisimportant,asitsuggeststhattheprimarystatedgoalofintroducingapatentboxhasnotbeenachieved.
Ourliteraturereviewrevealedawiderangeofapproachestoestimatingthepatentboxeffectaswellassomewhatinconclusiveresults.Wefoundinourexplorationsthatresultshadsizablestandarderrorsandweresensitivetospecification,especiallytotheprecisedefinitionofwhetheracquiredorexistingIPwascoveredbythebox.Withonly13countriesintroducingapatentbox,andallowingforbothyearandcountryeffects,thenumberofactualdegreesoffreedomforidentificationisrathersmall.Identificationisachievedbycomparingthechangeinacountrybeforeandafterpatentboxintroductiontothechangeinanothercountrythatdidnotintroduceapatentbox,controllingforthecommontrendinthetwocountries.Itischallengingthentodistinguishtwocountries,oneofwhichhasanexistingpatentsexclusion,andtheotherwhichdoesnot.Thatisprobablywhythereissomuchvariationintheresultsofthepriorliterature.
Inspiteofthisextensivecaveat,ourresultsdoleadtooneconclusionaboutthedesignofthesetaxinstruments:requiringthatfurtherdevelopmentoftheinventiontakeplacewithinthecountryinordertobenefitfromthelowertaxratedoesseemtomitigatetransfersforpurelytaxreasons.ThisprovidessupportfortheincorporationofsuchrulesintotheBEPSrecommendations.Infact,severalcountrieshavealreadymodifiedtheirtaxrulesinthisway.
GiventheapparenteffectivenessofR&DtaxcreditsinincreasingfirmspendingonresearchanddevelopmentreportedinHallandVanReenen(2010)andAppeltetal.(2016),itisperhapssurprisingthatcountrieshaveseenthenecessityfortheintroductionofspecialtaxtreatmentforincomederivedfrompatentedinventions.Thereare(atleast)twoarguments:thefirst(benign)oneisthatsomepatentedinventionsareproducedwithinvestmentotherthanR&Dbutstillhavefeaturesthatmaycreatepublicgoodsintheformofinformation,justifyingasubsidyrelativetootherinvestments.Thesecond(lessbenign)oneisthatfirmswithcommerciallyvaluablepatentsareabletousesomeoftheirprofitsforrent‐seekingintheformofareducedtaxonsomeoftheirincome.Putsimply,apatentboxsubsidizesoutputratherthaninput,soitbenefitsmainlyfirmsthathavehadsuccesswiththeirinvention.Thismayinturnbeanencouragementtoallfirmstoundertakesuchinvention,butitseemsafairlyinefficientwaytodoso.AnotherdisadvantagerelativetoR&Dincentivesisthatsuchaninstrumentdoesalmostnothingtoalleviatetheexanteliquidityconstraintfacedbyinnovatingfirms(HallandLerner2010).

33
References
Alstadsæter,Annette,SalvadorBarrios,GaetanNicodeme,AgnieszkaMariaSkoniecznaandAntonioVezzani(2018).Patentboxesdesign,patentslocation,andlocalR&D.EconomicPolicy33(93):131‐177.
Appelt,Sylvia,MatejBajgar,ChiaraCriscuolo,andFernandoGalindo‐Rueda(2016),R&DTaxIncentives:Evidenceondesign,incidenceandimpacts,OECDScience,TechnologyandIndustryPolicyPapers,No.32,OECDPublishing,Paris.Availableathttp://dx.doi.org/10.1787/5jlr8fldqk7j‐enOECD
Boehm,Tobias,TomKarkinsky,BodoKnoll,andNadineRiedel(2015).TheImpactofCorporateTaxesonR&DandPatentHoldings.UniversityofHohenheim:WorkingPaper.
Bongaerts,WillemandIvoIjzerman(2016).TheSecretstotheSuccessoftheDutchInnovationBox.TaxNotesInternational2May:479‐483.
Bösenberg,Simon,andPeterEgger(2017).R&Dtaxincentivesandtheemergenceandtradeofideas.EconomicPolicy32(89):39‐80.
Bräutigam,Rainer,ChristophSpengel,andFrankSteiff(2017).DeclineofCFCrulesandriseofpatentboxes:HowtheECJaffectstaxcompetitionandeconomicdistortionsinEurope.FiscalStudies38(4):719–745.
Ciaramella,Laurie(2017).Ontheinternationalchangesofpatentownership:Strategicrelocationandpatentboxes.MinesParisTechCERNA:WorkingPaper.
DeloitteConsulting(2014).GuidetoControlledForeignCompanyRegimes.Availableathttps://www2.deloitte.com/content/dam/Deloitte/global/Documents/Tax/dttl‐tax‐guide‐to‐cfc‐regimes‐120314.pdf
Dinkel,AndreasandDeborahSchanz(2015).Taxattractivenessandthelocationofpatents.LMUMunich:Arqus‐DiskussionsbeiträgezurquantitativenSteuerlehre,No.188.
Dischinger,Matthias,andNadineRiedel(2011).Corporatetaxesandthelocationofintangibleassetswithinmultinationalfirms.JournalofPublicEconomics95:691–707.
Dudar,Olena,ChristophSpengel,andJohannesVoget(2015).TheImpactofTaxesonBilateralRoyaltyFlows.Mannheim:ZEWDiscussionPaper15‐052.
Ernst,ChristofandChristophSpengel(2011).Taxation,R&DtaxincentivesandpatentapplicationinEurope.Mannheim:ZEWDiscussionPaper11‐024.
Evers,Lisa,HelenMiller,andChristophSpengel(2015).Intellectualpropertyboxregimes‐effectivetaxratesandtaxpolicyconsiderations.InternationalTaxPublicFinance22:502–530.DOIhttp://dx.doi.org/10.1007/s10797‐014‐9328‐x

34
Feenstra,RobertC.,RobertInklaarandMarcelP.Timmer(2015).TheNextGenerationofthePennWorldTable,AmericanEconomicReview105(10):3150‐3182,availablefordownloadatwww.ggdc.net/pwt
Fink,Carsten,M.KhanandH.Zhou(2016).Exploringtheworldwidepatentsurge.EconomicsofInnovationandNewTechnology25(2):114‐142.
Gaessler,Fabian(2016).EnforcingandTradingPatents–EvidenceforEurope(InnovationundEntrepreneurship).Wiesbaden:SpringerGabler.
Gaessler,FabianandDietmarHarhoff(2018).PatentTransfersinEurope–DataandMethodologicalReport.MaxPlanckInstituteforInnovationandCompetition,Munich.
Ginarte,JuanC.,andWalterG.Park(1997).Determinantsofpatentrights:Across‐nationalstudy.ResearchPolicy26:283‐301.
Griffith,Rachel,HelenMiller,andMartinO’Connell(2014).Ownershipofintellectualpropertyandcorporatetaxation,JournalofPublicEconomics112:12‐23.
Hall,BronwynH.(2011).TheInternationalizationofR&D.InA.Sydor(ed.),GlobalValueChains:ImpactsandImplications,Ottawa,Canada:ForeignAffairsandInternationalTradeCanada,GovernmentofCanada,pp.179‐210.UNU‐MERITWorkingPaper2011‐049.
Hall,BronwynH.(2005).MeasuringtheReturnstoR&D:TheDepreciationProblem.Annalesd'EconomieetdeStatistiqueN°79/80:341‐382.
Hall,BronwynH.(2004).ANoteonMeasurementErrorandProxyVariables.Availableathttps://eml.berkeley.edu//~bhhall/papers/BHH04_measerr.pdf
Hall,BronwynH.,andJoshLerner(2010).TheFinancingofR&DandInnovation,.InHall,B.H.andN.Rosenberg,HandbookoftheEconomicsofInnovation,Elsevier(April),pp.609‐639.
Hall,BronwynH.,andJohnVanReenen(2000).HowEffectiveareFiscalIncentivesforR&D?ANewReviewoftheEvidence.ResearchPolicy29:449‐469.
Karkinsky,TomandNadineRiedel(2012).Corporatetaxationandthechoiceofpatentlocationwithinmultinationalfirms.JournalofInternationalEconomics88:176–185.
King,Gary,andLangcheZeng(2001).Logisticregressioninrareeventsdata.PoliticalAnalysis9(2):137‐163.
Klemens,Ben(2016).ABoxingMatch:Canintellectualpropertyboxesachievetheirstatedgoals?USTreasuryOfficeofTaxAnalysis.Availableathttps://papers.ssrn.com/sol3/papers.cfm?abstract_id=2822575
Koethenbuerger,Marko,FedericaLiberini,andMichaelStimmelmayr(2016).IsitLuringInnovationsorjustProfit?TheCaseofEuropeanPatentBoxes.ETHZurich:WorkingPaper.

35
PublishedinGerman:SteuerlicheEffekteeuropäischerPatentboxen,KOFAnalysen2018(1):73–82.
Lester,John,andJacekWarda(2018).AnInternationalComparisonofTaxAssistanceforR&D:2017UpdateandExtensiontoPatentBoxes.Calgary,Canada:UniversityofCalgarySchoolofPublicPolicyResearchReport11:13.
Mohnen,Pierre,ArthurVankan,andBartVerspagen(2017).EvaluatingtheinnovationboxtaxpolicyinstrumentintheNetherlands,2007–13.OxfordReviewofEconomicPolicy33(1):141‐156.
Mutti,JohnandHarryGrubert(2009).TheEffectofTaxesonRoyaltiesandtheMigrationofIntangibleAssetsAbroad.InReinsdorf,M.andM.J.Slaughter(eds.),InternationalTradeinServicesandIntangiblesintheEraofGlobalization.NBERConferenceVolume,UniversityofChicagoPress,pp.111‐137.
OECD/OCDE(2016).TaxStatistics.EnglishISSN2074‐4307.DOI:http://dx.doi.org/10.1787/tax‐data‐en
OECD(2015),CounteringHarmfulTaxPracticesMoreEffectively,TakingintoAccountTransparencyandSubstance,Action5‐2015FinalReport.Paris:OECDPublishing.DOI:http://dx.doi.org/10.1787/9789264241190‐en
Santos‐Silva,J.M.C.andSilvanaTenreyo(2006).TheLogofGravity.ReviewofEconomicsandStatistics88(4):641‐658.
Schwab,Thomas,andMaximilianTodtenhaupt(2018).Thinkingoutsidethebox:Thecross‐bordereffectoftaxcutsonR&D.Mannheim:ZEWDiscussionPaperNo.16‐073.Availableathttps://papers.ssrn.com/sol3/papers.cfm?abstract_id=2864304
Sullivan,Martin(2015).Economicanalysis:Patentboxes,researchcredits,orlowerrates?”TaxNotes1June.http://americansfortaxfairness.org/files/Tax‐Notes‐Sullivan‐Patent‐Boxes‐Research‐Credits‐or‐Lower‐Rates‐6‐1‐15.pdf
UnitedNationsInstituteforStatistics(2018).http://uis.unesco.org/en/topic/research‐and‐development
USFederalTradeCommission(2016).PatentAssertionEntityActivity:AnFTCStudy.Availableathttps://www.ftc.gov/system/files/documents/reports/patent‐assertion‐entity‐activity‐ftc‐study/p131203_patent_assertion_entity_activity_an_ftc_study_0.pdf
Warda,Jacek(2002).MeasuringthevalueofR&DtaxtreatmentinOECDcountries.OECDScience,TechnologyandIndustryReview27.Paris:OECD/OCDE.
Westmore,Ben(2013).Innovationandgrowth:Considerationsforpublicpolicy.ReviewofEconomicsandInstitutions4(3):Article3.

36
AppendixA:SimplestatisticsTableA1
Code Country
R&E
tax
credit
@
CFC
rules^
Years
with
patent
box
Gross or net
income
Includes
existing
patents
Includes
acquired
patents
Develop‐
ment
condition
Patents
transferred
out 2000‐
2014
Patents
transferred
in 2000‐
2014
Diff‐
erence
AT Austria x 2521 1135 ‐1386
AU Australia x x 1202 587 ‐615
AW* Aruba 10 10
BB* Barbados 196 2269 2073
BE Belgium x 2007‐ gross yes% yes% yes 1140 1639 498
BM* Bermuda 48 635 587
BS* Bahamas 29 157 128
CA Canada x x 3918 2172 ‐1745
CH Switzerland 2011‐ net yes yes no 6353 10521 4168
CL Chile x 13 43 30
CW* Curacao 85 628 542
CY Cyprus 2012‐ net yes yes no 139 197 58
CZ Czech Republic x 45 104 60
DE Germany x 13804 11633 ‐2171
DK Denmark x 1171 957 ‐214
EE Estonia x 10 20 10
ES Spain x x 2008‐ net yes no% yes 468 408 ‐61
FI Finland x 1466 3034 1567
FR France x x 1971‐ net yes yes# no 4821 5136 316
GB UK x x 2013‐ net yes yes% yes 12825 5792 ‐7032
GG* Guernsey 0 93 93
GI* Gilbraltar 12 86 74
GR Greece x 35 51 16
HK* Hong Kong 21 339 318
HU Hungary x x 2003‐ gross yes yes no 94 265 171
IE Ireland x 1973‐2010 yes no% yes 431 1695 1264
IL Israel x 930 1075 145
IM* Isle of Man 23 63 40
IS Iceland x x 27 155 128
IT Italy x x 1920 1281 ‐639
JE* Jersey 59 59
JP Japan x x 4626 2817 ‐1809
KR South Korea x x 686 816 130
KY* Cayman Islands 98 1587 1489
LI** Liechtenstein 2011‐ net no yes no 283 275 ‐8
LU Luxembourg 2008‐ net yes no no 500 2386 1886
MC* Monaco 66 50 ‐16
MT Malta 2010‐ not deduct. yes yes no 32 95 63
MX Mexico x 82 200 118
NL Netherlands x 2007‐ net no yes% yes 7826 11426 3600
NO Norway x x 466 867 401
NZ New Zealand x 182 107 ‐76
PL Poland 55 94 39
PT Portugal x x 2014‐ gross no no% yes 48 147 99
SE Sweden x x 3153 3948 795
SG* Singapore 186 1352 1167
SI Slovenia x 49 29 ‐20
SK Slovakia x 29 35 6
TR Turkey x 15 40 25
US US x x 28878 21081 ‐7797
VG* Virgin Islands (British) 87 1501 1414
Total 101091 101091 0
# if held for at least 2 years. ̂CFC rules in 2014. % if further developed.
** GDP data not available from the Penn World Tables for this country.
@Some kind of R&D tax credit (beyond expensing) available during the period.
Sources: Tax info ‐ Evers et al. (2013), Deloitte (2014), Alstadsæter et al. (2015).
Patent data ‐ authors'computations from Patstat April 2017.
* denotes countries that are tax havens; most do not have GDP data on PWT either.
Sample countries

37
TableA2
Code Country
Years with
IP box
R&E tax
credit@
Includes
existing
patents
Includes
acquired
patents
Corp tax
rate
(statutory)
IP box rate
(statutory)
Effective
average tax
rate ord.
income
Effective
average tax
rate IP box
BE Belgium 2007‐ x yes% yes% 34 6.8 21.11 ‐26.95
CY Cyprus 2012‐ yes yes 10 2.5 11.69 2.34
FR France 1971‐ x yes yes# 34 16 26.56 ‐6.41
HU Hungary 2003‐ x yes yes 20 10 14.25 ‐2.54
IE Ireland 1973‐2010 x yes no% 12.5 0 12.50 0.00
LI** Liechtenstein 2011‐ no yes 12.5 2.5 6.92 1.39
LU Luxembourg 2008‐ yes no 29 5.84 21.92 5.47
MT Malta 2010‐ yes yes 35 0 26.25 0.00
NL Netherlands 2007‐ x no yes% 25.5 5 18.75 3.75
PT Portugal 2014‐ x no no% 31.5 15 31.50 15.00
ES Spain 2008‐ x yes no% 30 12 22.50 ‐2.95
CH Switzerland 2011‐ yes yes 21 8.8 9.50 2.74
GB UK 2013‐ x yes yes% 22 10 15.75 7.50
# i f held for at least 2 years.
% if further developed.
** GDP data not available from the Penn World Tables for this country.
@Some kind of R&D tax credit (beyond expensing) available during the period.
Effective average tax rates for countries with a Patent Box

38
TableA3
Variable Mean# St.dev. Median IQ range Min Max
Family size 8.196 0.639 8 1.83 2 236
Number of claims 14.655 0.616 15 1.82 1 593
5‐year forward cites 2.314 0.816 2 4.00 1 142
Number of inventors 3.340 0.431 3 2.00 1 63
Number of applicants 2.018 0.114 2 1.00 2 10
Cumulative applicant patents* 79.8 2.7 83.0 83.12 2 28,370
MNC (multi‐country researcher) 0.560 0.496 1 1 0 1
Corporation, not MNC 0.345 0.475 0 1 0 1
Family size 6.567 0.621 6 1.80 2 428
Number of claims 12.685 0.615 14 1.80 1 488
5‐year forward cites 1.931 0.776 2 3.00 1 972
Number of inventors 3.250 0.435 3 2.00 1 54
Number of applicants 2.024 0.108 2 1.00 2 18
Cumulative applicant patents* 124.7 2.6 139.0 105.82 2 31,451
MNC (multi‐country researcher) 0.435 0.496 0 1 0 1
Corporation, not MNC 0.466 0.499 0 1 0 1
Diff s.e. T‐stat
Family size 1.629 0.002 694.8
Number of claims 1.970 0.002 864.1
5‐year forward cites 0.382 0.003 128.5
Number of inventors 0.091 0.002 56.6
Number of applicants ‐0.007 0.000 ‐15.9
Cumulative applicant patents ‐44.839 0.010 ‐4572.5
MNC (multi‐country researcher) 0.125 0.002 68.2
Corporation, not MNC ‐0.121 0.002 ‐67.8
# The geometric mean is shown for all variables except the MNC and corporation dummies
@ 10 per cent sample of non‐transferred patents.
* Cumulative patent applications by patent owner in the year 2000 or the year of application,
whichever is later.
Internationally transferred patents (N=105,328)
Patents that are not internationally transferred (N=237,826)@
‐67.9
‐38.6
EPO patents applied for 2000‐2014: Simple statistics
62.8
18.3
‐15.6
71.9
Ranksum test ‐ chisq(1)
109.9
52.9

39
TableA4
TableA5
Family size 1.000
Number of claims 0.091 1.000
5‐year forward cites 0.355 0.188 1.000
Number of inventors 0.165 0.087 0.169 1.000
Number of applicants 0.000 0.007 0.008 0.113 1.000
Cumulative applicant patents 0.001 ‐0.051 0.037 0.174 ‐0.079 1.000
MNC (multi‐country researcher) 0.064 ‐0.001 0.061 0.129 ‐0.062 0.736 1.000
Corporation, not MNC ‐0.045 ‐0.011 ‐0.043 ‐0.085 ‐0.064 ‐0.572 ‐0.807 1.000
Family size 1.000
Number of claims 0.037 1.000
5‐year forward cites 0.306 0.150 1.000
Number of inventors 0.113 0.062 0.130 1.000
Number of applicants ‐0.008 0.009 0.008 0.109 1.000
Cumulative applicant patents 0.030 ‐0.038 0.033 0.134 ‐0.074 1.000
MNC (multi‐country researcher) 0.059 ‐0.017 0.039 0.101 ‐0.043 0.721 1.000
Corporation, not MNC ‐0.022 0.012 ‐0.015 ‐0.052 ‐0.078 ‐0.569 ‐0.799 1.000
All variables are in logs except the MNC and corporation dummies
# Sample is based on a 10 per cent sample of the non‐transferred patents and all of the transferred patents.
Correlation matrix
Correlation matrix with year, tech, country dummies removed
All EPO patents applied for 2000‐2014: 343,154 observations#
no
transfer@
non‐group,
non‐tax
group,
non‐tax
non‐group,
tax‐related
group,
tax‐related
Observations 237,826 34,220 40,951 11,318 18,839
Family size 6.57 8.09 8.41 7.98 8.15
Number of claims 12.69 14.70 14.77 14.11 14.72
5‐year forward cites 1.93 2.27 2.36 2.26 2.34
Number of inventors 3.27 3.22 3.52 3.29 3.42
Number of applicants 2.05 2.03 2.04 2.03 2.11
Cumulative applicant patents* 120.3 44.3 113.4 75.4 120.3
MNC (multi‐country researcher) 1.54 1.53 1.86 1.69 2.02
Corporation, not MNC 2.44 2.38 2.46 2.45 2.60
Variable means by type of transfer#
# The geometric mean is shown for all variables except the MNC and corporation dummies
* Cumulative patent applications by patent owner in the year 2000 or the year of application, whichever is later.
@ 10 per cent sample of non‐transferred patents.

40
FigureA1
0%
10%
20%
30%
40%
50%
60%
70%
80%
90%
100%
2000 2001 2002 2003 2004 2005 2006 2007 2008 2009 2010 2011 2012 2013
Evolution of the patent box across 42 developed countries
No patent box Patent box

41
AppendixB:Additionalestimates
TableB1
Variable
All
(1)
All
(2)
All
(3)
All
(4)
Within
group
(5)
Buyer corporate tax rate 0.82 0.98 1.11 1.19 0.40
(1.24) (1.22) (1.26) (1.26) (1.74)
D (buyer patent box) ‐0.04
in all years after introduction (0.15)
D (buyer patent box) 0.00
in year of introduction (0.11)
D (buyer patent box) 0.17
in year after introduction (0.22)
D (buyer patent box) 0.39*
two years after introduction (0.23)
Buyer patent tax rate wedge 0.12
in all years after introduction (0.74)
Buyer patent tax rate wedge 0.18 0.20
in year of introduction (0.64) (0.84)
Buyer patent tax rate wedge 1.14 1.68
in year after introduction (1.39) (1.52)
Buyer patent tax rate wedge 2.28* 3.19**
two years after introduction (1.25) (1.42)
Seller corporate tax rate 0.90 1.03 0.98 1.08 0.93
(1.15) (1.13) (1.13) (1.11) (1.39)
D (seller patent box) ‐0.28** ‐0.26**
(0.13) (0.13)
Seller patent tax rate wedge ‐1.32** ‐1.26* ‐1.88**
(0.65) (0.64) (0.80)
Chi‐squared 12829.9 11975.8 11957.8 11956.1 11028.3
Degrees of freedom 92 92 94 94 94
Inter‐country patent transfer flows
Estimates including 14 tax haven countries
Dependent variable: Number of patents transferred from seller country to buyer country
during the year
Poisson random effects panel regression with standard errors clustered on buyer‐seller country pairs.
36,750 observations on 2,450 country pairs, 2000‐2014
Coefficient significance is denoted by * p<0.1, ** p<0.05, *** p<0.01.
All regressions include complete sets of dummies for the 51 buyer and seller countries and years.

42
TableB2
Variable
All
(1)
All
(2)
All
(3)
All
(4)
All
(5)
Within
group
(6)
Within
group
(7)
Difference: 0.05 0.05 0.22 0.20 ‐0.37 0.61 0.27
seller corp tax‐buyer corp tax (0.84) (0.85) (0.86) (0.86) (0.94) (1.08) (1.23)
Difference: 0.62 0.83 0.19 1.33** 0.34 1.85** 0.47
buyer‐seller patent tax wedge (0.49) (0.64) (0.56) (0.61) (0.55) (0.84) (0.73)
D (existing patents) * buyer‐ ‐0.38
seller patent tax wedge
D (acqired patents) * buyer‐ 1.54
seller patent tax wedge
D (dev condition on use)*buyer‐ ‐1.88* ‐2.29*
seller patent tax wedge (1.03) (1.29)
D (CFC rules apply to buyer) ‐0.25 ‐0.14
(0.19) (0.25)
D (CFC) * seller‐buyer corp 2.30* 0.58
tax difference (1.29) (1.60)
D (CFC) * buyer‐seller patent 1.30 2.17*
box difference (1.02) (1.24)
Chi‐squared 11777.7 11585.1 12474.6 12401.3 11447.9 10061.1 9920.0
Degrees of freedom 90 91 91 91 93 91 93
Inter‐country patent transfer flows ‐ exploring tax variables
Estimates including 14 tax haven countries
Dependent variable: Number of patents transferred from seller country to buyer country during the year
Poisson random effects panel regression with standard errors clustered on buyer‐seller country pairs.
36,750 observations on 2,450 country pairs, 2000‐2014
Coefficient significance is denoted by * p<0.1, ** p<0.05, *** p<0.01.
All regressions include complete sets of dummies for the 51 buyer and seller countries and years.

43
TableB3
Wemodelthedecisiontotransferapatentusingproportionalhazardratemodels,wherethehazardofpatenti’stransferattimetisgivenbythefollowing:
( , ) Pr( transferred at | not yet transferred, )
( )exp( )i i
i
h X t i t i X
h t X bº=
whereidenotesapatentandtdenotesthetimesincethepatent’sapplicationdate.h(t)isthebaselinehazard,whichiseitheranon‐parametricoraparametricfunctionoftimesinceentryintothesample.Theimpactofanycharacteristicxonthehazardcanbecomputedasfollows:
( ) ( ) ( ) ( )
( ), , 1
exp or ,
i i
ii i i
h X t h X th t X
x x h X tb b b
¶ ¶= =
¶ ¶
Thusifxismeasuredinlogs,βmeasurestheelasticityofthehazardratewithrespecttox.Notethatthisquantitydoesnotdependonthebaselinehazardh(t),butisthesameforanyt.Weusethesemi‐parametricCoxmodelforh(t).
Variable
All
(1)
All
(2)
All
(3)
All
(4)
All
(5)
Within
group
(6)
Within
group
(7)
Difference: 0.18 0.05 0.16 0.35 ‐0.31 0.70 0.29
seller corp tax‐buyer corp tax (0.88) (0.87) (0.88) (0.90) (0.95) (1.12) (1.24)
Difference: 0.60 0.96* 0.65 1.35** 0.33 1.82** 0.40
buyer‐seller patent tax wedge (0.49) (0.50) (0.54) (0.63) (0.55) (0.85) (0.74)
D (existing patents) * buyer‐ ‐1.40
seller patent tax wedge (1.08)
D (acqired patents) * buyer‐ ‐0.24
seller patent tax wedge (1.10)
D (dev condition on use)*buyer‐ ‐1.95* ‐2.29*
seller patent tax wedge (1.03) (1.30)
D (CFC rules apply to buyer) ‐0.37** ‐0.22
(0.17) (0.27)
D (CFC) * seller‐buyer corp 3.31*** 1.20
tax difference (1.13) (1.77)
D (CFC) * buyer‐seller patent 1.27 2.22*
box difference (1.04) (1.26)
Chi‐squared 4054.3 4131.0 4097.4 4072.5 4175.9 3183.1 3095.2
Degrees of freedom 90 91 91 91 93 91 93
All regressions include complete sets of dummies for the 37 buyer and seller countries and years.
19,980 observations on 1,332 country pairs, 2000‐2014
Poisson random effects panel regression with standard errors clustered on buyer‐seller country pairs.
Dependent variable: Number of patents transferred from seller country to buyer country during the year
Inter‐country patent transfer flows ‐ exploring tax variables
Coefficient significance is denoted by * p<0.1, ** p<0.05, *** p<0.01.