corporate taxes and the location of intellectual property · table 7: location of intellectual...
TRANSCRIPT

Corporate taxes and the location of intellectual property
Rachel Griffith
Helen Miller
Martin O’Connell
© Institute for Fiscal Studies

Why are Intellectual Property decisions interesting?Why are Intellectual Property decisions interesting?• Intangible capital accounts for growing share of inputs
• The income from IP is highly mobile
• Intellectual property has been in policy spot light
© Institute for Fiscal Studies

Why are Intellectual Property decisions interesting?Why are Intellectual Property decisions interesting?• Intangible capital accounts for growing share of inputs
– since the mid 1990s UK investment in intangible (knowledge) assets g ( g )has been greater than that in fixed capital
– OECD described growing significance intellectual property & its simultaneous use by many different parts of a firm as “one of the
t i t t i l d l t i t d d ”most important commercial developments in recent decades.”
• The income from IP is highly mobileg y
• Intellectual property has been in policy spot light
© Institute for Fiscal Studies

Why are Intellectual Property decisions interesting?Why are Intellectual Property decisions interesting?• Intangible capital accounts for growing share of inputs
• The income from IP is highly mobile
– Firms can and do separate income from real activity
– offshore holdings of IP can be used to reduce tax
– A tax lawyer quoted in the New York Times noted:
“…most of the assets that are going to be reallocated as part of a global repositioning are intellectual property…that is where most of the profit is.”
• Intellectual property has been in policy spot light
© Institute for Fiscal Studies

Why are Intellectual Property decisions interesting?Why are Intellectual Property decisions interesting?• Intangible capital accounts for growing share of inputs
• The income from IP is highly mobile
• Intellectual property has been in policy spot light
– Many governments want to encourage production and use of intangible capital to boost productivity; tax policy is one instrument
– Mobility of IP income raises questions over governments’ ability to tax it
• treatment of foreign earnings of multinational firms (CFC rules)
– Recent introduction of ‘Patent Boxes’ which sharply reduce the rate of corp. tax applied to patent income
© Institute for Fiscal Studies

Taxation of foreign earnings of multinationalsTaxation of foreign earnings of multinationals
• Credit vs Exemption system for taxation of foreign source income
– Credit: tax worldwide income with credit for foreign tax (UK until 09)Credit: tax worldwide income with credit for foreign tax (UK until 09)
– Exemption: foreign source income can be remitted tax free (UK now)
• Opportunities to avoid tax in both – anti avoidance rules encompassed in Controlled Foreign Company (CFC) rules
I i l t t b dditi ll t d i h t– Income in low tax country can be additionally taxed in home country
• We consider how CFC rules affect the location of patents
© Institute for Fiscal Studies

"Patent Box"Patent Box
• Belgium, Netherlands and Luxembourg currently operate
“Patent Box”
– income from patents is taxed at substantially lower rate
– Belgium 6.8% (full rate, 34%); Netherlands 10% (full rate, 25%); Luxembourg 5.9% (full rate, 39%)g ( , )
• UK propose to introduce one in 2013
d h i f f 28% (24%) 10%– reduce tax rate on the income from patents from 28% (24%) to 10%
– HM Treasury estimate revenue cost at £1.3bn
© Institute for Fiscal Studies

Location and taxesLocation and taxes
Location of innovationMultinational
Corporate income taxR&D tax credits
Headquarter location
Treatment of foreign source income Corporate income tax
CFC regime
Location of IPR holdings
Corporate income taxPatent box
Location of production
Royalty treatment(Withholding rates)
Location of production
Corporate income tax
© Institute for Fiscal Studies

Location and taxesLocation and taxes
Location of innovationMultinational
Corporate income taxR&D tax credits
Headquarter location
Treatment of foreign source income Corporate income tax
CFC regime
Location of IPR holdings
Corporate income taxPatent boxPatents associated with number of countries:
• where technology was created
Location of production
Royalty treatment(Withholding rates)
e e tec o ogy as c eated
• where legal protection sought
• which patent office patent filed atLocation of production
Corporate income tax• where company that legally holds
the patent is based
© Institute for Fiscal Studies

Our contributionOur contribution
• Model the impact of taxes on the location of patent holdings
• Allow firms to have heterogeneous responses to taxes
• Simulate the effect of Patent Box on the location of patents, under different assumptions about CFC rules
© Institute for Fiscal Studies

Model of firm behaviourModel of firm behaviour
• Firm has a successful discovery, decides which subsidiary should apply for the patent
– the location of the subsidiary determines how the income will be taxed
• Discrete choice model; firms choose location where value is highest
• Value to firm of holding patent in a location depends on:
– revenue from patentrevenue from patent
– Costs of holding patent in that subsidiary:
• those related to earning income there, (taxes)
• fixed costs of locating• fixed costs of locating
– any benefits that arise from holding patent in that location
© Institute for Fiscal Studies

Expected value to firm of a patentExpected value to firm of a patent
i: firmt: yearp: patent application
V: valuec: variable costPQp: patent application
j: locationPQ: revenueF: fixed cost
© Institute for Fiscal Studies

Empirical specification & heterogeneityEmpirical specification & heterogeneity
• Unobserved heterogeneityUnobserved heterogeneity
random coefficient allows heterogeneity in response to tax across firmsacross firms
• Observed heterogeneity
6 i d t i t i ti t 6 t i6 industry-size categories - estimate 6 separate regressions – allow coefficients (and distribution) to vary across industry and firm size
© Institute for Fiscal Studies

Heterogeneity in firm behaviourHeterogeneity in firm behaviour
We allow for heterogeneity in firm behaviour along three important dimensions:
1 we allow all coefficients to vary across three broad industry1. we allow all coefficients to vary across three broad industry classifications
2. we allow all coefficients to vary with the size of the firm
3. we allow the income earned by a patent to vary with unobserved patent (firm) characteristics through including a random coefficient
– the distribution of the random coefficients varies across industry and firm size
© Institute for Fiscal Studies
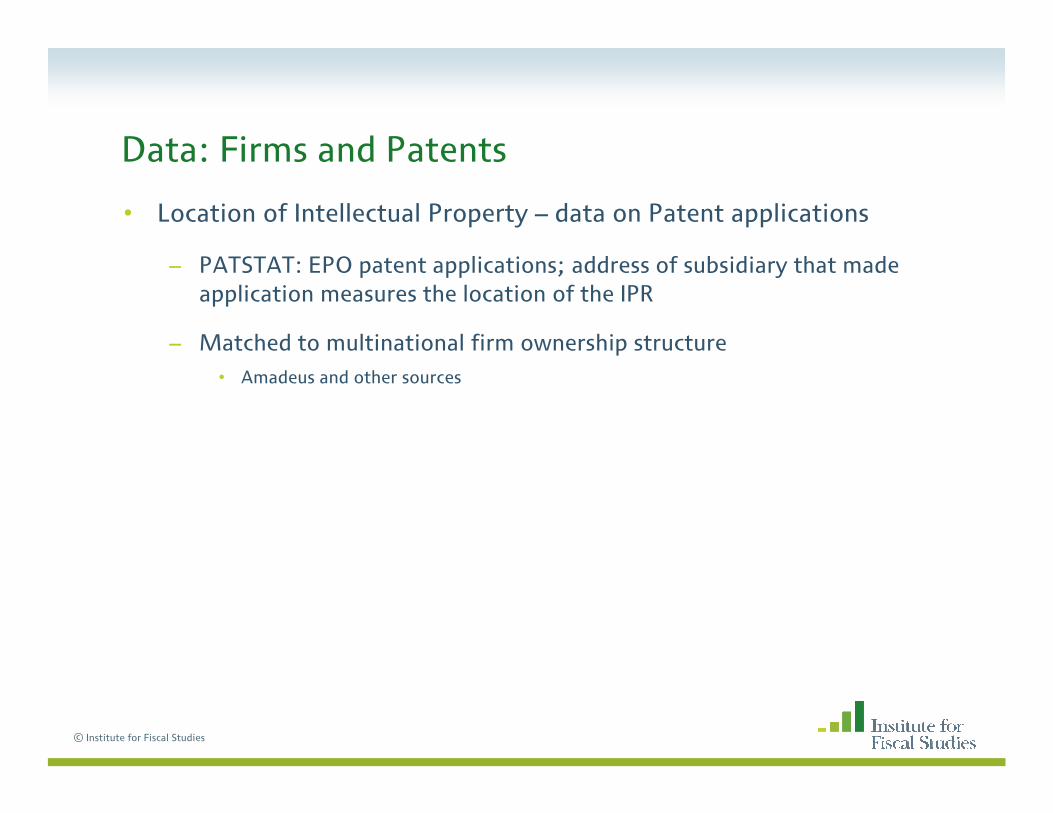
Data: Firms and PatentsData: Firms and Patents
• Location of Intellectual Property – data on Patent applications
– PATSTAT: EPO patent applications; address of subsidiary that made application measures the location of the IPR
– Matched to multinational firm ownership structurep• Amadeus and other sources
© Institute for Fiscal Studies
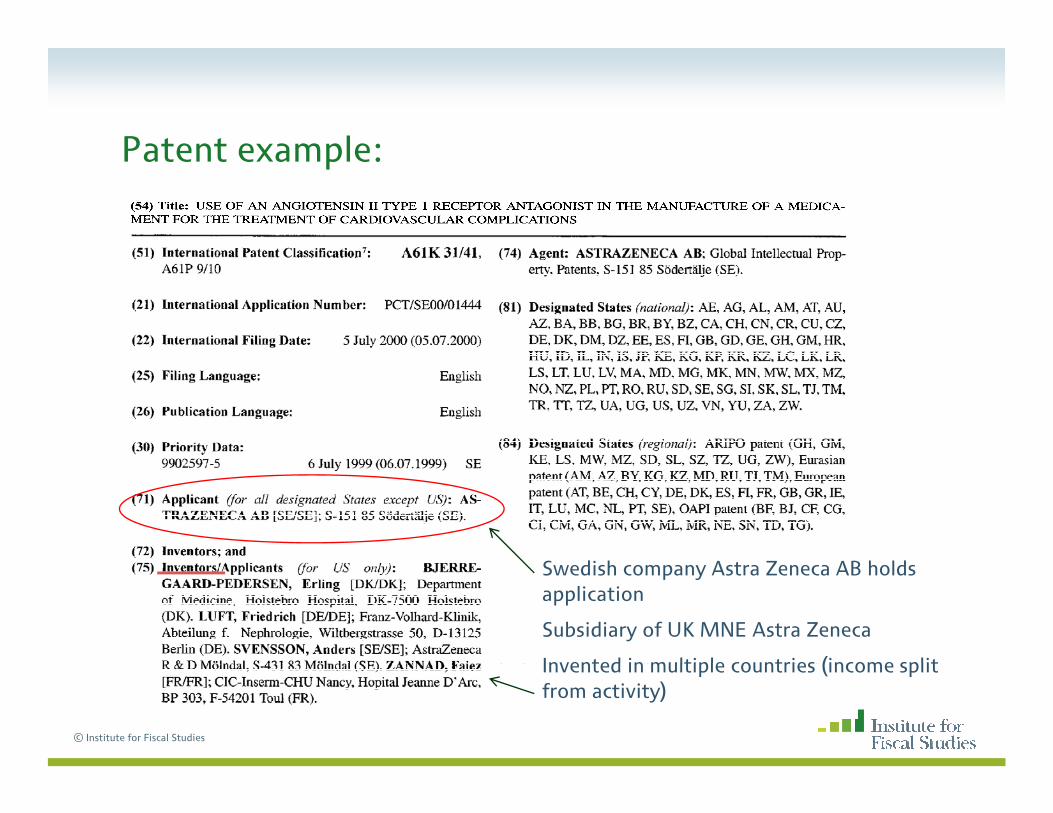
Patent example:Patent example:
d h h ldSwedish company Astra Zeneca AB holds application
Subsidiary of UK MNE Astra Zeneca
Invented in multiple countries (income split
© Institute for Fiscal Studies
Invented in multiple countries (income split from activity)

Data: Firms and PatentsData: Firms and Patents
• Location of Intellectual Property – data on Patent applications
– PATSTAT: EPO patent applications; address of subsidiary that made application measures the location of the IPR
– Matched to multinational firm ownership structurep• Amadeus and other sources
• Result: European parent firms and their patent applications held in European and US subsidiariesp
• Firms headquartered in 13 European countries
– Belgium, Denmark, Finland, France, Ireland, Italy, Luxembourg, h l d d l d dNetherlands, Norway, Spain, Sweden, Switzerland and UK
• Choose from 15 locations
© Institute for Fiscal Studies
– above plus Germany, and US

Data: Firms and PatentsData: Firms and Patents
• Data on 639 firms with 233,471 patent applications filed 1985-2005
Large MediumCh i l P t t 81 268 23 307
• Assign to 3 industries; within this spilt by firm size
Chemicals Patents 81,268 23,307Firms 124 480
Electrical Patents 93,473 93,473Firms 125 490
Engineering Patents 64,811 64,811Fi 149 480
© Institute for Fiscal Studies
Firms 149 480

TaxesTaxes
• Statutory corporate rate in source country
– vary across countries and over time (Table 3)
• Important interactions between jurisdictions : CFC regime• Important interactions between jurisdictions : CFC regime
– CFC regimes, (roughly) apply when: (Table 4 gives details)
• a great enough proportion of the subsidiaries income arises from ‘passive sources’sources
• the subsidiary is located in a country deemed to be a low tax country
– Use home country tax rate for pairs of countries where CFC regime at home and source defined as low taxhome and source defined as low tax
• Patent Boxes rates used in simulations
© Institute for Fiscal Studies

Table 6: Location of Intellectual Property in the Chemical industry D d t i bl 1 if t t li ti i l tiDependent variable=1 if patent application in location
Large firms Medium firms(1) (2) (3) (4) (5) (6)(1) (2) (3) (4) (5) (6)logit logit RC logit logit RC
tax rate ( ) -0.04 -1.42 -4.00 -0.55 -2.67 -3.30(0 04) (0 09)** (0 14)** (0 08)** (0 18)** (0 22)**(0.04) (0.09) (0.14) (0.08) (0.18) (0.22)
Variance of ( ) - - 78.36 - - 16.51- (3.43)** - (3.17)**
country effects yes yes yes yes
firms 124 124 124 480 480 480
patent applications 81,268 81,268 81,268 23,307 23,307 23,307
© Institute for Fiscal Studies

Table 7: Location of Intellectual Property in the Electrical industry D d t i bl 1 if t t li ti i l tiDependent variable=1 if patent application in location
Large firms Medium firms(1) (2) (3) (4) (5) (6)(1) (2) (3) (4) (5) (6)logit logit RC logit logit RC
tax rate ( ) 0.59 -3.17 -5.01 -1.11 -4.48 -5.17(0 04)** (0 09)** (0 12)** ( 08)** (0 19)** (0 27)**(0.04) (0.09) (0.12) (.08) (0.19) (0.27)
Variance of ( ) - - 46.30 - - 12.36- (2.21)** - (3.46)**
firms 125 125 125 490 490 490
patent applications 93,473 93,473 93,473 22,335 22,335 22,335
© Institute for Fiscal Studies

Table 8: Location of Intellectual Property in the Engineering industry D d t i bl 1 if t t li ti i l tiDependent variable=1 if patent application in location
Large firms Medium firms(1) (2) (3) (4) (5) (6)(1) (2) (3) (4) (5) (6)logit logit RC logit logit RC
tax rate ( ) 0.44 -1.80 -2.60 -0.15 -2.98 -3.76(0 05)** (0 11)** (0 13)** (0 07)* (0 16)** (0 21)**(0.05) (0.11) (0.13) (0.07) (0.16) (0.21)
Variance of ( ) - 21.76 - 17.67- (2.15)** - (3.27)**
firms 149 149 149 480 480 480
patent applications 64,811 64,811 64,811 26,063 26,063 26,063
© Institute for Fiscal Studies

ElasticitiesElasticities
• From these coefficient estimates we can construct market own and cross tax-elasticities
• Aggregated over patent specific elasticities (therefore over firms, industries etc.)
© Institute for Fiscal Studies
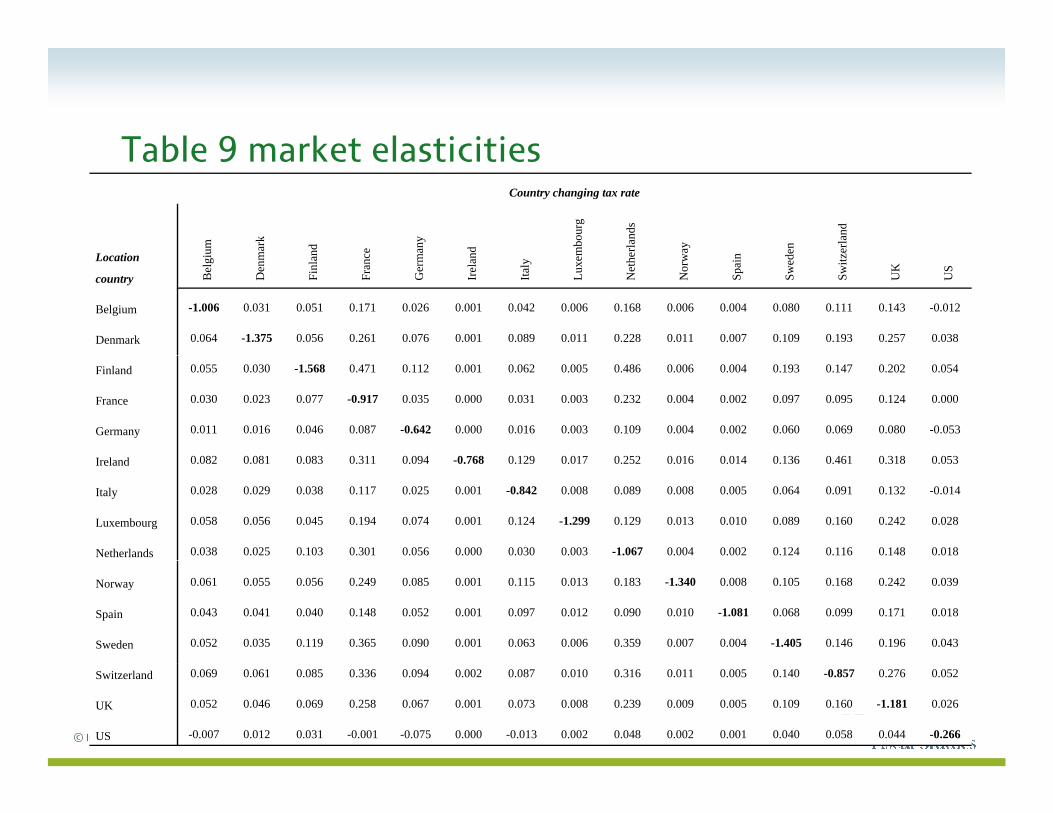
Table 9 market elasticitiesTable 9 market elasticitiesCountry changing tax rate
um mar
k
nd e any
nd mbo
urg
erla
nds
ay en erla
nd
Location
country Bel
giu
Den
m
Finl
an
Fran
c
Ger
m
Irel
an
Italy
Luxe
m
Net
he
Nor
w
Spai
n
Swed
e
Switz
UK
US
Belgium -1.006 0.031 0.051 0.171 0.026 0.001 0.042 0.006 0.168 0.006 0.004 0.080 0.111 0.143 -0.012
Denmark 0.064 -1.375 0.056 0.261 0.076 0.001 0.089 0.011 0.228 0.011 0.007 0.109 0.193 0.257 0.038
Finland 0.055 0.030 -1.568 0.471 0.112 0.001 0.062 0.005 0.486 0.006 0.004 0.193 0.147 0.202 0.054
France 0.030 0.023 0.077 -0.917 0.035 0.000 0.031 0.003 0.232 0.004 0.002 0.097 0.095 0.124 0.000
Germany 0.011 0.016 0.046 0.087 -0.642 0.000 0.016 0.003 0.109 0.004 0.002 0.060 0.069 0.080 -0.053
I l d 0 082 0 081 0 083 0 311 0 094 0 768 0 129 0 017 0 252 0 016 0 014 0 136 0 461 0 318 0 053Ireland 0.082 0.081 0.083 0.311 0.094 -0.768 0.129 0.017 0.252 0.016 0.014 0.136 0.461 0.318 0.053
Italy 0.028 0.029 0.038 0.117 0.025 0.001 -0.842 0.008 0.089 0.008 0.005 0.064 0.091 0.132 -0.014
Luxembourg 0.058 0.056 0.045 0.194 0.074 0.001 0.124 -1.299 0.129 0.013 0.010 0.089 0.160 0.242 0.028
Netherlands 0.038 0.025 0.103 0.301 0.056 0.000 0.030 0.003 -1.067 0.004 0.002 0.124 0.116 0.148 0.018
Norway 0.061 0.055 0.056 0.249 0.085 0.001 0.115 0.013 0.183 -1.340 0.008 0.105 0.168 0.242 0.039
Spain 0.043 0.041 0.040 0.148 0.052 0.001 0.097 0.012 0.090 0.010 -1.081 0.068 0.099 0.171 0.018
Sweden 0.052 0.035 0.119 0.365 0.090 0.001 0.063 0.006 0.359 0.007 0.004 -1.405 0.146 0.196 0.043
© Institute for Fiscal Studies
Switzerland 0.069 0.061 0.085 0.336 0.094 0.002 0.087 0.010 0.316 0.011 0.005 0.140 -0.857 0.276 0.052
UK 0.052 0.046 0.069 0.258 0.067 0.001 0.073 0.008 0.239 0.009 0.005 0.109 0.160 -1.181 0.026
US -0.007 0.012 0.031 -0.001 -0.075 0.000 -0.013 0.002 0.048 0.002 0.001 0.040 0.058 0.044 -0.266
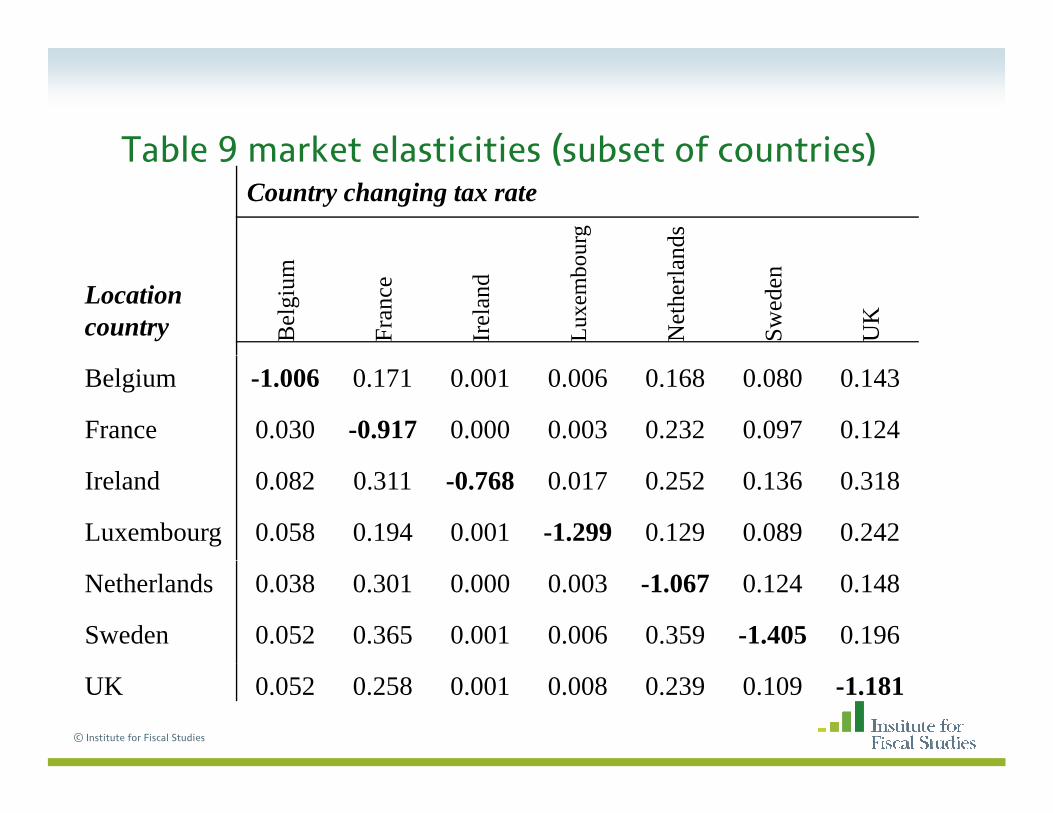
Table 9 market elasticities (subset of countries)Table 9 market elasticities (subset of countries)Country changing tax rate
urg
nds
Location country B
elgi
um
Fran
ce
Irel
and
Luxe
mbo
u
Net
herla
n
Swed
en
UK
Belgium -1.006 0.171 0.001 0.006 0.168 0.080 0.143
France 0.030 -0.917 0.000 0.003 0.232 0.097 0.124
Ireland 0.082 0.311 -0.768 0.017 0.252 0.136 0.318
Luxembourg 0.058 0.194 0.001 -1.299 0.129 0.089 0.242
Netherlands 0.038 0.301 0.000 0.003 -1.067 0.124 0.148
Sweden 0.052 0.365 0.001 0.006 0.359 -1.405 0.196
© Institute for Fiscal Studies
UK 0.052 0.258 0.001 0.008 0.239 0.109 -1.181

Table 9 market elasticities; Ignore CFCTable 9 market elasticities; Ignore CFCCountry changing tax rate
urg
nds
Ireland looks moreprice elastic whendon’t account for CFC
Location country B
elgi
um
Fran
ce
Irel
and
Luxe
mbo
u
Net
herla
n
Swed
en
UK
Belgium -0.942 0.145 0.001 0.005 0.144 0.071 0.121
France 0.025 -0.883 0.001 0.003 0.209 0.088 0.107
Ireland 0.091 0.361 -1.055 0.018 0.299 0.159 0.354
Luxembourg 0.051 0.171 0.003 -1.239 0.109 0.078 0.213
Netherlands 0.033 0.271 0.001 0.002 -1.033 0.112 0.127
Sweden 0.047 0.333 0.001 0.005 0.326 -1.361 0.171
© Institute for Fiscal Studies
UK 0.045 0.226 0.002 0.007 0.207 0.096 -1.136
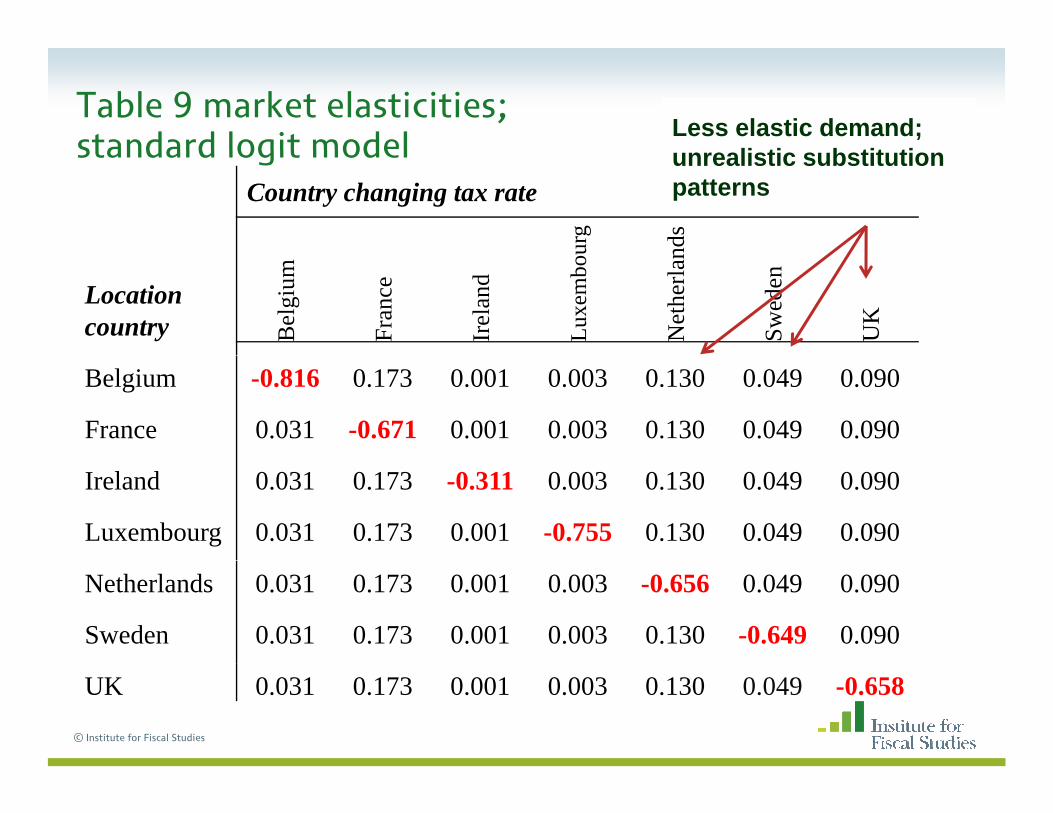
Table 9 market elasticities; standard logit model
Less elastic demand;li ti b tit tistandard logit model
Country changing tax rate
urg
nds
unrealistic substitutionpatterns
Location country B
elgi
um
Fran
ce
Irel
and
Luxe
mbo
u
Net
herla
n
Swed
en
UK
Belgium -0.816 0.173 0.001 0.003 0.130 0.049 0.090
France 0.031 -0.671 0.001 0.003 0.130 0.049 0.090
Ireland 0.031 0.173 -0.311 0.003 0.130 0.049 0.090
Luxembourg 0.031 0.173 0.001 -0.755 0.130 0.049 0.090
Netherlands 0.031 0.173 0.001 0.003 -0.656 0.049 0.090
Sweden 0.031 0.173 0.001 0.003 0.130 -0.649 0.090
© Institute for Fiscal Studies
UK 0.031 0.173 0.001 0.003 0.130 0.049 -0.658

Elasticities in random coefficient modelElasticities in random coefficient model
• standard logit: cross tax elasticities are the same across countries (within each column)
– cross-tax elasticity is a function of only the tax rate in the country that is adjusting its tax rate, the share of that country and the
ffi i t th t t hi h i t t t icoefficient on the tax rate, which is constant across countries
• random coefficients model: cross tax elasticities vary across countries
– they depend on the countries' characteristics and how close they are to each other;
– countries that have more similar characteristics will be seen as closer b tit t b fi d th f th t l ti it ill bsubstitutes by firms, and therefore the cross tax elasticity will be
higher
© Institute for Fiscal Studies

Summary of estimation resultsSummary of estimation results
• Firms respond to taxes when choosing where to hold IPR
• Allowing for observed and unobserved heterogeneity in responsiveness is importantresponsiveness is important
– gives more realistic substitution patterns than standard multinomial logit model
• Controlling for unobserved country effects important
– the attractiveness of a country is positively correlated with tax, failing l f hi k i l k lik d ’to control for this makes it look like tax doesn’t matter
© Institute for Fiscal Studies
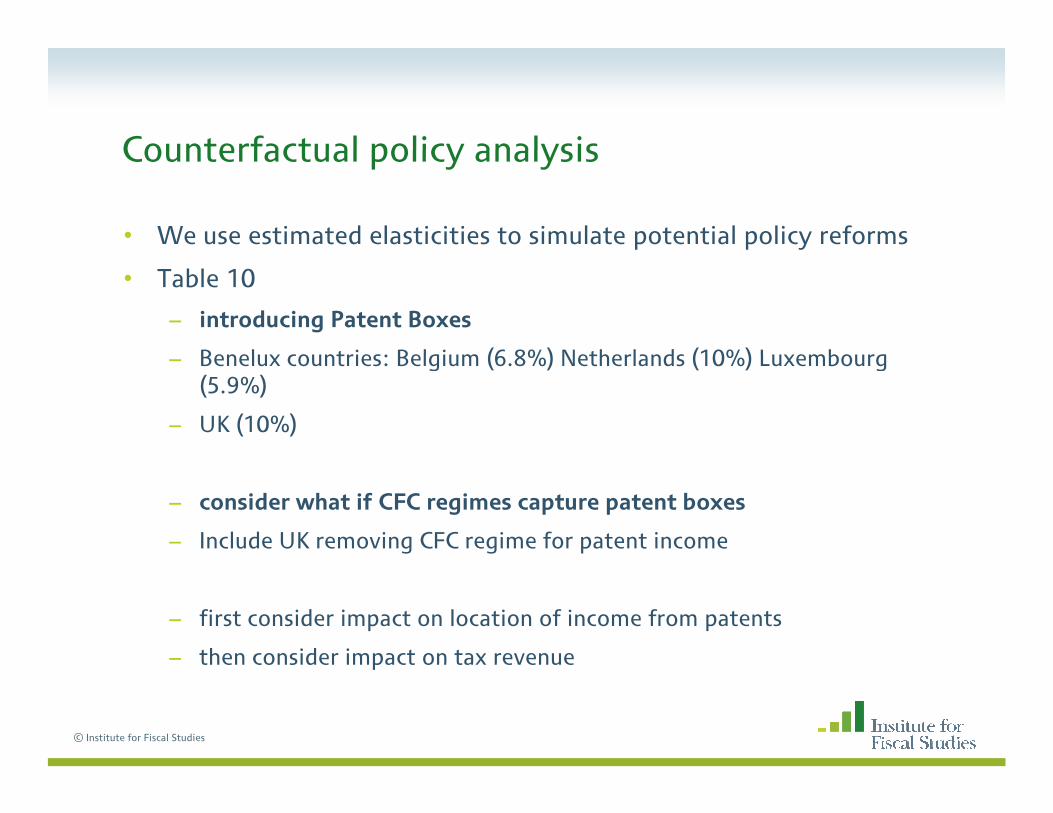
Counterfactual policy analysisCounterfactual policy analysis
• We use estimated elasticities to simulate potential policy reforms
• Table 10
– introducing Patent Boxes
Benelux countries: Belgium (6 8%) Netherlands (10%) Luxembourg– Benelux countries: Belgium (6.8%) Netherlands (10%) Luxembourg (5.9%)
– UK (10%)
– consider what if CFC regimes capture patent boxes
– Include UK removing CFC regime for patent income
– first consider impact on location of income from patents
– then consider impact on tax revenuethen consider impact on tax revenue
© Institute for Fiscal Studies
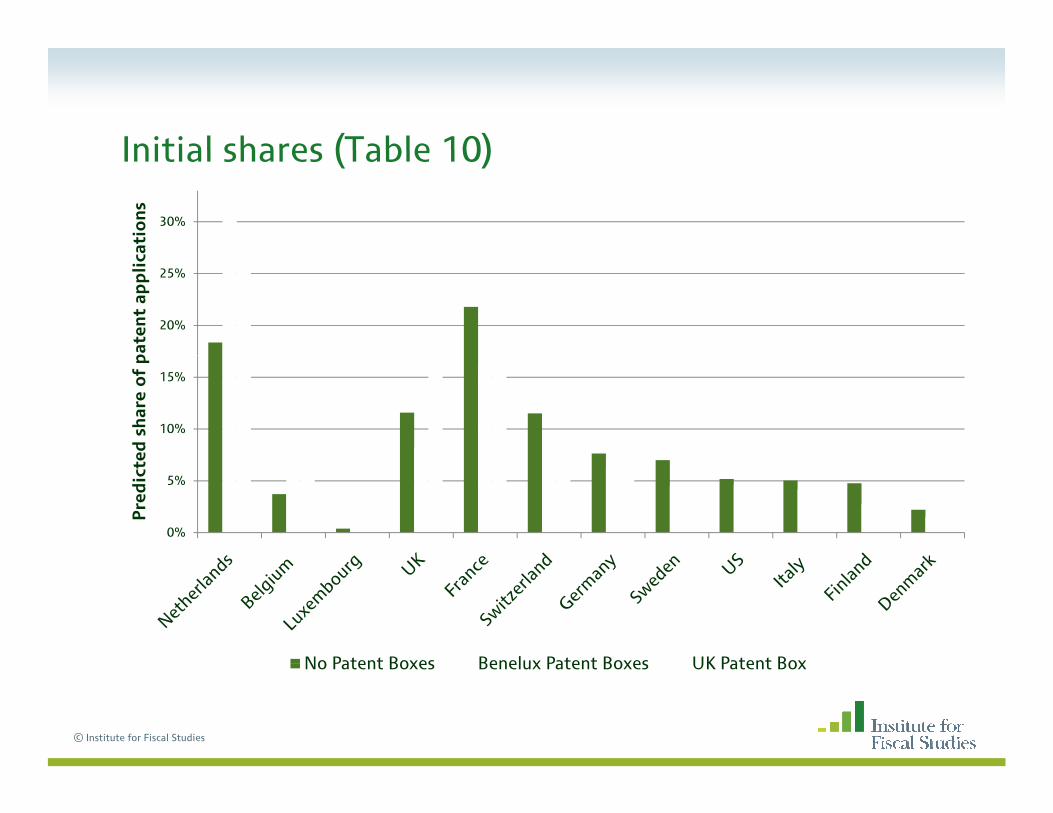
Initial shares (Table 10)Initial shares (Table 10)
30%
atio
ns
20%
25%
pat
ent
app
lica
10%
15%
ed s
har
e o
f p
0%
5%
Pre
dic
te
No Patent Boxes Benelux Patent Boxes UK Patent Box
© Institute for Fiscal Studies
No Patent Boxes Benelux Patent Boxes UK Patent Box
Benelux Patent Boxes • Increase share in BeneluxBenelux Patent Boxes
30%
atio
ns
• Increase share in Benelux countries
• Fall in UK share (12% -8%) , and elsewhere
20%
25%
pat
ent
app
lica and elsewhere
10%
15%
ed s
har
e o
f p
0%
5%
Pre
dic
te
No Patent Boxes Benelux Patent Boxes UK Patent Box
© Institute for Fiscal Studies
No Patent Boxes Benelux Patent Boxes UK Patent Box

UK Patent Box F ll i B l t i ’ hUK Patent Box
30%
atio
ns
• Fall in Benelux countries’ share
• Increase in UK share (to 17%)
20%
25%
pat
ent
app
lica
10%
15%
ed s
har
e o
f p
0%
5%
Pre
dic
te
No Patent Boxes Benelux Patent Boxes UK Patent Box
© Institute for Fiscal Studies
No Patent Boxes Benelux Patent Boxes UK Patent Box
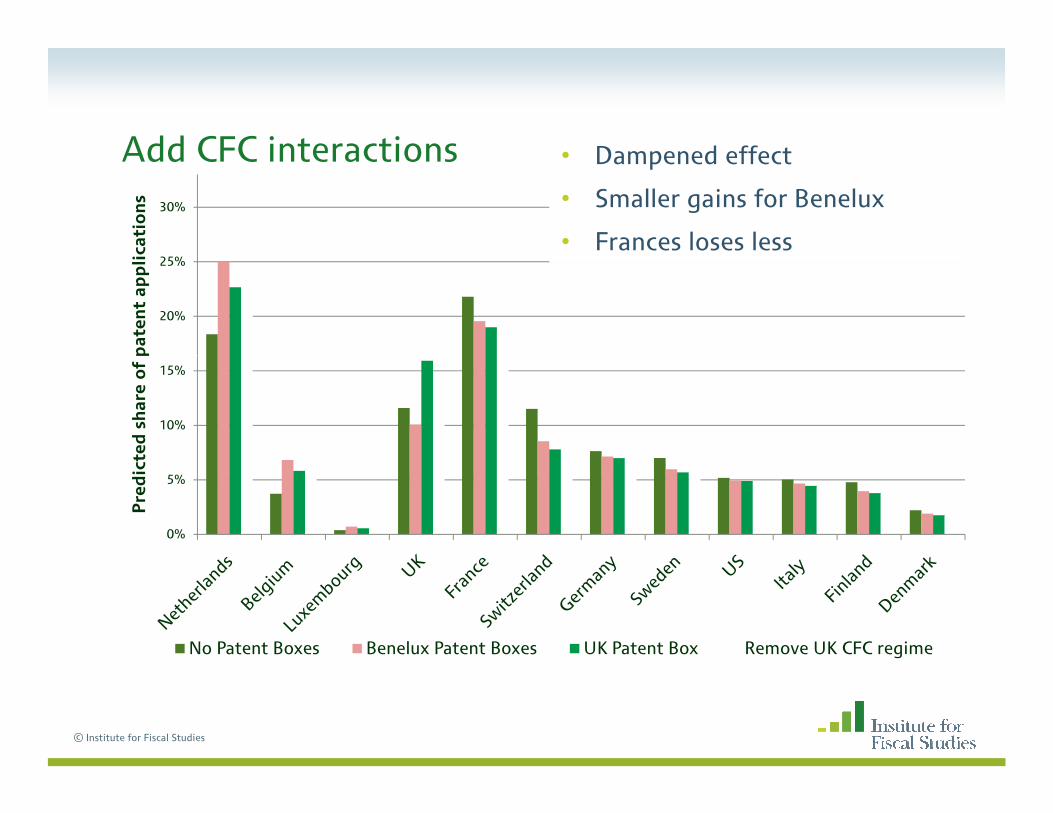
Add CFC interactions D d ff tAdd CFC interactions30%
cati
on
s• Dampened effect
• Smaller gains for Benelux
• Frances loses less
20%
25%
pat
ent
app
lic
10%
15%
ted
sh
are
of
p
0%
5%
Pre
dic
t
No Patent Boxes Benelux Patent Boxes UK Patent Box Remove UK CFC regime
© Institute for Fiscal Studies
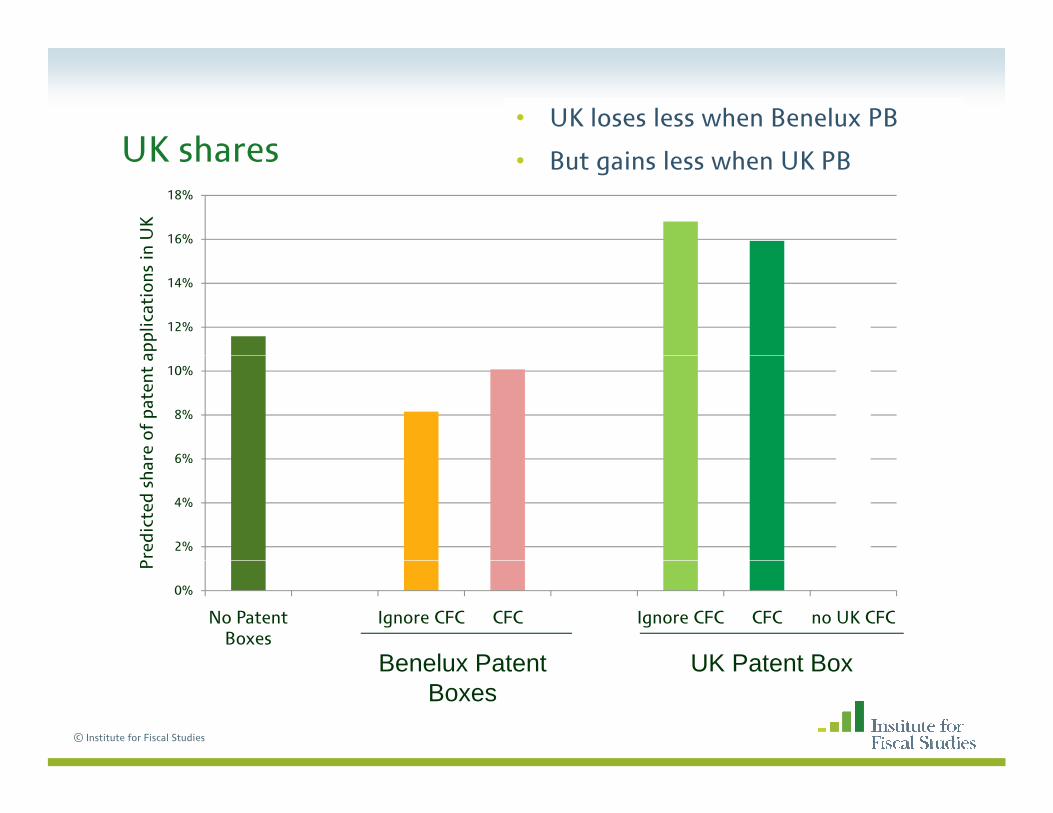
UK shares• UK loses less when Benelux PB
UK shares • But gains less when UK PB
16%
18%
n U
K
12%
14%
appl
icat
ions
in
6%
8%
10%
re o
f pa
tent
a
2%
4%
6%
Pre
dict
ed s
har
0%
No Patent Boxes
Ignore CFC CFC Ignore CFC CFC no UK CFC
P
Benelux Patent UK Patent Box
© Institute for Fiscal Studies
Benelux Patent Boxes
UK Patent Box

UK shares• Smaller gain in UK share when
CFC iUK shares no CFC regime
16%
18%
n U
K
12%
14%
appl
icat
ions
in
6%
8%
10%
re o
f pa
tent
a
2%
4%
6%
Pre
dict
ed s
har
0%
No Patent Boxes
Ignore CFC CFC Ignore CFC CFC no UK CFC
P
Benelux Patent UK Patent Box
© Institute for Fiscal Studies
Benelux Patent Boxes
UK Patent Box

Remove UK CFC regimeRemove UK CFC regime30%
cati
on
s
• UK share higher than initially but lower than when the UK operates CFC regime
20%
25%
pat
ent
app
lic
10%
15%
ted
sh
are
of
p
0%
5%
Pre
dic
t
No Patent Boxes Benelux Patent Boxes UK Patent Box Remove UK CFC regime
© Institute for Fiscal Studies

Table 11: Tax revenueTable 11: Tax revenue
• government revenue from patent income,
– function of the share of patent income held in a country and the relevant tax rate.
– For illustration, assume that CFC regimes continue to operate based on the statutory tax rates
• Expect fall in revenue in non-Patent Box countriesExpect fall in revenue in non Patent Box countries
• In others depends on whether increase in share of income outweighs lower tax rate applied to income
© Institute for Fiscal Studies

Table 11: Tax revenue
90
100
even
ueTable 11: Tax revenue
60
70
80
ed t
o in
ital
re
30
40
50
enue
, in
dex
e
0
10
20
vern
men
t re
vG
ov
No Patent Boxes Benelux Patent Boxes UK Patent Box
© Institute for Fiscal Studies

Tax revenuesTax revenues
• What if other countries followed suit and also introduced Patent Boxes?
– We simulate the effect of France of Sweden introducing a 10% Patent Box
– UK share of patent income falls further and with it govt. revenues
© Institute for Fiscal Studies

ExtensionsExtensions
• Interactions between governments in tax setting
we showed indicative evidence that tax competition could erode any– we showed indicative evidence that tax competition could erode any benefits
– model government behaviour; write down government’s maximisation problem and find optimal policyp p p y
• More heterogeneity in the model?
– we assume fixed benefits and costs of choosing a location are common across firms
– likely to depend on (unobserved) firm characteristics
– allow more random coefficients
© Institute for Fiscal Studies

General conclusionsGeneral conclusions
• Important to account for heterogeneity in firm location choice
industry– industry
– size
– variation in responses to taxes with unobserved characteristics
• Tax does affect location of patent holding
• Patent boxes attract patent holdings but lead to reductions in revenue
© Institute for Fiscal Studies