short- and long-term performance of leds© 2008 rensselaer polytechnic institute. all rights...
TRANSCRIPT

© 2008 Rensselaer Polytechnic Institute. All rights reserved.
ShortShort-- and longand long--term term performance of LEDsperformance of LEDs
N. NarendranN. Narendran
Lighting Research CenterLighting Research Center
Rensselaer Polytechnic InstituteRensselaer Polytechnic Institute
Troy, NYTroy, NY
EIRT MeetingChicago, IL
April 22, 2008

2© 2008 Rensselaer Polytechnic Institute. All rights reserved.
Introduction Introduction -- LED EvolutionLED Evolution
LumiLeds Lighting

3© 2008 Rensselaer Polytechnic Institute. All rights reserved.
Introduction Introduction -- White LED PromiseWhite LED Promise
15 lm/W
90 lm/W
120 lm/W
150 lm/WEnergy savings
1000 hrs
20,000 hrs30,000 hrs
100,000 hrsLower maintenance cost
By 2012

4© 2008 Rensselaer Polytechnic Institute. All rights reserved.
Lighting

5© 2008 Rensselaer Polytechnic Institute. All rights reserved.
LED: Present LED: Present IndustryIndustry TrendTrend
Growing number of LEDs and LED fixturesGrowing number of LEDs and LED fixtures

6© 2008 Rensselaer Polytechnic Institute. All rights reserved.

7© 2008 Rensselaer Polytechnic Institute. All rights reserved.
Lighting Market ForecastLighting Market Forecast
Forecast from Optoelectronics Industry Development Forecast from Optoelectronics Industry Development Association (OIDA)Association (OIDA)›› Incandescent will be the worst affectedIncandescent will be the worst affected
http://images.google.com/imgres?imgurl=http://wrtassoc.com/__oneclick_uploads/2007/11/ssl-forecast.jpg&imgrefurl=http://wrtassoc.com/&h=346&w=575&sz=31&hl=en&start=7&um=1&tbnid=ziWTcKTuWLmgAM:&tbnh=81&tbnw=134&
prev=/images%3Fq%3Devolution%2Bof%2Bhigh%2Bpower%2Blight%2Bemitting%2Bdiodes%26um%3D1%26hl%3Den%26sa%3DX

8© 2008 Rensselaer Polytechnic Institute. All rights reserved.
Performance of Commercial Products
9© 2008 Rensselaer Polytechnic Institute. All rights reserved.
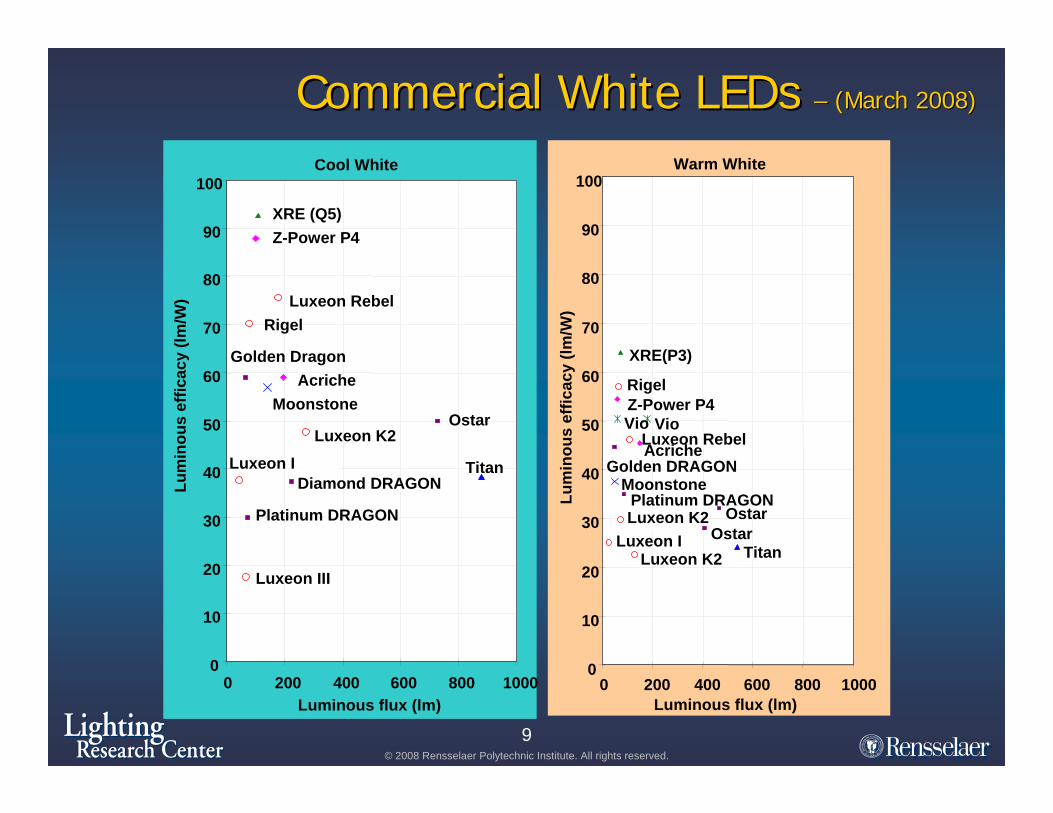
Commercial White LEDs Commercial White LEDs –– (March 2008)(March 2008)
Warm White
Vio Vio
OstarOstar
Z-Power P4
Acriche
XRE(P3)
Luxeon Rebel
Luxeon ILuxeon K2
Rigel
Platinum DRAGON
Golden DRAGON
Titan
Moonstone
Luxeon K2
0
10
20
30
40
50
60
70
80
90
100
0 200 400 600 800 1000Luminous flux (lm)
Lum
inou
s ef
ficac
y (lm
/W)
Cool White
Moonstone
Diamond DRAGON
Z-Power P4
Acriche
XRE (Q5)
Luxeon Rebel
Luxeon ILuxeon K2
Luxeon III
Rigel
Platinum DRAGON
Golden Dragon
Ostar
Titan
0
10
20
30
40
50
60
70
80
90
100
0 200 400 600 800 1000Luminous flux (lm)
Lum
inou
s ef
ficac
y (lm
/W)

10© 2008 Rensselaer Polytechnic Institute. All rights reserved.
LED: StateLED: State--ofof--thethe--artart
LumiLeds Lighting
11© 2008 Rensselaer Polytechnic Institute. All rights reserved.
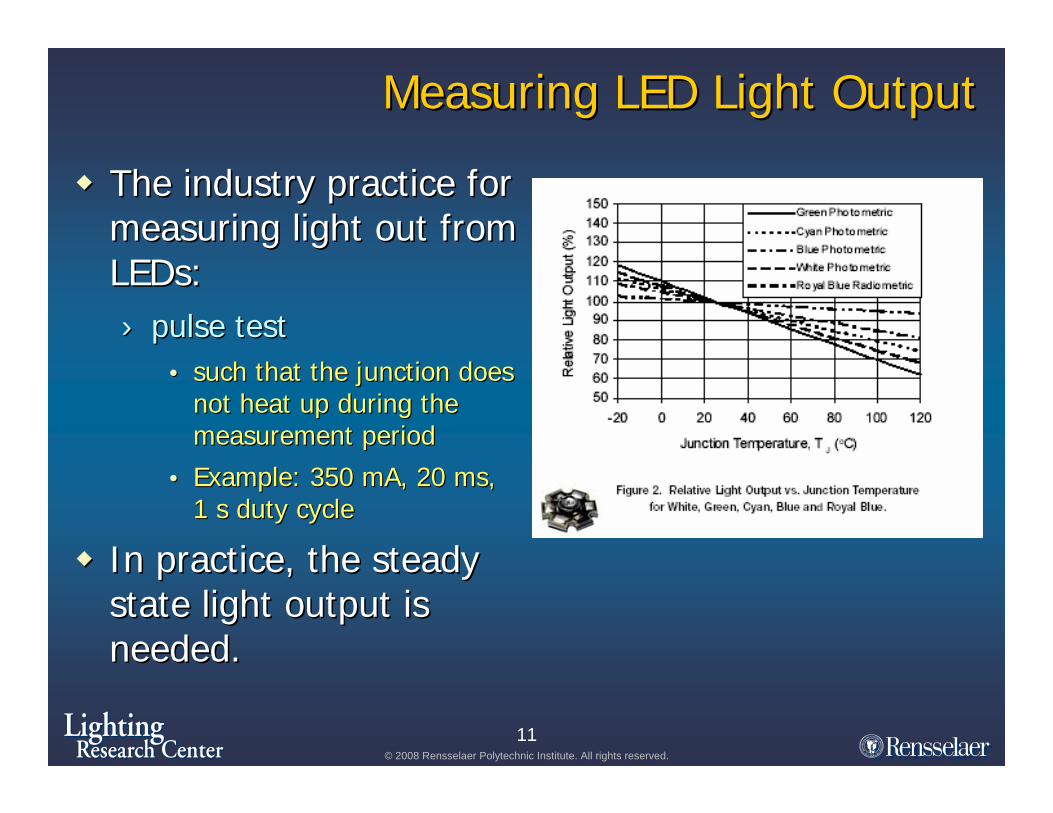
Measuring LED Light OutputMeasuring LED Light Output
The industry practice for The industry practice for measuring light out from measuring light out from LEDs:LEDs:›› pulse testpulse test
•• such that the junction does such that the junction does not heat up during the not heat up during the measurement measurement periodperiod
•• Example: 350 mA, 20 ms, Example: 350 mA, 20 ms, 1 s duty cycle1 s duty cycle
In practice, the steady In practice, the steady state light output is state light output is needed.needed.
http://www.lumileds.com/pdfs/DS46.PDF

12© 2008 Rensselaer Polytechnic Institute. All rights reserved.
LED LED SystemSystemLED
Electrical ~ 80%
Optical ~ 80%
Heat ~ 85%
Final Efficiency ~ 54%
Luxeon

13© 2008 Rensselaer Polytechnic Institute. All rights reserved.
LED Lighting LED Lighting SystemsSystems PerformancePerformance
To the end user, it is the system performance that To the end user, it is the system performance that matters, not source performance.matters, not source performance.
0
50
100
150
200
250
2000 2004 2008 2012Year
Perf
orm
ance
(Lm
/W)
White LED
R&D Results
Liner Fluorescent Systems
CFL Systems
Incand. Systems
(2007-08)
LED Systems

14© 2008 Rensselaer Polytechnic Institute. All rights reserved.
Reliability

15© 2008 Rensselaer Polytechnic Institute. All rights reserved.
LED LifeLED Life
Many commercial LEDs in the marketplaceMany commercial LEDs in the marketplace›› All LEDs are not created the same; large All LEDs are not created the same; large
variations between them.variations between them.High power white LED
70%
75%
80%
85%
90%
95%
100%
100 1000 10000 100000Time (hours)
Rel
ativ
e lig
ht o
utpu
t
F
C
A D
E B
1W white LEDs operated at 35 deg C, 350 mA

16© 2008 Rensselaer Polytechnic Institute. All rights reserved.
Traffic LightsTraffic Lights
LED LED –– Value propositionValue proposition›› Uses 80% less energy than incandescent signalsUses 80% less energy than incandescent signals
›› Reduces maintenance costsReduces maintenance costs•• (typically 5(typically 5--year warranty)year warranty)
Poorly integrated systems could have Poorly integrated systems could have muchmuchshorter shorter lifetimeslifetimes
Failed LEDs

17© 2008 Rensselaer Polytechnic Institute. All rights reserved.
Failure MethodsFailure Methods
Catastrophic Catastrophic –– Abrupt and complete cessationAbrupt and complete cessation•• Broken stitch bondsBroken stitch bonds
•• Lifted dieLifted die--attachattach
•• Cracking epoxyCracking epoxy
•• Delamination of epoxyDelamination of epoxy--leadframeleadframe
•• Broken solder jointsBroken solder joints
Degradation Degradation –– Continuous deterioration over timeContinuous deterioration over time•• TimeTime--dependent light lossdependent light loss
•• TimeTime--dependent color shiftdependent color shift
Failure results in reduced lifeFailure results in reduced life

18© 2008 Rensselaer Polytechnic Institute. All rights reserved.
Market SpoilersMarket Spoilers
OverOver--promisedpromised, , underunder--delivereddelivered productsproducts
Taipei
Not good for the LED lighting industryNot good for the LED lighting industry

19© 2008 Rensselaer Polytechnic Institute. All rights reserved.
Thermal Issues

20© 2008 Rensselaer Polytechnic Institute. All rights reserved.
Ballast (Driver)
Heat Sink
Optics (Lens)
LED Array
Optics (Diffuser)
Electrical Grid
Fixture Housing
Controls
Circuit Board
LED Lighting SystemLED Lighting System

21© 2008 Rensselaer Polytechnic Institute. All rights reserved.
Energy output of electric light sources
70 %34 %18 %Heat(Conduction-Convection)
10 %13 %Ballast or Driver
Low29 %72 %IR
20 %23 %10 %Light
LED(estimate)
Fluorescent*(T-8 F32 rare earth)
Incandescent*(100 W)
* IESNA Handbook – 9th Edition
Why is heat management important?Why is heat management important?

22© 2008 Rensselaer Polytechnic Institute. All rights reserved.
Why is heat management important?Why is heat management important?
Higher temperature near the LED junctionHigher temperature near the LED junction›› ShortShort--term effect term effect
•• Lower light outputLower light output
•• Wavelength (color) shiftWavelength (color) shift
›› LongLong--term effect term effect •• Higher degradation rate (shorter life)Higher degradation rate (shorter life)
Poor heat management leads to poor system Poor heat management leads to poor system performanceperformance

23© 2008 Rensselaer Polytechnic Institute. All rights reserved.
Impact of Heat on LEDsImpact of Heat on LEDs
Heat at the junction affects the performance Heat at the junction affects the performance of LEDsof LEDs›› Light output reduces with increased heatLight output reduces with increased heat
›› Color shifts with heatColor shifts with heat
›› Life shortens with heatLife shortens with heat
R2 = 0.91
0
10000
20000
30000
40000
50000
60000
35 40 45 50 55 60
T pin (deg C)
Life
L70
% (h
rs)
1 Watt White LEDs
60%70%80%
90%100%110%
40 60 80 100 120Tj
Rel
ativ
e lig
ht o
utpu
t
LED A
LED B
LED C
Reference: Narendran et al., IESNA 2006
24© 2008 Rensselaer Polytechnic Institute. All rights reserved.
LED System Performance in Applications

25© 2008 Rensselaer Polytechnic Institute. All rights reserved.
Lighting ApplicationLighting Application
IncandescentHalogen CFL LED
Now, many light source technologies can Now, many light source technologies can cater to a given lighting application.cater to a given lighting application.

26© 2008 Rensselaer Polytechnic Institute. All rights reserved.
Ceiling tiles (Poor thermal conductor)
Halogen / Incandescent Fixture
LED Fixture
Conducted heat
Radiant heat
Insulation material above the ceiling area
Installation IssuesInstallation IssuesSystem integration and application environment System integration and application environment affectaffect LED system LED system performance.performance.

27© 2008 Rensselaer Polytechnic Institute. All rights reserved.
Installation IssuesInstallation Issues
InIn--groundground vs.vs. aboveabove--groundground fixturesfixtures

28© 2008 Rensselaer Polytechnic Institute. All rights reserved.
Application EnvironmentsApplication Environments
Generally, light sources or fixtures operate in Generally, light sources or fixtures operate in thermal environments such as:thermal environments such as:›› Fully ventilated (e.g., track lighting, openFully ventilated (e.g., track lighting, open--air)air)
›› SemiSemi--ventilated (e.g., recessed downlight, Nonventilated (e.g., recessed downlight, Non--IC)IC)
›› Enclosed (e.g., recessed downlight with ceiling insulation, Enclosed (e.g., recessed downlight with ceiling insulation, IC)IC)
http://www.ylighting.com/linear-system.htmlReference: Narendran et al., IESNA 2006

29© 2008 Rensselaer Polytechnic Institute. All rights reserved.
Performance of Performance of anan LED PAR Lamp LED PAR Lamp
The junction temperature of the LED array The junction temperature of the LED array changes when the PAR lamp is used in the changes when the PAR lamp is used in the three different application conditions.three different application conditions.
LED PAR30 Lamp in Application
0255075
100125150175200
0 2 4 6 8 10Time (hrs)
Tem
pera
ture
(C)
Open IC Non-IC
~ 160°C
~ 90°C
~ 60°C
Reference: Jayasinghe et al., 2006

30© 2008 Rensselaer Polytechnic Institute. All rights reserved.
ASSISTASSIST RecommendsRecommends
In 2007, several In 2007, several ASSIST ASSIST recommendsrecommendsdocuments were released: documents were released: ›› General guide to applicationsGeneral guide to applications›› Guide to selecting LED fixturesGuide to selecting LED fixtures›› Testing and evaluation recommendationsTesting and evaluation recommendations
ASSIST ASSIST recommendsrecommends testtest methods were methods were designed to:designed to:›› Provide more useful information for selecting Provide more useful information for selecting
and using LED directional lightingand using LED directional lighting luminairesluminaires›› Help differentiate between good and poor Help differentiate between good and poor
performing LEDperforming LED luminairesluminaires in terms of light in terms of light output and lifeoutput and life

31© 2008 Rensselaer Polytechnic Institute. All rights reserved.
Directional Lighting Test MethodDirectional Lighting Test Method
ASSIST ASSIST recommendsrecommends proposed three proposed three environmental conditions to test environmental conditions to test fixtures:fixtures:
›› Open air:Open air: Here the light source and the Here the light source and the driver have plenty of ventilation around driver have plenty of ventilation around them.them.
›› SemiSemi--ventilated:ventilated: Here the light source and Here the light source and the driver have limited ventilation around the driver have limited ventilation around them. them.
›› Enclosed:Enclosed: Here the light source and the Here the light source and the driver have almost no ventilation around driver have almost no ventilation around them.them.

32© 2008 Rensselaer Polytechnic Institute. All rights reserved.
Sphere Sphere PhotometryPhotometry
Temperature, Ts, is measured Temperature, Ts, is measured while operating the fixture in while operating the fixture in the the three environmentsthree environments..
Fixture is placed inside a Fixture is placed inside a heated enclosure which is heated enclosure which is place inside the integrating place inside the integrating sphere.sphere.
Data gathered once the Data gathered once the temperature, Ts, temperature, Ts, reachesreachesapplication application temperature.temperature. Heater
Lamp
Driver
Heated enclosure
Feedbackcontrol
Ts

33© 2008 Rensselaer Polytechnic Institute. All rights reserved.
LuminaireLuminaire Testing Testing
Several commercial LED fixtures are being tested in Several commercial LED fixtures are being tested in 3 environments (per 3 environments (per ASSISTASSIST recommendsrecommends))›› Open airOpen air›› NonNon--ICIC›› ICIC
ShortShort--term testingterm testing›› Flux and colorFlux and color
LongLong--term testingterm testing›› Lumen depreciation Lumen depreciation
and life (L70)and life (L70)›› Color shiftColor shift

34© 2008 Rensselaer Polytechnic Institute. All rights reserved.
Flux (lumens)Flux (lumens)
WellWell--designeddesigned luminaires maintain light luminaires maintain light output,output, even even in hotter in hotter environments.environments.Poorly designed luminaires have more than 30% Poorly designed luminaires have more than 30% lower light output in lower light output in ICIC--condition.condition.
236
649583
263212
678
446
223
643
396
183
0100200300400500600700800
Fixture A26W
Fixture B26W
Fixture C12W
Fixture D30W
Flux
(lum
ens)
Open air Non-IC IC

35© 2008 Rensselaer Polytechnic Institute. All rights reserved.
Efficacy (lm/W)Efficacy (lm/W)
Generally, system efficacy values are 30% to 50% Generally, system efficacy values are 30% to 50% lower than LED efficacy values. lower than LED efficacy values. However, However, wellwell--designeddesigned luminaires have achieved luminaires have achieved over 50 lm/W over 50 lm/W ..
10
22
54
8917
7715
5457
0
10
20
30
40
50
60
70
Fixture A26W
Fixture B26W
Fixture C12W
Fixture D30W
Effic
acy
(lm/W
)
Open air Non-IC IC
36© 2008 Rensselaer Polytechnic Institute. All rights reserved.
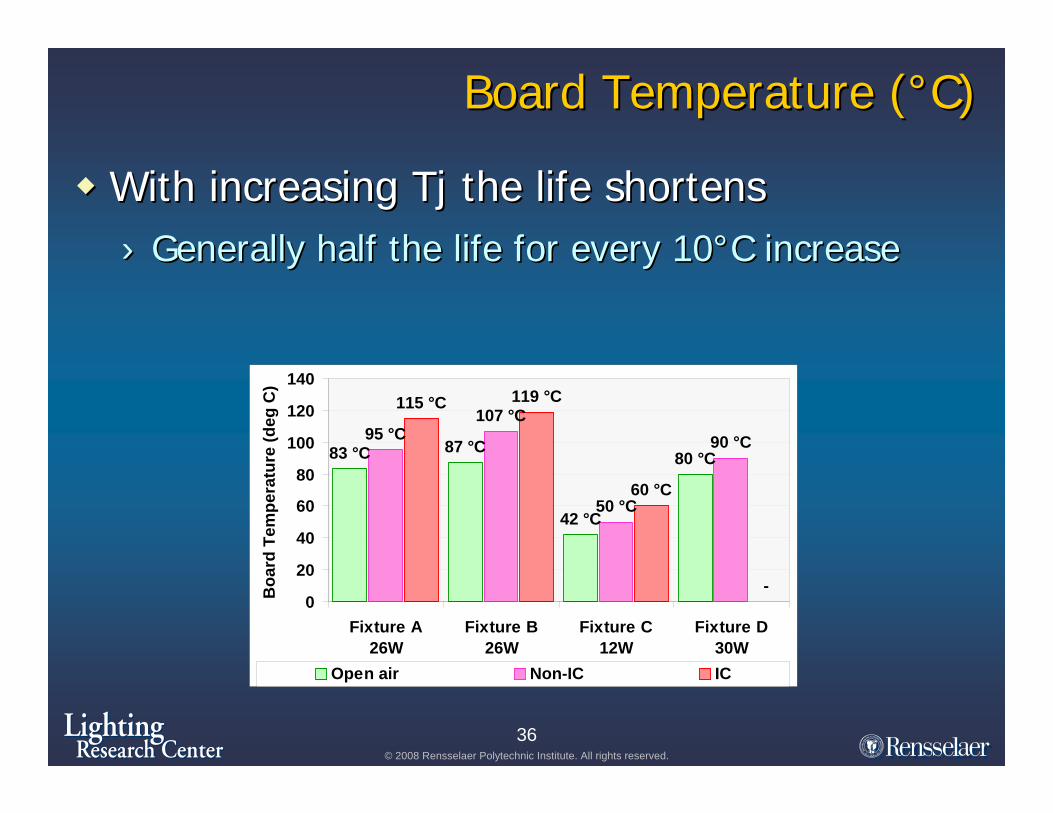
Board Temperature (Board Temperature (°°C)C)
With increasing With increasing TjTj the life shortens the life shortens ›› Generally half the life for every 10Generally half the life for every 10°°C increaseC increase
83 °C 87 °C
42 °C
80 °C95 °C
107 °C
50 °C
90 °C
115 °C 119 °C
60 °C
-0
20
40
60
80
100
120
140
Fixture A26W
Fixture B26W
Fixture C12W
Fixture D30W
Boa
rd T
empe
ratu
re (d
eg C
)
Open air Non-IC IC

37© 2008 Rensselaer Polytechnic Institute. All rights reserved.
Lumen Depreciation & Color ShiftLumen Depreciation & Color Shift
In the IC In the IC condition:condition:Life (L70) is less than 3000 hrsLife (L70) is less than 3000 hrsThe color shift is greater than a The color shift is greater than a 3636--step step MacAdamMacAdam ellipse ellipse (reached within 3000 hrs) (reached within 3000 hrs)
Fixture A - 26W LED Downlight
50%
60%
70%
80%
90%
100%
110%
100 1,000 10,000Time (hours)
Rel
ativ
e Li
ght O
utpu
t
Enclosed Semi-ventilated Open air
83 83 °°CC95 95 °°CC115 115 °°CCOpen airOpen airNonNon--ICICICIC
Fixture A - 26W LED Downlight
0
10
20
30
40
50
100 1,000 10,000Time (hours)
Mac
Ada
m E
llips
es
Enclosed Semi-ventilated Open air

38© 2008 Rensselaer Polytechnic Institute. All rights reserved.
Fixture B - 26W LED Downlight
50%
60%
70%
80%
90%
100%
110%
100 1,000 10,000Time (hours)
Rel
ativ
e Li
ght O
utpu
t
Enclosed Semi-ventilated Open air
Lumen Depreciation & Color ShiftLumen Depreciation & Color Shift
In the IC In the IC condition:condition:Life (L70) is less than 3000 hrsLife (L70) is less than 3000 hrsThe color shift is greater than a The color shift is greater than a 1919--step step MacAdamMacAdam ellipse ellipse (reached within 4000 hrs)(reached within 4000 hrs)
87 87 °°CC107 107 °°CC119 119 °°CCOpen airOpen airNonNon--ICICICIC
Fixture B - 26W LED Downlight
0
10
20
30
40
50
100 1,000 10,000Time (hours)
Mac
Ada
m E
llips
es
Enclosed Semi-ventilated Open air

39© 2008 Rensselaer Polytechnic Institute. All rights reserved.
Fixture C - 12W LED Downlight
50%
60%
70%
80%
90%
100%
110%
100 1,000 10,000Time (hours)
Rel
ativ
e Li
ght O
utpu
t
Enclosed Semi-ventilated Open air
Lumen Depreciation & Color ShiftLumen Depreciation & Color Shift
Even in the IC Even in the IC condition:condition:Life (L70) seems very longLife (L70) seems very longThe color shift is within The color shift is within a 4a 4--stepstepMacAdamMacAdam ellipseellipse (in the 3000 hrs)(in the 3000 hrs)
42 42 °°CC50 50 °°CC60 60 °°CCOpen airOpen airNonNon--ICICICIC
Fixture C - 12W LED Downlight
0
2
4
6
8
10
100 1,000 10,000Time (hours)
Mac
Ada
m E
llips
es
Enclosed Semi-ventilated Open air
40© 2008 Rensselaer Polytechnic Institute. All rights reserved.
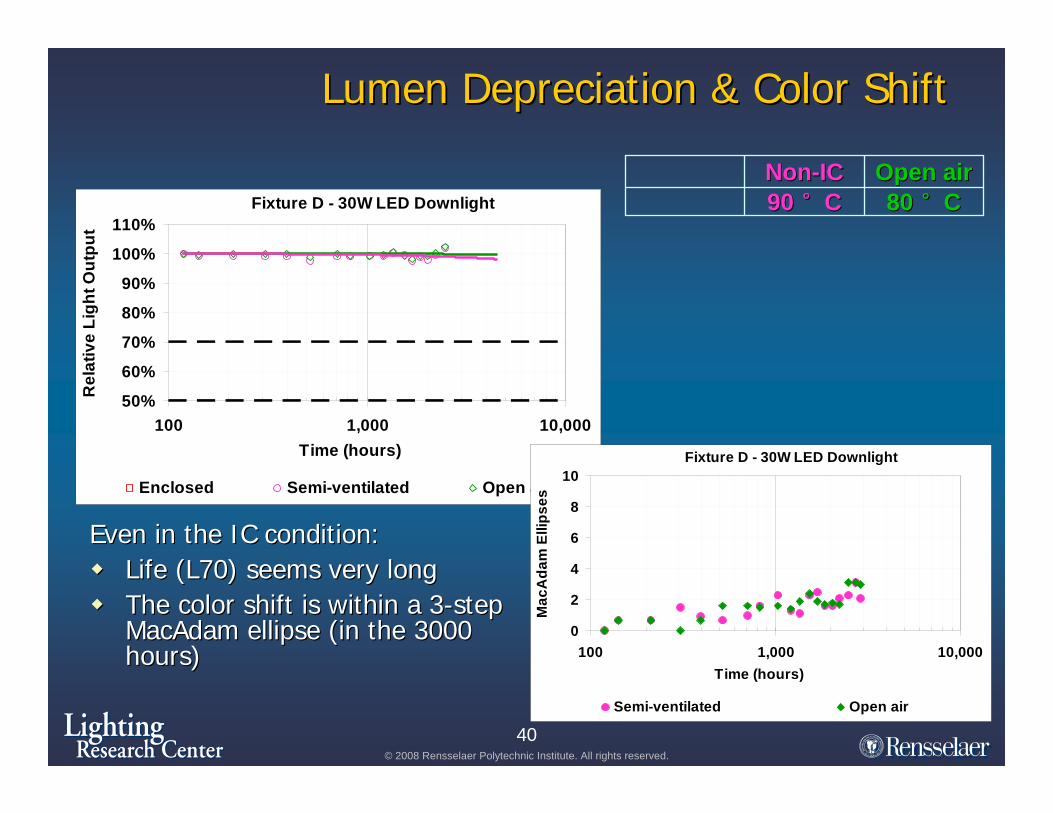
Fixture D - 30W LED Downlight
50%
60%
70%
80%
90%
100%
110%
100 1,000 10,000Time (hours)
Rel
ativ
e Li
ght O
utpu
t
Enclosed Semi-ventilated Open air
80 80 °°CC90 90 °°CCOpen airOpen airNonNon--ICIC
Even in the IC Even in the IC condition:condition:Life (L70) seems very Life (L70) seems very longlongThe color shift is within The color shift is within a 3a 3--stepstepMacAdamMacAdam ellipseellipse (in the 3000 (in the 3000 hours)hours)
Lumen Lumen DepreciationDepreciation & Color & Color ShiftShift
Fixture D - 30W LED Downlight
0
2
4
6
8
10
100 1,000 10,000Time (hours)
Mac
Ada
m E
llips
es
Semi-ventilated Open air

41© 2008 Rensselaer Polytechnic Institute. All rights reserved.
LED Airport LightingLED Airport Lighting
There are several LED fixtures available in the There are several LED fixtures available in the market to replace traditional runway and taxiway market to replace traditional runway and taxiway fixtures.fixtures.
Taxiway (in-pavement, elevated) Obstruction Utility(L-852A, B, C, D, T; L-861T) (L-810)
White obstruction(L-810)
ADB-Siemens ADB-Siemens ADB-Siemens ADB-Siemens ADB-Siemens
ADB-Siemens
Dialight
Dialight

42© 2008 Rensselaer Polytechnic Institute. All rights reserved.
Why LEDs?Why LEDs?
Top performance criteriaTop performance criteria›› Improved visual performanceImproved visual performance
•• Intensity distribution and colorimetry specificationsIntensity distribution and colorimetry specifications
›› System reliabilitySystem reliability•• Maintain beam properties under Maintain beam properties under all weatherall weather conditions conditions
›› Reduced maintenance costReduced maintenance cost•• Life ratings under actual operating conditionsLife ratings under actual operating conditions
›› Reduced energy costReduced energy cost•• System efficiencySystem efficiency

43© 2008 Rensselaer Polytechnic Institute. All rights reserved.
WarmWarm--up Timeup Time
Stabilization time of LEDs is typically longer than 45 minutes, Stabilization time of LEDs is typically longer than 45 minutes, in some cases 150 minutes in some cases 150 minutes isis needed.needed.
Photometric and electrical characteristics depend on the Photometric and electrical characteristics depend on the junction temperature (Tj).junction temperature (Tj).
FAA specification requirements:FAA specification requirements:Perform tests after 15 minutes of operation.Perform tests after 15 minutes of operation.

44© 2008 Rensselaer Polytechnic Institute. All rights reserved.
LED Pin TemperatureALSF green threshold runway fixture
0
20
40
60
80
100
0 50 100 150 200 250Time (min)
LED
Pin
Tem
pera
ture
(ºC
)
Inside
Outside
WarmWarm--up Timeup Time
Green Runway Threshold FixtureGreen Runway Threshold Fixture›› Measured LED pin temperature inside and out of an Measured LED pin temperature inside and out of an
enclosed spaceenclosed space

45© 2008 Rensselaer Polytechnic Institute. All rights reserved.
Peak Wavelength ShiftALSF green threshold runway fixture
0
1
2
3
4
5
0 50 100 150 200 250 300
Time (min)
Pea
k W
avel
engt
h S
hif
t (n
m)
Relative Light OutputALSF green threshold runway fixture
85%
90%
95%
100%
0 50 100 150 200 250 300
Time (min)
Rel
ativ
e Li
ght
Ou
tpu
t
WarmWarm--up Timeup Time
Green Runway Threshold FixtureGreen Runway Threshold Fixture›› Measured light output and spectrumMeasured light output and spectrum
46© 2008 Rensselaer Polytechnic Institute. All rights reserved.
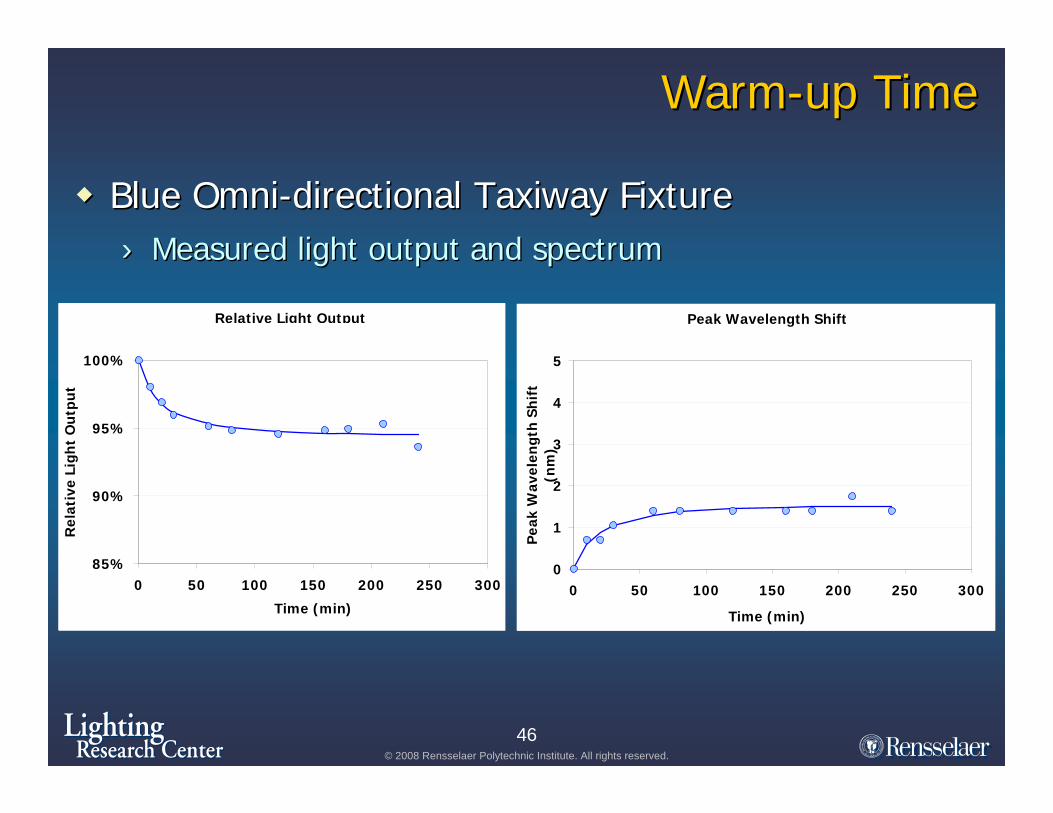
WarmWarm--up Timeup Time
Blue OmniBlue Omni--directional Taxiway Fixturedirectional Taxiway Fixture›› Measured light output and spectrumMeasured light output and spectrum
Peak Wavelength ShiftL-861T blue omni-directional taxiway fixture
0
1
2
3
4
5
0 50 100 150 200 250 300
Time (min)
Pea
k W
avel
engt
h Sh
ift
(nm
)
Relative Light OutputL-861T blue omni-directional taxiway fixture
85%
90%
95%
100%
0 50 100 150 200 250 300
Time (min)
Rel
ativ
e Li
ght
Out
put

Life Life –– Light Output DepreciationLight Output Depreciation
Life of LEDs is better defined as light output depreciation Life of LEDs is better defined as light output depreciation over time, which depends on each LEDover time, which depends on each LED’’s technology and the s technology and the actual operating conditions.actual operating conditions.
High Power LEDs
50%
60%
70%
80%
90%
100%
100 1000 10000 100000Hours
Rel
ativ
e lig
ht o
utpu
t
White Red Blue Green
LRC Data 2004 - 350 mA; 35 ºC
FAA specification requirements:FAA specification requirements:Life is defined as a minimum number of rated hours to failure.Life is defined as a minimum number of rated hours to failure.

Life Life –– Light Output DepreciationLight Output Depreciation
Lumen depreciation of LEDs Lumen depreciation of LEDs with heatwith heat
I = Io exp - alpha (t)
70%
80%
90%
100%
0 10000 20000 30000 40000Hours
Ligh
t Out
put
Thermocouple
R2 = 0.96
010000
2000030000
4000050000
35 40 45 50 55 60T-point Temperature (deg C)
Life
(hrs
)
49© 2008 Rensselaer Polytechnic Institute. All rights reserved.
Dimming LEDs

50© 2008 Rensselaer Polytechnic Institute. All rights reserved.
DimmingDimming LEDsLEDs
Dimming methodsDimming methods›› Continuous Current Reduction (CCR) Continuous Current Reduction (CCR)
›› Pulse Width Modulation (PWM)Pulse Width Modulation (PWM)
The duty cycle (D):D = τ / T
T
τ
Ligh
t Out
put
Drive Current
Y. Gu et al., SPIE 2006

51© 2008 Rensselaer Polytechnic Institute. All rights reserved.
Dimming WhiteDimming White LEDsLEDs
DybleDyble etet al.al. in 2005in 2005 quantified color shift of quantified color shift of highhigh--powerpower white white LED systems due to CCR LED systems due to CCR andand PWM dimming. PWM dimming. ›› Compared to PC white LEDs, Compared to PC white LEDs, mixed color (RGB)mixed color (RGB) white LEDs had very white LEDs had very
large color large color shift undershift under both dimming methods.both dimming methods.
Dyble et al., 2005

52© 2008 Rensselaer Polytechnic Institute. All rights reserved.
-10-8-6-4-202468
10
0% 20% 40% 60% 80% 100%current level/duty cycle
peak
wav
elen
gth
shift
-10-8-6-4-202468
10
0% 20% 40% 60% 80% 100%current level/duty cycle
peak
wav
elen
gth
shift
-10-8-6-4-202468
10
0% 20% 40% 60% 80% 100%current level/duty cycle
peak
wav
elen
gth
shift
Peak Peak WavelengthWavelength ShiftsShiftsForFor InGaN InGaN LEDs,LEDs, the peak wavelength shifts are in opposite directions for the tthe peak wavelength shifts are in opposite directions for the two dimming wo dimming schemes.schemes.
›› Current: blue shift with increased currentCurrent: blue shift with increased current
›› PWM: red shift with increased duty cycle PWM: red shift with increased duty cycle
For For AlInGaPAlInGaP LEDs,LEDs, the peak wavelength shifts are in the same direction for the twthe peak wavelength shifts are in the same direction for the two o dimming dimming schemes.schemes.
›› Current and PWM: red shift with increased current or duty cycle Current and PWM: red shift with increased current or duty cycle
PC white (blue): 447 nmRed: 646 nm, Green: 541 nm, Blue: 450 nm
CC - R CC - G CC - BCC - W PWM - R PWM - GPWM - B PWM - W
Manufacturer A Manufacturer B Manufacturer C
PC white (blue): 459 nmRed: 639 nmGreen: 525 nmBlue: 465 nm
PC white (blue): 460 nmRed: 644 nmGreen: 518 nmBlue: 455 nm
Y. Gu et al., SPIE 2006

53© 2008 Rensselaer Polytechnic Institute. All rights reserved.
Luminous Luminous EfficacyEfficacy
Luminous efficacy of a light source can be Luminous efficacy of a light source can be affected by several factors:affected by several factors:›› Radiant energy outputRadiant energy output
›› Power dissipated at the junctionPower dissipated at the junction
›› SPD change (wavelength shift)SPD change (wavelength shift)

54© 2008 Rensselaer Polytechnic Institute. All rights reserved.
Luminous Luminous EfficacyEfficacy ChangeChange
To create equal light output at dimmed levels, PWM demands To create equal light output at dimmed levels, PWM demands more power than current dimming.more power than current dimming.›› Efficacy is higher for current dimming at dimmed levels Efficacy is higher for current dimming at dimmed levels
0%
20%
40%
60%
80%
100%
0.0 0.3 0.6 0.9 1.2 1.5power (W)
rela
tive
light
out
put
0%
20%
40%
60%
80%
100%
0.0 0.3 0.6 0.9 1.2 1.5power (W)
rela
tive
light
out
put
CC - R CC - G
PWM - R PWM - G Y. Gu et al., SPIE 2006

55© 2008 Rensselaer Polytechnic Institute. All rights reserved.
Luminous Luminous EfficacyEfficacy ChangeChange
Luminous efficacy forLuminous efficacy for LEDsLEDs from manufacturer Bfrom manufacturer B›› At dimmed At dimmed levels,levels, efficacy is always higher for current dimming, for all efficacy is always higher for current dimming, for all
colors.colors.
Manufacturer B
0%
50%
100%
150%
200%
250%
300%
0% 20% 40% 60% 80% 100%current level/duty cycle
rela
tive
effia
cy
CC - R CC - GCC - B CC - WPWM - R PWM - GPWM - B PWM - W
Y. Gu et al., SPIE 2006

56© 2008 Rensselaer Polytechnic Institute. All rights reserved.
Luminous Luminous EfficacyEfficacy ChangeChange
Luminous efficacy @ 20% dimming level forLuminous efficacy @ 20% dimming level for LEDsLEDs from from manufacturer Bmanufacturer B
0%
50%
100%
150%
200%
B - CCR B - PWM
rela
tive
effic
acy
R G B W
Y. Gu et al., SPIE 2006
57© 2008 Rensselaer Polytechnic Institute. All rights reserved.
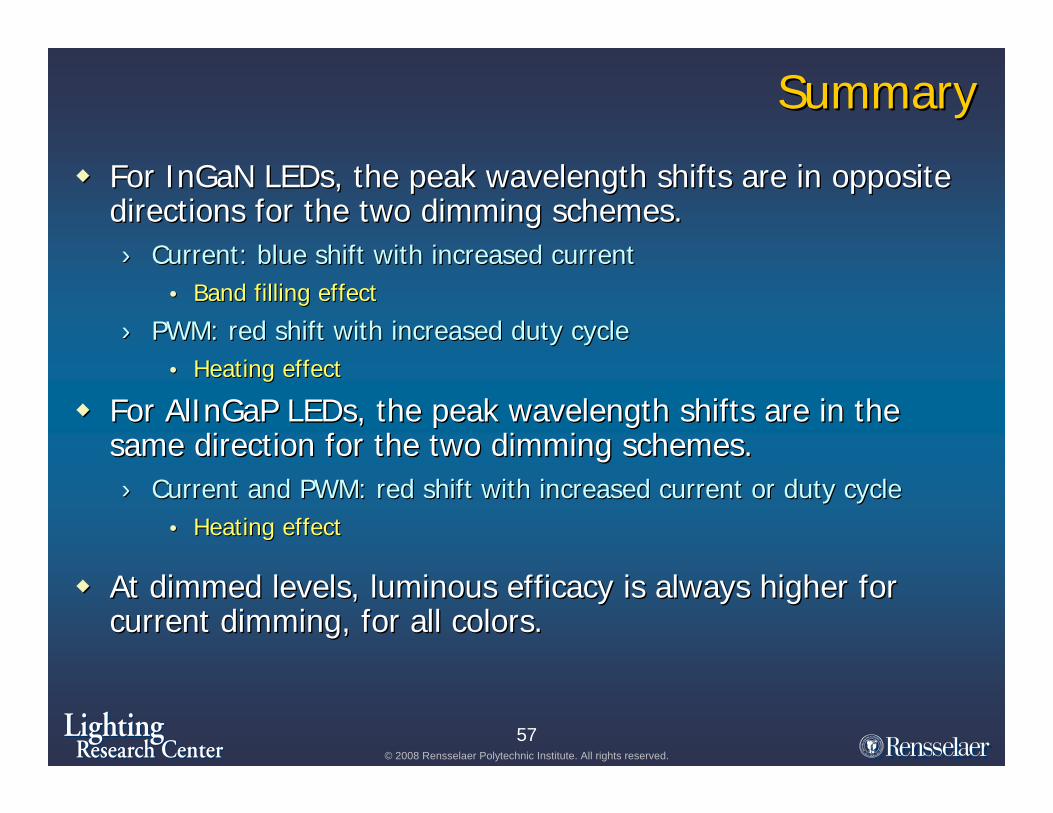
SummarySummary
ForFor InGaN InGaN LEDs,LEDs, the peak wavelength shifts are in opposite the peak wavelength shifts are in opposite directions for the two dimming schemes.directions for the two dimming schemes.›› Current: blue shift with increased currentCurrent: blue shift with increased current
•• Band filling effectBand filling effect
›› PWM: red shift with increased duty cycle PWM: red shift with increased duty cycle •• Heating effectHeating effect
For For AlInGaPAlInGaP LEDs,LEDs, the peak wavelength shifts are in the the peak wavelength shifts are in the same direction for the two dimming same direction for the two dimming schemes.schemes.›› Current and PWM: red shift with increased current or duty cycle Current and PWM: red shift with increased current or duty cycle
•• Heating effectHeating effect
At dimmed At dimmed levels,levels, luminous efficacy is always higher for luminous efficacy is always higher for current dimming, for all colors.current dimming, for all colors.

58© 2008 Rensselaer Polytechnic Institute. All rights reserved.
AcknowledgmentsAcknowledgments
LRC faculty, staffLRC faculty, staff, and students, and students
LRC program and project sponsorsLRC program and project sponsors
ASSIST Program SponsorsASSIST Program Sponsors

59© 2008 Rensselaer Polytechnic Institute. All rights reserved.

60© 2008 Rensselaer Polytechnic Institute. All rights reserved.
Thank YouThank You