shm for buildings - bridge & structure webpage wireless or wired? • long term application –...
TRANSCRIPT

1
SHM for BuildingsSHM for Buildings
Mita LabKeio University
1
Akira MitaKeio University
APSS July 27, 2010
Sensing, processing and prognosisSensing, processing and prognosis
Typhoon
Smart sensorsFOS
Analog, digitalfilters
Subspace methodARMAX
Mode parametersSignals
SVMNeural net
Dataacquisition
CleansingCuration
DiagnosisPrognosis
Systemidentification
Featureextraction
Mita LabKeio University
頭脳
Quake
Typhoon
DamageSnap!
2
A/D
PC
Sensor
Typical sensor configurationTypical sensor configuration
Mita LabKeio University
3
Long analog cables
・Many cables・Noise
・ Long and tedious installation labors
Experiment with analog sensorsExperiment with analog sensors
Mita LabKeio University
4
Experiments conducted at E-Defense6 storey RC building
892 sensors
Many sensor cables
Issues for sensor networksIssues for sensor networks
• Thousands of sensors are needed for large experiments.
• Wired sensor network requires cables as many as sensors.
• Digital sensor network is a good choice
Mita LabKeio University
5
• Digital sensor network is a good choice to reduce cables.
• However, it does not ensure time synchronization.
Digital sensor networkDigital sensor network
RouterData acquisition host
Mita LabKeio University
6
Wireless
Local sensor network
Wireless
Data acquisition hostRouter
2
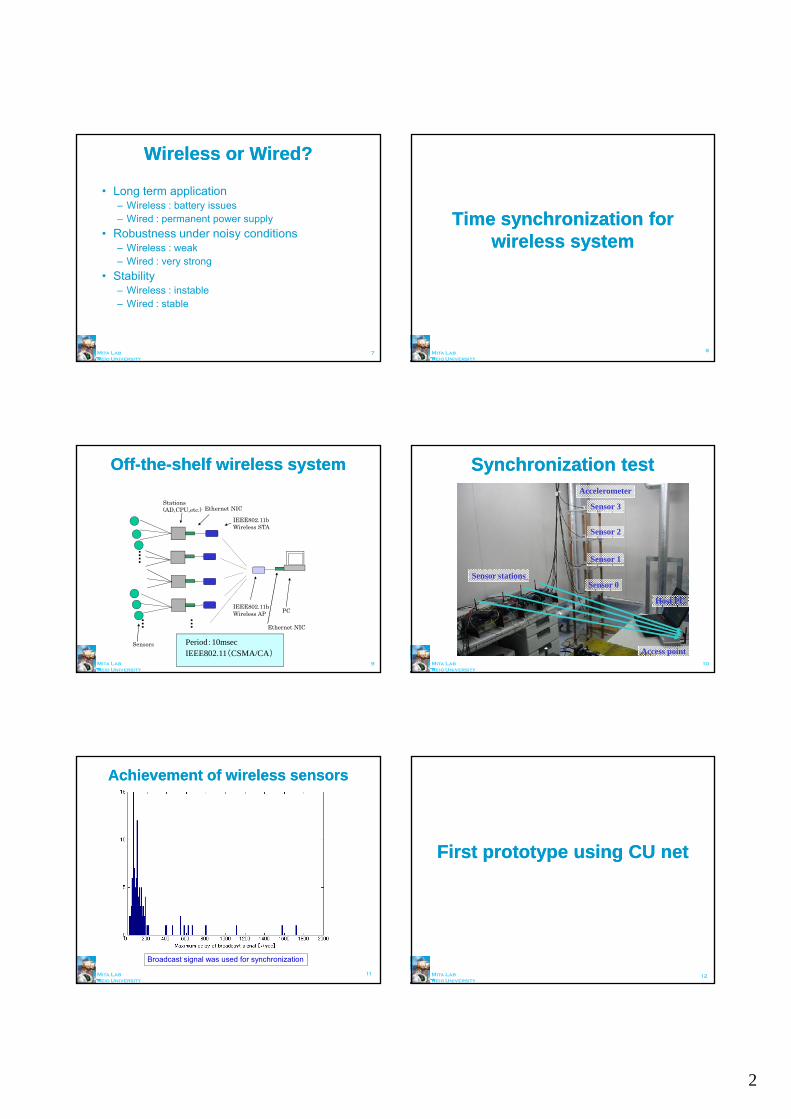
Wireless or Wired?Wireless or Wired?
• Long term application– Wireless : battery issues– Wired : permanent power supply
• Robustness under noisy conditionsWireless : weak
Mita LabKeio University
– Wireless : weak– Wired : very strong
• Stability– Wireless : instable– Wired : stable
7
Time synchronization for Time synchronization for wireless systemwireless system
Mita LabKeio University
yy
8
IEEE802.11bWireless STA
Ethernet NICStations(AD,CPU,etc.)
OffOff--thethe--shelf wireless systemshelf wireless system
Mita LabKeio University
9
IEEE802.11bWireless AP
Sensors
PC
Ethernet NIC
Period:10msecIEEE802.11(CSMA/CA)
Accelerometer
Sensor 1
Sensor 2
Sensor 3
Synchronization testSynchronization test
Mita LabKeio University
10
Sensor stationsSensor 0
Sensor 1
Access point
Host PC
Achievement of wireless sensorsAchievement of wireless sensors
Mita LabKeio University
11
Broadcast signal was used for synchronization
First prototype using CU netFirst prototype using CU net
Mita LabKeio University
12
3
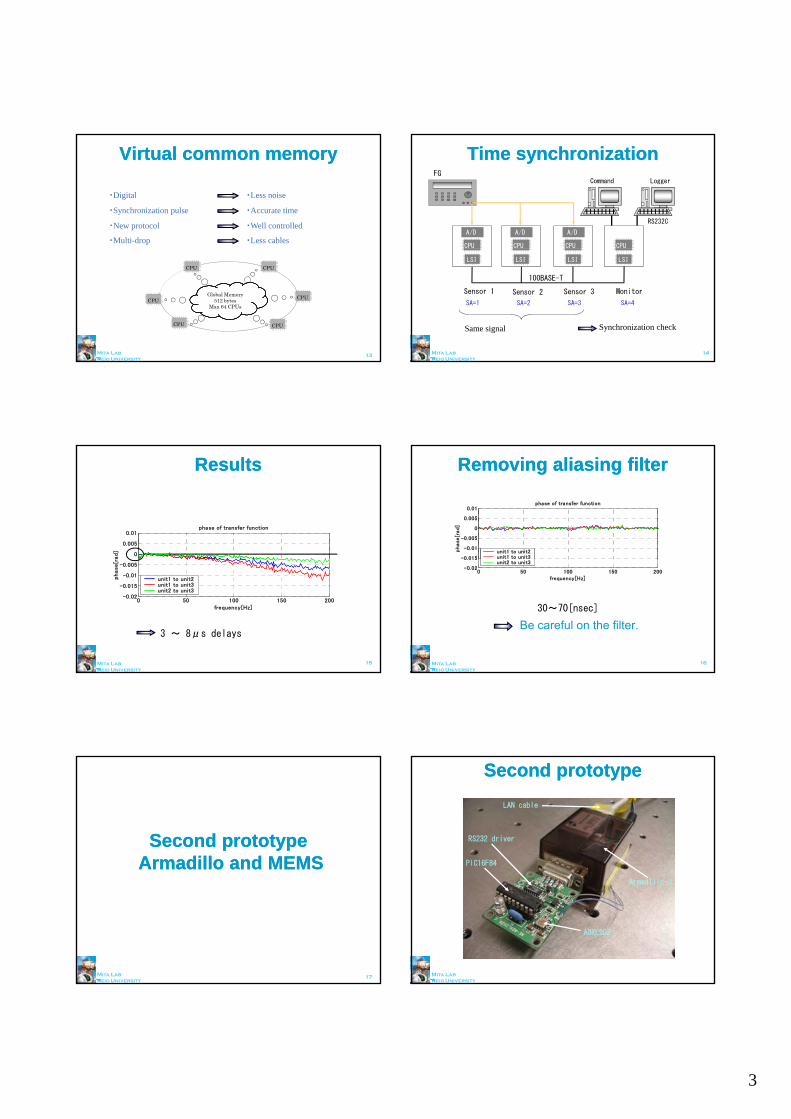
・New protocol
・Synchronization pulse
・Well controlled
・Accurate time
・Less cables・Multi-drop
・Digital ・Less noise
Virtual common memoryVirtual common memory
Mita LabKeio University
13
Global Memory512 bytes
Max 64 CPUs
CPU
CPU CPU
CPU
CPU
CPU
CommandFG
CPU
A/D
RS232C
CPUCPU
A/D
CPU
A/D
Logger
Time synchronizationTime synchronization
Mita LabKeio University
14
Sensor 1 Sensor 2 Sensor 3 Monitor
100BASE-T
LSI LSILSI LSI
SA=1 SA=2 SA=3 SA=4
Same signal Synchronization check
0
0.005
0.01phase of transfer function
ad]
ResultsResults
Mita LabKeio University
15
0 50 100 150 200-0.02
-0.015
-0.01
-0.005
frequency[Hz]
phase
[ra
unit1 to unit2unit1 to unit3unit2 to unit3
3 ~ 8μs delays
-0 015
-0.01
-0.005
0
0.005
0.01phase of transfer function
phase
[rad]
unit1 to unit2unit1 to unit3
Removing aliasing filterRemoving aliasing filter
Mita LabKeio University
16
Be careful on the filter.
30~70[nsec]
0 50 100 150 200-0.02
0.015
frequency[Hz]
unit2 to unit3
Second prototypeSecond prototypeArmadillo and MEMSArmadillo and MEMS
Mita LabKeio University
17
PIC16F84
RS232 driver
LAN cable
Second prototypeSecond prototype
Mita LabKeio University
Armadillo-J
ADXL202
4
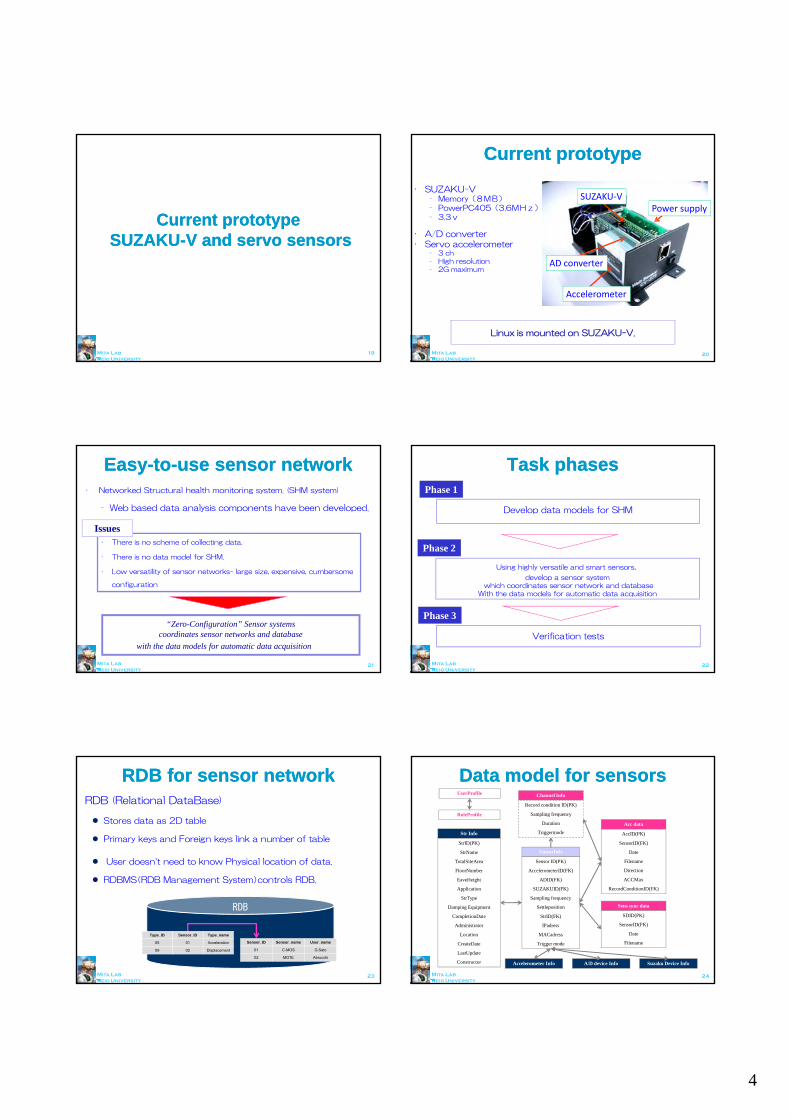
Current prototypeCurrent prototypeSUZAKUSUZAKU--V and servo sensorsV and servo sensors
Mita LabKeio University
19
• SUZAKU-V– Memory(8MB)– PowerPC405(3.6MHz)– 3.3v
• A/D converter• Servo accelerometer
SUZAKU‐VPower supply
Current prototypeCurrent prototype
Mita LabKeio University
Linux is mounted on SUZAKU-V.
– 3 ch– High resolution– 2G maximum
AD converter
Accelerometer
20
• Networked Structural health monitoring system. (SHM system)
– Web based data analysis components have been developed.
• There is no scheme of collecting data.
• There is no data model for SHM
Issues
EasyEasy--toto--use sensor networkuse sensor network
Mita LabKeio University
There is no data model for SHM.
• Low versatility of sensor networks- large size, expensive, cumbersome
configuration
“Zero-Configuration” Sensor systemscoordinates sensor networks and database
with the data models for automatic data acquisition
21
Develop data models for SHM
Phase 1
Phase 2
Task phasesTask phases
Mita LabKeio University
Using highly versatile and smart sensors,
develop a sensor systemwhich coordinates sensor network and database
With the data models for automatic data acquisition
Phase 3
Verification tests
22
RDB (Relational DataBase)
Stores data as 2D table
Primary keys and Foreign keys link a number of table
User doesn’t need to know Physical location of data.
RDB for sensor networkRDB for sensor network
Mita LabKeio University
RDB
Sensor_ID Sensor_name User_name
01 C-MOS G.Sato
02 MOTE Abrucchi
Type_ID Sensor_ID Type_name
05 01 Acceleration
09 02 Displacement
RDBMS(RDB Management System)controls RDB.
23
Str Info
StrID(PK)
StrName
TotalSiteArea
Fl N b
Acc data
AccID(PK)
SensorID(FK)
Date
Filename
Direction
SensorInfo
Sensor ID(PK)
A l t ID(FK)
Channel Info
Record condition ID(PK)
Sampling frequency
Duration
Triggermode
PK – Primary KEY
FK – Foreign KEY
UserProfile
RoleProfile
Data model for sensorsData model for sensors
Mita LabKeio University
FloorNumber
EaveHeight
Application
StrType
Damping Equipment
CompletionDate
Administrator
Location
CreateDate
LastUpdate
Constructor
Direction
ACCMax
RecordConditionID(FK)
AccelerometerID(FK)
ADID(FK)
SUZAKUID(FK)
Sampling frequency
Settleposition
StrID(FK)
IPadress
MACadress
Trigger mode
Accelerometer Info A/D device Info Suzaku Device Info
Sens sync data
SDID(PK)
SensorID(FK)
Date
Filename
24
5
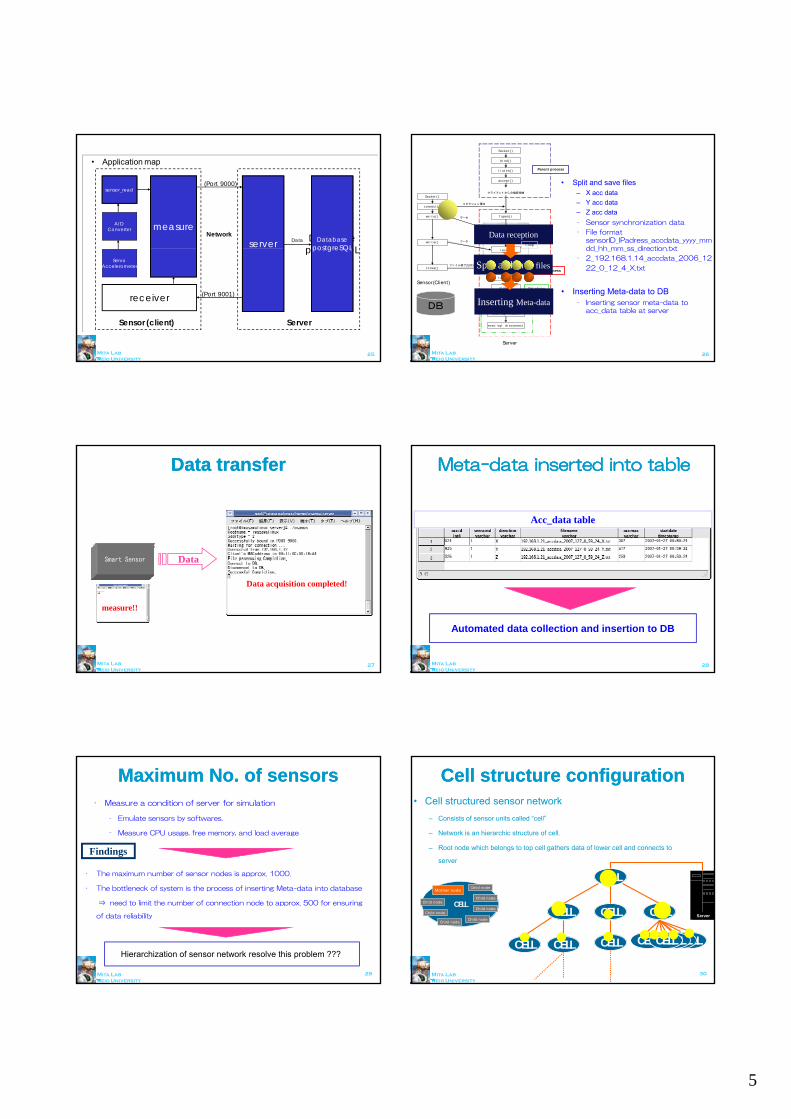
• Application map
measure
sensor_read
server
A/D Converter
(Port 9000)
Network DatabasepostgreSQL
Data
measure
server DatabasepostgreSQL
A/D Converter
sensor_read
Mita LabKeio University
ServoAccelerometer
receiver (Port 9001)
postgreSQL
Sensor (client) Server
postgreSQLServo
Accelerometer
25
• Split and save files– X acc data
– Y acc data
– Z acc data
– Sensor synchronization data
– File format sensorID_IPadress_accdata_yyyy_mmdd hh mm ss direction txt
Socket()
bind()
listen()
accept()
Socket()
connect()
recv()
write()
クライアント からの接続待機
コネクショ ン確立
fopen()
fprintf()write()
データ
データ
loop
Parent process
Data reception
Mita LabKeio University
dd_hh_mm_ss_direction.txt
– 2_192.168.1.14_accdata_2006_12
22_0_12_4_X.txt
• Inserting Meta-data to DB– Inserting sensor meta-data to
acc_data table at server
recv()
fprintf()
fclose()
close()
exec sql insert
exec sql connect
exec sql disconnect
close()
ファイル終了(EOF)通知
Child process
Database
process
Sensor(Client)
Server
Split and save files
Inserting Meta-dataDB
26
Smart Sensor Data
Data transferData transfer
Mita LabKeio University
Smart Sensor Data
measure!!
Data acquisition completed!
27
Acc_data table
MetaMeta--data inserted into tabledata inserted into table
Mita LabKeio University
Automated data collection and insertion to DB
28
Maximum No. of sensorsMaximum No. of sensors• Measure a condition of server for simulation
– Emulate sensors by softwares.
– Measure CPU usage, free memory, and load average
Findings
Mita LabKeio University
29
• The maximum number of sensor nodes is approx. 1000.
• The bottleneck of system is the process of inserting Meta-data into database
⇒ need to limit the number of connection node to approx. 500 for ensuring
of data reliability
Hierarchization of sensor network resolve this problem ???
Cell structure configurationCell structure configuration• Cell structured sensor network
– Consists of sensor units called “cell”
– Network is an hierarchic structure of cell.
– Root node which belongs to top cell gathers data of lower cell and connects to
server
Mita LabKeio University
30
ServerServer
CELL
CELL CELL CELL
CELL CELL CELLCELLCELLCELLCELL CELLCELLCELLCELL
Root
1st level
2nd level
CELL
Mother node
Child node
Child node
Child nodeChild node
Child node
Child node
Child node

6
010020030040050060070080090010005
10
15
20
25
30
the number of root nodes
Exe
cut
ion
Tim
e (
sec)
70
1000 nodes transmit 1-sec data
The execution time
decreases
The number of Root node decreases
Mita LabKeio University
31Smaller number of root nodes is preferred.
2 4 6 8 10 12 14 16 18 200
10
20
30
40
50
60
70
Execution time (sec)
Load
Ave
rage
1000nodes
500nodes100nodes50nodes
10nodes1node
Load decreas
e
31
Time synchronizationTime synchronization
Mita LabKeio University
32
Time synchronizationTime synchronization
• All sensors should have the same clock.
Mita LabKeio University
33
A5s.
B3s.
C10s.
A5s.
B5s.
C5s.
FeaturesFeatures
• Time synchronization of the sensor network is evaluated.
• Time synchronization system is implemented in real machine.
Mita LabKeio University
34
• About 10% of resources in FPGA were consumed by time synchronization system.
Implementation detailsImplementation details
• The A/D converter in the sensor node needs 1KHz timing signals.
• Small jitter of the 1KHz timing signals make better measurement.
Mita LabKeio University
35
• The 1KHz timing signals need under 10μs jitter.– 10μs jitter makes 1% jitter for the 1KHz
timing signals.
Cell structureCell structure
• Our sensor network consists of cells.
• Tree structure configuration
CellRoot
Mita LabKeio University
36
Cell
Cell Cell
Cell
Cell
Cell CellCellCellCellCellCellCellCell Cell
Root
1st level
2nd level

7
Hub connections for a cellHub connections for a cell
From: upper level cellUpper level cell port
Mother sensor node port
Child sensor node port
Mita LabKeio University
37
To: mother sensor node
To: child sensor node or lower level
cellSensor node
Transmission of time Transmission of time synchronization signalssynchronization signals
(4,5) lines in the cable is connectedto (7,8) lines in the cable.(7,8)
linesin the
From:the upper level cell
This is a hub.These are linesSensor network in this implementation
is a wired network by 100BASE-TX.2 f 4 i d li i th t 5 bl
The synchronization signals come from the upper level
The synchronization signals are input to the mother sensor node.In mother sensor node, time is synchronized by using the time synchronization signalsThe new time synchronization i l li f
Finally the new time synchronization signals are input to the child sensor nodes and lower level cells.In the child sensor nodes, time is
Mita LabKeio University
38
(4,5) linesIn the cable
(7,8)linesin thecable
(7,8)linesin thecable
(7,8)linesin thecable
(7,8)linesin thecable
(7,8)linesin thecable
(7,8)linesin thecable
cable
Themothersensornode
Thechild
sensornode
Thechild
sensornode
Thechild
sensornode To:
the lower level cells
2 of 4 paired lines in the category-5 cable arenot used in the 100BASE-TX network.The time synchronization signals were
transmitted in the 2 pair lines.
come from the upper level cell through lines 7&8 of
the cable.
using the time synchronization signals.The mother sensor node then generates new time synchronization signals.
signals are output to lines 4&5 of the cable.
Lines 4&5 of the cable join to lines 7&8 in the hub.
In the child sensor nodes, time is synchronized by using the new time synchronization signals.
Real machine environmentReal machine environment
• Modified commercial hubs and cables were used.
• RS-485 was used for time synchronization signal transmission
Mita LabKeio University
39
signal transmission.
• Maximum distance between nodes was 190m.
Hub Hub Hub
190m
Real machine resultReal machine result
• All sensor nodes were synchronized correctly.
• An ID and commands were transmitted correctly.
Mita LabKeio University
40
• Maximum jitter was 1.53μs .
Current SHM systemCurrent SHM system
Mita LabKeio University
41
Prototype SHM systemPrototype SHM system
TCP/IP
Diagnosis serverSystem ID
Diagnosis conditions
Building Mita lab servers User
Diagnosis results
Mita LabKeio University
Sensor gatewayCommunication with sensorsNTP severData converter
Data serverData baseWeb serverSensor interfaceSystem control
This system can automatically runfrom data acquisition to feature extraction.
Browse and control

8
Smart sensor unitSmart sensor unit
• Automatic operation– Communication with a server
– Measuring data
• Three timings to measure– Over trigger value
Set time
Mita LabKeio University
Power supply
Accelerometer
SUZAKU-V
A/D converter
– Set time
– Use command
• Command system– Trigger value
– Microtremor on/off
– Start anytime
x yz
Data modelData model
Measurement
ServerEvent
SensorAnalysisUser
Mita LabKeio University
BuildingAuth
It became possible to search necessary information quickly,and to analyze corresponding to various buildings.
Data flowData flow
Smart sensor
cv_read cv_read new_environment SHMDB
Store
Add metadata
To decimal
Mita Laboratory
Add metadata
Metadata.xmlMeas_data.txt
Database registration
Data ServerSensor gateway
Mita LabKeio University
/media/HD-PSU/raw_datarsync
A/D converter
Sensor
Signal
To physical
Synchronization
Diagnosis Server
The user does not need to insert the relevant metadata for each measurement.
/media/HD-PSU/edit_data /media/HD-PSU/edit_data
KK--SHM consortiumSHM consortium
• 14 companies are supporting the consortium based at Keio U. starting from FY2008 for three years.
• Smart sensor network is used as an
Mita LabKeio University
46
infrastructure for this SHM
• Companies include largest design firms and many construction companies.
• The system will be available as a commercial product soon.
Application to real structuresApplication to real structures
Name A building B building C building D building
No. of story 6 story 11 story 3 story 14 story
Mita LabKeio University
Sensor 1 - 11th floor - 14th floor
Sensor 2 5th floor 1st floorseismic isolator
1st floor
Installation date
Nov. 9, 2009 Feb. 5, 2010 Apr. 7, 2010 Apr. 21, 2010
Application to real structures (1/4)Application to real structures (1/4)
• A building– S structure (6-story)
– Seismic isolated building
– 2009/11/09~
Mita LabKeio University
– 1 sensor (5th floor)
– 14 seismic data were acquired

9
Application to real structures (2/4)Application to real structures (2/4)
• B building– SRC structure (11-story)
– 2010/02/05~
– 2 sensors (1st, 11th floor)
Mita LabKeio University
– 2 seismic data were acquired
Application to real structures (3/4)Application to real structures (3/4)
• C building– RC structure (3-story)
– Seismic isolated building
2010/0 /0
Mita LabKeio University
– 2010/04/07~
– 1 sensor (seismic isolator)
– 1 seismic data was acquired
Application to real structures (4/4)Application to real structures (4/4)
• D building– S structure (14-story)
– Damping system
– 2010/04/21~
Mita LabKeio University
– 2 sensors (1st, 14th
floor)
– 2 seismic data were acquired
– mobile data transfer system
Database and data Database and data managementmanagement
Mita LabKeio University
gg
52
EDgridEDgrid for Efor E--DefenseDefense
Firewall
Internet
RHL4(64bit)
EDgrid Central
Grid Auth
mysql
RHL4(64bit)
EDgrid Central
Grid Auth
mysql
RHL4(64bit)
EDgrid Centraledcentral0 edcentral1 edcentral2
RHL4(32bit)
EDgrid pop(NEESpop)edgrid
RDV
mysql
開発マシンホットスタンバイ(EDgrid Central)
EDgrid アーキテクチャ2006.12
開発マシン
Mita LabKeio University
Firewall RHL4(64bit) RHL4(64bit) RHL4(64bit)RHL4(32bit)
RHL4(64bit)
DNS/Maildns
DNS
RHL4(32bit)
backup
RHL4(64bit)
Repositorystorage
Repository
PostgreSQL
Windows(32bit)
Data inputClientTerminal
Converter
RHL4(64bit)
TelepresenceServervideo
RBNB
mysql
flexTPS
RHL4(64bit)
RBNB
mysql
flexTPS
video0
負荷分散Telepresence Server
開発マシンhttps で接続
NFS
ntp
53
sensor
sensor
sensorsensor
sensorsensor
Sensor gridDamage data, please!
Here you are.This is easy to understand, right?
Give me data!
What is this?Current system
Smarter way for SHMSmarter way for SHM
Mita LabKeio University
54
sensorsensor sensor
sensor
sensor
sensor
sensorsensor
sensor sensor
sensorsensor
targetLab.Smart sensor network can understand what you want!

10
Our current research focusOur current research focusBioficationBiofication of living spacesof living spaces
Mita LabKeio University
g pg p
55
Adaptive buildingsAdaptive buildings
Mita LabKeio University
Sensory adaption• Air conditioning• Lighting• Water supply• Parking system
Adaption by learning• Automatic switch
for TV• Air conditioning fit
to residents• Pattern control for
lighting
Physiological adaption• Adaptive to family
members• Adaptive to
elderly people• Adaptive to
season s• Security based on
immune system
Evolutionary adaption• Creation of new
living space that is different from LDK system
• Portable and flexible space design
56
Major functions for Major functions for bioficationbioficationSensors• Acquisition of environmental
information• Sensory adaption
Brain• Centralized control system• Adaption by learning
Mita LabKeio University
Immune system• Distributed intelligence• Physiological adaption
DNA• Creation of next generation• Evolutionary adaption
57
ee--puckpuckEcole Polytechnique Fédérale de Lausanne as collaboration between the Autonomous Systems Lab, the Swarm-Intelligent Systems group and the Laboratory of Intelligent System
Specifications
Mita LabKeio University
58
Micropohone×3Bluetooth commnication
xy
z VGA camera(640×480)3-axis accelerometerProcimity sensor×8
Specifications
Robot 1 for Robot 1 for bioficationbiofication
Mita LabKeio University
59
Robot 2 for Robot 2 for bioficationbiofication
Mita LabKeio University
60

11
Teach B,C,D positions
Instruct B,C,DA person has entered!
Step 1: Collaboration
Step 2: Monitoring environmental change
Step 3: DNA for next generation
Acquisition of environmental Acquisition of environmental data using multiple robotsdata using multiple robots
Mita LabKeio University
C B
A D
C B
A D
Furniture has moved!
CB
AD
Record important InformationAs
“Spatial DNA”
61
SummarySummary
• Smart sensors have been developed and are currently under feasibility study.
• An SHM platform has been completed and is currently under test with many companies.
• Data management is most important
Mita LabKeio University
62
• Data management is most important.
• The system will be jointly used with sensor agent robots.
• Biofication of living spaces is a natural evolution of SHM.