shire of yilgarn long term financial plan 2013 – · pdf fileshire of yilgarn long term...
TRANSCRIPT

Shire of YilgarnLong Term Financial Plan 2013 – 2023
www.yilgarn.wa.gov.au

LONG TERM FINANCIAL PLAN 2013-14 to 2022-23
The Shire of Yilgarn thank and acknowledge that the WA Departments of Local Government and Regional Development and Lands for providing skills development and funding to support the research and development for this Long Term Financial Plan 2013 – 2023.
Prepared for the Shire of Yilgarn by Bob Waddell Local Government Consultant June 2013

Page 1 Shire of Yilgarn
Long Term Financial Plan
Contents
PURPOSE OF THE PLAN ........................................................................................................................................................... 2
KEY STATISTICS .......................................................................................................................................................................... 2
COUNCIL INFORMATION ......................................................................................................................................................... 3
OUR COMMUNITY ....................................................................................................................................................................... 3
OUR SERVICES .............................................................................................................................................................................. 4
SERVICE DELIVERY .................................................................................................................................................................... 5
ASSET MANAGEMENT .............................................................................................................................................................. 5
FINANCIAL STRATEGIES AND PRINCIPLES .................................................................................................................... 6
WORKFORCE PLANNING STRATEGIES ............................................................................................................................ 7
SCENARIO MODELLING AND SENSITIVITY ANALYSIS .............................................................................................. 8
KEY ASSUMPTIONS UNDERPINNING THE LONG TERM FINANCIAL PLAN. .................................................... 9
MEASURING SUSTAINABILITY. ......................................................................................................................................... 10
RISK ASSESSMENT .................................................................................................................................................................. 11
FINANCIAL PROJECTIONS ................................................................................................................................................... 12
CONCLUSION - IMPLEMENTATION AND REVIEW OF THE LTFP ...................................................................... 13

Page 2 Shire of Yilgarn
Long Term Financial Plan
Purpose of the Plan
The Shire of Yilgarn’s Long Term Financial Plan (LTFP) details what the Council proposes to do over the next ten years as a means of ensuring the Shire’s financial sustainability. It is aligned to other core planning documents by which Council is accountable to the community including the Strategic Community Plan and the Corporate Business Plan. Information contained in other strategic plans including the Workforce Plan, Asset Management Plan and Forward Capital Works Plan have informed the LTFP. Financial information has been extracted from the LTFP for inclusion in the Corporate Business Plan which will be the basis for preparation of the Shire’s Annual Budgets.
The LTFP is a dynamic tool which analyses financial trends over a ten year period on a range of assumptions and provides the Shire with information to assess resourcing requirements to achieve its strategic objectives and assists the Shire to ensure its future financial sustainability.
The LTFP covers the period 2013-14 to 2022-23. There is a high level of accuracy and detail in the first 3 years of the LTFP but this is underpinned by a number of assumptions. The remaining seven years of the LTFP are shown as an overview with reasonable estimates only. The Shire undertakes a broad review of its Strategic Community Plan every two years and a full review is planned every four years. This LTFP will be reviewed in conjunction with Strategic Community Plan reviews. As Annual Budgets are developed from the LTFP there may be some annual variations between both which will be explained in the Annual Budget.
Key Statistics
The following table provides a snapshot of the Shire of Yilgarn at 2012-13:
Distance from Perth (km) 370
Area (sq km) 30,720
Population (est) 1,636
Number of Electors 845
Number of Dwellings 809
Total Rates Levied $4,051,167
Total Revenue $11,619,470
Number of Employees (Full Time Equivalents) 35
Page 3 Shire of Yilgarn
Long Term Financial Plan
Council Information
Yilgarn is located 370 km east of Perth in the heart of the Eastern Wheatbelt and is well known as the Gateway between the Wheatbelt and the Goldfields.
The name ‘Yilgarn’ is aboriginal for ‘white stone’ or ‘quartz’.
The town of Southern Cross is the main centre, and houses the administration of the Shire, however, there are numerous other smaller townsites throughout the Shire, including, Bodallin, Bullfinch, Ghooli, Koolyanobbing, Marvel Loch, Moorine Rock, Mt Hampton and Yellowdine.
In 1891, the Yilgarn Road Board was gazetted, and in 1918, it merged with the Municipality of Southern Cross. In 1961 it became the Shire of Yilgarn following changes to the Local Government Act 1960.
The Shire provides roads, recreational facilities, funding for medical services, parks and gardens, street lighting, and waste collection amongst other community services and infrastructure. Our elected members advocate for the interests of the community and make decisions about where and how development can occur.
Agricultural production and a continual increase in mining activities are the main primary industries for the Shire. Mining employees make up an increasing percentage of the local workforce.
Distance to Perth and the regional centres of Kalgoorlie and Merredin is one of our biggest challenges and this challenge is often at the forefront of decisions our Council makes on behalf of our community.
Our Community
The Shire has a population of approximately 1,600. Forecast population in the LTFP is expected to remain constant which is contrary to the WA Planning Commission (WAPC) Band C (WA Tomorrow) predictions. Council and management feel strongly that the Shire’s population will go against the WAPC prediction of a decline in population. The Shire’s very strong financial position will enable it to provide new and improved amenities to existing and future residents of the Shire. This will help retain and attract residents to the locality.
According to the 2011 Census with the Australian Bureau of Statistics the population comprises approximately 61.6% males and 38.4% females with the median age being 38 years.
The community of the Shire is a diverse one which brings with it challenges. The retention of youth and families are challenging areas for the Shire. These challenges are targeted in this LTFP.

Page 4 Shire of Yilgarn
Long Term Financial Plan
Our Services
The Shire of Yilgarn provides an extensive range of services to the community which fall into the following programs prescribed under the Local Government (Financial Management) Regulations 1996. Estimates of expenditure and income have been calculated for each of these programs in this LTFP:
Governance – relates to the support of members of Council (Councillors) and administration and operation of services and facilities to support the Council’s function.
General Purpose Funding – expenses and income associated with levying and collecting rates, general purpose grants and interest from investments.
Law, Order and Public Safety – covers expenses and income principally associated with the administration and implementation of various local laws, animal control (licensing and enforcement), fire prevention and emergency services.
Health – operation of child health clinic, support of medical services, monitoring of food quality, licensing of food premises and pest control measures (mosquito control).
Education and Welfare – operation of senior citizens centre, day care centres and pre-school facilities; assistance to playgroups, homes for the aged and other voluntary services.
Housing – control and maintenance of staff housing as well as commercially rented dwellings.
Community Amenities – principally covers rubbish collection services, operation of refuse disposal sites, noise control, administration of the Town Planning Scheme, maintenance of cemeteries, maintenance of rest centre and storm water drainage maintenance, operation and maintenance of sewerage schemes.
Recreation and Culture – maintenance of halls, the aquatic centre, recreation centres and various reserves; operation of the library.
Transport – construction and maintenance of streets, roads, bridges, parking areas and footpaths including street cleaning and lighting of streets. Costs associated with operation of the works depot and maintenance of the airstrip are also included.
Economic Services – The regulation and provision of tourism, area promotion, building control, noxious weeds, vermin control and standpipes.
Other Property and Services – private works undertaken by the Shire and operating and maintenance costs of the Shire’s plant and equipment used in maintenance and construction works. Any other unclassified services are included in this program.

Page 5 Shire of Yilgarn
Long Term Financial Plan
Service Delivery
It is proposed that existing service levels will be maintained for all operational areas in the short term, however, a key objective in the Corporate Business Plan which directly impacts future service delivery is to improve existing service levels in the longer term whilst striving to achieve annual operating surpluses each year to fund the provision of infrastructure.
Service levels will be reviewed from time to time when future reviews of the LTFP are undertaken and the impact of any growth across the municipality can be monitored and assessed.
Asset Management
The Shire has developed a strategic approach to asset management and developed asset management plans based on total life cycle of assets. The Asset Management Plan will assist the Council in predicting infrastructure consumption and asset renewal needs and identifies the cost required to renew or reserve the asset (renewal gap). This renewal gap is being addressed in the LTFP and will be the focus of future annual budgets.
Funding for the renewal of assets has been increased to ensure sustainability in the longer term. The continued allocation of funding towards the renewal of assets and funding for maintenance and upgrades will result in a positive investment for the community in the future. Asset acquisitions and capital works projects are funded from rate revenue, specific cash reserves, sales of existing assets or government grants.

Page 6 Shire of Yilgarn
Long Term Financial Plan
Financial Strategies and Principles
Rate Increases
There is not expected to be much population growth in the Shire so little increase demand for services are expected. There is however, expected to be a need for additional funds for the operations, maintenance, renewal, upgrade and expansion of Council’s assets over the long term. Levying rate increases at or below CPI is unsustainable in the long term and in the LTFP the Council has determined that rate increases would be based on 9.0% for year 1 and 6.0% for the remaining 9 years of the plan. These increases are significantly higher than the CPI figure if 2.5% used in LTFP. It is not envisaged that the rate base will grow over the term of the LTFP.
Budget Surpluses
The Council believes that adopting a balance budget each year will not improve its financial sustainability or liquidity and will include an increasing budget surplus each year so that by 2022-23 it is estimated that the budget surplus will be $64k.
Cost Recovery of Services
Discretionary fees and charges are planned to be increased by CPI to match estimated additional costs in service delivery. The Shire does not recover the full cost of providing all services but is working towards full cost recovery for all services.
Applications fees for building licences and planning and development approvals are limited by regulations preventing the full cost recovery of these services.
Prudent Use of Debt Finance
The Shire has no debt at the commencement of the LTFP and does not propose to use debt funding in the future for large non-recurrent capital works projects. The Shire will continue to have excellent levels of debt to revenue and a strong capacity to repay debt should the need to borrow arise.
Cash Reserves
Cash Reserves are also maintained by the Shire to ease the impact of future capital expenditures in any one year. The principal capital purpose cash reserves are:
Airport Reserve Building Reserve Community Bus Reserve Homes fro the Aged Reserve Land Development Reserve Long Service Leave Reserve Mt Hampton/Dulyalbin Water Supply Reserve Museum Reserve Plant Replacement Reserve Recreation Facility Reserve Refuse Disposal Sewerage Reserve Health Services Reserve Youth Development Reserve ICT and Furniture & Equipment Reserve

Page 7 Shire of Yilgarn
Long Term Financial Plan
Reserve funds utilised over the life of the Plan are detailed below:
$320,000 from the Recreation Facility Reserve in 2014-15 towards the upgrade of the swimming pool facilities and change rooms.
$110,500 from the Community Bus Reserve in 2017-18 towards the replacement of the community bus.
Funds will be utilised from the Plant Reserve over the life of the LTFP. Funds are transferred from this reserve if the total net changeover of plant and vehicles is greater than a set threshold for that year. The threshold is set at $550,000 at the commencement of the Plan. This threshold is increased by CPI over the life of the Plan. Funds are transferred to this reserve if the net changeover is less than the threshold for that year.
Funds will also be utilised from the ICT and Furniture & Equipment Reserve over the life of the LTFP. Funds are transferred from this reserve if the net capital purchases of ICT and Furniture & Equipment is greater than a set threshold for that year. The threshold is set at $25,000 at the commencement of the Plan. This threshold is increased by CPI over the life of the Plan. Funds are transferred to this reserve if the net capital purchases are less than the threshold for that year.
All cash reserves attract interest earnings which are re-invested in the applicable reserve. Over the life of the LTFP the cash reserves are projected to increase from $3.59m to $13.13m.
Grant Funding
The Shire will continue to pursue grant funding for strategic capital works from the State and Federal Government.
Workforce Planning Strategies
The Workforce Plan proposes that net staff levels will remain unchanged in line with current service provision levels. Increasing legislative requirements associated with Integrated Strategic Planning are expected to be absorbed within existing Staff numbers. The Workforce Plan proposes building our leadership capability and putting in place a robust framework so that that we have the necessary skills to deliver the required level of service now and into the future.

Page 8 Shire of Yilgarn
Long Term Financial Plan
Scenario Modelling and Sensitivity Analysis
A couple of scenarios were developed using slightly different assumptions and changes in variables to determine how capable the Shire is to deliver services and assets to the community. Of the two scenarios, scenario one was adopted by Council which is considered the most beneficial to achieve required service delivery levels and outcomes of the Strategic Community Plan and Corporate Business Plan.
Scenario 1 (Adopted)
An initial scenario (and detailed in statements and schedules attached) was developed based on no growth in population, no change in service levels, a 9% rate increase in 13-14 and 6% rate increases each year thereafter, a small increasing surplus budget for the life of the LTFP, other operating income based on the assumptions adopted in the plan, operating expenditure based on assumptions adopted in this plan, Council funded capital expenditure on buildings increasing in 2015-16 by approximately $400,00 and being maintained at this level plus CPI, Council funded capital expenditure on road renewal increased in 2016/17 by $250,000 and being maintained at this level plus CPI, transfers to reserves used to balance the LTFP in years where a significant surplus eventuated.
Scenario 2
An second scenario was developed based on no growth in population, no change in service levels, a 9% rate increase in 13-14 and 4% rate increases each year thereafter, a small surplus budget for the life of the LTFP, other operating income based on the assumptions adopted in the plan, operating expenditure based on assumptions adopted in this plan, Council funded capital expenditure on buildings increasing in 2015-16 by approximately $400,00 and being maintained at this level plus CPI except for 2018-19 where expenditure was reduced by $200,000 as a one off, Council funded capital expenditure on road renewal increased in 2016/17 by $250,000 and being maintained at this level plus CPI, transfers to/from reserves used to balance the LTFP in years where a significant surplus/deficit eventuated.
The following table highlights variances in results over the term of the LTFP:
Scenario 1 Scenario 2 Difference
Rate Income Over 10 Years 61,902,343 56,647,781 5,254,562
Cash Reserve Balances Over 10 Years 13,133,530 7,292,410 5,841,120
Interest Earnings on Reserves over 10 years 2,509,085 1,917,904 591,181
Average Current Ratio 1.33 1.12 .21
Average Operating Surplus Ratio 5.17% -1.44% 6.61%
Average Rates Coverage Ratio 50.02% 48.23% 1.79%
Average Own Source Revenue Coverage Ratio 76.52% 70.69% 5.83%
The most sensitive criterion in the adopted model is a variation in the level of proposed rate increases. The result of a 2% reduction in rates (to those proposed) over the life of the LTFP is highlighted in the table above.
Page 9 Shire of Yilgarn
Long Term Financial Plan
Key Assumptions Underpinning the Long Term Financial
Plan
The estimates in the LTFP are based on a number of assumptions and Council strategies. The base point for the modelling is the adopted 2012-13 budget (adjusted for variations) and assumptions have been applied to the model. The assumptions are:
Existing service levels will be maintained with a view to improvement in the longer term
Annual operating surpluses will be strived for and achieved over the term of the LTFP
Staff levels will remain unchanged over the life of the Plan as Shire demographics’ not expected to change over the life of the LTFP
CPI will be 2.5% per annum for the term of the LTFP
Employees wages will increase at 5% for 2013-14 and 4% for the remaining nine years of the LTFP
Rate increases will be 9.00% for 2013-14 and 6% per annum for the remaining nine years of the LTFP. These increases will be used to ensure Council’s rating base is at a the benchmark level of the Rates Coverage Ration benchmark of 40% or greater
The rate base will not increase over the life of the LTFP
Discretionary fees and charges will increase by CPI
Interest rates for new borrowings will be in line with indicative prices issued by WATC in May 2013 which progressively increase from 2.93% in 2013 to 3.86% in 2023
Interest rates for invested funds will be 4.50% over the life of the LTFP
Roads to Recovery funding will continue until 2022-23
Royalties for Regions funding will cease in 2012-13
Local Roads Financial Assistance Grants will increase by CPI over the life of the LTFP
General Purpose Financial Assistance Grants will increase by 10% for the full term of the LTFP. These increments are in line with guidance provided by the grants commission taking into account the new calculation methodology for Financial Assistance Grants
Other government grants have been included and incremented in the LTFP on a line by line basis
Materials and contracts will increase by CPI
Utility charges will increase by CPI plus 2% over the life of the LTFP to reflect a continuation of recent increases in energy and water costs
The shire’s expenditure on renewal of road infrastructure from its own sources will increase by CPI over the term of the LTFP. There will be additional funds spent on renewal of road infrastructure from 2016-17 for the remainder of the term of the LTFP
The Shire’s expenditure on renewal and replacement of buildings from its own sources will be maintained and increased by CPI over the term of the LTFP
Cash reserves will continue to be maintained and increased to fund future commitments

Page 10 Shire of Yilgarn
Long Term Financial Plan
Measuring Sustainability
Several statutory key performance indicators (KPIs) have been prescribed in the Local Government (Financial Management) Regulations 1996 to measure the financial sustainability of local governments. The LTFP has been assessed against these KPIs and will be compared with KPIs measured from the Annual Financial Statements to provide clear targets for the Shire to report its progress to the community each year.
The KPIs, target rates and results measured from the LTFP are tabled below:
Explanations for the ratios in the above table is provided for the understanding of the reader:
Current Ratio
This is a measure of a local government’s liquidity and its ability to meet its short term financial obligations out of unrestricted current assets. It is measured as:
Current Assets less Restricted Assets Current Liabilities less Current Liabilities associated with Restricted Assets
Target – greater than or equal to 1 : 1
Operating Surplus Ratio
This is an indicator of the extent to which revenues raised cover operational expenses only or are available for capital funding purposes. This is measured as:
Operating Revenue less Operating Expense Own Source Operating Revenue
Target – between 0% and 15%
Rates Coverage Ratio
This is an indicator of a local government’s ability to cover its costs through its own revenue efforts. This is measured as:
Net Rate Revenue Operating Revenue
Target – greater than or equal to 40%
KPI Target Year 1 Year 10 Average
Current Ratio 1 : 1 1.12 1.56 1.33
Operating Surplus Ratio 0% - 15% -29.60% 24.16% 5.17%
Rates Coverage Ratio >= 40% 44.92% 52.66% 50.02%
Debt Service Ratio < 0.08 N/A N/A N/A
Asset Sustainability Ratio 90% - 100% 83.77% 95.57% 94.39%
Asset Consumption Ratio 50% - 75% 61.53% 52.63% 56.55%
Growth in Cash Reserves 5% -16.85% 25.51% 7.27%

Page 11 Shire of Yilgarn
Long Term Financial Plan
Debt Service Ratio
This is an indicator of a local government’s ability to produce enough cash to cover its debt payments. This is measured as:
Debt Service Cost (Principal and Interest) Available Operating Revenue
Target – less than 0.08
Asset Sustainability Ratio
This is an indicator of the extent to which assets managed by a local government are being replaced as they reach the end of their useful lives. This is measured as:
Capital Renewal and Replacement Expenditure Depreciation Expense
Target – greater than 90%
Asset Consumption Ratio
This ratio highlights the aged condition of a local governments physical assets. This is measured as:
Depreciated Replacement Cost of Assets (Written Down Value) Current Replacement Cost
Target – greater than 50%
Risk Assessment
The Asset Management Plan identifies assets that are critical to the Shire’s operations and outlines risk management strategies for these.
The ability of the Shire to levy Rates with the prescribed increases in the LTFP is a clear risk. Ratepayer pressure on Council may influence the ability for this LTFP to be implemented. Strong adherence to the LTFP assumptions in relation to rating is required to ensure the desired financial outcome is achieved. The risk associated with this is moderate.
The major risks associated with long term financial planning relate to delays in approvals for major projects, the viability of a project if it relies on land acquisition which may be affected by land price movements and funding of projects.
A number of new building projects are included each year in the LTFP. All of these are proposed to be constructed on land owned by the Shire or Crown Land managed by the Shire. The developments will not require external approvals and are being funded through rate revenues, reserve funds and/or grant funding. The risk associated with these is therefore low.
The Shire has an extensive road renewal program which includes some external funding. If that funding reduces or is not made available to the Shire, then the timing of the works will be reviewed.
Interest rates on borrowings and on investments are predicted to be relatively constant over the life of the LTFP. If adverse changes in rates occur this may impact on the Shire’s revenues and future project costs if it decides to borrow.. The risk is considered low.
No other risks have been identified.

Page 12 Shire of Yilgarn
Long Term Financial Plan
Financial Projections
The financial projections in this LTFP have been developed in a format that conforms to the Local Government (Financial Management) Regulations 1996 and Australian Accounting Standards. This format has been chosen as it allows projections to feed into the statutory format of the Annual Budget and key performance measures in the LTFP to be compared with Annual Financial Reports. The Statutory statements include:
Forecast Statement of Comprehensive Income By Nature & Type Forecast Statement of Comprehensive Income By Program Forecast Statement of Financial Position (Balance Sheet) Forecast Statement of Changes in Equity Forecast Statement of Cash Flows Forecast Statement of Funding (Rate Setting)
The Forecast Statement of Comprehensive Income shows what is expected to happen during the year in terms of revenue, expenses and other adjustments from all activities. A surplus is estimated for each year of the LTFP.
The Forecast Statement of Financial Position is a snap-shot of the expected financial position of the Shire at the end of the financial year. It reports what is expected to be owned (assets) and what is expected to be owed (liabilities). The bottom line “Net Assets” represents the net worth of the Council. The assets and liabilities are separated into current and non-current. Current means those assets or liabilities which will fall due in the next 12 months. Non-current refers to assets and liabilities that are recoverable or which fall due over a longer period than 12 months.
The Forecast Statement of Changes in Equity shows the composition of Equity and the movements within Equity and the Statement of Comprehensive Income. The three sections of this statement are the Retained Surplus, Cash Backed Reserves and Asset Revaluation Reserves.
The Forecast Statement of Cash Flows shows what is expected to happen during the year in terms of cash. The net cash provided by operating activities shows how much cash is expected to remain after paying for the services provided to the community. This can be used to fund other activities such as capital works and infrastructure. The information in this statement assists in the assessment of the ability to generate cash flows and meet financial commitments as they fall due, including debt repayments.
The format of the Forecast Statement of Funding (Rate Setting Statement) varies from the format of the statement prepared in Annual Budgets. In Annual Budgets, the bottom line of the statement is the amount to be made up from rates. In the LTFP, rates assessed in accordance with relevant assumptions has been shown as a revenue stream with all other sources of revenue, so that if a surplus results, this can be used to fund other services. However, where a shortfall results, this indicates that the Council is unable to fund the services proposed at the planned rating levels and may need to defer works or services, increase debt or increase rates even further to cover the cost of planned service provision. In the LTFP the Forecast Statement of Funding shows the accumulated surplus carried forward at the end of each year.
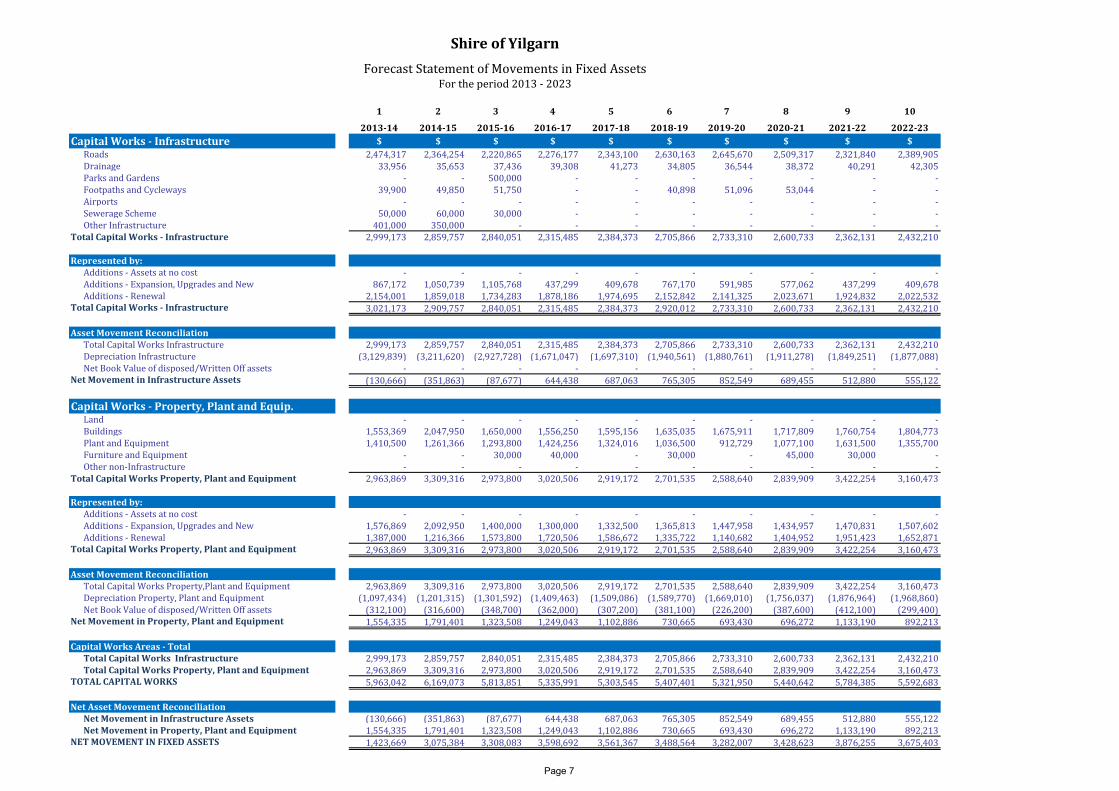
The statements are supported by the following:
Forecast Statement of Movements in Fixed Assets Forecast Ratio Analysis Forecast Cash Reserves Property, Plant and Equipment Capital Expenditure 10 Year Plant Replacement Program 10 Year ICT / Furniture & Equipment Program Details of Infrastructure Capital Expenditure

Page 13 Shire of Yilgarn
Long Term Financial Plan
Conclusion - Implementation and Review of the LTFP
The Council will consider the content of the LTFP when preparing the Annual Budget for 2013-14 and subsequent years and it is expected that adopted budgets will be closely aligned with the proposals in the LTFP and assumptions underpinning this.
Some minor review of the LTFP will occur each year as budgets are prepared to account for performance information and changing circumstances. However, a detailed desktop review is planned for 2014-15 and a full review will be undertaken in 2017-18 in conjunction with formal reviews of the Strategic Community Plan.
The Council is confident that the LTFP will allow the Shire to set priorities within its resourcing capabilities to sustainably deliver the assets and services required by the community.

Page 14 Shire of Yilgarn
Long Term Financial Plan
LONG TERM FINANCIAL PLAN
Statements and Supporting Schedules
TABLE OF CONTENTS
FORECAST STATEMENT OF COMPREHENSIVE INCOME BY NATURE & TYPE ............................................ 1
FORECAST STATEMENT OF COMPREHENSIVE INCOME BY PROGRAM .......................................................... 2
FORECAST STATEMENT OF FINANCIAL POSITION.................................................................................................... 3
FORECAST STATEMENT OF CHANGES IN EQUITY ..................................................................................................... 4
FORECAST STATEMENT OF CASH FLOWS ...................................................................................................................... 5
FORECAST STATEMENT OF FUNDING.............................................................................................................................. 6
FORECAST STATEMENT OF MOVEMENT IN FIXED ASSETS .................................................................................. 7
FORECAST RATIO ANALYSIS ................................................................................................................................................. 8
FORECAST CASH RESERVES .................................................................................................................................................. 9
PROPERTY, PLANT & EQUIPMENT CAPITAL EXPENDITURE ............................................................................ 10
10 YEAR PLANT REPLACEMENT PROGRAM .............................................................................................................. 15
10 YEAR ICT / FURNITURE & EQUIPMENT PROGRAM ......................................................................................... 17
INFRASTRUCTURE CAPITAL EXPENDITURE ............................................................................................................. 18

1 2 3 4 5 6 7 8 9 10
2009-10 2010-11 2011-12 Base 2013-14 2014-15 2015-16 2016-17 2017-18 2018-19 2019-20 2020-21 2021-22 2022-23
INCOME STATEMENT Notes $ $ $ $ $ $ $ $ $ $ $ $ $ $
RevenuesRates 3,235,702 3,498,928 4,051,167 4,218,764 4,756,310 5,027,007 5,313,864 5,617,849 5,939,990 6,281,372 6,643,148 7,026,540 7,432,839 7,863,424
Operating grants, subsidies and contributions 2,037,732 2,660,530 3,763,594 2,255,753 2,340,734 2,431,469 2,539,051 2,654,086 2,777,238 2,909,231 3,050,864 3,203,011 3,366,633 3,542,782
Fees and charges 738,372 879,287 656,605 1,203,024 700,495 717,558 735,035 752,949 771,315 790,143 809,438 829,214 849,481 870,256
Service charges - - - - - - - - - - - - - -
Interest earnings - General 21,821 96,361 167,899 145,810 84,533 75,834 78,488 81,009 83,812 86,666 89,875 93,156 96,805 100,648
Interest earnings - Reserves 154,345 182,680 182,542 220,330 194,348 161,597 158,090 169,017 189,221 229,811 257,478 304,997 373,635 470,891
Other revenue 294,134 265,089 183,179 209,550 272,510 275,329 278,236 281,235 284,329 287,523 290,820 294,223 297,738 301,3696,482,106 7,582,875 9,004,986 8,253,231 8,348,930 8,688,794 9,102,764 9,556,145 10,045,905 10,584,746 11,141,623 11,751,141 12,417,131 13,149,370
ExpensesEmployee costs (1,879,029) (2,038,744) (2,224,541) (2,559,759) (2,612,531) (2,693,782) (2,785,404) (2,894,448) (3,001,290) (3,111,265) (3,226,931) (3,346,541) (3,471,013) (3,599,933)
Materials and contracts (1,368,226) (1,695,582) (1,776,142) (4,148,903) (2,555,525) (1,966,006) (1,987,750) (2,215,527) (2,218,821) (2,258,186) (2,284,537) (2,327,505) (2,380,827) (2,426,204)
Utility charges (electricity, gas, water etc.) (303,967) (310,099) (389,142) (315,800) (328,941) (343,561) (358,835) (374,790) (391,458) (408,870) (427,059) (446,063) (465,916) (486,661)
Depreciation on non-current assets (2,291,962) (2,426,074) (2,926,487) (3,251,600) (4,227,273) (4,412,935) (4,229,320) (3,080,510) (3,206,396) (3,530,331) (3,549,771) (3,667,315) (3,726,215) (3,845,948)
Interest expense (7,787) (5,654) (3,217) (1,917) - - - - - - - - - -
Insurance expense (239,961) (249,994) (209,262) (247,290) (257,147) (263,552) (270,116) (276,845) (283,742) (290,810) (298,056) (305,484) (313,096) (320,897)
Other expenditure (78,848) (159,368) (76,738) (102,548) (146,159) (138,288) (139,444) (140,631) (150,846) (102,092) (103,367) (104,676) (156,019) (148,396)(6,169,780) (6,885,515) (7,605,529) (10,627,817) (10,127,576) (9,818,124) (9,770,869) (8,982,751) (9,252,553) (9,701,554) (9,889,721) (10,197,584) (10,513,086) (10,828,039)
OPERATING RESULT 312,326 697,360 1,399,457 (2,374,586) (1,778,646) (1,129,330) (668,105) 573,394 793,352 883,192 1,251,902 1,553,557 1,904,045 2,321,331
Revenue (Asset related)Non-Operating grants, subsidies and contributions 1,233,286 2,008,002 2,470,077 2,279,070 2,252,379 2,545,979 2,145,599 1,770,805 1,897,774 1,444,985 1,350,813 1,362,098 1,907,616 1,795,906
Profit on disposal of assets 125,982 170,339 144,407 118,375 - - - - - - - - - -
Loss on asset disposal (4,176) (94,168) (31,960) (98,990) - - - - - - - - - -NET RESULT 1,667,418 2,781,533 3,981,981 (76,131) 473,733 1,416,649 1,477,494 2,344,199 2,691,126 2,328,177 2,602,715 2,915,655 3,811,661 4,117,237
Other Comprehensive Income - - 10,549,173 - - - - - - - - - - -
Total Other Comprehensive Income 1,667,418 2,781,533 14,531,154 (76,131) 473,733 1,416,649 1,477,494 2,344,199 2,691,126 2,328,177 2,602,715 2,915,655 3,811,661 4,117,237
Shire of Yilgarn
Forecast Statement of Comprehensive IncomeFor the period 2013 - 2023
Page 1

1 2 3 4 5 6 7 8 9 102009-10 2010-11 2011-12 Base 2013-14 2014-15 2015-16 2016-17 2017-18 2018-19 2019-20 2020-21 2021-22 2022-23
INCOME STATEMENT Notes $ $ $ $ $ $ $ $ $ $ $ $ $ $
RevenuesGovernance 77,462 557,370 255,075 26,000 1,000 1,000 1,000 1,000 1,000 1,000 1,000 1,000 1,000 1,000
General Purpose Funding 4,877,902 5,356,134 7,518,660 5,892,306 6,889,163 7,253,316 7,188,335 7,604,211 8,055,523 8,554,953 9,071,436 9,639,553 10,263,109 10,951,853
Law, Order, Public Safety 69,013 842,648 111,118 536,840 629,402 542,028 544,718 547,475 620,301 123,198 126,167 129,211 632,333 545,532
Health 41,661 52,306 55,752 52,020 31,020 31,020 31,020 31,020 31,020 31,020 31,020 31,020 31,020 31,020
Education and Welfare 172,206 203,275 220,700 213,181 198,648 203,419 208,306 213,314 218,452 223,714 229,111 234,641 268,305 246,110
Housing 66,339 52,226 57,886 60,060 61,563 63,104 64,681 66,298 67,955 69,654 71,396 73,180 75,010 76,886
Community Amenities 408,068 442,580 467,631 516,346 534,460 532,779 541,301 550,036 558,990 568,171 577,578 587,221 597,103 607,235
Recreation & Culture 32,474 88,239 409,540 262,713 29,640 340,193 396,761 31,342 31,938 32,550 33,176 33,817 34,475 35,149
Transport 1,568,019 1,627,750 1,670,806 1,734,578 1,634,500 1,651,367 1,670,163 1,669,381 1,709,562 1,790,191 1,704,647 1,724,775 1,725,358 1,766,939
Economic Services 329,795 284,937 675,767 368,347 352,315 375,209 358,957 367,924 402,115 386,536 396,192 406,089 442,233 426,630
Other Property and Services 198,435 253,751 176,535 273,310 239,598 241,338 243,121 244,949 246,823 248,744 250,713 252,732 254,801 256,922 7,841,374 9,761,216 11,619,470 9,935,701 10,601,309 11,234,773 11,248,363 11,326,950 11,943,679 12,029,731 12,492,436 13,113,239 14,324,747 14,945,276
Expenses Excluding Finance CostsGovernance (385,589) (574,372) (670,056) (569,098) (407,110) (387,603) (393,118) (385,231) (395,646) (424,136) (418,597) (429,739) (440,356) (452,143)
General Purpose Funding (302,113) (329,136) (329,099) (482,909) (449,700) (464,618) (478,964) (491,008) (507,352) (524,852) (542,051) (560,159) (578,735) (598,152)
Law, Order, Public Safety (254,115) (325,823) (307,412) (509,918) (503,865) (510,815) (505,261) (443,277) (430,216) (404,938) (411,973) (424,956) (484,692) (489,191)
Health (212,445) (287,788) (271,830) (303,490) (312,671) (320,116) (325,520) (325,228) (333,003) (342,253) (349,885) (358,389) (366,817) (375,905)
Education and Welfare (381,289) (394,715) (395,120) (520,886) (532,478) (535,023) (541,145) (516,739) (534,157) (557,891) (572,336) (590,425) (607,343) (626,549)
Housing (82,998) (151,670) (119,677) (274,923) (227,580) (225,348) (223,042) (194,295) (200,629) (212,480) (216,048) (222,396) (227,215) (233,791)
Community Amenities (426,598) (449,372) (537,361) (896,444) (948,952) (904,828) (922,006) (914,781) (941,367) (988,815) (999,095) (1,027,682) (1,055,528) (1,085,770)
Recreation & Culture (895,071) (1,088,188) (1,293,749) (1,714,475) (1,858,982) (1,754,281) (1,696,002) (1,584,586) (1,637,097) (1,716,100) (1,757,464) (1,812,646) (1,861,667) (1,919,834)
Transport (2,677,963) (2,812,265) (3,089,929) (3,350,114) (3,879,147) (4,026,246) (3,978,497) (3,419,043) (3,539,118) (3,766,210) (3,833,126) (3,954,025) (4,045,615) (4,171,489)
Economic Services (482,295) (475,048) (550,483) (1,467,041) (630,516) (640,130) (657,427) (657,883) (682,475) (711,551) (735,960) (763,100) (790,147) (819,316)
Other Property and Services (65,693) (85,652) (69,556) (61,609) (376,575) (49,116) (49,887) (50,680) (51,493) (52,328) (53,186) (54,067) (54,971) (55,899) (6,166,169) (6,974,029) (7,634,272) (10,150,907) (10,127,576) (9,818,124) (9,770,869) (8,982,751) (9,252,553) (9,701,554) (9,889,721) (10,197,584) (10,513,086) (10,828,039)
Finance CostsGovernance - - - - - - - - - - - - - -
General Purpose Funding - - - - - - - - - - - - - -
Law, Order, Public Safety - - - - - - - - - - - - - -
Health - - - - - - - - - - - - - -
Education and Welfare - - - - - - - - - - - - - -
Housing (7,787) (5,654) (3,217) (1,917) - - - - - - - - - -
Community Amenities - - - - - - - - - - - - - -
Recreation & Culture - - - - - - - - - - - - - -
Transport - - - - - - - - - - - - - -
Economic Services - - - - - - - - - - - - - -
Other Property and Services - - - - - - - - - - - - - - (7,787) (5,654) (3,217) (1,917) - - - - - - - - - -
NET RESULT 1,667,418 2,781,533 3,981,981 (217,123) 473,733 1,416,649 1,477,494 2,344,199 2,691,126 2,328,177 2,602,715 2,915,655 3,811,661 4,117,237
Other Comprehensive Income - - 10,549,173 - - - - - - - - - - -
TOTAL COMPREHENSIVE INCOME 1,667,418 2,781,533 14,531,154 (217,123) 473,733 1,416,649 1,477,494 2,344,199 2,691,126 2,328,177 2,602,715 2,915,655 3,811,661 4,117,237
Shire of YilgarnForecast Statement of Comprehensive Income
By ProgramFor the period 2013 - 2023
Page 2

1 2 3 4 5 6 7 8 9 10BALANCE SHEET 2009-10 2010-11 2011-12 Base 2013-14 2014-15 2015-16 2016-17 2017-18 2018-19 2019-20 2020-21 2021-22 2022-23CURRENT ASSETS $ $ $ $ $ $ $ $ $ $ $ $ $ $
Unrestricted Cash and Equivalents 735,708 1,058,013 1,862,157 1,030,743 1,035,000 1,060,875 1,087,397 1,114,582 1,142,447 1,171,008 1,200,283 1,230,290 1,261,047 1,292,573Restricted Cash and Cash Equivalent 2,584,296 3,580,985 5,035,881 4,318,812 3,342,619 3,243,855 3,458,997 3,882,530 4,755,842 5,345,343 6,372,803 7,872,724 10,007,559 12,645,935
Non-Cash Investments - - - - - - - - - - - - - -
Trade and Other Receivables 245,804 355,284 254,046 190,647 196,647 202,647 208,647 214,647 220,647 226,647 228,147 228,147 228,147 228,147Inventories 91,347 62,201 14,999 14,999 14,999 14,999 14,999 14,999 14,999 14,999 14,999 14,999 14,999 14,999
TOTAL CURRENT ASSETS 3,657,155 5,056,483 7,167,083 5,555,201 4,589,265 4,522,376 4,770,040 5,226,758 6,133,935 6,757,997 7,816,232 9,346,160 11,511,752 14,181,654
NON-CURRENT ASSETSOther Receivables 10,921 61,486 59,462 53,462 47,462 41,462 35,462 29,462 23,462 17,462 15,962 15,962 15,962 15,962Inventories 79,126 79,148 - 20,000 20,000 20,000 20,000 20,000 20,000 20,000 20,000 20,000 20,000 20,000Property Plant and Equipment 12,074,971 13,022,822 24,442,969 25,633,419 27,187,754 28,979,155 30,302,663 31,551,706 32,654,592 33,385,257 34,078,687 34,774,959 35,908,149 36,800,362Infrastructure 45,082,215 45,557,965 46,720,596 47,605,635 47,496,969 47,195,106 47,107,429 47,751,867 48,438,930 49,418,380 50,270,930 50,960,385 51,473,264 52,028,386
TOTAL NON-CURRENT ASSETS 57,247,233 58,721,421 71,223,027 73,312,516 74,752,185 76,235,723 77,465,554 79,353,035 81,136,984 82,841,099 84,385,579 85,771,306 87,417,375 88,864,710
TOTAL ASSETS 60,904,388 63,777,904 78,390,110 78,867,717 79,341,450 80,758,099 82,235,594 84,579,793 87,270,919 89,599,096 92,201,811 95,117,466 98,929,127 103,046,364
CURRENT LIABILITIESTrade and Other Payables 72,153 180,958 243,740 983,740 983,740 983,740 983,740 983,740 983,740 983,740 983,740 983,740 983,740 983,740
Current Portion of Long-term Liabilities 40,520 42,830 45,270 - - - - - - - - - - -
Provisions 251,320 343,850 397,660 397,660 397,660 397,660 397,660 397,660 397,660 397,660 397,660 397,660 397,660 397,660TOTAL CURRENT LIABILITIES 363,993 567,638 686,670 1,381,400 1,381,400 1,381,400 1,381,400 1,381,400 1,381,400 1,381,400 1,381,400 1,381,400 1,381,400 1,381,400
NON-CURRENT LIABILITIESLong-term Borrowings 88,100 45,270 - - - - - - - - - - - -Provisions 98,845 30,013 37,303 37,303 37,303 37,303 37,303 37,303 37,303 37,303 37,303 37,303 37,303 37,303
TOTAL NON-CURRENT LIABILITIES 186,945 75,283 37,303 37,303 37,303 37,303 37,303 37,303 37,303 37,303 37,303 37,303 37,303 37,303
TOTAL LIABILITIES 550,938 642,921 723,973 1,418,703 1,418,703 1,418,703 1,418,703 1,418,703 1,418,703 1,418,703 1,418,703 1,418,703 1,418,703 1,418,703
NET ASSETS 60,353,450 63,134,983 77,666,137 77,449,014 77,922,747 79,339,396 80,816,891 83,161,090 85,852,216 88,180,393 90,783,108 93,698,763 97,510,424 101,627,661
EQUITY
Retained Surplus 57,810,114 59,553,998 62,147,790 62,581,029 63,782,517 65,277,121 66,511,805 68,407,002 70,196,149 71,909,522 73,456,247 74,846,574 76,496,979 77,944,957Reserves - Cash Backed 2,543,336 3,580,985 4,969,174 4,318,812 3,591,057 3,513,102 3,755,912 4,204,914 5,106,893 5,721,697 6,777,687 8,303,015 10,464,271 13,133,530
Reserves - Revaluation - - 10,549,173 10,549,173 10,549,173 10,549,173 10,549,173 10,549,173 10,549,173 10,549,173 10,549,173 10,549,173 10,549,173 10,549,173TOTAL EQUITY 60,353,450 63,134,983 77,666,137 77,449,014 77,922,747 79,339,396 80,816,890 83,161,089 85,852,215 88,180,392 90,783,107 93,698,762 97,510,423 101,627,660
Shire of Yilgarn
Forecast Statement of Financial PositionFor the period 2013 - 2023
Page 3

1 2 3 4 5 6 7 8 9 102009-10 2010-11 2011-12 Base 2013-14 2014-15 2015-16 2016-17 2017-18 2018-19 2019-20 2020-21 2021-22 2022-23
RETAINED SURPLUS $ $ $ $ $ $ $ $ $ $ $ $ $ $Opening Balance 56,142,696 57,810,114 59,553,998 62,006,798 62,581,029 63,782,517 65,277,121 66,511,805 68,407,002 70,196,149 71,909,522 73,456,247 74,846,574 76,496,979Net Result 1,667,418 2,781,533 14,531,154 (76,131) 473,733 1,416,649 1,477,494 2,344,199 2,691,126 2,328,177 2,602,715 2,915,655 3,811,661 4,117,237Total Other Comprehensive Income - - (10,549,173) - - - - - - - - - - -Amount transferred (to)/from Reserves (1,037,649) (1,388,189) 650,362 727,755 77,955 (242,810) (449,002) (901,979) (614,804) (1,055,990) (1,525,328) (2,161,256) (2,669,259)Closing Balance 57,810,114 59,553,998 62,147,790 62,581,029 63,782,517 65,277,121 66,511,805 68,407,002 70,196,149 71,909,522 73,456,247 74,846,574 76,496,979 77,944,957
RESERVES - CASH/INVESTMENT BACKEDOpening Balance 2,543,336 2,543,336 3,580,985 4,969,174 4,318,812 3,591,057 3,513,102 3,755,912 4,204,914 5,106,893 5,721,697 6,777,687 8,303,015 10,464,271Amount transferred to/(from) Retained Surplus - 1,037,649 1,388,189 (650,362) (727,755) (77,955) 242,810 449,002 901,979 614,804 1,055,990 1,525,328 2,161,256 2,669,259Closing Balance 2,543,336 3,580,985 4,969,174 4,318,812 3,591,057 3,513,102 3,755,912 4,204,914 5,106,893 5,721,697 6,777,687 8,303,015 10,464,271 13,133,530
Asset Revaluation ReservesOpening Balance - - - 10,549,173 10,549,173 10,549,173 10,549,173 10,549,173 10,549,173 10,549,173 10,549,173 10,549,173 10,549,173 10,549,173Total Other Comprehensive Income - - 10,549,173 - - - - - - - - - - -Closing Balance - - 10,549,173 10,549,173 10,549,173 10,549,173 10,549,173 10,549,173 10,549,173 10,549,173 10,549,173 10,549,173 10,549,173 10,549,173
TOTAL EQUITY 60,353,450 63,134,983 77,666,137 77,449,014 77,922,747 79,339,396 80,816,890 83,161,089 85,852,215 88,180,392 90,783,107 93,698,762 97,510,423 101,627,660
Shire of Yilgarn
Forecast Statement of Changes in EquityFor the period 2013 - 2023
Page 4

1 2 3 4 5 6 7 8 9 10
2010-11 2011-12 Base 2013-14 2014-15 2015-16 2016-17 2017-18 2018-19 2019-20 2020-21 2021-22 2022-23$ $ $ $ $ $ $ $ $ $ $ $ $
Cash Flows From Operating ActivitiesReceipts
Rates 3,498,928 4,051,167 4,218,764 4,756,310 5,027,007 5,313,864 5,617,849 5,939,990 6,281,372 6,643,148 7,026,540 7,432,839 7,863,424Operating grants, subsidies and contributions 2,660,530 3,763,594 2,255,753 2,340,734 2,431,469 2,539,051 2,654,086 2,777,238 2,909,231 3,050,864 3,203,011 3,366,633 3,542,782
Fees and Charges 719,242 757,843 1,272,423 700,495 717,558 735,035 752,949 771,315 790,143 809,438 829,214 849,481 870,256
Service Charges - - - - - - - - - - - - -Interest Earnings 279,041 350,441 366,140 278,881 237,431 236,578 250,026 273,033 316,477 347,353 398,153 470,440 571,539
Other Revenue 294,213 230,381 189,550 272,510 275,329 278,236 281,235 284,329 287,523 290,820 294,223 297,738 301,3697,451,954 9,153,426 8,302,630 8,348,930 8,688,794 9,102,764 9,556,145 10,045,905 10,584,746 11,141,623 11,751,141 12,417,131 13,149,370
Payments
Employee Costs (2,015,046) (2,163,441) (2,559,759) (2,612,531) (2,693,782) (2,785,404) (2,894,448) (3,001,290) (3,111,265) (3,226,931) (3,346,541) (3,471,013) (3,599,933)Materials and Contracts (1,586,777) (1,713,360) (3,408,903) (2,555,525) (1,966,006) (1,987,750) (2,215,527) (2,218,821) (2,258,186) (2,284,537) (2,327,505) (2,380,827) (2,426,204)
Utility Charges (310,099) (389,142) (315,800) (328,941) (343,561) (358,835) (374,790) (391,458) (408,870) (427,059) (446,063) (465,916) (486,661)Insurance Expenses (5,654) (3,217) (1,917) - - - - - - - - - -
Interest expenses (249,994) (209,262) (247,290) (257,147) (263,552) (270,116) (276,845) (283,742) (290,810) (298,056) (305,484) (313,096) (320,897)
Other Expenditure (159,368) (76,738) (102,548) (146,159) (138,288) (139,444) (140,631) (150,846) (102,092) (103,367) (104,676) (156,019) (148,396)(4,326,938) (4,555,160) (6,636,217) (5,900,303) (5,405,189) (5,541,549) (5,902,241) (6,046,157) (6,171,223) (6,339,950) (6,530,269) (6,786,871) (6,982,091)
Net Cash Provided By (Used In) Operating Activities 3,125,016 4,598,266 1,666,413 2,448,627 3,283,605 3,561,215 3,653,904 3,999,748 4,413,523 4,801,673 5,220,872 5,630,260 6,167,279
Cash Flows from Investing Activities
Payments for Development of Land Held for Resale (141) - (100,000) - - - - - - - - - -Payments for Purchase of Property, Plant & Equipment (2,201,490) (2,743,525) (3,133,809) (2,963,869) (3,309,316) (2,973,800) (3,020,506) (2,919,172) (2,701,535) (2,588,640) (2,839,909) (3,422,254) (3,160,473)
Payments for Construction of Infrastructure (1,964,955) (2,298,021) (3,210,340) (3,021,173) (2,909,757) (2,840,051) (2,315,485) (2,384,373) (2,920,011) (2,733,311) (2,600,733) (2,362,131) (2,432,210)Advances to Community Groups (60,000) - - - - - - - - - - - -
Non-Operating Grants, Subsidies and Contributions 2,008,002 2,470,077 2,279,070 2,252,379 2,545,979 2,145,599 1,770,805 1,897,774 1,444,985 1,350,813 1,362,098 1,907,616 1,795,906
Proceeds from Sale of Plant & Equipment 445,636 299,432 261,555 312,100 316,600 348,700 362,000 307,200 381,100 226,200 387,600 412,100 299,400Proceeds from Sale of Land Held for Resale - - - - - - - - - -
Transfers (to)/from Investments - - - - - - - - - - - - -Net Cash Provided By (Used In) Investing Activities (1,772,948) (2,272,037) (3,903,524) (3,420,563) (3,356,494) (3,319,552) (3,203,186) (3,098,571) (3,795,461) (3,744,938) (3,690,944) (3,464,669) (3,497,377)
Cash Flows from Financing ActivitiesRepayment of Debentures (40,520) (42,830) (45,270) - - - - - - - - - -
Proceeds from Self Supporting Loans 4,500 6,000 6,000 - - - - - - - - - -
Proceeds from New Debentures - - - - - - - - - - - - -Net Cash Provided By (Used In) Financing Activities (36,020) (36,830) (39,270) - - - - - - - - - -
Net Increase (Decrease) in Cash Held 1,316,048 2,289,399 (2,276,381) (971,936) (72,889) 241,663 450,718 901,177 618,062 1,056,735 1,529,928 2,165,591 2,669,902Cash at Beginning of Year 3,320,004 4,638,998 6,898,038 5,349,555 4,377,619 4,304,730 4,546,394 4,997,112 5,898,289 6,516,351 7,573,086 9,103,014 11,268,606Cash and Cash Equivalents at the End of the Year 4,636,052 6,928,397 4,621,657 4,377,619 4,304,730 4,546,393 4,997,112 5,898,289 6,516,351 7,573,086 9,103,014 11,268,605 13,938,508
Reconciliation of Net Cash Provided By Operating Activities to Net Result
Net Result 2,781,533 3,981,981 (76,131) 473,733 1,416,649 1,477,494 2,344,199 2,691,126 2,328,177 2,602,715 2,915,655 3,811,661 4,117,237
Depreciation 2,426,074 2,926,487 3,251,600 4,227,273 4,412,935 4,229,320 3,080,510 3,206,396 3,530,331 3,549,771 3,667,315 3,726,215 3,845,948Write off of Assets - - - - - - - - - -
(Profit)/Loss on Sale of Asset (76,171) (112,447) (19,385) - - - - - - - - - -
(Increase)/Decrease in Receivables (160,045) 101,238 69,399 - - - - - - - - - -
(Increase)/Decrease in Inventories 29,124 47,202 (20,000) - - - - - - - - - -Increase/(Decrease) in Payables 108,805 62,782 740,000 - - - - - - - - - -Increase/(Decrease) in Employee Provisions 23,698 61,100 - - - - - - - - - - -
Grants/Contributions for the Development of Assets (2,008,002) (2,470,077) (2,279,070) (2,252,379) (2,545,979) (2,145,599) (1,770,805) (1,897,774) (1,444,985) (1,350,813) (1,362,098) (1,907,616) (1,795,906)Net Cash from Operating Activities 3,125,016 4,598,266 1,666,413 2,448,627 3,283,605 3,561,215 3,653,904 3,999,748 4,413,523 4,801,673 5,220,872 5,630,260 6,167,279
Shire of Yilgarn
Forecast Statement of CashflowsFor the period 2013 - 2023
Page 5

1 2 3 4 5 6 7 8 9 10
2010-11 2011-12 Base 2013-14 2014-15 2015-16 2016-17 2017-18 2018-19 2019-20 2020-21 2021-22 2022-23OPERATING $ $ $ $ $ $ $ $ $ $ $ $ $
RevenuesRates 3,498,928 4,051,167 4,218,764 4,756,310 5,027,007 5,313,864 5,617,849 5,939,990 6,281,372 6,643,148 7,026,540 7,432,839 7,863,424
Operating grants, subsidies and contributions 2,660,530 3,763,594 2,255,753 2,340,734 2,431,469 2,539,051 2,654,086 2,777,238 2,909,231 3,050,864 3,203,011 3,366,633 3,542,782
Profit on Asset Disposal 170,339 144,407 118,375 - - - - - - - - - -
Fees and charges 879,287 656,605 1,203,024 700,495 717,558 735,035 752,949 771,315 790,143 809,438 829,214 849,481 870,256
Service charges - - - - - - - - - - - - -
Interest earnings - General 96,361 167,899 115,000 84,533 75,834 78,488 81,009 83,812 86,666 89,875 93,156 96,805 100,648
Interest earnings - Reserves 182,680 182,542 200,000 194,348 161,597 158,090 169,017 189,221 229,811 257,478 304,997 373,635 470,891
Other revenue 265,089 183,179 209,550 272,510 275,329 278,236 281,235 284,329 287,523 290,820 294,223 297,738 301,3697,753,214 9,149,393 8,320,466 8,348,930 8,688,794 9,102,764 9,556,145 10,045,905 10,584,746 11,141,623 11,751,141 12,417,131 13,149,370
ExpensesEmployee costs (2,038,744) (2,224,541) (2,559,759) (2,612,531) (2,693,782) (2,785,404) (2,894,448) (3,001,290) (3,111,265) (3,226,931) (3,346,541) (3,471,013) (3,599,933)
Materials and contracts (1,695,582) (1,776,142) (4,148,903) (2,555,525) (1,966,006) (1,987,750) (2,215,527) (2,218,821) (2,258,186) (2,284,537) (2,327,505) (2,380,827) (2,426,204)
Utility charges (electricity, gas, water etc.) (310,099) (389,142) (315,800) (328,941) (343,561) (358,835) (374,790) (391,458) (408,870) (427,059) (446,063) (465,916) (486,661)
Depreciation on non-current assets (2,426,074) (2,926,487) (3,251,600) (4,227,273) (4,412,935) (4,229,320) (3,080,510) (3,206,396) (3,530,331) (3,549,771) (3,667,315) (3,726,215) (3,845,948)
Loss on Asset Disposal (94,168) (31,960) (98,990) - - - - - - - - - -
Interest Expense (5,654) (3,217) (1,917) - - - - - - - - - -
Insurance expense (249,994) (209,262) (247,290) (257,147) (263,552) (270,116) (276,845) (283,742) (290,810) (298,056) (305,484) (313,096) (320,897)
Other expenditure (159,368) (76,738) (102,548) (146,159) (138,288) (139,444) (140,631) (150,846) (102,092) (103,367) (104,676) (156,019) (148,396)(6,979,683) (7,637,489) (10,726,807) (10,127,576) (9,818,124) (9,770,869) (8,982,751) (9,252,553) (9,701,554) (9,889,721) (10,197,584) (10,513,086) (10,828,039)
NET OPERATIONS 773,531 1,511,904 (2,406,341) (1,778,646) (1,129,330) (668,105) 573,394 793,352 883,192 1,251,902 1,553,557 1,904,045 2,321,331
Funding Position AdjustmentsDepreciation on non-current assets 2,426,074 2,926,487 3,251,600 4,227,273 4,412,935 4,229,320 3,080,510 3,206,396 3,530,331 3,549,771 3,667,315 3,726,215 3,845,948
Net profit and losses on Disposal (76,171) (112,447) (19,385) - - - - - - - - - -
Movement in Accruals 12,064 14,937 - - - - - - - - - - -
Movement in Deferred Pensioner Rates (Non-Current) - - - - - - - - - -
Movement in Non Current Receivables 6,000 6,000 6,000 6,000 6,000 6,000 1,500 - - -
Movement in Employee Benefit Provisions 23,698 61,100 - - - - - - - - - - -
Write-off of assets - - - - - - - - - - - - -
FUNDING FROM GENERAL OPERATIONS 3,159,196 4,401,981 825,874 2,454,627 3,289,605 3,567,215 3,659,904 4,005,748 4,419,523 4,803,173 5,220,872 5,630,260 6,167,279
CAPITAL
Asset Acquisitions and ConstructionPurchase of land held for resale (141) - (100,000) - - - - - - - - - -
Purchase of Property Plant and Equipment (2,201,490) (2,743,525) (3,133,809) (2,963,869) (3,309,316) (2,973,800) (3,020,506) (2,919,172) (2,701,535) (2,588,640) (2,839,909) (3,422,254) (3,160,473)
Infrastructure (1,964,955) (2,298,021) (3,210,340) (3,021,173) (2,909,757) (2,840,051) (2,315,485) (2,384,373) (2,920,011) (2,733,311) (2,600,733) (2,362,131) (2,432,210)
Proceeds on Disposal 445,636 299,432 261,555 312,100 316,600 348,700 362,000 307,200 381,100 226,200 387,600 412,100 299,400
Non-Operating grants, subsidies and contributions 2,008,002 2,470,077 2,279,070 2,252,379 2,545,979 2,145,599 1,770,805 1,897,774 1,444,985 1,350,813 1,362,098 1,907,616 1,795,906
NET FUNDING BEFORE FINANCING (1,712,948) (2,272,037) (3,903,524) (3,420,563) (3,356,494) (3,319,552) (3,203,186) (3,098,571) (3,795,461) (3,744,938) (3,690,944) (3,464,669) (3,497,377)
FinancingInflows
Transfer from Reserves 2,464,538 2,925,229 4,387,454 995,481 332,016 10,990 128,543 110,500 43,839 48,698 55,005 73,278 425New Borrowings - - - - - - - - - - - - -Self Supporting Loan 4,500 6,000 6,000 - - - - - - - - - -
OutflowsTransfer to Reserves (3,502,187) (4,313,418) (3,116,098) (267,726) (254,061) (253,800) (577,545) (1,012,479) (658,643) (1,104,688) (1,580,333) (2,234,534) (2,669,684)Advances to Community Groups (60,000) - - - - - - - - - - - -Repayment of Past Borrowings (40,520) (42,830) (45,270) - - - - - - - - - -
NET FINANCING (1,133,669) (1,425,019) 1,232,086 727,755 77,955 (242,810) (449,002) (901,979) (614,804) (1,055,990) (1,525,328) (2,161,256) (2,669,259)
ACCOUNTING PERIOD BALANCESOpening Balance 1,041,666 1,354,245 2,059,170 252,649 14,468 25,534 30,387 38,103 43,301 52,559 54,804 59,404 63,739Closing Balance 1,354,245 2,059,170 213,606 14,468 25,534 30,387 38,103 43,301 52,559 54,804 59,404 63,739 64,382
PROOF OF CLOSING POSITIONCURRENT ASSETS
Unrestricted Cash and Equivalents 735,708 1,058,013 1,862,157 1,030,743 1,035,000 1,060,875 1,087,397 1,114,582 1,142,447 1,171,008 1,200,283 1,230,290 1,261,047 1,292,573
Restricted Cash and Cash Equivalent 2,584,296 3,580,985 5,035,881 4,318,812 3,342,619 3,243,855 3,458,997 3,882,530 4,755,842 5,345,343 6,372,803 7,872,724 10,007,559 12,645,935
Non-Cash Investments - - - - - - - - - - - - - -
Trade and Other Receivables 245,804 355,284 254,046 190,647 196,647 202,647 208,647 214,647 220,647 226,647 228,147 228,147 228,147 228,147
Inventories 91,347 62,201 14,999 14,999 14,999 14,999 14,999 14,999 14,999 14,999 14,999 14,999 14,999 14,999CURRENT LIABILITIES
Trade and Other Payables (72,153) (180,958) (243,740) (983,740) (983,740) (983,740) (983,740) (983,740) (983,740) (983,740) (983,740) (983,740) (983,740) (983,740)
Reserves (2,543,336) (3,580,985) (4,969,174) (4,318,812) (3,591,057) (3,513,102) (3,755,912) (4,204,914) (5,106,893) (5,721,697) (6,777,687) (8,303,015) (10,464,271) (13,133,530)
Current Self Supporting Loans Receivable - - - - - - - - - - -
Movement in Deferred Pensioner Rates (Non-Current) - - - - - - - - - -
Movement in Accrued Salaries and Wages - - - - - - - - - -
1,041,666 1,294,540 1,954,169 252,649 14,468 25,534 30,388 38,104 43,302 52,560 54,805 59,405 63,741 64,384
Shire of Yilgarn
Forecast Statement of FundingFor the period 2013 - 2023
Page 6
1 2 3 4 5 6 7 8 9 10
2013-14 2014-15 2015-16 2016-17 2017-18 2018-19 2019-20 2020-21 2021-22 2022-23
Capital Works - Infrastructure $ $ $ $ $ $ $ $ $ $
Roads 2,474,317 2,364,254 2,220,865 2,276,177 2,343,100 2,630,163 2,645,670 2,509,317 2,321,840 2,389,905Drainage 33,956 35,653 37,436 39,308 41,273 34,805 36,544 38,372 40,291 42,305Parks and Gardens - - 500,000 - - - - - - -Footpaths and Cycleways 39,900 49,850 51,750 - - 40,898 51,096 53,044 - -Airports - - - - - - - - - -Sewerage Scheme 50,000 60,000 30,000 - - - - - - -Other Infrastructure 401,000 350,000 - - - - - - - -
Total Capital Works - Infrastructure 2,999,173 2,859,757 2,840,051 2,315,485 2,384,373 2,705,866 2,733,310 2,600,733 2,362,131 2,432,210
Represented by:Additions - Assets at no cost - - - - - - - - - -Additions - Expansion, Upgrades and New 867,172 1,050,739 1,105,768 437,299 409,678 767,170 591,985 577,062 437,299 409,678Additions - Renewal 2,154,001 1,859,018 1,734,283 1,878,186 1,974,695 2,152,842 2,141,325 2,023,671 1,924,832 2,022,532
Total Capital Works - Infrastructure 3,021,173 2,909,757 2,840,051 2,315,485 2,384,373 2,920,012 2,733,310 2,600,733 2,362,131 2,432,210
Asset Movement Reconciliation Total Capital Works Infrastructure 2,999,173 2,859,757 2,840,051 2,315,485 2,384,373 2,705,866 2,733,310 2,600,733 2,362,131 2,432,210Depreciation Infrastructure (3,129,839) (3,211,620) (2,927,728) (1,671,047) (1,697,310) (1,940,561) (1,880,761) (1,911,278) (1,849,251) (1,877,088)Net Book Value of disposed/Written Off assets - - - - - - - - - -
Net Movement in Infrastructure Assets (130,666) (351,863) (87,677) 644,438 687,063 765,305 852,549 689,455 512,880 555,122
Capital Works - Property, Plant and Equip.Land - - - - - - - - - -Buildings 1,553,369 2,047,950 1,650,000 1,556,250 1,595,156 1,635,035 1,675,911 1,717,809 1,760,754 1,804,773Plant and Equipment 1,410,500 1,261,366 1,293,800 1,424,256 1,324,016 1,036,500 912,729 1,077,100 1,631,500 1,355,700Furniture and Equipment - - 30,000 40,000 - 30,000 - 45,000 30,000 -Other non-Infrastructure - - - - - - - - - -
Total Capital Works Property, Plant and Equipment 2,963,869 3,309,316 2,973,800 3,020,506 2,919,172 2,701,535 2,588,640 2,839,909 3,422,254 3,160,473
Represented by:Additions - Assets at no cost - - - - - - - - - -Additions - Expansion, Upgrades and New 1,576,869 2,092,950 1,400,000 1,300,000 1,332,500 1,365,813 1,447,958 1,434,957 1,470,831 1,507,602Additions - Renewal 1,387,000 1,216,366 1,573,800 1,720,506 1,586,672 1,335,722 1,140,682 1,404,952 1,951,423 1,652,871
Total Capital Works Property, Plant and Equipment 2,963,869 3,309,316 2,973,800 3,020,506 2,919,172 2,701,535 2,588,640 2,839,909 3,422,254 3,160,473
Asset Movement ReconciliationTotal Capital Works Property,Plant and Equipment 2,963,869 3,309,316 2,973,800 3,020,506 2,919,172 2,701,535 2,588,640 2,839,909 3,422,254 3,160,473Depreciation Property, Plant and Equipment (1,097,434) (1,201,315) (1,301,592) (1,409,463) (1,509,086) (1,589,770) (1,669,010) (1,756,037) (1,876,964) (1,968,860)Net Book Value of disposed/Written Off assets (312,100) (316,600) (348,700) (362,000) (307,200) (381,100) (226,200) (387,600) (412,100) (299,400)
Net Movement in Property, Plant and Equipment 1,554,335 1,791,401 1,323,508 1,249,043 1,102,886 730,665 693,430 696,272 1,133,190 892,213
Capital Works Areas - TotalTotal Capital Works Infrastructure 2,999,173 2,859,757 2,840,051 2,315,485 2,384,373 2,705,866 2,733,310 2,600,733 2,362,131 2,432,210Total Capital Works Property, Plant and Equipment 2,963,869 3,309,316 2,973,800 3,020,506 2,919,172 2,701,535 2,588,640 2,839,909 3,422,254 3,160,473
TOTAL CAPITAL WORKS 5,963,042 6,169,073 5,813,851 5,335,991 5,303,545 5,407,401 5,321,950 5,440,642 5,784,385 5,592,683
Net Asset Movement Reconciliation Net Movement in Infrastructure Assets (130,666) (351,863) (87,677) 644,438 687,063 765,305 852,549 689,455 512,880 555,122Net Movement in Property, Plant and Equipment 1,554,335 1,791,401 1,323,508 1,249,043 1,102,886 730,665 693,430 696,272 1,133,190 892,213
NET MOVEMENT IN FIXED ASSETS 1,423,669 3,075,384 3,308,083 3,598,692 3,561,367 3,488,564 3,282,007 3,428,623 3,876,255 3,675,403
Shire of Yilgarn
Forecast Statement of Movements in Fixed AssetsFor the period 2013 - 2023
Page 7
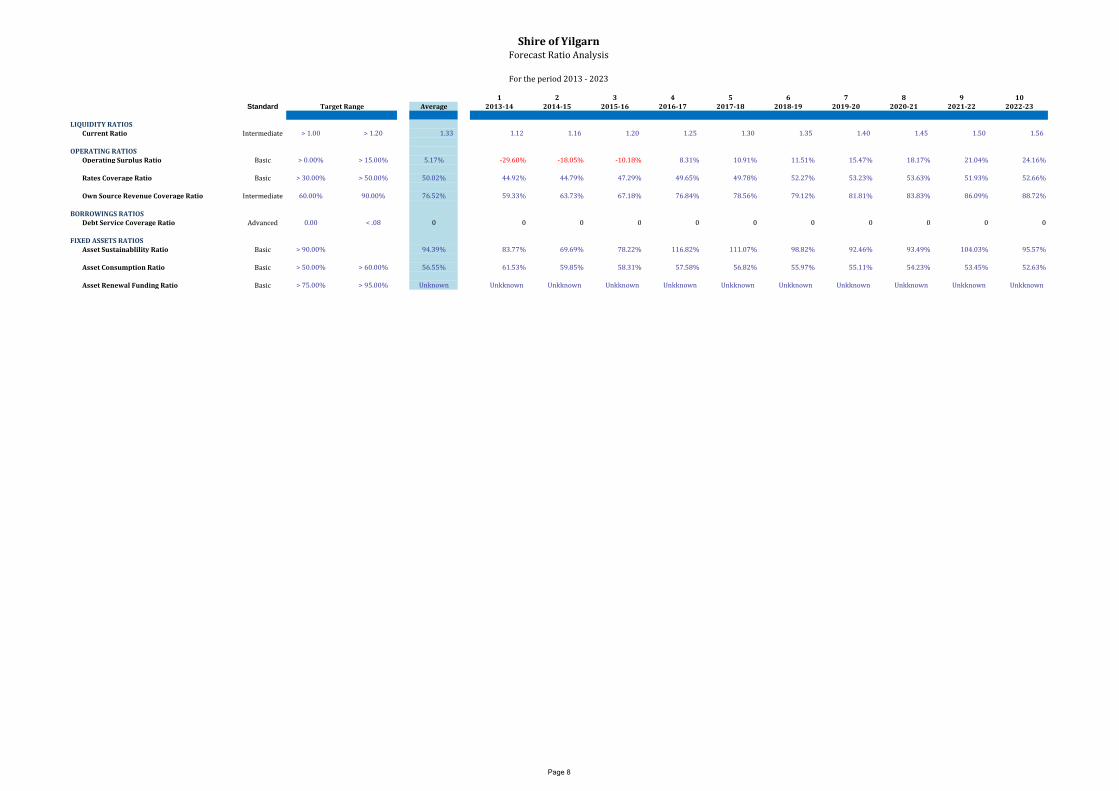
1 2 3 4 5 6 7 8 9 10Standard Average 2013-14 2014-15 2015-16 2016-17 2017-18 2018-19 2019-20 2020-21 2021-22 2022-23
LIQUIDITY RATIOSCurrent Ratio Intermediate > 1.00 > 1.20 1.33 1.12 1.16 1.20 1.25 1.30 1.35 1.40 1.45 1.50 1.56
OPERATING RATIOSOperating Surplus Ratio Basic > 0.00% > 15.00% 5.17% -29.60% -18.05% -10.18% 8.31% 10.91% 11.51% 15.47% 18.17% 21.04% 24.16%
Rates Coverage Ratio Basic > 30.00% > 50.00% 50.02% 44.92% 44.79% 47.29% 49.65% 49.78% 52.27% 53.23% 53.63% 51.93% 52.66%
Own Source Revenue Coverage Ratio Intermediate 60.00% 90.00% 76.52% 59.33% 63.73% 67.18% 76.84% 78.56% 79.12% 81.81% 83.83% 86.09% 88.72%
BORROWINGS RATIOSDebt Service Coverage Ratio Advanced 0.00 < .08 0 0 0 0 0 0 0 0 0 0 0
FIXED ASSETS RATIOSAsset Sustainablility Ratio Basic > 90.00% 94.39% 83.77% 69.69% 78.22% 116.82% 111.07% 98.82% 92.46% 93.49% 104.03% 95.57%
Asset Consumption Ratio Basic > 50.00% > 60.00% 56.55% 61.53% 59.85% 58.31% 57.58% 56.82% 55.97% 55.11% 54.23% 53.45% 52.63%
Asset Renewal Funding Ratio Basic > 75.00% > 95.00% Unknown Unkknown Unkknown Unkknown Unkknown Unkknown Unkknown Unkknown Unkknown Unkknown Unkknown
Shire of YilgarnForecast Ratio Analysis
For the period 2013 - 2023
Target Range
Page 8

1 2 3 4 5 6 7 8 9 10Base 2013-14 2014-15 2015-16 2016-17 2017-18 2018-19 2019-20 2020-21 2021-22 2022-23
CASH BACKED RESERVE $ $ $ $ $ $ $ $ $ $ $
Airport Reserve 106,526 111,320 116,329 121,564 127,034 132,751 138,725 194,968 273,742 286,060 298,933 Building Reserve 411,752 430,281 449,644 469,878 521,023 794,469 980,220 1,324,330 1,883,925 2,608,702 3,366,094 Community Bus Reserve 69,647 87,781 106,731 126,534 147,228 58,353 75,979 94,398 113,646 133,760 154,779 Computer Hardware and Software Reserve 46,348 - - - - - - - - - - Homes for the Aged Reserve 262,881 274,711 287,073 299,991 313,491 327,598 342,340 357,745 373,844 790,667 1,226,247 Land Development Reserve 135,566 141,666 148,041 154,703 161,665 218,940 278,792 341,338 406,698 474,999 546,374 Long Service Leave Reserve 255,369 266,861 278,870 291,419 304,533 318,237 332,558 347,523 363,162 379,504 396,582 Mt Hampton/Dulyalbin Water Supply Reserve 30,242 31,603 33,025 34,511 36,064 37,687 39,383 41,155 43,007 44,942 46,964 Museum Reserve 18,248 19,069 19,927 20,824 21,761 22,740 23,763 24,832 25,949 27,117 28,337 Plant Replacement Reserve 853,383 793,385 817,071 853,583 791,028 1,002,405 1,012,388 1,009,248 1,018,941 991,515 1,035,708 Recreation Facility Reserve 551,040 575,837 281,750 314,429 578,578 854,614 1,043,072 1,390,010 1,952,560 2,685,425 3,806,269 Refuse Disposal Reserve 132,139 138,085 144,299 150,792 157,578 164,669 172,079 244,823 340,840 356,178 372,206 Sewerage Reserve 492,159 523,950 610,567 698,753 793,725 888,724 982,549 1,076,681 1,170,468 1,264,077 1,357,030 Health Services Reserve 136,150 142,277 148,679 155,370 162,362 169,668 177,303 185,282 193,620 242,333 293,238 Unspent Grants Reserve 698,508 - - - - - - - - - - HVRIC Reserve 113,594 - - - - - - - - - - Youth Development Reserve 5,260 5,497 5,744 6,002 56,272 68,804 81,900 95,586 109,887 124,832 140,449 ICT and Furniture & Equipment Reserve - 48,734 65,352 57,559 32,572 47,234 40,646 49,768 32,726 54,160 64,320
4,318,812 3,591,057 3,513,102 3,755,912 4,204,914 5,106,893 5,721,697 6,777,687 8,303,015 10,464,271 13,133,530
Shire of YilgarnForecast Cash Reserves
For the period 2013 - 2023
Page 9

SHIRE OF YILGARN FINANCIAL PLAN 2013-14 TO 2022-23
LAND HELD FOR RESALEBase CBP
2012-13 2013-14 2014-15 2015-16 2016-17 2017-18 2018-19 2019-20 2020-21 2021-22 2022-23 REF
Asset Expenditure Type Project
Additions - Assets at no cost 0 0 0 0 0 0 0 0 0 0 0 0 0 0 0 0 0 0 0 0 0 0 Additions - Expansion, Upgrades and New 0 0 0 0 0 0 0 0 0 0 0 0 0 0 0 0 0 0 0 0 0 0 0 0 0 0 0 0 0 0 0 0 0 Additions - Renewal 0 0 0 0 0 0 0 0 0 0 0 0 0 0 0 0 0 0 0 0 0 0 0 0 0 0 0 0 0 0 0 0 0 0 0 0 0 0 0 0 0 0 0 0 0 0 0 0 0 0 0 0 0 0 0 0 0 0 0 0 0 0 0 0 0 0
TOTAL LAND HELD FOR RESALE CAPITAL EXPENDITURE 0 0 0 0 0 0 0 0 0 0 0
Funding Sources
0 0 0 0 0 0 0 0 0 0 00 0 0 0 0 0 0 0 0 0 0
0 0 0 0 0 0 0 0 0 0 0
Funded by Council 0 0 0 0 0 0 0 0 0 0 0
Inventories, Property, Plant & Equipment - Asset Capital Expenditure
Projected
Page 10

SHIRE OF YILGARN FINANCIAL PLAN 2013-14 TO 2022-23
#
LANDBase CBP
2012-13 2013-14 2014-15 2015-16 2016-17 2017-18 2018-19 2019-20 2020-21 2021-22 2022-23 REF
Asset Expenditure Type Project
Additions - Assets at no cost 0 0 0 0 0 0 0 0 0 0 0
0 0 0 0 0 0 0 0 0 0 0
Additions - Expansion, Upgrades and New 0 0 0 0 0 0 0 0 0 0 0 0 0 0 0 0 0 0 0 0 0 0 0 0 0 0 0 0 0 0 0 0 0 Additions - Renewal 0 0 0 0 0 0 0 0 0 0 0 0 0 0 0 0 0 0 0 0 0 0 0 0 0 0 0 0 0 0 0 0 0
TOTAL LAND CAPITAL EXPENDITURE 0 0 0 0 0 0 0 0 0 0 0
Funding Sources
0 0 0 0 0 0 0 0 0 0 00 0 0 0 0 0 0 0 0 0 0
0 0 0 0 0 0 0 0 0 0 0
Funded by Council 0 0 0 0 0 0 0 0 0 0 0
Inventories, Property, Plant & Equipment - Asset Capital Expenditure
Projected
Page 11

SHIRE OF YILGARN FINANCIAL PLAN 2013-14 TO 2022-23
BUILDINGSBase CBP
2012-13 2013-14 2014-15 2015-16 2016-17 2017-18 2018-19 2019-20 2020-21 2021-22 2022-23 REF
Asset Expenditure Type Project
Additions - Assets at no cost 0 0 0 0 0 0 0 0 0 0 0
0 0 0 0 0 0 0 0 0 0 0 Additions - Expansion, Upgrades and New Dwelling Construction 0 472,361 0 0 0 0 0 0 0 0 0 Purchase of House - Doctor 43,500 0 0 0 0 0 0 0 0 0 0 S1.10.3
Purchase & Install Unisex Toilet Block/Outside Shower 22,250 0 0 0 0 0 0 0 0 0 0 Southern Cross Community Centre Upgrade 35,500 0 0 0 0 0 0 0 0 0 0 Sports Complex Capital Upgrade 7,000 0 0 0 0 0 0 0 0 0 0 S1.12.4
Recreation Sporting Precinct 582,268 0 0 0 0 0 0 0 0 0 0 S1.12.4
Airport Terminal - Firehouse Reels & Pumps 1,500 0 0 0 0 0 0 0 0 0 0 Caravan Park Improvements 0 419,368 0 0 0 0 0 0 0 0 0 Install New Transportable Accommodation 0 100,000 0 0 0 0 0 0 0 0 0 S1.3.2
Admin Centre Upgrade 75,500 0 150,000 0 0 0 0 0 0 0 0 Depot Office Upgrade 15,440 0 0 0 0 0 0 0 0 0 0 Pool Facilities & Change rooms 0 0 580,000 0 0 0 0 0 0 0 0 S1.12.1
Construct Indoor Heated/Hydrotherapy Pool 0 0 0 1,200,000 0 0 0 0 0 0 0 S1.12.1
Energy Conservation Project - Admin Centre 0 30,000 30,000 0 0 0 0 0 0 0 0 Brick Paving at new Pavilion & other capital upgrades 0 2,000 0 0 0 0 0 0 0 0 0 Construct New Store Room - SX Community Cntre 0 60,000 0 0 0 0 0 0 0 0 0 Dust proof Telescope shed - Masonic Hall 0 9,000 0 0 0 0 0 0 0 0 0 Caravan Park Power Upgrades 0 50,000 0 0 0 0 0 0 0 0 0 Tourist Visitor Centre Development 0 360,640 0 0 0 0 0 0 0 0 0 Seniors Accommodation - Lifestyle Village 0 50,000 1,287,950 0 0 0 0 0 0 0 0 Council Funded Commitment to Upgrade of L & B 0 0 0 200,000 1,300,000 1,332,500 1,365,813 1,399,958 1,434,957 1,470,831 1,507,602
782,958 1,553,369 2,047,950 1,400,000 1,300,000 1,332,500 1,365,813 1,399,958 1,434,957 1,470,831 1,507,602 Additions - Renewal Council Funded Commitment to Renewal of L & B 0 0 0 250,000 256,250 262,656 269,222 275,953 282,852 289,923 297,171
0 0 0 0 0 0 0 0 0 0 0 0 0 0 250,000 256,250 262,656 269,222 275,953 282,852 289,923 297,171
TOTAL BUILDINGS CAPITAL EXPENDITURE 782,958 1,553,369 2,047,950 1,650,000 1,556,250 1,595,156 1,635,035 1,675,911 1,717,809 1,760,754 1,804,773
Funding Sources
CLGF– Regional Government (State) 11/12 Professional Accommodation - Yilgarn (392,361) 0 0 0 0 0 0 0 0 0 0CLGF– local Government (State) 11/12 - RECEIVED 2011-12 Recreation Sporting Precinct (392,361) 0 0 0 0 0 0 0 0 0 0Lotterywest - Playgound Equip Recreation Sporting Precinct (60,198) 0 0 0 0 0 0 0 0 0 0CLGF– local Government (State) 12/13 Caravan Park Improvements 0 (392,361) 0 0 0 0 0 0 0 0 0CSRFF Pool Facilities & Change rooms 0 0 (193,333) 0 0 0 0 0 0 0 0Lotterywest Construct Indoor Heated/Hydrotherapy Pool 0 0 0 (200,000) 0 0 0 0 0 0 0Grant Funding Tourist Visitor Centre Development 0 (10,640) 0 0 0 0 0 0 0 0 0CLGF– Regional Government (State) 12/13 Seniors Accommodation - Lifestyle Village 0 0 (442,361) 0 0 0 0 0 0 0 0Transfer from Recreation Facilities Reserve Pool Facilities & Change rooms 0 0 (320,000) 0 0 0 0 0 0 0 0
(844,920) (403,001) (955,694) (200,000) 0 0 0 0 0 0 0
Funded by Council (61,962) 1,150,368 1,092,256 1,450,000 1,556,250 1,595,156 1,635,035 1,675,911 1,717,809 1,760,754 1,804,773
Inventories, Property, Plant & Equipment - Asset Capital Expenditure
Projected
Page 12

SHIRE OF YILGARN FINANCIAL PLAN 2013-14 TO 2022-23
FURNITURE & EQUIPMENTBase CBP
2012-13 2013-14 2014-15 2015-16 2016-17 2017-18 2018-19 2019-20 2020-21 2021-22 2022-23 REF
Asset Expenditure Type Project
Additions - Assets at no cost 0 0 0 0 0 0 0 0 0 0 0
0 0 0 0 0 0 0 0 0 0 0
Additions - Expansion, Upgrades and New 0 0 0 0 0 0 0 0 0 0 0 0 0 0 0 0 0 0 0 0 0 0 0 0 0 0 0 0 0 0 0 0 0
Additions - Renewal Server 0 0 0 0 40,000 0 0 0 45,000 0 0 CRC Photocopier 18,201 0 0 0 0 0 0 0 0 30,000 0 Back Room Photocopier 0 0 0 0 0 0 30,000 0 0 0 0 Front Office Photocopier 0 0 0 30,000 0 0 0 0 0 0 0 0 0 0 0 0 0 0 0 0 0 0 18,201 0 0 30,000 40,000 0 30,000 0 45,000 30,000 0
TOTAL FURNITURE & EQUIPMENT CAPITAL EXPENDITURE 18,201 0 0 30,000 40,000 0 30,000 0 45,000 30,000 0
Funding Sources
Lotterywest Grant CRC Photocopier (18,201) 0 0 0 0 0 0 0 0 (28,000) 0Proceeds on Disposal of Assets Proceeds on Disposal of CRC Copier 0 0 0 0 0 0 0 0 0 (2,000) 0Proceeds on Disposal of Assets Proceeds on Disposal of Admin Copier 0 0 0 (2,000) 0 0 (2,000) 0 0 0 0
(18,201) 0 0 (2,000) 0 0 (2,000) 0 0 (30,000) 0
Funded by Council 0 0 0 28,000 40,000 0 28,000 0 45,000 0 0
NB: A reserve exists for the renewal of the above computer equipment and furniture & equipment.
Projected
Inventories, Property, Plant & Equipment - Asset Capital Expenditure
Page 13

SHIRE OF YILGARN FINANCIAL PLAN 2013-14 TO 2022-23
PLANT & EQUIPMENTBase CBP
2012-13 2013-14 2014-15 2015-16 2016-17 2017-18 2018-19 2019-20 2020-21 2021-22 2022-23 REF
Asset Expenditure Type Project
Additions - Assets at no cost 0 0 0 0 0 0 0 0 0 0 0
0 0 0 0 0 0 0 0 0 0 0
Additions - Expansion, Upgrades and New Seating for Constellation Park 5,000 0 0 0 0 0 0 0 0 0 0 S1.2.5
Works Miscellaneous Plant Items 0 23,500 45,000 0 0 0 0 48,000 0 0 0 CL4.4.5
Skeleton Weed Program Minor Plant 5,000 0 0 0 0 0 0 0 0 0 0 10,000 23,500 45,000 0 0 0 0 48,000 0 0 0
Additions - Renewal FESA Vehicles Replaced 410,000 500,000 410,000 410,000 410,000 500,000 0 0 0 500,000 410,000 Doctors Vehicle Replaced 35,000 0 0 0 37,500 0 0 0 0 0 0 S1.10.1
Community Bus Replacement 0 0 0 0 0 150,500 0 0 0 0 0 Community Vehicle Replacement 0 37,500 0 0 0 0 40,000 0 0 0 0 Parks & Gardens Plant Replacement 28,000 0 0 0 0 36,000 0 0 0 0 35,000 Works Major Plant Replacement 353,000 699,000 532,500 350,500 677,156 365,600 585,600 756,229 479,500 747,000 692,500 CL4.4.5
Light Vehicles - Outside Crew Replacement 208,000 48,500 173,566 429,300 196,000 113,616 304,000 0 487,900 262,000 63,000 CL4.4.5
Light Vehicles - Skeleton Weed Program Replacement 40,000 0 0 0 0 52,000 0 0 0 55,000 0 Light Vehicles - Administration Replacement 139,800 102,000 100,300 104,000 103,600 106,300 106,900 108,500 109,700 67,500 155,200 1,213,800 1,387,000 1,216,366 1,293,800 1,424,256 1,324,016 1,036,500 864,729 1,077,100 1,631,500 1,355,700
TOTAL PLANT & EQUIPMENT CAPITAL EXPENDITURE 1,223,800 1,410,500 1,261,366 1,293,800 1,424,256 1,324,016 1,036,500 912,729 1,077,100 1,631,500 1,355,700
Funding Sources
Proceeds on Disposal of Assets FESA Vehicles Proceeds (4,340) (50,000) (41,000) (41,000) (41,000) (50,000) 0 0 0 (50,000) (41,000)Proceeds on Disposal of Assets Doctors Vehicle Proceeds (11,245) 0 0 0 (21,000) 0 0 0 0 0 0Proceeds on Disposal of Assets Community Bus Proceeds 0 0 0 0 0 (40,000) 0 0 0 0 0Proceeds on Disposal of Assets Community Vehicle Proceeds 0 (21,000) 0 0 0 0 (21,000) 0 0 0 0Proceeds on Disposal of Assets Parks & Gardens Plant Proceeds (1,500) 0 0 0 0 (5,000) 0 0 0 0 (3,500)Proceeds on Disposal of Assets Works Major Plant Proceeds (35,000) (159,500) (105,000) (70,000) (140,000) (70,000) (110,000) (160,000) (110,000) (166,000) (100,000)Proceeds on Disposal of Assets Light Vehicles - Outside Crew Proceeds (89,000) (15,000) (94,500) (172,000) (81,500) (50,200) (167,000) 0 (195,000) (124,000) (47,000)Proceeds on Disposal of Assets Light Vehicles - Skeleton Weed Program Proceeds (8,000) 0 0 0 0 (27,000) 0 0 0 (29,000) 0Proceeds on Disposal of Assets Light Vehicles - Administration Proceeds (112,470) (66,600) (76,100) (63,700) (78,500) (65,000) (81,100) (66,200) (82,600) (43,100) (107,900)
(261,555) (312,100) (316,600) (346,700) (362,000) (307,200) (379,100) (226,200) (387,600) (412,100) (299,400)
Funded by Council 962,245 1,098,400 944,766 947,100 1,062,256 1,016,816 657,400 686,529 689,500 1,219,400 1,056,300
NB: A reserve exists for the purchase of the above plant and equipment.
Inventories, Property, Plant & Equipment - Asset Capital Expenditure
Projected
Page 14

Existing Plant
Plant Rego Item Make Year Estd Purchase Net Purchase Net Purchase Net Purchase Net Purchase Net Purchase Net Purchase Net Purchase Net Purchase Net Purchase Net
No Life Disposal Impact Disposal Impact Disposal Impact Disposal Impact Disposal Impact Disposal Impact Disposal Impact Disposal Impact Disposal Impact Disposal Impact
Major Plant
1853 YL542 Construction Grader John Deere 770 2009 8 365,600
(70,000) 295,600
P1864 YL672 Grader John Deere D770 2008 8 370,600
(70,000) 300,600
1848 YL087 Grader John Deere 670 2010 8 354,500
(65,000) 289,500
1844 YL 5199 Grader John Deere 670D 2007 8 347,500 369,500
(65,000) 282,500 (70,000) 299,500
1839 YL 296 Grader Volvo G930 2006 8 343,500 365,500
(60,000) 283,500 (60,000) 305,500
1796 YL595 Roller - vib steel Cat 2011 10 236,500
(55,000) 181,500
1841 YL129 Roller - multi tyre Amman 2006 10 185,000
(40,000) 145,000
1845 YL 5248 Roller - multi tyre Amman 2008 10 215,000
(40,000) 175,000
1840 YL326 Loader CAT 950H 2006 8 355,500 381,500
(99,500) 256,000 (106,000) 275,500
1850 YL 5304 Loader Cat 924H IT 2009 12 243,000
(55,000) 188,000
1813 YL985 Backhoe John Deere 2013 12 168,000
(20,000) 148,000
1875 YL122 Tractor JD 2011 12
1856 YL 117 Prime Mover Iveco 2009 8 350,500
(70,000) 280,500
1865 YL 7059 Semi trailer tipper H. Porter 2010 10 155,500
(25,000) 130,500
1866 YL 7016 Semi trailer tipper 2010 10 155,500
(25,000) 130,500
1733 YL 3311 Float Matrix 2013 15 155,000
(10,000) 145,000
1854 YL 469 Truck - 8 Wheel Mitsubishi 2010 8 322,656
(75,000) 247,656
1833 YL 698 Truck - 8 wheel Mitsubishi 2011 8 335,229
(75,000) 260,229
1851 YL 5302 Skid Steere Loader Cat 2009 10 110,000
(35,000) 75,000
Community Vehicles
YL 414 Community Bus Coaster 2012 80K 150,500
(40,000) 110,500
1CTS586Community Car Mazda CX9 2009 5 37,500 40,000
(21,000) 16,500 (21,000) 19,000
Parks & Gardens Plant
1500 YL 4682 Slasher/Mower Toro SP 2012 10 35,000
(3,500) 31,500
1502 YL 298 Ride-On Turf Mower Toro SP 2007 10 36,000
(5,000) 31,000
Miscellaneous Plant Items
9,000 9,000
14,500 14,500
2010 5 45,000 45,000 48,000 48,000
Light Vehicles - Outside Crew
1835 YL163 Truck - 4 x 4 Canter 2010 5 94,800 112,000
(25,000) 69,800 (35,000) 77,000
1861 YL4949 Truck Dual Cab 4 x 2 Mitsubishi 2010 5 80,000 96,000
(30,000) 50,000 (35,000) 61,000
1863 YL 046 Truck - Maintenance Mitsubishi 2010 5 79,500 96,500
(25,000) 54,500 (30,000) 66,500
1838 YL 120 Truck - (P & G) Canter 2011 5 85,000
(12,500) 72,500
1852 YL121 4 x 4 Ute (P & G) Hilux Ute 2013 3 51,000 57,500 64,500
(22,000) 29,000 (25,000) 32,500 (27,000) 37,500
1870 YL 13 4 x 4 Ute (P&G/NRM) Hilux Ute 2011 3 54,566 50,616 56,900
(13,500) 41,066 (15,200) 35,416 (17,000) 39,900
1867 YL 636 4 x 4 Ute (Handyman) Mazda BT50 2009 3 48,500 51,000 57,500 64,500
(15,000) 33,500 (22,000) 29,000 (25,000) 32,500 (27,000) 37,500
1871 YL645 4 x 4 Ute (Mechanic) Lnd Crs 2011 3 61,000 63,000 64,500
(35,000) 26,000 (35,000) 28,000 (31,000) 33,500
1846 YL 5067 4 x 4 Ute (Works) Lnd Crs 2012 3 62,000 64,000 66,500
(35,000) 27,000 (35,000) 29,000 (35,000) 31,500
1847 YL 38 4 x 4 Ute (Works) Lnd Crs 2012 3 62,000 64,000 66,500
(35,000) 27,000 (35,000) 29,000 (35,000) 31,500
1882 YL333 4 x 4 Ute (Supervisor) Toyota Landcruiser 2012 2 58,000 60,000 61,000 62,000 63,000
(46,000) 12,000 (47,000) 13,000 (47,000) 14,000 (47,000) 15,000 (47,000) 16,000
Light Vehicles - Skeleton Weed Program
1883 YL 399 4 x 4 Ute (Skeleton) Hilux 2012 5 52,000 55,000
(27,000) 25,000 (29,000) 26,000
Light Vehicles - Doctors
1631 YL 152 Sedan(Doctors) Toyota Aurion 2011 2 37,500
(21,000) 16,500
Light Vehicles - Administration
YL 50 SUV (DCE Kluger KX-R (DCEO) 2012 2 39,500 40,300 41,200 42,000 43,700
(22,600) 16,900 (23,100) 17,200 (23,500) 17,700 (24,000) 18,000 (24,700) 19,000
1636 YL 1 Sedan WM Caprice (CEO) 2012 2 62,000 64,500 67,000 69,000 70,000
(50,000) 12,000 (52,000) 12,500 (54,000) 13,000 (55,000) 14,000 (55,000) 15,000
1637 YL 252 Sedan SV6 Commodore (EHO) 2012 2 38,300 39,100 39,900 40,700 41,500
(26,100) 12,200 (26,500) 12,600 (27,100) 12,800 (27,600) 13,100 (28,200) 13,300
1883 YL 150 4x4 Ute (Manager) Prado (MWS) 2012 2 62,500 63,700 65,100 66,500 67,500
(44,000) 18,500 (40,600) 23,100 (41,500) 23,600 (42,200) 24,300 (43,100) 24,400
SHIRE OF YILGARN
10 YEAR PLANT REPLACEMENT PROGRAM
Year 1 Year 2 Year 3 Year 4 Year 5 Year 6 Year 7 Year 8 Year 9 Year 10
2021/20222013/2014 2014/2015 2015/2016 2016/2017 2017/2018 2022/2023
Slasher Attachment for Skid Steere Loader
Rock Breaker/pick Attachment for Backhoe
Water Tank
2018/2019 2019/2020 2020/2021
Page 15
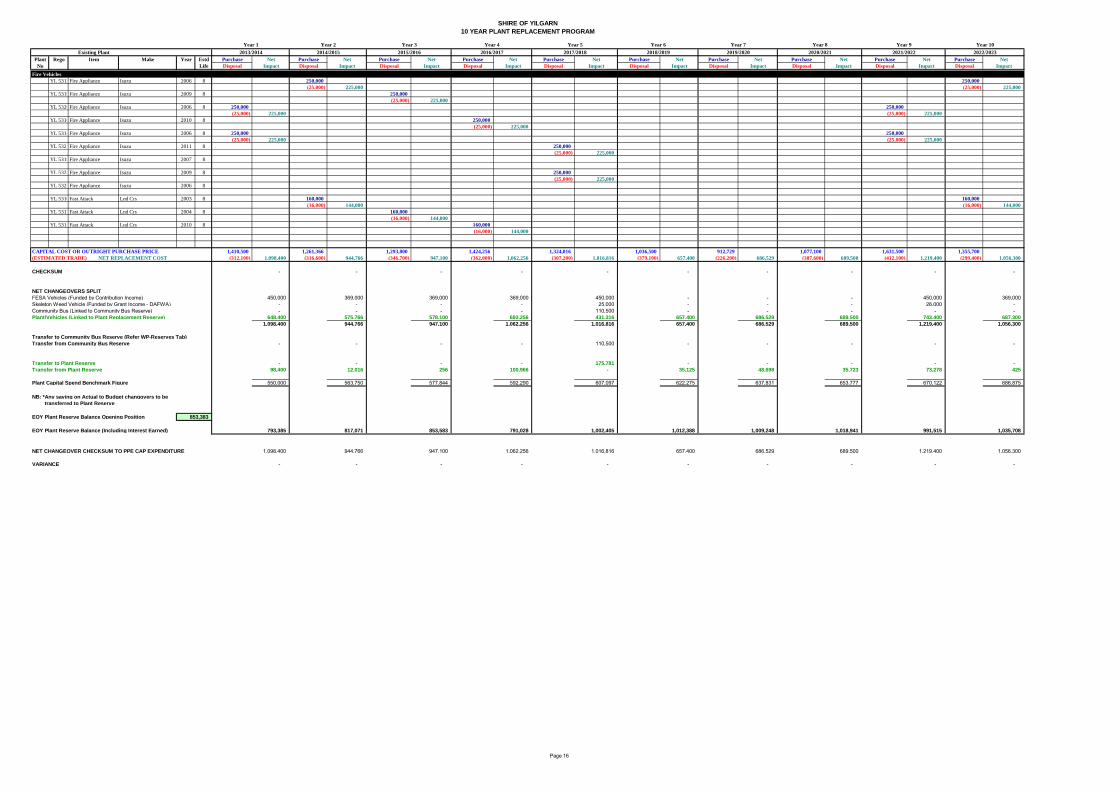
Existing Plant
Plant Rego Item Make Year Estd Purchase Net Purchase Net Purchase Net Purchase Net Purchase Net Purchase Net Purchase Net Purchase Net Purchase Net Purchase Net
No Life Disposal Impact Disposal Impact Disposal Impact Disposal Impact Disposal Impact Disposal Impact Disposal Impact Disposal Impact Disposal Impact Disposal Impact
SHIRE OF YILGARN
10 YEAR PLANT REPLACEMENT PROGRAM
Year 1 Year 2 Year 3 Year 4 Year 5 Year 6 Year 7 Year 8 Year 9 Year 10
2021/20222013/2014 2014/2015 2015/2016 2016/2017 2017/2018 2022/20232018/2019 2019/2020 2020/2021
Fire Vehicles
YL 5313Fire Appliance Isuzu 2006 8 250,000 250,000
(25,000) 225,000 (25,000) 225,000
YL 5319Fire Appliance Isuzu 2009 8 250,000
(25,000) 225,000
YL 5320Fire Appliance Isuzu 2006 8 250,000 250,000
(25,000) 225,000 (25,000) 225,000
YL 5316Fire Appliance Isuzu 2010 8 250,000
(25,000) 225,000
YL 5314Fire Appliance Isuzu 2006 8 250,000 250,000
(25,000) 225,000 (25,000) 225,000
YL 5321Fire Appliance Isuzu 2011 8 . 250,000
(25,000) 225,000
YL 5318Fire Appliance Isuzu 2007 8
YL 5323Fire Appliance Isuzu 2009 8 250,000
(25,000) 225,000
YL 5322Fire Appliance Isuzu 2006 8
YL 5310Fast Attack Lnd Crs 2003 8 160,000 160,000
(16,000) 144,000 (16,000) 144,000
YL 5317Fast Attack Lnd Crs 2004 8 160,000
(16,000) 144,000
YL 5315Fast Attack Lnd Crs 2010 8 160,000
(16,000) 144,000
CAPITAL COST OR OUTRIGHT PURCHASE PRICE 1,410,500 1,261,366 1,293,800 1,424,256 1,324,016 1,036,500 912,729 1,077,100 1,631,500 1,355,700
(312,100) 1,098,400 (316,600) 944,766 (346,700) 947,100 (362,000) 1,062,256 (307,200) 1,016,816 (379,100) 657,400 (226,200) 686,529 (387,600) 689,500 (412,100) 1,219,400 (299,400) 1,056,300
CHECKSUM - - - - - - - - - -
NET CHANGEOVERS SPLIT
FESA Vehicles (Funded by Contribution Income) 450,000 369,000 369,000 369,000 450,000 - - - 450,000 369,000 Skeleton Weed Vehicle (Funded by Grant Income - DAFWA) - - - - 25,000 - - - 26,000 - Community Bus (Linked to Community Bus Reserve) - - - - 110,500 - - - - - Plant/Vehicles (Linked to Plant Replacement Reserve) 648,400 575,766 578,100 693,256 431,316 657,400 686,529 689,500 743,400 687,300
1,098,400 944,766 947,100 1,062,256 1,016,816 657,400 686,529 689,500 1,219,400 1,056,300
Transfer to Community Bus Reserve (Refer WP-Reserves Tab)
Transfer from Community Bus Reserve - - - - 110,500 - - - - -
Transfer to Plant Reserve - - - - 175,781 - - - - -
Transfer from Plant Reserve 98,400 12,016 256 100,966 - 35,125 48,698 35,723 73,278 425
Plant Capital Spend Benchmark Figure 550,000 563,750 577,844 592,290 607,097 622,275 637,831 653,777 670,122 686,875
NB: *Any saving on Actual to Budget changovers to be
NB: *transferred to Plant Reserve
EOY Plant Reserve Balance Opening Position
EOY Plant Reserve Balance (Including Interest Earned) 793,385 817,071 853,583 791,028 1,002,405 1,012,388 1,009,248 1,018,941 991,515 1,035,708
NET CHANGEOVER CHECKSUM TO PPE CAP EXPENDITURE 1,098,400 944,766 947,100 1,062,256 1,016,816 657,400 686,529 689,500 1,219,400 1,056,300
VARIANCE - - - - - - - - - -
853,383
(ESTIMATED TRADE) NET REPLACEMENT COST
Page 16

Year 1 Year 2 Year 3 Year 4 Year 5 Year 6 Year 7 Year 8 Year 9 Year 10
Item 2013/2014 2014/2015 2015/2016 2016/2017 2017/2018 2018/2019 2019/2020 2020/2021 2021/2022 2022/2023
Computers (3 per year) 4,000 4,000 4,000 4,000 4,000 4,000 4,000 4,000 4,000 4,000
Software upgrades 10,500 10,500 10,500 10,500
Server 40,000 45,000
Telephones 2,000 2,000 2,000
Mobile Telephones 3,000 3,000 3,000
Councillor iPads (previously laptops) 9,000 9,000 9,000
Officer Laptops 7,200 7,200
Mini Notepads 1,200 1,400 1,500
CRC Photocopier 30,000
Back Room Photocopier 30,000
Front Office Photocopier 30,000
24,700 11,200 39,000 54,500 14,400 39,000 21,700 49,000 40,500 23,500
Represented By:
Operating
Expenditure under Capitalisation Theshold 24,700 11,200 9,000 14,500 14,400 9,000 21,700 4,000 10,500 23,500Capital
Additions - Assets at no costAdditions - Expansion, Upgrades and NewAdditions - Renewal 0 0 30,000 40,000 0 30,000 0 45,000 30,000 0
24,700 11,200 39,000 54,500 14,400 39,000 21,700 49,000 40,500 23,500
Less:
Fully Funded Purchases 0 0 0 0 0 0 0 0 (28,000) 0Proceeds on Disposal - Admin Copiers (2,000) (2,000)Proceeds on Disposal - CRC Copier (2,000)
0 0 (2,000) 0 0 (2,000) 0 0 (30,000) 0
Net Capital Purchases 24,700 11,200 37,000 54,500 14,400 37,000 21,700 49,000 10,500 23,500
Opening F&E Reserve Balance 48,434 48,734 65,352 57,559 32,572 47,234 40,646 49,768 32,726 54,160Transfer to F&E Reserve 300 14,425 0 0 13,196 0 7,293 0 19,961 7,723Transfer from F&E Reserve 0 0 (10,734) (27,577) 0 (8,714) 0 (19,282) 0 0Interest Transferred to Reserve 0 2,193 2,941 2,590 1,466 2,126 1,829 2,240 1,473 2,437Benchmark figure (Increased by CPI Annually) 25,000 25,625 26,266 26,923 27,596 28,286 28,993 29,718 30,461 31,223
Closing F&E Reserve Balance 48,734 65,352 57,559 32,572 47,234 40,646 49,768 32,726 54,160 64,320
NB: The program above does not include all expenditure associated with ICT and F&E. Additional expenditure items such as Photocopier Maintenance, Toners, Printer cartridges, etc.
NB: are included under the general operations of Council.
10 Year ICT / Furniture & Equipment Program
Page 17

SHIRE OF YILGARN FINANCIAL PLAN 2013-14 TO 2022-23
#
ROADS - CLEARING & EARTHWORKSBase CBP
2012-13 2013-14 2014-15 2015-16 2016-17 2017-18 2018-19 2019-20 2020-21 2021-22 2022-23 REF
Asset Expenditure Type Project
Additions - Assets at no cost 0 0 0 0 0 0 0 0 0 0 0 E3.4.2
0 0 0 0 0 0 0 0 0 0 0
Additions - Expansion, Upgrades and New RRG Clearing & Earthworks 0 0 0 0 0 0 0 0 0 0 0 E3.4.2
RTR Clearing & Earthworks 108,024 117,941 33,229 57,031 38,220 20,801 117,941 33,229 57,031 38,220 20,801 E3.4.2
Council Funded Clearing & Earthworks 239,527 187,093 193,945 163,057 145,446 151,263 187,093 193,945 163,057 145,446 151,263 E3.4.2
HVRIC Funded Clearing & Earthworks 0 0 0 0 0 0 0 0 0 0 0 E3.4.2
347,551 305,034 227,173 220,088 183,666 172,065 305,034 227,173 220,088 183,666 172,065
Additions - Renewal RRG Clearing & Earthworks 432,441 444,436 422,251 380,026 399,027 418,976 444,436 422,251 380,026 399,027 418,976 E3.4.2
RTR Clearing & Earthworks 190,328 0 281,614 236,556 262,071 262,289 0 281,614 236,556 262,071 262,289 E3.4.2
Council Funded Clearing & Earthworks 0 0 0 0 0 0 0 0 0 0 0 E3.4.2
HVRIC Funded Clearing & Earthworks 0 0 0 0 0 0 0 0 0 0 0 E3.4.2
622,769 444,436 703,865 616,581 661,098 681,265 444,436 703,865 616,581 661,098 681,265
TOTAL ROAD CAPITAL EXPENDITURE 970,321 749,470 931,038 836,669 844,763 853,330 749,470 931,038 836,669 844,763 853,330
Funding Sources
Regional Road Grants RRG Clearing & Earthworks (288,294) (296,291) (281,500) (253,350) (266,018) (279,317) (296,291) (281,500) (253,350) (266,018) (279,317)Roads To Recovery Grant RTR Clearing & Earthworks (298,352) (117,941) (314,843) (293,586) (300,291) (283,091) (117,941) (314,843) (293,586) (300,291) (283,091)
(586,646) (414,232) (596,343) (546,936) (566,309) (562,408) (414,232) (596,343) (546,936) (566,309) (562,408)
Funded by Council 383,675 335,238 334,695 289,733 278,454 290,923 335,238 334,695 289,733 278,454 290,923
Projected
Infrastructure - Asset Capital Expenditure
Page 18

SHIRE OF YILGARN FINANCIAL PLAN 2013-14 TO 2022-23
ROADS - GRAVELBase CBP
2012-13 2013-14 2014-15 2015-16 2016-17 2017-18 2018-19 2019-20 2020-21 2021-22 2022-23 REF
Asset Expenditure Type Project
Additions - Assets at no cost 0 0 0 0 0 0 0 0 0 0 0 E3.4.2
0 0 0 0 0 0 0 0 0 0 0
Additions - Expansion, Upgrades and New RRG Gravel Works 0 0 0 0 0 0 0 0 0 0 0 E3.4.2
RTR Gravel Works 149,176 162,872 45,887 78,756 52,780 28,726 162,872 45,887 78,756 52,780 28,726 E3.4.2
Council Funded Gravel Works 318,403 258,366 267,828 225,174 200,853 208,888 258,366 267,828 225,174 200,853 208,888 E3.4.2
HVRIC Funded Gravel Works 0 0 0 0 0 0 0 0 0 0 0 VARIOUS
467,579 421,238 313,716 303,930 253,633 237,613 421,238 313,716 303,930 253,633 237,613
Additions - Renewal RRG Gravel Works 0 0 0 0 0 0 0 0 0 0 0 E3.4.2
RTR Gravel Works 0 0 0 0 0 0 0 0 0 0 0 E3.4.2
Council Funded Gravel Works 0 0 0 0 0 0 0 0 0 0 0 E3.4.2
HVRIC Funded Gravel Works 0 0 0 0 0 0 0 0 0 0 0 VARIOUS
0 0 0 0 0 0 0 0 0 0 0
TOTAL ROAD CAPITAL EXPENDITURE 467,579 421,238 313,716 303,930 253,633 237,613 421,238 313,716 303,930 253,633 237,613
Funding Sources
Regional Road Grants 0 0 0 0 0 0 0 0 0 0 0Roads To Recovery Grant (149,176) (162,872) (45,887) (78,756) (52,780) (28,726) (162,872) (45,887) (78,756) (52,780) (28,726)
(149,176) (162,872) (45,887) (78,756) (52,780) (28,726) (162,872) (45,887) (78,756) (52,780) (28,726)
Funded by Council 318,403 258,366 267,828 225,174 200,853 208,888 258,366 267,828 225,174 200,853 208,888
Infrastructure - Asset Capital Expenditure
Projected
Page 19

SHIRE OF YILGARN FINANCIAL PLAN 2013-14 TO 2022-23
ROADS - SEALEDBase CBP
2012-13 2013-14 2014-15 2015-16 2016-17 2017-18 2018-19 2019-20 2020-21 2021-22 2022-23 REF
Asset Expenditure Type Project
Additions - Assets at no cost 0 0 0 0 0 0 0 0 0 0 0 E3.4.2
0 0 0 0 0 0 0 0 0 0 0
Additions - Expansion, Upgrades and New RRG Sealing Works 0 0 0 0 0 0 0 0 0 0 0 E3.4.2
RTR Sealing Works 0 0 0 0 0 0 0 0 0 0 0 E3.4.2
Council Funded Sealing Works 0 0 0 0 0 0 0 0 0 0 0 E3.4.2
HVRIC Funded Sealing Works 0 0 0 0 0 0 0 0 0 0 0 VARIOUS
0 0 0 0 0 0 0 0 0 0 0
Additions - Renewal RRG Sealing Works 500,539 566,339 598,991 654,206 618,193 642,797 566,339 598,991 654,206 618,193 642,797 E3.4.2
RTR Sealing Works 117,482 284,187 204,270 192,657 212,099 253,184 284,187 204,270 192,657 212,099 253,184 E3.4.2
Council Funded Sealing Works 230,140 243,849 223,448 138,291 0 0 243,849 223,448 138,291 0 0 E3.4.2
Council Funded Additional Sealing Works 0 0 0 0 250,000 256,250 262,656 269,222 275,953 282,852 289,923 E3.4.2
HVRIC Funded Sealing Works 0 209,234 92,791 95,111 97,489 99,926 102,424 104,985 107,610 110,300 113,058 VARIOUS
848,161 1,303,609 1,119,500 1,080,266 1,177,781 1,252,157 1,459,455 1,400,916 1,368,718 1,223,444 1,298,962
TOTAL ROAD CAPITAL EXPENDITURE 848,161 1,303,609 1,119,500 1,080,266 1,177,781 1,252,157 1,459,455 1,400,916 1,368,718 1,223,444 1,298,962
Funding Sources
Regional Road Grants (333,693) (377,559) (399,328) (436,138) (412,128) (428,531) (377,559) (399,328) (436,138) (412,128) (428,531)Roads To Recovery Grant (117,482) (284,187) (204,270) (192,657) (212,099) (253,184) (284,187) (204,270) (192,657) (212,099) (253,184)
(451,175) (661,746) (603,598) (628,795) (624,227) (681,715) (661,746) (603,598) (628,795) (624,227) (681,715)
Funded by Council 396,986 641,863 515,902 451,470 553,554 570,442 797,709 797,318 739,922 599,217 617,247
Infrastructure - Asset Capital Expenditure
Projected
Page 20

SHIRE OF YILGARN FINANCIAL PLAN 2013-14 TO 2022-23
ROADS - KERBINGBase CBP
2012-13 2013-14 2014-15 2015-16 2016-17 2017-18 2018-19 2019-20 2020-21 2021-22 2022-23 REF
Asset Expenditure Type Project
Additions - Assets at no cost 0 0 0 0 0 0 0 0 0 0 0 E3.4.2
0 0 0 0 0 0 0 0 0 0 0
Additions - Expansion, Upgrades and New RRG Kerbing Works 0 0 0 0 0 0 0 0 0 0 0 E3.4.2
RTR Kerbing Works 0 0 0 0 0 0 0 0 0 0 0 E3.4.2
Council Funded Kerbing Works 0 0 0 0 0 0 0 0 0 0 0 E3.4.2
HVRIC Funded Kerbing Works 0 0 0 0 0 0 0 0 0 0 0 VARIOUS
0 0 0 0 0 0 0 0 0 0 0
Additions - Renewal RRG Kerbing Works 0 0 0 0 0 0 0 0 0 0 0 E3.4.2
RTR Kerbing Works 0 0 0 0 0 0 0 0 0 0 0 E3.4.2
Council Funded Kerbing Works 0 0 0 0 0 0 0 0 0 0 0 E3.4.2
HVRIC Funded Kerbing Works 0 0 0 0 0 0 0 0 0 0 0 VARIOUS
0 0 0 0 0 0 0 0 0 0 0
TOTAL ROAD CAPITAL EXPENDITURE 0 0 0 0 0 0 0 0 0 0 0
Funding Sources
Regional Road Grants 0 0 0 0 0 0 0 0 0 0 0Roads To Recovery Grant 0 0 0 0 0 0 0 0 0 0 0
0 0 0 0 0 0 0 0 0 0 0
Funded by Council 0 0 0 0 0 0 0 0 0 0 0
Infrastructure - Asset Capital Expenditure
Projected
Page 21
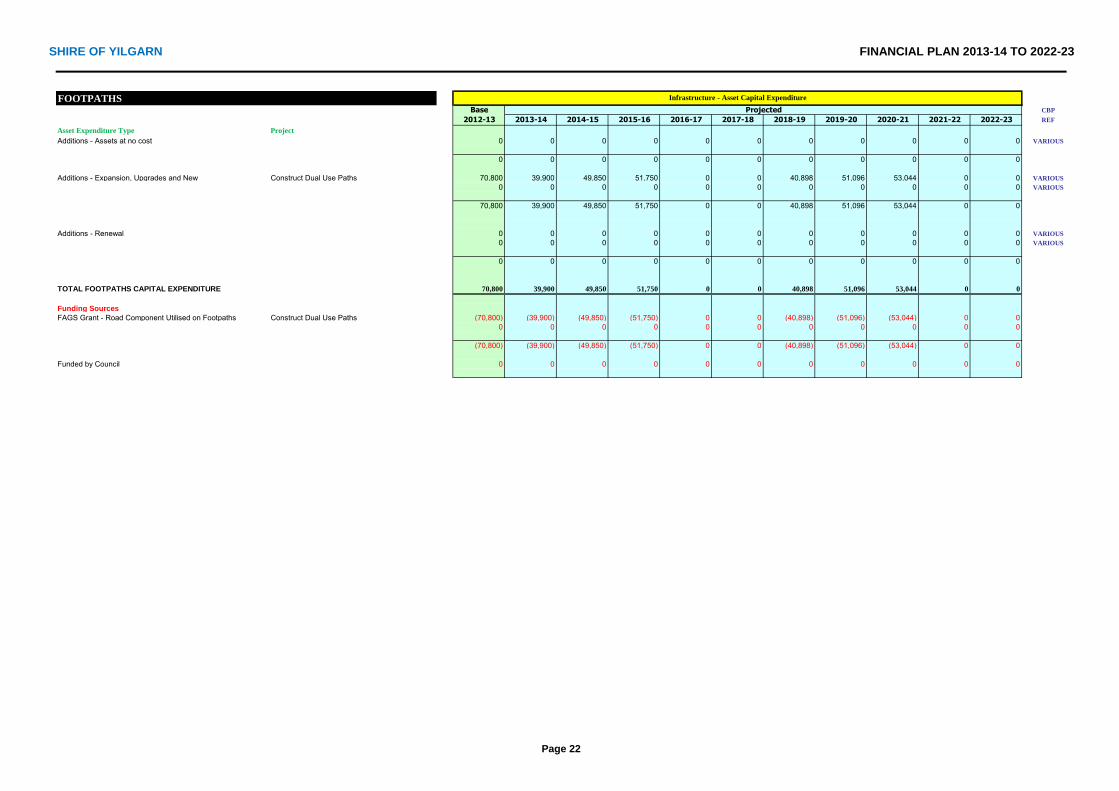
SHIRE OF YILGARN FINANCIAL PLAN 2013-14 TO 2022-23
FOOTPATHSBase CBP
2012-13 2013-14 2014-15 2015-16 2016-17 2017-18 2018-19 2019-20 2020-21 2021-22 2022-23 REF
Asset Expenditure Type Project
Additions - Assets at no cost 0 0 0 0 0 0 0 0 0 0 0 VARIOUS
0 0 0 0 0 0 0 0 0 0 0
Additions - Expansion, Upgrades and New Construct Dual Use Paths 70,800 39,900 49,850 51,750 0 0 40,898 51,096 53,044 0 0 VARIOUS
0 0 0 0 0 0 0 0 0 0 0 VARIOUS
70,800 39,900 49,850 51,750 0 0 40,898 51,096 53,044 0 0
Additions - Renewal 0 0 0 0 0 0 0 0 0 0 0 VARIOUS
0 0 0 0 0 0 0 0 0 0 0 VARIOUS
0 0 0 0 0 0 0 0 0 0 0
TOTAL FOOTPATHS CAPITAL EXPENDITURE 70,800 39,900 49,850 51,750 0 0 40,898 51,096 53,044 0 0
Funding Sources
FAGS Grant - Road Component Utilised on Footpaths Construct Dual Use Paths (70,800) (39,900) (49,850) (51,750) 0 0 (40,898) (51,096) (53,044) 0 00 0 0 0 0 0 0 0 0 0 0
(70,800) (39,900) (49,850) (51,750) 0 0 (40,898) (51,096) (53,044) 0 0
Funded by Council 0 0 0 0 0 0 0 0 0 0 0
Infrastructure - Asset Capital Expenditure
Projected
Page 22

SHIRE OF YILGARN FINANCIAL PLAN 2013-14 TO 2022-23
DRAINAGEBase CBP
2012-13 2013-14 2014-15 2015-16 2016-17 2017-18 2018-19 2019-20 2020-21 2021-22 2022-23 REF
Asset Expenditure Type Project
Additions - Assets at no cost 0 0 0 0 0 0 0 0 0 0 0
0 0 0 0 0 0 0 0 0 0 0
Additions - Expansion, Upgrades and New 0 0 0 0 0 0 0 0 0 0 0 0 0 0 0 0 0 0 0 0 0 0 0 0 0 0 0 0 0 0 0 0 0
Additions - Renewal Improve Stormwater Drainage 20,400 33,956 35,653 37,436 39,308 41,273 34,805 36,544 38,372 40,291 42,305 EN2.1.8
0 0 0 0 0 0 0 0 0 0 0 20,400 33,956 35,653 37,436 39,308 41,273 34,805 36,544 38,372 40,291 42,305
TOTAL DRAINAGE CAPITAL EXPENDITURE 20,400 33,956 35,653 37,436 39,308 41,273 34,805 36,544 38,372 40,291 42,305
Funding Sources
0 0 0 0 0 0 0 0 0 0 00 0 0 0 0 0 0 0 0 0 0
0 0 0 0 0 0 0 0 0 0 0
Funded by Council 20,400 33,956 35,653 37,436 39,308 41,273 34,805 36,544 38,372 40,291 42,305
Projected
Infrastructure - Asset Capital Expenditure
Page 23

SHIRE OF YILGARN FINANCIAL PLAN 2013-14 TO 2022-23
PARKS AND OVALSBase CBP
2012-13 2013-14 2014-15 2015-16 2016-17 2017-18 2018-19 2019-20 2020-21 2021-22 2022-23 REF
Asset Expenditure Type Project
Additions - Assets at no cost 0 0 0 0 0 0 0 0 0 0 0
0 0 0 0 0 0 0 0 0 0 0
Additions - Expansion, Upgrades and New Complete Upgrade of Power Outlets (SX Oval) 5,000 0 0 0 0 0 0 0 0 0 0 Upgrade Lights SX Oval 0 0 0 500,000 0 0 0 0 0 0 0 S1.12.2
0 0 0 0 0 0 0 0 0 0 0
5,000 0 0 500,000 0 0 0 0 0 0 0
Additions - Renewal Remove and Replace Football Railing 30,000 0 0 0 0 0 0 0 0 0 0 0 0 0 0 0 0 0 0 0 0 0 30,000 0 0 0 0 0 0 0 0 0 0
TOTAL PARKS AND OVALS CAPITAL EXPENDITURE 35,000 0 0 500,000 0 0 0 0 0 0 0
Funding Sources
CSRFF Grant Upgrade Lights SX Oval 0 0 0 (166,000) 0 0 0 0 0 0 0Lotterywest Grant 0 0 0 0 0 0 0 0 0 0 0
0 0 0 (166,000) 0 0 0 0 0 0 0
Funded by Council 35,000 0 0 334,000 0 0 0 0 0 0 0
Infrastructure - Asset Capital Expenditure
Projected
Page 24
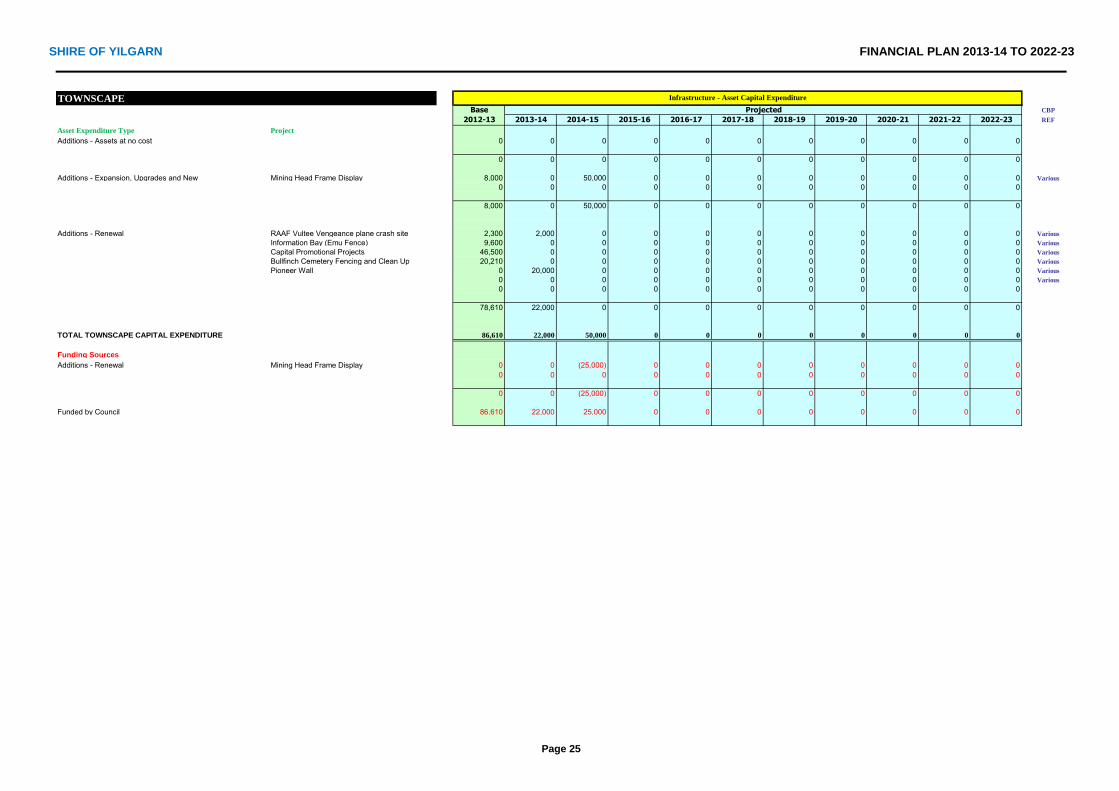
SHIRE OF YILGARN FINANCIAL PLAN 2013-14 TO 2022-23
TOWNSCAPEBase CBP
2012-13 2013-14 2014-15 2015-16 2016-17 2017-18 2018-19 2019-20 2020-21 2021-22 2022-23 REF
Asset Expenditure Type Project
Additions - Assets at no cost 0 0 0 0 0 0 0 0 0 0 0
0 0 0 0 0 0 0 0 0 0 0
Additions - Expansion, Upgrades and New Mining Head Frame Display 8,000 0 50,000 0 0 0 0 0 0 0 0 Various
0 0 0 0 0 0 0 0 0 0 0 8,000 0 50,000 0 0 0 0 0 0 0 0
Additions - Renewal RAAF Vultee Vengeance plane crash site 2,300 2,000 0 0 0 0 0 0 0 0 0 Various
Information Bay (Emu Fence) 9,600 0 0 0 0 0 0 0 0 0 0 Various
Capital Promotional Projects 46,500 0 0 0 0 0 0 0 0 0 0 Various
Bullfinch Cemetery Fencing and Clean Up 20,210 0 0 0 0 0 0 0 0 0 0 Various
Pioneer Wall 0 20,000 0 0 0 0 0 0 0 0 0 Various
0 0 0 0 0 0 0 0 0 0 0 Various
0 0 0 0 0 0 0 0 0 0 0
78,610 22,000 0 0 0 0 0 0 0 0 0
TOTAL TOWNSCAPE CAPITAL EXPENDITURE 86,610 22,000 50,000 0 0 0 0 0 0 0 0
Funding Sources
Additions - Renewal Mining Head Frame Display 0 0 (25,000) 0 0 0 0 0 0 0 00 0 0 0 0 0 0 0 0 0 0
0 0 (25,000) 0 0 0 0 0 0 0 0
Funded by Council 86,610 22,000 25,000 0 0 0 0 0 0 0 0
Infrastructure - Asset Capital Expenditure
Projected
Page 25

SHIRE OF YILGARN FINANCIAL PLAN 2013-14 TO 2022-23
REFUSEBase CBP
2012-13 2013-14 2014-15 2015-16 2016-17 2017-18 2018-19 2019-20 2020-21 2021-22 2022-23 REF
Asset Expenditure Type Project
Additions - Assets at no cost 0 0 0 0 0 0 0 0 0 0 0
0 0 0 0 0 0 0 0 0 0 0
Additions - Expansion, Upgrades and New 0 0 0 0 0 0 0 0 0 0 0 0 0 0 0 0 0 0 0 0 0 0 0 0 0 0 0 0 0 0 0 0 0
0 0 0 0 0 0 0 0 0 0 0 0 0 0 0 0 0 0 0 0 0 0 0 0 0 0 0 0 0 0 0 0 0 0 0 0 0 0 0 0 0 0 0 0
0 0 0 0 0 0 0 0 0 0 0
0 0 0 0 0 0 0 0 0 0 0
TOTAL REFUSE CAPITAL EXPENDITURE 0 0 0 0 0 0 0 0 0 0 0
Funding Sources
0 0 0 0 0 0 0 0 0 0 00 0 0 0 0 0 0 0 0 0 0
0 0 0 0 0 0 0 0 0 0 0
Funded by Council 0 0 0 0 0 0 0 0 0 0 0
Infrastructure - Asset Capital Expenditure
Projected
Page 26

SHIRE OF YILGARN FINANCIAL PLAN 2013-14 TO 2022-23
SEWERAGEBase CBP
2012-13 2013-14 2014-15 2015-16 2016-17 2017-18 2018-19 2019-20 2020-21 2021-22 2022-23 REF
Asset Expenditure Type Project
Additions - Assets at no cost 0 0 0 0 0 0 0 0 0 0 0
0 0 0 0 0 0 0 0 0 0 0
Additions - Expansion, Upgrades and New Southern Cross Sewerage Treatment 34,700 50,000 0 0 0 0 0 0 0 0 0 Marvel Loch Sewerage Treatment 26,200 0 60,000 0 0 0 0 0 0 0 0 Energy Conservation Project - Sewerage 0 0 0 30,000 0 0 0 0 0 0 0 60,900 50,000 60,000 30,000 0 0 0 0 0 0 0 Additions - Renewal 0 0 0 0 0 0 0 0 0 0 0 0 0 0 0 0 0 0 0 0 0 0 0 0 0 0 0 0 0 0 0 0 0 0 0 0 0 0 0 0 0 0 0 0 0 0 0 0 0 0 0 0 0 0 0
0 0 0 0 0 0 0 0 0 0 0
TOTAL SEWERAGE CAPITAL EXPENDITURE 60,900 50,000 60,000 30,000 0 0 0 0 0 0 0
Funding Sources
Sewerage Charge Southern Cross Sewerage Treatment (34,700) (50,000) 0 0 0 0 0 0 0 0 0Sewerage Charge Marvel Loch Sewerage Treatment (26,200) 0 (60,000) 0 0 0 0 0 0 0 0
(60,900) (50,000) (60,000) 0 0 0 0 0 0 0 0
Funded by Council 0 0 0 30,000 0 0 0 0 0 0 0
Infrastructure - Asset Capital Expenditure
Projected
Page 27

SHIRE OF YILGARN FINANCIAL PLAN 2013-14 TO 2022-23
AERODROMESBase CBP
2012-13 2013-14 2014-15 2015-16 2016-17 2017-18 2018-19 2019-20 2020-21 2021-22 2022-23 REF
Asset Expenditure Type Project
Additions - Assets at no cost 0 0 0 0 0 0 0 0 0 0 0
0 0 0 0 0 0 0 0 0 0 0
Additions - Expansion, Upgrades and New 0 0 0 0 0 0 0 0 0 0 0 0 0 0 0 0 0 0 0 0 0 0 0 0 0 0 0 0 0 0 0 0 0
Additions - Renewal Airstrip Runway 09/27 - Gravel Overlay 208,680 0 0 0 0 0 214,146 0 0 0 0 0 0 0 0 0 0 0 0 0 0 0 208,680 0 0 0 0 0 214,146 0 0 0 0
TOTAL AERODROMES CAPITAL EXPENDITURE 208,680 0 0 0 0 0 214,146 0 0 0 0
Funding Sources
RADS Grant Funding Airstrip Runway 09/27 - Gravel Overlay (98,700) 0 0 0 0 0 (103,711) 0 0 0 00 0 0 0 0 0 0 0 0 0 0
(98,700) 0 0 0 0 0 (103,711) 0 0 0 0
Funded by Council 109,980 0 0 0 0 0 110,435 0 0 0 0
Infrastructure - Asset Capital Expenditure
Projected
Page 28

SHIRE OF YILGARN FINANCIAL PLAN 2013-14 TO 2022-23
OTHER INFRASTRUCTUREBase CBP
2012-13 2013-14 2014-15 2015-16 2016-17 2017-18 2018-19 2019-20 2020-21 2021-22 2022-23 REF
Asset Expenditure Type Project
Additions - Assets at no cost 0 0 0 0 0 0 0 0 0 0 0
0 0 0 0 0 0 0 0 0 0 0
Additions - Expansion, Upgrades and New Tennis Courts Fencing & Lighting 70,000 0 0 0 0 0 0 0 0 0 0 S1.12.4
Construct a new fixed concrete skate park. 0 51,000 350,000 0 0 0 0 0 0 0 0 S1.12.4
0 0 0 0 0 0 0 0 0 0 0 70,000 51,000 350,000 0 0 0 0 0 0 0 0
Additions - Renewal Resurfacing Tennis Courts 350,000 0 0 0 0 0 0 0 0 0 0 0 0 0 0 0 0 0 0 0 0 0 0 0 0 0 0 0 0 0 0 0 0 0 0 0 0 0 0 0 0 0 0 0 0 0 0 0 0 0 0 0 0 0 0
350,000 0 0 0 0 0 0 0 0 0 0
TOTAL OTHER INFRASTRUCTURE CAPITAL EXPENDITURE 420,000 51,000 350,000 0 0 0 0 0 0 0 0
Funding Sources
CSRFF Funding Tennis Courts (48,415) 0 0 0 0 0 0 0 0 0 0CSRFF Funding Construct a new fixed concrete skate park. 0 0 (116,666) 0 0 0 0 0 0 0 0
(48,415) 0 (116,666) 0 0 0 0 0 0 0 0
Funded by Council 371,585 51,000 233,334 0 0 0 0 0 0 0 0
Projected
Infrastructure - Asset Capital Expenditure
Page 29