shelter assessment manager - reach resource · pdf fileshelter assessment loreto ... to issue...
TRANSCRIPT

SHELTER CLUSTER ASSESSMENT
IN LORETO, PERU
SHELTER CLUSTER REPORT
FINAL ASSESSMENT REPORT
JULY 2012
A product of
Funded by

The assessment was facilitated (in the framework of the shelter cluster) by REACH, an interagency program of IMPACT
Initiatives (IMPACT).
REACH was born in 2010 as a joint initiative of two INGOs (IMPACT and ACTED) and one UN program (UNOSAT).
Based in Geneva, REACH operates through global advocacy and country-level deployments.
REACH‟s purpose is to promote and facilitate the development of information products that enhance the humanitarian
community‟s decision making and planning capacity.
REACH‟s overall objective is to enhance the effectiveness of planning and coordination by aid actors in countries that
are in crisis or at-risk of crisis.
Since 2011 REACH has formalized a partnership with the Global Shelter Cluster (GSC) to support the strengthening of its
coordination and planning capacity, with financial support from the European Commission Humanitarian Aid Office.
Dedicated REACH teams (including assessment, database and mapping experts) are available to be rapidly deployed to
the field in the aftermath of future emergencies in order to facilitate interagency assessments and mapping activities on
behalf of the shelter cluster. Resulting information products are used to enable better planning and coordination by the
cluster, and are widely disseminated.
REACH‟s partnership with the GSC is directed by a dedicated Steering Committee including representatives from ACTED,
IFRC (as GSC co-lead), IMPACT, the European Commission‟s Joint Research Centre and UNOSAT.
www.reach-initiative.org
This document has been produced with the
financial assistance of the European
Commission. The views expressed herein
should not be taken, in any way, to reflect
the official opinion of the European
Commission.
IMPACT HEAD OFFICE Chemin de Balexert, 7 1219 Châtelaine – Switzerland Phone: +41 (0) 22 566 2963 [email protected] www.impact-initiatives.org

TABLE OF CONTENTS
Acronyms ............................................................................................................................................................................. 1
Geographic Classifications ................................................................................................................................................ 1
1. Executive Summary ................................................................................................................................................. 2
1.1. Context ..................................................................................................................................................................... 2
1.2. Assessment Methodology ........................................................................................................................................ 3
1.3. Conclusion and Recommendations ......................................................................................................................... 5
2. Context of the Flood Events 2012 in Peru ............................................................................................................. 7
3. Assessment Methodology ...................................................................................................................................... 9
3.1. Objectives ................................................................................................................................................................ 9
3.2. Coordination with Clusters, Agencies....................................................................................................................... 9
3.3. General Methodology ............................................................................................................................................... 9
3.4. Assessment Area ................................................................................................................................................... 10
3.5. Training, Logistics and Human Resources ............................................................................................................. 12
3.6. Scope of Assessment ............................................................................................................................................ 13
4. Assessment Results .............................................................................................................................................. 15
4.1. Demographic Characteristics ................................................................................................................................. 16
4.2. Displacement ......................................................................................................................................................... 19
4.3. Socio Economic Context ........................................................................................................................................ 22
4.4. Shelter Profile......................................................................................................................................................... 27
4.5. Shelter Needs ........................................................................................................................................................ 34
4.6. WaSH Situation in Shelters .................................................................................................................................... 37
4.7. Non-Shelter Household Needs .............................................................................................................................. 39
4.8. Household Risk / Disaster Preparedness............................................................................................................... 41
5. Conclusions & Recommendations ....................................................................................................................... 44
List of Annexes to this Report ......................................................................................................................................... 47

FIGURES AND TABLES
Figure 1: Typical flood damage experienced in the semi-urban neighbourhoods in Punchana, Iquitos ................ iv
Figure 2: Rainfall as % of normal cumulative precipitation between the 1st February and 20th March 2012 ........ 7
Figure 3: River height measured in meters above sea level compared to previous established records ............... 7
Figure 4: Geographical Coverage of the Assessment Conducted, Including Demarcation of Zones ................... 14
Figure 5: Age Profile of Surveyed Population ...................................................................................................... 16
Figure 6: Average Length of Stay of Families in Locations at Time of Flooding .................................................. 16
Figure 7: Most Vulnerable Households subset by Priority ................................................................................... 18
Figure 8: % of RURAL Communities Reporting Displacement ............................................................................ 19
Figure 9: Destination of Displaced Community Members .................................................................................... 20
Figure 10: Reasons for Selection of Evacuation Site ........................................................................................... 20
Figure 11: SHELTER Conditions Experienced at Evacuation Sites ..................................................................... 21
Figure 12: % of Displaced Families within the Community that have already Returned ...................................... 21
Figure 13: Period in which Returns Occurred ...................................................................................................... 21
Figure 14: Primary Sources of Income by Location (Urban / Rural) ..................................................................... 22
Figure 15: Impact of Floods on Primary Income Source ...................................................................................... 23
Figure 16: Average Household Income, Poverty Incidence ................................................................................. 24
Figure 17: Sectors of Community that were cited as having been Damaged as a Result of Floods .................... 24
Figure 18: Top Three Most Affected Categories subset by Location ................................................................... 25
Figure 19: Top Three Most Important Livelihood Activities subset by Location ................................................... 26
Figure 20: Top Three Highest Expenditure Categories subset by Location ......................................................... 26
Figure 21: Land Ownership Structure .................................................................................................................. 27
Figure 22: Shelter Classification; URBAN areas .................................................................................................. 28
Figure 23: Shelter Classification; RURAL areas .................................................................................................. 28
Figure 24: Example of Elevated Shelters (Santa Martha, District of Belen, Rural Location) ................................ 29
Figure 25: Example of Floating Shelter (Belen Municipality, Semi-Urban Location) ............................................ 29
Figure 26: Example of Ground Level Shelter, (Punchana Municipality, Urban Location)..................................... 29
Figure 27: Number of Shelters Affected subset by Shelter/Material type ............................................................. 30
Figure 28: % of Shelters Affected by Floodwater Levels Measured in cm above the Shelter Floor ..................... 30
Figure 29: Component of Shelters Most Affected by Flooding ............................................................................. 31
Figure 30: Damage Profile by Location ................................................................................................................ 32
Figure 31: Damage Profile by Shelter Type ......................................................................................................... 32
Figure 32: Reasons for Families not Starting Rehabilitation/ Reconstruction Activities ....................................... 34
Figure 33: Types of Shelter Works Undertaken After the Flooding ...................................................................... 35
Figure 34: Breakdown of Shelter Needs subset by Location Type ...................................................................... 36
Figure 35: Primary Water Source; RURAL AREAS ............................................................................................. 37
Figure 36: Primary Water Source; URBAN AREAS ............................................................................................. 37
Figure 37: % of Households with Access to Functional Latrine (Post Flooding) .................................................. 37
Figure 38: % of Respondents Indicating Need for Support per Category ............................................................ 39
Figure 39: % of HH Answers According to Risk Factors ...................................................................................... 41
Figure 40: Type of Improvement to Shelter Suggested by Communities ............................................................. 42

Table 1: Household Data Collected by Location ................................................................................................... 13
Table 2: Key Informant Data Collected by Location ............................................................................................. 13
Table 3: Breakdown in % of Single Headed Households ..................................................................................... 17
Table 4: Number of Communities Reporting Displacement Before/After the Onset of Floods; Categorised per
Location Type ....................................................................................................................................................... 20
Table 5: Household Participants in Primary and Secondary Income Generating Activities .................................. 23
Table 6: Type of Adaptation to Shelter Categorised by Location ......................................................................... 29
Table 7: Ability of Inhabitants able to cover the Costs associated with the Reconstruction / Rehabilitation of their
Shelters of their own Accord, as perceived by Key Informant Respondents ......................................................... 34
Table 8: % of Households Indicating Top 3 Priority Needs by Category .............................................................. 40
Table 9: % of Households Responding as Adequate Materials / Items per Category .......................................... 40
Table 10: Indicators for Community Perception of Lack of Disaster Preparedness .............................................. 42
Figure 1: Typical flood damage experienced in the semi-urban neighbourhoods in Punchana, Iquitos

Shelter Assessment Loreto Department; PERU 1
www.sheltercluster.org / http://peru.reach-initiative.org
ACRONYMS
3W Who What Where ACAPS The Assessment Capacities Project ACTED Agence d'Aide à la Coopération Technique et au Développement AHM / AAHH Asentamiento Humano / Neighbourhood within Municipal Jurisdiction COER Regional Emergency Coordination Body, Loreto DB Data base DIRESA Regional Health Authority, Loreto DRR / DM Disaster Risk Reduction / Disaster Management ECHO European Commission Humanitarian Aid Office FGDs Focus Group Discussions GIS Geographic information systems IFRC International Federation of the Red Cross INGEMMET Geological Institute of Mining and Metallurgy IOM International Organization for Migration INDECI National Civil Defence Institute, Peru JRC Joint Research Centre – European Commission NGO Non-governmental organization PRCS Peruvian Red Cross Society SENAMHI National Meteorological and Hydrological Service, Peru SME Small and Medium Enterprise UNOCHA United Nations Office of Coordination of Humanitarian Affairs UNOSAT United Nation‟s Operational Satellite Applications Program UNICEF United Nation‟s Children‟s Fund WaSH Water Sanitation and Hygiene Promotion
GEOGRAPHIC CLASSIFICATIONS
English Name Used in Report
Definition
Region Highest form of governance below the national level where many government agencies reside Province Sub division of a Region with own administrative structure reporting to regional government District Sub division of a Province Municipality Urban administrative area AA.HH / Caserio Neighbourhood that may also be informal and not classified for administrative purposes

Shelter Assessment Loreto Department; PERU 2
www.sheltercluster.org / http://peru.reach-initiative.org
1. EXECUTIVE SUMMARY
1.1. CONTEXT
A strong La Nina effect active since 2011 formed severe hydro-meteorological disturbances across South America which
caused heavy rainfall over a period starting in November 2011 through the first quarter of 2012. These strong rainfall
events moved across Peru causing its national meteorological agency – SENAMHI – to issue 16 severe weather warnings
between January and April 2012. As a result, watersheds across Peru were coping with over 100% more rainfall than the
monthly precipitation average of 180mm for February-March, culminating in flash floods and landslides in highland areas,
and widespread flooding across lowland areas. Within the Amazon basin, water levels rose above historic highs, with the
Amazon river itself registering 118,97 metres above sea level (m.s.l) at its highest level on the 20th April 2012.
States of emergencies were called across 18 of Peru‟s 24 regions, of which 6 remain active at the time of writing. INDECI
data estimates a total of 833.779 individuals affected by the extreme weather events and the consequent floods and
mud/- landslides. Amongst the most affected regions was the Department of Loreto, situated in the North-East of the
country. Over the course of a three month period between February and April 2012, over 280.771 individuals and 59.880
shelters were affected by floods. This represented 34% of the total number of affected individuals, and 35% of the total
number of affected shelters nationwide.
As a result, the Global Shelter Cluster in partnership with the UN humanitarian team in Lima activated the shelter cluster
in Peru in early June in order to conduct an assessment on the impact of the flooding on the shelter sector in the Loreto
Region. The aim of the assessment was to support coordination efforts and inform the humanitarian community and
national/regional stakeholders on the needs and recommended strategy for a post-emergency response.
Despite the fact that multiple locations across the country could be considered as areas of priority for a shelter
assessment, the focus of the humanitarian coordination actors at the national level has been on the region of Loreto. In
large part this is due to the significantly larger scale of the numbers being reported from the area. While Loreto does not
match with regions such as Puno in terms of number of shelters collapsed, at the national level the concern is that Loreto
has over 60.000 affected shelters in combination with over 200.000 individuals categorized as damnificadas or who lost
everything, which is significantly higher than any other region. Moreover, authorities in highly affected regions such as
Puno are said to have responded in a more rapid manner in comparison to those in Loreto where the information flow
within the region and thus subsequent response was much slower. This greater capacity at the regional level in Puno is
considered to have mitigated the impact of the events, one that was not available to the populations in Loreto living under
the impact of floods for a period of multiple months without recourse to aid and support given a much lower regional
capacity to collect, funnel and consolidate information from the field. Finally, actors in Puno observed that the figures
mask the reality that a majority of families have more than one shelter in regions such as Puno, thus having much less
acute shelter assistance needs. Based on this information provided by the both Redhum and UNOCHA the shelter
assessment team chose to retain the original focus on Loreto.
This report consolidates the information collected by the shelter cluster‟s assessment conducted with the facilitation of
REACH between the 20th June and 07th July 2012. In addition to this report the assessment team completed a secondary
data review for which a separate report is available, as well as a web-map resource which provides a geo-spatial analysis
of results through an interactive online map. All reports and factsheets developed by REACH as part of this shelter
assessment are available on the shelter cluster website‟s Peru 2012 Floods section under:
www.sheltercluster.org/Americas/Peru/Peru_Floods_2012/Pages/default.aspx
and/or on the REACH website under: www.reach-initiative.org/countries/peru

Shelter Assessment Loreto Department; PERU 3
www.sheltercluster.org / http://peru.reach-initiative.org
1.2. ASSESSMENT METHODOLOGY
The assessment was conducted between the 25th June and 06th July 2012 by the shelter cluster team with the support of
REACH assessment and DB/GIS facilitators, based on the following Terms of Reference:
Emergency Natural Disaster √ Conflict Complex Emergency
Sector Shelter Cluster Lead Peruvian RC / IFRC
Country Peru
Regional Focus Loreto Department / Province and Districts TBD on location
Assessment Timeframe 20.06 – 06.07.2012
Description of Context
Intense precipitation events across Peru have caused floods and landslides in many regions, affecting
over 800,000 people throughout the season. The area with the largest number of affected population
in the country is the Department of Loreto, with over 250,000 people affected. The Amazonas and
Marañon rivers reached record levels and submerged entire communities for months.
The Global Shelter Cluster activated a cluster presence in Loreto to ensure that the shelter needs are
established and humanitarian actors respond to any shelter gaps in the field in a coordinated and
relevant manner. IFRC as cluster lead will be providing support to carry out a detailed shelter
assessment, develop a shelter strategy, and undertake advocacy activities on behalf of the shelter
cluster. In this framework REACH will second an assessment and data management team in order to
facilitate an inter-agency assessment.
Main objective Facilitation of an inter-agency assessment focused on the impact of floods and landslides in the
shelter sector in selected priority areas supporting the identification of early recovery needs.
Specific objectives
1. Completion of a rapid shelter assessment that provides key figures and information on the needs
of flood-affected communities in both the short and medium term to inform a relevant and timely
humanitarian response;
2. Review of institutional capacities and cross-cutting themes relevant to the shelter sector in
support to the development of a coordinated shelter support strategy;
3. Mapping and sharing of shelter related data at the field level to support a planned and
coordinated humanitarian aid response in the region.
Data Sources
PRIMARY DATA COLLECTION: Household Questionnaires, Focus Group Discussions (Emergency
Centres), Key informant[s] Questionnaires (Rural areas only).
SECONDARY DATA COLLECTION: INDECI, Loreto Regional Government, UNICEF, IOM, NGO Aid
actors.
REMOTE SENSING: UNOSAT, JRC
Targeting
Urban Areas: Municipalities of Belen and Punchana, Iquitos City, Maynas Province
Rural Areas: Indiana, Belen, Iquitos, Fernando Lorres Districts – Maynas Province & Nauta District –
Loreto Province
Shelter Cluster Resources
REACH Resources
1x Shelter Cluster Coordinator / 1x Shelter Cluster Coordinator Assistant
1x Assessment Coordinator / 1x Database/GIS Coordinator
Expected Results
1. Completion of an inter-agency shelter assessment;
2. Contribution through thematic mapping to coordination and advocacy;
3. Contribution through complementary data analysis to shelter response strategy.
Expected Deliverables
a. In-county presentations of preliminary assessment results;
b. Preparation of factsheets and maps;
c. Final assessment report.

Shelter Assessment Loreto Department; PERU 4
www.sheltercluster.org / http://peru.reach-initiative.org
The shelter assessment includes four components of data collection and analysis:
1. Secondary data sources of governments and agencies which are summarised in the Secondary Data Report
that is available on the shelter cluster “Peru Floods 2012” section of the webpage.
2. Household surveys conducted by the assessment teams in rural and urban/ semi-urban locations.
3. Key Informant Questionnaires conducted in each of the communities visited aiming to provide contextual
information regarding the impact of the floods at a community level, including eventual displacement information,
economic impact of livelihoods, and status of coping mechanisms within the community.
4. Finally, there is the GIS and mapping component which includes (a) the use of satellite imagery to identify
informal communities affected in hard to reach or highly affected areas; and (b) the production of static and web-
based interactive mapping of all collected and analyzed data.
This assessment focused on urban locations most affected by the floods as well as villages along the primary rivers
including the Amazon, Marañon, Itaya, and Nanay rivers. Within the urban areas, the communities of Punchana and
Belen were selected based on the fact that these represent the poorest and most vulnerable municipal localities in the city
of Iquitos which were affected by the rising waters for a period of multiple months. In rural areas districts were selected
based on flood extent maps prepared by the Loreto regional government as well as risk maps prepared by INGEMMET
(Geological Institute). The selection of locations was further cross-checked against district level data on flood impact
consolidated and managed by the regional office of the Civil Defence Institute (INDECI).
In order to ensure that the scope of the assessment was sufficiently wide so as to be as representative as possible of
other nearby districts and provinces, villages were selected along multiple primary rivers. Given the significant size of the
Loreto region, and the limitations for travel only by means of boats along rivers, villages were selected within zones
created by taking into consideration factors including distance from Iquitos and distance from the primary river[s]. In this
way a total of 4 zones were created with a sample of villages being selected each zone, ensuring that villages both distant
from, and close to, the river were assessed.
In total, this assessment included 1.319 household surveys (excluding data errors representing ca. 7% margin)
representing over 7.600 affected persons, and an additional 44 focus groups with community representatives. The data
collection tools included socio-economic as well as technical assessment information, with the aim of informing actors
both on the impact and needs in terms of shelter as well as on community coping mechanisms as well as additional risk
factors associated with the impact of the floods on WaSH, health, and economic activities. This ensured that the
information would be representative of the broader issues while also providing local-level knowledge for those
implementing the projects.
A further village was added in an area considered by the COER as having sustained only limited flooding at the height of
the emergency. This village, in the Iquitos District along the Nanay river was added primarily as a control village for the
purpose of confirming data relevance.
Transportation challenges unfortunately rendered more remote areas across the Loreto region inaccessible to the
assessment team.
Full Sets of Data and Maps from the Project
All of the research‟s raw data, including databases, reports, web-maps, static maps, government and other secondary
data, questionnaires, fact sheets and more can be accessed through the Shelter Cluster at
https://www.sheltercluster.org/Americas/Peru/Peru_Floods_2012/Pages/default.aspx and the REACH portal of
IMPACT Initiatives: http://www.reach-initiative.org

Shelter Assessment Loreto Department; PERU 5
www.sheltercluster.org / http://peru.reach-initiative.org
1.3. CONCLUSION AND RECOMMENDATIONS
1. Given the strong capacity of communities to deal with their shelter needs, the focus of assistance
programmes should be on livelihood recovery and support to reduce the vulnerability of households on
single source income streams (diversification and/or DRR), alongside a component of shelter materials
distributions to those households with shelters that experienced the greatest damage. Given the fact that the
floods ended some weeks prior to the assessment period, most families had undertaken activities of their own
means or with external support to manage their immediate shelter needs. At this time therefore, a focus on livelihood
recover and vulnerability reduction would have a greater impact, although a strong shelter component should be
mainstreamed for the most vulnerable families.
2. Reconstruction and rehabilitation works should as best as possible incorporate disaster risk reduction
components. Given the strong resilience shown by households across communities to tackle reconstruction and
recovery efforts of their own accord, any programmes directly supporting shelter reconstruction efforts should ensure
that communities are informed on „build back better‟ techniques as well as given information on how to manage
adaptations to both their individual shelters as well as wider community in order to reduce the risk of damage in
future flooding events.
3. Government-led relocation programmes should be supported to ensure relevant targeting of households
living in informal communities in high flood-risk or no-build areas. Given the existence of regional plans to
develop relocation sites in safer areas, the humanitarian community should support and inform the regional
government on key areas and households that should be targeted, based on the informed consent of families. In
particular, despite the possibility to categorise families by vulnerability based on assessment data, there is a strong
argument in favour of relocating on the basis of community vulnerability rather than on the basis of family
vulnerability alone – thus avoiding that the lots emptied by relocated families are taken over by other families. The
humanitarian community could further participate in the process aiding information exchange and monitoring
implementation from a protection perspective.
4. District Authorities should be supported to develop their response and assessment capacities in order to
make better use of regional emergency decisions aimed at providing response and recovery support.
Despite efforts of the regional government and COER to provide assistance to affected provinces and districts, a
significant capacity gap appears at the lower administrative levels, especially within the technical departments
(secretarias técnicas municipales). This affects both the collection of critical data in order to understand the impact
and extent of damage, as well as recovery efforts such as ensuring the rehabilitation of schools and health centres
critical in early recovery efforts. Such capacity gaps will impact the regional government‟s ability to make effective
use of national emergency funds given the lack of substantiating data linked to their requests. This particularly
affects efforts by the Ministry of Housing in their ability to ensure that funds or resources are equitably channelled to
the most affected areas.
5. High risk areas need to be identified and clearly demarcated and communicated to those affected.
Moreover, any program that addresses reconstruction and rehabilitation ought to adhere to risk boundaries in an
effort to improve disaster risk reduction and resilience to future water-related events.
6. One of the most often mentioned issues mentioned by communities hit by flooding was the protracted length during
which communities were often isolated in their homes. Overall, floodwaters were present in the most highly affected
areas for two months. The impact therefore on livelihoods in both urban and rural locations beyond the obvious

Shelter Assessment Loreto Department; PERU 6
www.sheltercluster.org / http://peru.reach-initiative.org
sectors (agriculture for example) was strongly felt across many other sectors since members of the household would
be afraid to leave their homes. Therefore any effective program needs to target livelihood activities with a
strong component on diversification of income generation activities and DRR in rural communities, given
their current high reliance on agriculture and fishing.
7. Water treatment, management of stagnant water, and solid waste management plans are recommended as
complementary programmes for shelter interventions given the high prevalence of illness and disease associated
with poor quality drinking water and vector-borne diseases (especially dengue and malaria), as well as a high
reported caseload of children with stomach parasites.
8. Disaster risk reduction and disaster management programmes should be a key component of both long-
term development and response/ early recovery programmes. Communities are aware of the risks faced within
their locations and strong grassroots community structures exist that could be used as channels to implement
grassroots DRR/DM programmes to further strengthen community resilience.
9. At least a rapid-needs assessment should be conducted to verify living conditions and basic needs during
the emergency or in its immediate aftermath across affected areas as well as in collective centres, to inform
emergency aid distribution decision-making. Throughout the emergency phase support by the regional
government and NGOs / Agencies was focussed mainly in the collective centres in which only ca. 5% of the affected
people found space. This decision caused unease and tension amongst community members that remained in their
homes during the floods (mainly in urban area) as no aid was delivered to them despite the fact that their situation
was similar. Moreover, the distribution of assistance was conducted without taking into consideration the real
vulnerability conditions of families.

Shelter Assessment Loreto Department; PERU 7
www.sheltercluster.org / http://peru.reach-initiative.org
2. CONTEXT OF THE FLOOD EVENTS 2012 IN PERU
Peru experiences regular seasonal rainfall that peaks between the months of December through April and regularly
causes flooding in the Amazon River basin. However, a strong La Nina effect in 2011 that lasted into early 2012 created
significant hydro-meteorological disturbances that moved through the South American continent from the South Atlantic
bringing with it heavy rainfall that in turn caused flooding and mudslides across vast areas of both highland and lowland
regions of Peru.
Despite the fact that Peru experiences regular yearly flooding, the intensity and regularity of the heavy rains (see Figure 1
below left) over a 5 month period which started in November 2011 caused water levels in its primary river basins to reach
unprecedented levels. As conditions steadily worsened through the first quarter of 2012, 18 of the 24 Departments in the
country declared a state of emergency on the 29th of March 2012. At
the time of launching the assessment 11 States of Emergency
remained in place across 6 departments.
Figure 2 (left): Rainfall as % of normal cumulative precipitation between the 1st February and 20th March 2012 (Source: USDA)
Across the country over 146 emergency events in 15 departments
were reported ranging from mudslides, flash floods and hailstorms in
highland areas to severe rainfall, flooding and strong winds across the
country. Whilst departments across the width and breadth of the
country have been impacted, the Northeastern Amazonian lowland
regions have been hardest hit given their location in the lower
echelons of the catchment areas of a number of major rivers including
the Huallaga, Ucayali, Amazonas and Marañon rivers which swelled
to the extent that water levels in the Amazon basin within the Loreto
Department reached a peak of 118,62m (height measured above sea
level) on the 20th April 2012; overtaking the previous record of
118,58m last seen in 1986 (see Figure 2 below).
Figure 3 (below right): River height measured in meters above sea level compared to previous established records (Source COER)
Despite the fact that Peru has witnessed
unprecedented growth of around 9% since 2008,
mainly based on the export of natural resources
significant economic disparities still exist across
the country leaving more than half of the
population below the poverty line. Departments
without mineral resources remain reliant on
traditional agricultural practices and have
progressed at a much slower rate whilst at the
same time being most vulnerable to natural
hazards. The recent floods particularly hit those

Shelter Assessment Loreto Department; PERU 8
www.sheltercluster.org / http://peru.reach-initiative.org
departments much lower on the human development index than the Peruvian average.1
Data from the region indicated that 833.779 people have been affected across Peru as per the National Institute for Civil
Defence report of 1st June 2012. Across the country‟s 24 affected Departments, Loreto accounts for 34% of the affected
population or 280.771 individuals. Although flood levels had slowly started to recede since the end of May, an estimated
three quarters of the affected population in Loreto is thought to be still facing shelter-related issues. Field reports indicated
that families found shelter either within their communities through emergency means or at central evacuation / emergency
centres Loreto‟s regional capital – Iquitos. Emergency centres have since been closed. At the height of the displacement
an estimated 15.000 families were reported as having sought shelter in such centres.
The Humanitarian response in this region through governmental bodies and international agencies was focussed strictly in
supporting displaced population in collective centres through basic services (water, sanitation, health, protection, etc.) and
distribution of NFI. Population that stayed in their communities were not included in the provision of these benefits as they
were categorised as affected but not “damnificado”.
The primary response at the national level has been coordinated by INDECI, which regularly provided updates and
reports on the state of the crisis. UNOCHA supported the humanitarian country team (red humanitaria) in Peru to activate
humanitarian coordination mechanisms. In Loreto, UNICEF was tasked by the humanitarian country team with the
coordination of the humanitarian actors linking closely with the primary governmental actors - COER (the regional
emergency coordination body) and the regional office of INDECI - to support the response efforts to the crisis. Shelter was
identified as a priority sector, and on the 01st June 2012 IFRC was officially requested to activate and lead a country-level
shelter cluster in order to identify capacities, gaps and support the advocacy needs in this sector.
Consequently, REACH was requested by IFRC to facilitate an inter-agency shelter cluster assessment as well as
providing database and GIS support to the Shelter Cluster. A REACH team2 was deployed to undertake an assessment in
order to inform the shelter cluster and national and international actors and stakeholders on the scale and impact of the
floods on shelter. Oversight and support was provided by REACH and the United Nations Office of Satellite Imagery
(UNOSAT) from their Geneva offices3.
The purpose of the deployment and this assessment was to inform humanitarian decision-making and coordination in
relation to shelter. Household level surveys were undertaken to verify and provide additional detail (particularly in terms of
technical assessments) to information that had been collected through various government agencies and international
organizations, whilst key informant discussions were held with communities to understand broader issues. Static maps
and a web-map with interactive functions were developed based on key data collected by the assessment to enable any
humanitarian stakeholders to quickly reference of the scale and extent of damage across targeted areas, the relief
assistance being provided, and various other baseline social, economic and technical information. Further mapping
requests from humanitarian agencies can be provided upon request either to the shelter cluster or REACH‟s GIS unit in
Geneva.
1 DG ECHO Humanitarian Implementation Plan (HIP) South America; Dated 07.05.2012 Version 1 2 Please refer to Impact & REACH overview at the end of this report 3 Within the United Nations Institute of Training and Research (UNITAR).

Shelter Assessment Loreto Department; PERU 9
www.sheltercluster.org / http://peru.reach-initiative.org
3. ASSESSMENT METHODOLOGY
This section describes the methodology developed and implemented in undertaking the shelter assessment. A sample of
affected households across all accessible areas was taken in line with time and resource availability.
This section highlights (a) the overall objectives of the assessment mission; (b) coordination in planning and
implementation of the assessment; (c) the general methodology of the assessment including the use of key informant and
household surveys; (d) the coverage of the assessment in terms of households and effected areas; and (e) the scale and
scope of the assessment.
3.1. OBJECTIVES The key objective of the assessment is to facilitate an inter-agency assessment focused on the impact of floods and
landslides in the shelter sector in selected priority areas supporting the identification of early recovery needs.
Specifically, the assessment aims to inform actors and stakeholders involved in the development of:
Relevant and timely early recovery projects based on identified needs and gaps;
Coordination mechanisms which ensure that most vulnerable communities or groups are provided timely
assistance based on GIS mapping outputs; and
Response strategies specific to the shelter sector based on grassroots and institutional capacities and
relevant cross-cutting themes identified through key informant surveys.
3.2. COORDINATION WITH CLUSTERS, AGENCIES Despite the limited presence of humanitarian actors on the ground in Loreto, coordination with key stakeholders and
actors was undertaken through the shelter cluster coordinator. As part of the planning for the shelter assessment the
shelter cluster team participated in daily COER meetings and specific humanitarian coordination meetings in which the
shelter assessment purpose and plans were shared with NGOs and UN agencies active in the region. At this time
attendees were: (a) provided with the questionnaires for feedback and input; and (b) requested to identify areas of interest
for the assessment. Moreover, these coordination forums were used to get information about past-present-future project
activities related to the floods, organisation strategies, funding possibilities for shelter, the type of support being given/
planned, coordination with other sectors, as well as advocacy to work in the shelter sector regarding vulnerability criteria.
Participants to these meetings included representatives of the regional civil defence office (INDECI), the Loreto Regional
Government, department of health (DIRESA), International Organization for Migration (IOM), UNICEF, Cesvi, Bomberos
Unidos, , Plan International, as well as the Peruvian Red Cross and local stakeholders.
Local institutions were also directly engaged in support of the shelter assessment – including the Instituto de Educación
Superior Tecnológico Privado Reyna de las Américas, and the International Cooperation Department (Oficinas
Cooperación Internacional) of the Loreto Regional Government.
At a global level, coordination was done with the humanitarian country team lead by INDECI and OCHA, including
organisations and agencies as Coopi, Care-Peru, UNFPA, IFRC, PRCS, Welthungerhilfe, Predes, etc. through direct
meetings or distance information sharing. It was also contacted the Ministry of Housing and donors.
3.3. GENERAL METHODOLOGY The shelter assessment includes four components of data collection and analysis. First, there are the secondary data
sources of national and regional government and agencies. Second there are the household surveys that serve as the
backbone of the assessment. Thirdly, key informant discussions were held in the communities visited. And finally, there is
the GIS and mapping component which includes static and web-based interactive mapping of all data collected, collated

Shelter Assessment Loreto Department; PERU 10
www.sheltercluster.org / http://peru.reach-initiative.org
and analyzed. The use of these different data collection means further facilitates the cross-verification of field information,
which was conducted as part of the analysis.
Secondary data: The REACH team reviewed available data related to the flood impact at both national and regional
levels as well as assessments conducted by other agencies and flood impact mapping conducted by the Loreto regional
government. Moreover, the team reviewed available institutional information related to the shelter sector. The secondary
data report produced as an output of this review was further verified and checked by ACAPS.
Household surveys: The REACH team designed a household survey for households located in flood affected areas with
the support of the shelter cluster coordinator. This included demographic information on the households, socio-economic
household data, as well as a technical assessment of the shelters in which respondents to the survey were currently
residing. See Annex 1 for the assessment template. The purpose was to generate specific data to inform on the needs
and type of projects required, and to assess the level of vulnerability of households affected. In each rural village selected,
household surveys covered at least 30% of the village population.
Key Informant surveys: Key Informant questionnaires were designed to generate discussion about the impact of the
floods at a community level across sectors including shelter. The information generated by these questionnaires aims to
inform actors on how communities have been affected, what kind of priority needs the community identifies, and how
support can best be provided or targeted. See Appendix 2 for the questionnaire template. Key informant questionnaires
were developed for the participation of community leaders; both formal (in the majority of cases persons such as the
teniente gobernador) and informal (in the majority of cases the presidente de la calle / street committee president). The
identification of key informants was undertaken upon arrival to any given community, where the team would introduce
themselves and the purpose of the visit to the community leader. At this time the community leader would collect other
members of grassroots committees to participate in the interview. As far as possible, at least 4 persons were asked to be
present at the key informant interviews.
GIS and mapping: Multiple scales of mapping have been undertaken to inform the shelter assessment in the planning
and implementation stages, to support the dissemination of data collected by the shelter assessment, as well as to
support the identification of priority areas; particularly in urban settings. In partnership with a team of technical experts
from UNOSAT, satellite imagery was incorporated into static and web based maps. The web-based interactive map is
also being made available with data being updated on an ongoing basis (see www.sheltercluster.org).
3.4. ASSESSMENT AREA Despite the fact that multiple locations across the country could be considered as areas of priority for a shelter
assessment, the focus of the humanitarian coordination actors at the national level has been on the region of Loreto. In
large part this is due to the significantly larger scale of the numbers being reported from the area. While Loreto does not
match with regions such as Puno or Piura (other highly affected regions identified in the Secondary Data Review Report)4
in terms of number of shelters collapsed, at the national level the concern is that Loreto has over 60.000 affected shelters
in combination with over 200.000 individuals categorized as damnificadas or who lost everything, which is significantly
higher than any other region. Moreover, authorities in highly affected regions such as Puno are said to have responded in
a more rapid manner in comparison to those in Loreto where the information flow within the region and thus subsequent
response was much slower. This greater capacity at the regional level in Puno is considered to have mitigated the impact
of the events, one that was not available to the populations in Loreto living under the impact of floods for a period of
multiple months without recourse to aid and support given a much lower regional capacity to collect, funnel and
consolidate information from the field. Finally, actors observed that the criteria used to classify shelters in the INDECI
reports for Loreto were not standardised and not understood by all actors, thus in reality potentially masking a much
4 See REACH/ Shelter Cluster “Secondary Data Review Report, 2012 Flood Events, Peru” June 2012

Shelter Assessment Loreto Department; PERU 11
www.sheltercluster.org / http://peru.reach-initiative.org
greater impact in terms of the shelter needs on the ground in Loreto. Based on this information provided by the both
Redhum and UNOCHA the shelter assessment team chose to retain the original focus on Loreto.
Given the logistical challenge of getting to points across the Loreto region by boat from the main point of arrival of Iquitos,
it was decided to focus the assessment in affected districts with the greatest population density within a reasonable travel
distance from Iquitos.
The districts selected to be included in this assessment are based on three criteria.
1. Affected by the floodwaters;
2. Communities located in areas identified as acutely or highly vulnerable to flooding; and
3. Districts with a population of above 20.000 individuals (2007 census data projected for 2012).
The process for selecting villages within targeted districts was facilitated by the use of three primary sources of
information:
1. Flood extent map produced by the Loreto Regional Government – Mapa de Inundacion del Departamento de
Loreto (see Annex 3);
2. Critical „at risk‟ zones produced by INGEMMET – Mapa de Zonas Criticas, Region Loreto (see Annex 4); and
3. Vulnerability risk map produced by INGEMMET – Mapa de Susceptibilidad a Inundaciones y Erosion Fluvial,
Ciudad de Iquitos y Alrededores (see Annex 5).
Based on the limited availability of other data, the team further met with the key coordinating agencies, COER5 and
UNICEF (as the co-lead agency for humanitarian coordination) as well as IOM and PRCS. In particular, these actors were
asked to point out the following:
Most affected areas;
Communities that had received the least amount of support; and
Are considered to be the most vulnerable.
Within the Iquitos area, it was decided to focus on two areas which had been identified as being amongst the hardest hit
due to the high risk locations of shelter and high vulnerability of families given (a) a high population density; and (b) high
level of poverty. In rural areas, areas with highest vulnerability to flooding and of highest floodwater were identified and
categorised in zones comprising of concentric rings of 10km from the urban centres of Iquitos and Nauta. A sample of
villages were selected from each zone based on varying degrees of distance from the main river channels.
Evacuation centres (Albergues) were not assessed given that these were being closed at the request of the Regional
Government in order to minimise the disruption already caused to the schools‟ academic years. At the time of launching
the assessment a total of 6 of 119 evacuation centres that had existed through the emergency remained in existence and
had been well covered in terms of support by humanitarian agencies. By the 2nd of July all collective centres were closed.
5 The Loreto emergency was categorized as a level 3 emergency, designating the regional government and in turn the COER as the primary response and coordination authorities.

Shelter Assessment Loreto Department; PERU 12
www.sheltercluster.org / http://peru.reach-initiative.org
3.5. TRAINING, LOGISTICS AND HUMAN RESOURCES Although the primary aim of the shelter assessment was to be undertaken in an inter-agency manner, the limited
availability of human resources and general capacity of the key aid actors in Loreto meant that the assessment depended
highly on the PRCS which had both the resources and network to mobilise the necessary volunteers.
The shelter assessment formally began on the 25th of June 2012 with the support of the PRCS which provided volunteers
and logistical support in terms of office space, collecting quotations for boats, etc. Given the experience of the PRCS
volunteers in the conduct of surveys, a short half day training was given at the PRCS office which included a detailed
review of the questionnaires and key informant questionnaires, followed by a half day in the municipality of Punchana with
volunteers being directly supported in the field by the assessment team. A brief training session was also conducted on
using GPS enabled cameras, and the requirements of photography for the web based map.
The PRCS volunteers were selected as the team leaders for the other volunteers that joined the survey on an ongoing
basis, based on their availability to conduct full day surveys. Unfortunately the greatest challenge faced was in the
identification of volunteers that could participate for full days and over a multi-day period. With universities being in their
period of exams, and a limited on-the-ground capacity of NGOs active in the area, the assessment relied on an ad-hoc
system in which those who could participate would meet in the early morning for a quick training, then being supported in
the field directly by their PRCS team leaders.
Data collection was completed on the 05th of July. Data entry was completed on the 06th of July.
Generalizing Results and Statistical Analysis
A non-random sampling method was used to identify households and communities that were included (see
above for how communities were selected). Therefore, it is important to note that the results are not able to
accurately be generalised across all affected communities. This decision was based on the fact that at the time
of launching the assessment limited data on flood impact was available to the assessment team beyond
informal recommendations by primary actors in the region. Therefore, this assessment does not include a
statistical analysis. Nonetheless, given the efforts to select villages by taking into consideration factors such as
vulnerability to flooding, distance from river channels, and distance from an urban centre, the assessment is
considered sufficient for results to be considered indicative of the areas around Iquitos – particularly for those in
urban municipalities where a greater sample size was collected. Agencies are encouraged to verify all
information.

Shelter Assessment Loreto Department; PERU 13
www.sheltercluster.org / http://peru.reach-initiative.org
3.6. SCOPE OF ASSESSMENT The table below show the areas in which Household and Key Informant surveys were conducted (a geographical
representation of the table can be seen on the subsequent page below).
Province District Village Name / Urban Municipality
# of Surveys
Province District Village Name / Urban Municipality
# of Surveys
Maynas Mazan Santa Maria de Fatima 26 Loreto Nauta Firmeza 18
Belen Santa Martha 24 Nuevo San Martin 23
Cabo Pantoja 17 Lisboa 9
Mazanillo 13 Bagazan 27
Canta Gallo 21 Sucre 36
Monte Verde 13 Miraflores 42
Municipalidad de Belen 339 02 de Mayo 18
Fernando Lorres
Muyuysillo 12 Palizada 38
Timareo III Zona 7 Pampa Caño 9
Terrabona 12 San Pedro de Tipishca I
23
Centro America 19 20 de Enero 8
Indipendiente 19 Santo Domingo 3
Pueblo Libre 7 Las Malvinas 4
Nuevo Amazonas 11 Las Palmas 8
Tapira Nuevo 15 Grau 21
Huaysi 7 TOTAL 287
08 de Mayo 7
Mangua 10
Villa Asis 14
Iquitos San Jose de Lupuna 17
Punchana Municipalidad de Punchana 422
TOTAL 1.032
Table 1(above): Household Data Collected by Location
Province District Village Name / Urban Municipality
Province District Village Name / Urban Municipality
Maynas Belen Santa Martha Loreto Nauta Firmeza
Municipalidad de Belen Caserio Nuevo Campeon Caserio Nuevo San Jose AAHH Pueblo Libre AAHH Prolongacion Santa Rosa AH 28 de Julio
Nuevo San Martin
Fernando Lorres
Monte Verde Lisboa
Timareo III Zona Bagazan
Terrabona Sucre
Centro America Miraflores
Indipendiente 02 de Mayo
Pueblo Libre Palizada
Nuevo Amazonas Pampa Cano
Tapira Nuevo San Pedro de Tipishca I
San Jorge 20 de Enero
Muyusillo Santo Domingo
08 de Mayo Las Malvinas
Mangua Las Palmas
Iquitos San Jose de Lupuna
Punchana Municipalidad de Punchana AAHH Nueva Venecia AAHH Ivan Vasquez Valeria AAHH Daniel Alcides Carrion AAHH Pilar Nores de Garcia (Ampliacion) AAHH Pilar Nores de Garcia (A,B,C, y D) AAHH Nuestra Señora de la Salud AAHH Delicia Manzur Khan
Table 2 (above): Key Informant Data Collected by Location

Shelter Assessment Loreto Department; PERU 14
www.sheltercluster.org / http://peru.reach-initiative.org
Figure 4 (above): Geographical Coverage of the Assessment Conducted, Including Demarcation of Zones

Shelter Assessment Loreto Department; PERU 15
www.sheltercluster.org / http://peru.reach-initiative.org
4. ASSESSMENT RESULTS
This section includes the results from the household surveys
and the Key Informant Questionnaires. The analysis highlights
the summary level information, with detailed breakdowns
accessible through the database subject to the removal of any
confidential information.
Summary information is complemented by a sub-categorisation
by rural or urban / semi-urban locations wherever possible. It is
worthwhile noting that the information included here has some
variations across sites. This is due to the fact that the urban-
rural nexus means that the scale of impact on communities
differs. For example, while an urban setting may have more
damage in aggregate numbers and cost of impact, a rural
setting may be more affected as a proportion.
This section first considers demographic information of those
surveyed and affected, including identification of vulnerable
groups. This is followed by socio-economic information of
affected people and respondents, a considerable influence on
households‟ coping mechanisms. Technical assessments and
the scale and type of impact is summarized, highlighting the
variation within existing statistics. The type of support needed is
highlighted. Finally, community based issues from the Key
Informant Questionnaires are summarized to support the
quantitative analysis with qualitative information.
As part of a global effort to standardise information and
indicators within the shelter sector (with the aim of improving
transparency, impact monitoring, and cross-country / thematic
comparisons) a set of shelter-related indicators are in the
process of being developed. The final section of the results
section provides statistics for some of the indicators as far as
the data allows.
The assessment has
collected a significant amount
of information across a range
of data sources. Moreover, as
a rapid assessment the
amount of time available for in
depth analysis and reporting
is limited.
This report provides a
synopsis of the key issues
and summary of the data that
has been collected. It is not
intended or able to provide
detailed programmatic
information in its current form
- rather, the assessment is
designed to be useful for a
broader audience. Where it is
of value, specific case studies
are identified which may differ
from the summary
information.
In addition, the database of
information is available to
interested parties, with
confidential information
removed where necessary.
For more information see:
www.sheltercluster.org

Shelter Assessment Loreto Department; PERU 16
www.sheltercluster.org / http://peru.reach-initiative.org
4.1. DEMOGRAPHIC CHARACTERISTICS
A total of 1,319 households were surveyed as part
of the household assessment. This represents over
7.600 individuals. The age profile of respondents
highlights not only the relative young nature of the
population in general, with 46% being below the
age of 15 years of age, but also the number of
children that have directly been affected. Moreover,
the vast majority of those affected are working-age
people, highlighting the intricate relationship of
livelihoods needs as well as shelter needs. No
significant gender variation can be identified.
Figure 5 (right): Age Profile of Surveyed Population
On average over 70% of families have lived in their
locations since more than 5 years, which likely
indicates the existence of strong resilience mechanisms both at the community and household level, given the prevalence
of regular flooding – reported by 80% of households.
A strong urban-rural difference exists within this data, with 62% of families having lived for over 5 years in urban areas
compared to 89% of families in rural areas. Though one could expect such differences, it does indicate a higher likelihood
of impact in urban communities where families have had less time to develop coping mechanisms. Moreover, given that in
the urban municipality of Punchana there exists a relationship between the length of stay and proximity to the river (see
map on pp.16 below) – i.e. that new arrivals are living closer to the river –, there is further evidence that vulnerability is
higher amongst households who have recently settled in a given area.
Figure 6 (below, next page): Average Length of Stay of Families in Locations at Time of Flooding
Key Statistics
Average number of persons per family; 5,79 (5,97 Urban/ Semi-Urban areas; 5,55 Rural areas)
Average male to female ratio; 3,02 : 2.77 (52% male; 48% female)
Average number of families per community in rural areas: 55 1
Average number of families per shelter in rural areas: 1,35
Average number of families per shelter in urban areas: 1,45
30 20 10 0 10 20 30
0 - 5
5 - 15
15 - 55
>55
% Female
% Male

Shelter Assessment Loreto Department; PERU 17
www.sheltercluster.org / http://peru.reach-initiative.org
Vulnerability
A large number of those affected can be considered vulnerable households. 16% of families surveyed were single-
headed households, pregnant and lactating women are present in 19% of all affected households as well as mentally
and/or physically disabled (3%).
Rural Urban AVG
Single Headed Household 9% 22% 16%
Male Single Headed HH 65% 46% 49%
Female Single Headed HH 30% 52% 48%
No Data / Error 4% 2% 3%
Table 3: Breakdown in % of Single Headed Households
Female single-headed households seem to be slightly more prevalent if compared to male single-headed household in
urban areas than in rural areas. These figures should be used as indicative however, as the error margin is likely much
higher given that it was found during the first days of the survey that the question was often interpreted by respondents as
asking whether there was only one income earner in the family – and would answer “yes” if that income earner was also
the head of the household.
In an effort to support the development of a strategy prioritising vulnerable groups, key informant respondents were asked
to identify sub-groups within their communities which they consider as being amongst the most vulnerable. Overall,
Single Headed Households and Families without adequate shelter were ranked highly across communities, along
with families with a large number of dependents which is appears in second priority.
On average respondents identified that 27% of the families within their community fit these criteria of vulnerability.
28%
34%32%
6%
69%
19%
10%
2%
44%
28%22%
4%
More than 15 years 5 to 15 years 1 to 5 years < 1 year
Urban Rural All Areas

Shelter Assessment Loreto Department; PERU 18
www.sheltercluster.org / http://peru.reach-initiative.org
Figure 7 (below): Most Vulnerable Households subset by Priority
0% 20% 40% 60% 80% 100%
Priority 3
Priority 2
Priority 1
Priority 3 Priority 2 Priority 1
Single Headed Household 7% 13% 36%
Families without Adequate Shelter
11% 28% 22%
Families without Adequate Income
22% 19% 17%
Families with high number of Dependents
30% 31% 14%
Families that lost all their Posessions due to this years
Floods26% 9% 11%
Other 0% 0% 0%

Shelter Assessment Loreto Department; PERU 19
www.sheltercluster.org / http://peru.reach-initiative.org
4.2. DISPLACEMENT
Overall, as a result of the floods 45% of families were displaced from their homes though not necessarily from their
communities. Of these displaced families, 3% still currently live at a location other than their own before the floods. Of the
3% of currently still displaced families, given that the last evacuation centres were closed in the first days of the
assessment, 79% of those still displaced at the time of the survey were living with family members, 12% in temporary
shelters on their own plots, and 10% indicating other type of living conditions (primarily tents or temporary shelters on land
other than own plot) – for details see Section 4.3 below.
66% of both rural and urban communities reported that families within their community had been displaced as a result of
the floods. In urban areas 100% of communities reported that displacement occurred; which may be symptomatic of the
fact that access to evacuation centres in urban areas from flooded sites was significantly easier given the high proportion
of centres in urban zones.
Figure 8 (above): % of RURAL Communities Reporting Displacement
Displacement Profile
60% of communities reported that the first displacement occurred only after the floods had reached their village, with
families leaving on average 27 days after flooding first started. This generally fits with the statement that was given in
which community leaders mentioned that due to the regular nature of floods, families only decided to move when
floodwaters reached above the level of their shelter floors – when the floods began reaching record heights.
Urban Rural TOTAL
No Information 7% 8% 8%
Still Displaced at time of Survey 4% 2% 3%
Temporarily Displaced 47% 35% 42%
Not Displaced 42% 54% 47%
0%
10%
20%
30%
40%
50%
60%
70%
80%
90%
100%
Key Statistics
% of families currently still displaced as a result of floods: 3%
% of communities reporting displacement: 66%
% of households utilising evacuation centres: 9%

Shelter Assessment Loreto Department; PERU 20
www.sheltercluster.org / http://peru.reach-initiative.org
Of the 40% of communities in which families left before the floods, on average families left 8 days before the waters
reached the level of shelter floors. Perhaps tellingly, communities in urban locations were more likely to leave their
locations prior to the floods, which is probably directly associated to the availability and easier accessibility to centres for
evacuees.
Urban Rural TOTAL
Before 9 1 10
After 5 10 15
Not Sure 1 18 19
Table 4: Number of Communities Reporting Displacement Before/After the Onset of Floods; Categorised per Location Type
Figure 9 (below): Destination of Displaced Community Members
None of the communities reported families
going to health centres as their destination
during the displacement. As options under
“other” the following details were given:
unspecified location within a city 40%, higher
ground 30%, saw mill 10%, tents 10%, and
unspecified 10%.
When asked with what information the
decisions were taken to select a given location
during the displacement, the primary reasons
given were the fact that locations chosen were
(a) considered safer; (b) the only alternative
known to the community; and (c) based on
government advice (urban areas) or based
on a collectively taken community decision
– indicated in the graph as “other” (rural
areas).
Figure 10 (below right): Reasons for Selection of Evacuation Site
At their site of displacement, communities
generally reported normal or good shelter
conditions with communities mentioning only
schools and other locations as locations where
bad conditions were experienced. Not
surprisingly, „other‟ predominantly was used by
those communities that had evacuated to
higher land within the vicinity of their
communities; thus explaining the fact that 1/3rd
of the respondents indicated bad conditions.
Collective Centres
SchoolWith
Family/ Friends
Other
Urban 13% 27% 16% 7%
Rural 4% 2% 16% 16%
0%
5%
10%
15%
20%
25%
30%
35%
3%5%
19%
3%8%
16%
24%
19%
3%
Rural Urban

Shelter Assessment Loreto Department; PERU 21
www.sheltercluster.org / http://peru.reach-initiative.org
The fact that schools were used as
evacuation sites during this year‟s floods
should inform the authorities of the need to
equip and prepare the school infrastructure
to cope in such emergency situations at
those schools closest to high flood risk
areas.
Figure 11 (left): SHELTER Conditions Experienced at Evacuation Sites
Returns
The majority of communities reported that most displaced families have already returned since more than 3 weeks.
Figure 12 (above left): % of Displaced Families within the Community that have already Returned
Figure 13 (above right): Period in which Returns Occurred
44% of communities indicated that their reasons for returning were linked directly to the desire to protect their possessions
and shelters, 36% reported economic reasons (to restart their livelihood activities), and 20% reported that they were
requested to return.
24% of communities reported that there were still families from their locations that had yet to returned, though few could
give any indication as to the timeframe for their expected return. In conversation as to the reasons for their continued
displacement, in rural villages mostly livelihood issues were cited – indicating that once the next crop would be harvested
(September) the remaining families would return.
13% of communities reported new families arriving to their village/ neighbourhood with an average reported increase of
2,5 families arriving after the floods that had previously not resided there. 20% of communities reported families leaving
their village/ neighbourhood permanently, with an average of 2,4 families leaving.
11%
9%
44%
36%
< 50%
50-80%
80-100%
Don't Know
2% 9%
16%
29%
44%
<1 Week
1 - 2 Weeks
3 - 4 Weeks
more than 1 Month
Don't Know
50%
38%
29%
20%
38%
46%
29%
20%
0%
15%
0%
30%
13%
0%
43%
30%
Collective Centres Schools Family/ Friends Other
Good Normal Bad No Reply

Shelter Assessment Loreto Department; PERU 22
www.sheltercluster.org / http://peru.reach-initiative.org
4.3. SOCIO ECONOMIC CONTEXT
As might be expected, the primary livelihoods of those that have been affected differ across urban and rural areas. Across
both urban and rural areas only 2% of all respondents provided no information on their primary income source, which
could indicate not having any income source. In comparison 67% of households however provided no information in their
secondary income category (84% in urban areas and 51% in rural areas).
Figure 14: Primary Sources of Income by Location (Urban / Rural)
Key Statistics
% of families with multiple income sources; 30%
Average monthly income in Urban/ Semi-Urban areas; PEN 445 / USD 5,57
% of communities reporting livelihoods significantly affected by floods: 69%
% of households reporting their primary income source highly affected by floods: 55%
Primary livelihood sectors (Rural / Urban): Agriculture, Fishing / Skilled & Unskilled Labour, Private
Activity

Shelter Assessment Loreto Department; PERU 23
www.sheltercluster.org / http://peru.reach-initiative.org
Primarily households in rural areas indicated that their primary income streams were inconsistent, particularly in
Agriculture and Fishing given that in the case of the former part of the harvest is for subsistence purposes and only the
excess production is sold, and in the case of the latter catches vary greatly each day.
Activity Primarily Conducted by:
PRIMARY INCOME SOURCE
SECONDARY INCOME SOURCE
Urban Rural Urban Rural
Male 63% 36% 6% 19%
Female 14% 4% 8% 5%
Both 17% 42% 3% 12%
No Information 6% 17% 84% 65%
Table 5: Household Participants in Primary and Secondary Income Generating Activities
Across both rural and urban locations, over
83% of families indicated that their primary
income source had been affected to some
degree by the flooding (79% in urban areas
and 90% in rural areas) – with some 10%
not able to define whether or not their
income had been impacted.
Figure 15 (left): Impact of Floods on Primary Income Source
On average only 30% of households (16% in
urban areas and 50% in rural areas) report
having access to a secondary income
source. Of the 50% of rural households that
indicated having a secondary income
source, the sectors mentioned were fishing
(40%), agriculture (5%), shop / private
business (3%), and livestock and skilled
labour (1%).
Given that agriculture is highly susceptible to flooding and fishing is noted as a highly inconsistent income stream, there is
clearly a strong need for livelihood support / recovery programmes.
In the urban areas, the secondary income sources were limited to agriculture, fishing, and shop / private business.
However, almost 60% of families indicated that their primary income source had been impacted during the flooding, but
were able to recover to varying degrees once the floodwaters had subsided.
Data on average household incomes in rural areas carried an extremely high error margin due to the fact that families
could not necessarily give a monthly value nor could a daily value be simply extrapolated to a monthly one due to the
nature of the primary income sources – agriculture & fishing – being subsistence activities. In urban areas however, this
error margin is significantly reduced. As such only the urban data is provided here.
The average monthly income in urban / semi-urban areas was reported as PEN 445,82 or the equivalent of USD6 5,57
per day per family or given the average family size of 5,79 individuals, USD 0,96 per person per day. This would place
6 Exchange rate based on www.oanda.com/currency/converter on 17.07.2012 - 1 PEN : 0,37454 USD
Rural Urban OVERALL
Highly Affected 73% 42% 55%
Affected 16% 37% 28%
Not Affected 5% 8% 7%
Not Sure 5% 14% 10%
0%
10%
20%
30%
40%
50%
60%
70%
80%

Shelter Assessment Loreto Department; PERU 24
www.sheltercluster.org / http://peru.reach-initiative.org
approximately 54% of the urban/ semi-urban population questioned at an income level below the poverty rate of USD 1
per person per day (error margin of +/-10% - therefore should be used as indicative data).
Figure 16: Average Household Income, Poverty Incidence
To place these figures into relative terms, families were asked whether their monthly incomes would cover their monthly
household expenses. In response to this question, 8% responded as completely covering their monthly expenditures, 13%
sufficiently, 56% partially, and 20% indicating that they experienced regular problems meeting their monthly expenditures
with their monthly income. Generally, there was a limited difference in the data between urban and rural settings.
85% of households indicated that their most common expenses were food/ water, 3% health, 2% shelter, 2% education,
and 1% hygiene articles (7% provided no information). Respondents were asked to provide information before and after
the flooding, however the margin of change was below 1%, and thus insignificant.
Flood Impact on INFRASTRUCTURE & LIVELIHOODS
When asked about the impact of the floods the categories most often cited by key informants as having sustained damage
were livelihoods, shelters, and latrines.
Figure 17 (below): Sectors of Community that were cited as having been Damaged as a Result of Floods
Communities were further asked to report the top three most damaged categories, in which perhaps unsurprisingly
shelters feature predominantly in both 1st and 2nd categories, though significantly higher within the urban context
than the rural one. Livelihoods further appear significantly across all three top priorities amongst rural communities,
0
50
100
150
200
250
0 - 200 201 - 450 451 - 700 701 - 1000 Above 1000 Blank / Error
18% 17%
13%
3%
9%
13%
19%
8%
0%
5%
10%
15%
20%
Nu
mb
er o
f H
ou
seh
old
s
Monthly Household Income (PEN)
POVERTY LINE

Shelter Assessment Loreto Department; PERU 25
www.sheltercluster.org / http://peru.reach-initiative.org
whilst electricity and infrastructure
(often associated with elevated walkways
or roads/paths) appear significantly in
urban areas.
Figure 18 (left): Top Three Most Affected Categories subset by Location
100% of communities reported that their most
important livelihood source had been affected
(31%) or significantly affected (69%) by the
floods. This remains high at 91% for the
second and third most important livelihoods.
However, it is interesting to note that when
urban communities discuss the impact on
livelihoods relative to other categories /
sectors livelihoods feature only in the 3rd
priority. This indicates that, despite the fact
that livelihoods have been affected, the ability
to recover these quickly is likely to be higher
amongst urban communities than rural ones.
Based on the fact that within urban areas
daily labour, skilled labour and private
enterprise activities account for the top
three most important income sources, it is
Rural Urban Rural Urban Rural Urban
#1 Problem #2 Problem #3 Problem
Infrastructure 0% 0% 12% 56% 8% 31%
Health Centres 0% 0% 4% 0% 0% 0%
Schools 0% 0% 16% 0% 28% 8%
Debris 0% 7% 0% 0% 0% 0%
Economic 24% 0% 24% 0% 24% 23%
Electricity 20% 7% 4% 22% 8% 15%
Latrines 8% 0% 24% 0% 28% 23%
Shelter 48% 86% 16% 22% 4% 0%
0%
10%
20%
30%
40%
50%
60%
70%
80%
90%
100%
Rural Urban Rural Urban Rural Urban
#1 Most Important
#2 Most Important
#3 Most Important
Shop/Private Enterprise 3% 21% 3% 46% 29% 17%
Government Support 0% 0% 3% 0% 0% 0%
Remittences 0% 7% 0% 8% 0% 8%
Government Sector 0% 0% 0% 8% 0% 0%
Daily Labour 0% 36% 3% 15% 0% 42%
Skilled Labour 0% 21% 0% 8% 0% 33%
Livestock 0% 0% 3% 0% 57% 0%
Fishing 14% 0% 72% 15% 0% 0%
Agriculture 83% 14% 14% 0% 14% 0%
0%
10%
20%
30%
40%
50%
60%
70%
80%
90%
100%
Liv
elih
oo
d A
ctiv
itie
s b
y Im
po
rtan
ce

Shelter Assessment Loreto Department; PERU 26
www.sheltercluster.org / http://peru.reach-initiative.org
clear that the data substantiates this point.
Figure 19 (right): Top Three Most Important Livelihood Activities subset by Location
In rural areas on the other hand agriculture,
fishing, livestock and private enterprise
activities account for the most important income
activities.
In terms of expenses, communities reported that
food, health, and education represented their
most important expenses following the
floods. Across these categories there were only
minor changes between the period before and the
period after the floods. Note however, that this
data section may have a larger error margin in
that community members were not always able to
determine how their expenses changed.
Nonetheless, despite best being taken as
indicative data, it is backed up by the information
collected at the household level in which food and health represented the greatest area of need.
Figure 20 (left): Top Three Highest Expenditure Categories subset by Location
Interestingly, the importance of shelter related expenditures tends to decrease in priority after the floods, though based on
the assessment it is not possible to explain the reasoning behind this.
Before After Before After Before After
Priority 1 Priority 2 Priority 3
Other 2% 3% 0% 0% 0% 0%
Food 76% 87% 12% 5% 8% 5%
Education 0% 0% 27% 42% 30% 43%
Health 7% 8% 46% 42% 24% 27%
Shelter 7% 0% 10% 5% 35% 14%
Water 7% 3% 5% 5% 3% 11%
0%
10%
20%
30%
40%
50%
60%
70%
80%
90%
100%

Shelter Assessment Loreto Department; PERU 27
www.sheltercluster.org / http://peru.reach-initiative.org
4.4. SHELTER PROFILE
The shelter arrangements of affected
families had not been widely known prior to
the launching of the assessment. Despite the
existence of 119 evacuation centres in
Loreto at the height of the flooding, only
15.000 of an affected population of over
200.000 (ca. 8%) took refuge in such
centres. In fact, 45% of families responded
as having been displaced at some point
during the flooding indicating that the
majority of households remained in their
homes or within their community.
Figure 21 (right): Land Ownership Structure
At the time of the assessment 87% of
families were living in their own homes, 6%
currently living with family members 7, 5% in
transitional / temporary accommodation
setup (i.e. tent), and 2% in other (supported
by church group, etc.).
A minority (22%) of families held some sort of title to the land on which they were living, with a further 34% having some
sort of informal community regulated paper (a record of dwelling or constancia de morador) and most not having any title
or documentation at all (40%). Given the fact that across Peru land ownership regulation and structures are under-
developed, the lack of formal documentation does not feature as an area of concern amongst the households assessed
by the survey. This is backed by the data which shows (a) that over 50% of households had already initiated repairs /
rehabilitation to their shelters; and (b) that 81% of households without land property title or titulo de propriedad plan to
remain in the same locations as prior to the floods.
7 Note this differs from the 3% value attained when asked whether the family was still displaced. In fact, a number of families were living with their relatives in a neighbouring plot, and thus would respond that they were not currently displaced given the proximity to the original location of their home.
Key Statistics
% of families living in their own homes at time of assessment: 87%
%of shelters adapted by households as a flood mitigation measure (elevated / floating raft): 95%
% of shelters with minor flood related damage (cat. 3): 38%
% of shelters with major flood related damage or collapsed (cat. 4&5): 13%
% of non-affected shelters (cat. 1): 2%
0%
10%
20%
30%
40%
50%
60%
70%
80%
90%
100%
Urban Rural TOTAL
Title of Property 7% 5% 6%
Certificate of Posession 25% 3% 16%
Record of Dwelling 51% 11% 34%
Blank / Error 1% 0% 0%
Other (Renter) 1% 0% 1%
No Title 12% 78% 40%

Shelter Assessment Loreto Department; PERU 28
www.sheltercluster.org / http://peru.reach-initiative.org
Amongst those families who indicated that they planned not to remain in the same locations 43% said that they planned to
remain within the same community but at a different site therein, 18% indicated that they planned to move to a new
location / community, 7% said that they planned on remaining at the location to which they moved during the floods (most
often this is the case with displaced families hosted at a different location). Based on this data there the lack of property
title appears to have little significance on rehabilitation and recovery of shelter conditions. Nonetheless in both rural and
urban areas some key issues need to be considered:
In rural areas shelter rehabilitation should be coupled with community DRR capacity building and awareness
raising – particularly in terms of identification of locations within communities where construction should be
avoided and discouraged (potentially by not issuing the informal records of dwelling or constancia de morador).
This is especially important given that the lack of land ownership regulation leaves a great deal of choice of
where to construct ones home to the individual family or community;
In urban areas – especially in the high risk urban periphery – shelter response programmes should work closely
with local authorities to support families in the highest risk locations (within already highly vulnerable
neighbourhoods) to identify a safer location to which to move. Moreover, to avoid that any unused lots are taken
over by new families, shelter actors should work closely with authorities and communities to ensure that
information is shared on potential „no-build
zones‟ and communities are consulted in the
process of defining such areas.
Shelter Typology
Across both rural and urban locations the vast
majority of shelters were made solely of
timber, given the relative ease of accessibility
and low cost.
Figure 22 (left): Shelter Classification; URBAN areas
As can be expected, in rural areas the share of
shelters made of natural materials increases
further to over 90%, with no shelters being made entirely of non-timber products (cement, bricks).
The existence of coping mechanisms is further
demonstrated in the adaptations made by
households to their shelters, with 95% of
shelters having been constructed on stilts or
rafts and only 1% sitting directly on the ground
(4% of surveys had errors or were left blank).
Figure 23 (left): Shelter Classification; RURAL areas
85%
9%
2% 4%Individual shelter made of natural materials
Individual shelter made of natural and other materials (cement foundations, timber house)
Individual shelter made of non-timber materials
Blank / Error
94%
4% 2%
Individual shelter made of natural materials
Individual shelter made of natural and other materials (cement foundations, timber house)
Blank / Error

Shelter Assessment Loreto Department; PERU 29
www.sheltercluster.org / http://peru.reach-initiative.org
Shelter Adaptation
LOCATION
Figure 24 (above): Example of Elevated Shelters (Santa Martha, District of Belen, Rural Location)
Figure 25 (left): Example of Floating Shelter (Belen Municipality, Semi-Urban Location)
Urban Rural
Elevated 85% 94%
Floating Shelter 9% 4%
Ground Level 2% 0%
No Information 4% 2%
Table 6: Type of Adaptation to Shelter Categorised by Location
Figure 26 (right): Example of Ground Level Shelter, (Punchana Municipality, Urban Location)
Further data on the types / profile of shelters assessed during the survey are summarised below:

Shelter Assessment Loreto Department; PERU 30
www.sheltercluster.org / http://peru.reach-initiative.org
Figure 27 (below centre): Number of Shelters Affected subset by Shelter/Material type
6% of shelters have a small shop (7% in urban areas, 4% in rural areas);
78% of shelters have a dedicated space for cooking – kitchen (same across rural / urban divide);
6% of shelters have integrated an animal pen (same across rural / urban divide);
3% of shelters have a storage area for goods / inventory (5% in urban areas, 1% in rural areas);
7% of shelters mentioned having other spaces dedicated to a specific purpose – i.e. bedrooms, living quarters, or
an orchard (same across rural / urban divide).
Damage Profile
The slow-onset nature of the floods in the region meant that few houses sustained immediate and devastating damage,
though those closer to river channels (and especially at bends in the river) recounted experiencing strong currents which
particularly affected the floating shelters that are held in position with the use of poles – which act as anchors. The fact
however that the floods reached historical highs meant that despite the adaptation mechanisms, shelters were often
inundated even for those highest elevated shelters (see water height above floor level figure below).
Figure 28 (below centre): % of Shelters Affected by Floodwater Levels Measured in cm above the Shelter Floor
0 200 400 600 800 1000 1200
Orcon
Cemento
Topa
Timber
Plastic Sheet / Tarp
Cement / Brick
Plywood
CGI Sheets
Palm Leaves
Plastic Sheet / Tarp
Fou
ndat
ion/
B
ase
Wal
ls /
Roo
fR
oof
Number of Shelters
Urban Rural

Shelter Assessment Loreto Department; PERU 31
www.sheltercluster.org / http://peru.reach-initiative.org
Since floodwaters increased and receded in a gradual manner, the period in which the shelters were submersed or under
greater stress (in the case of floating shelters) was in many cases of multiple months. Thus, even when the best quality
(read: water-resistant timber type) materials were used, the prolonged nature of the disaster meant that there was
degradation of the shelter.
Figure 29 (right): Component of Shelters Most Affected by Flooding
Moreover, many communities reported severe storms and winds at the time of the floods associated with the severe
weather warnings issued by SENAMHI. These storms affected the integrity of the roof, which was under extra stress at
the time as one of the ways families coped with the floods was to create an „attic‟ at roof level in which they would live.
Particularly, the roofs made of palm leaf were quickly damaged during the storms thus letting water infiltrate from above. s
The data below provides an overview of the types of materials used in shelter construction by shelter component as well
as the damage profiled of the shelters both categorised by location and sub-categorised by type of shelter and shelter
adaptation mechanism. Note that in order to better define the extent of damage sustained by shelters as a result of the
floods five damage categories were established in line with INDECI categorization (affected, inhabitable, and collapsed):
Category 1: Not affected by floods;
Category 2: Affected by floods with only superficial damages; primarily cleaning required (INDECI Category
Affectadas);
Category 3: Shelter sustained minor damage, small repairs required (INDECI Category Affectadas);
Category 4: Shelter sustained major damage,
requires repairs to be habitable (INDECI Category
Inhabitables);
Category 5: Collapsed shelter; requires
reconstruction – uninhabitable (INDECI Category
Colapsadas).
KEY FACTS & FIGURES
Only 2% of assessed shelters reported water levels
not reaching the shelter floor – 79% of which were
due to the fact that they were sufficiently elevated
0%
5%
10%
15%
20%
25%
30%
0 cm 0 - 15 cm 15 - 50 cm
50 - 100 cm
100 - 150 cm
150 - 300 cm
> 300 cm Blank / Error
Urban
Rural
Floor39%
Walls40%
Foundation15%
Roof6%

Shelter Assessment Loreto Department; PERU 32
www.sheltercluster.org / http://peru.reach-initiative.org
or on unaffected land within a community, 12% of which were floating houses;
1/3rd of floating shelters sustained category 5 damages in which the shelter collapsed or was irrevocably
damaged. Two reasons were given for this high figure: (1) the floating structure couldn‟t carry the entire weight
of the shelter thus partially or fully submerging; (2) floating shelters were most commonly found close to river
banks where the water flow during the floods was highest – thus either shelters not properly anchored would get
carried away or those whose floating base (raft) was not strongly held together would weaken, submerging part
of the shelter;
Figure 30: Damage Profile by Location
Figure 31: Damage Profile by Shelter Type
68% of category 2 damaged shelters indicated superficial damage to walls or floor;
77% of category 3 damaged shelters indicated superficial damage to walls or floor as well as 60% indicating as
having a leakage;
83% of category 4 damaged shelters indicated damage to the walls or floor. 49% of category 4 cases
experienced structural damage or a partial collapse of their roof;
2%
49%
37%
8%
4%2%
47%
39%
10%
3%
Category 1; Not Affected Category 2; Superficial Damages
Category 3; Isolated Damage Sustained
Category 4; Major Damage Sustained
Category 5; Collapsed / Completely Damaged
Urban Rural
0% 20% 40% 60% 80% 100%
Elevated
Floating
Ground Level
Category 2; Superficial Damages
Category 3; Isolated Damage Sustained
Category 4; Major Damage Sustained
Category 5; Collapsed / Completely Damaged

Shelter Assessment Loreto Department; PERU 33
www.sheltercluster.org / http://peru.reach-initiative.org
60% of category 5 damaged shelters indicated that the shelter was completely damaged, collapsed, or was
washed away by the floods. Amongst the 40% that did not experience a total collapse, 20% indicated structural
damage to the foundations of the shelter had occurred. 13% had experienced the collapse of their roof. 10%
suffered severe damage to the walls that would indicate a potential issue with the structural integrity of the
shelter (in the remaining 57% of cases a visual confirmation could not be undertaken as the shelter had been
taken apart by its owners).
Overall, the data suggests that there is little correlation between the type of shelter (specifically the shelter adaptation
mechanism) and the degree of damage. In part this is likely due to the extreme nature of the flooding affecting even
elevated shelters, which would in „normal‟ years remain unaffected despite any flooding. Moreover, there is further little
difference across urban and rural locations which is unsurprising based on the similarities in the housing design and
materials used. From a technical perspective it would have potentially been interesting to review the intensity of damage
with respect to the types of materials used – specifically the type of timber used – given that, at least through visual
observation and general discussion with community members, there was evidence that wherever the material quality was
poor or inappropriate the damage was more pronounced. The lack of technical personnel available to support the survey
however meant that this could not be effectively analysed.
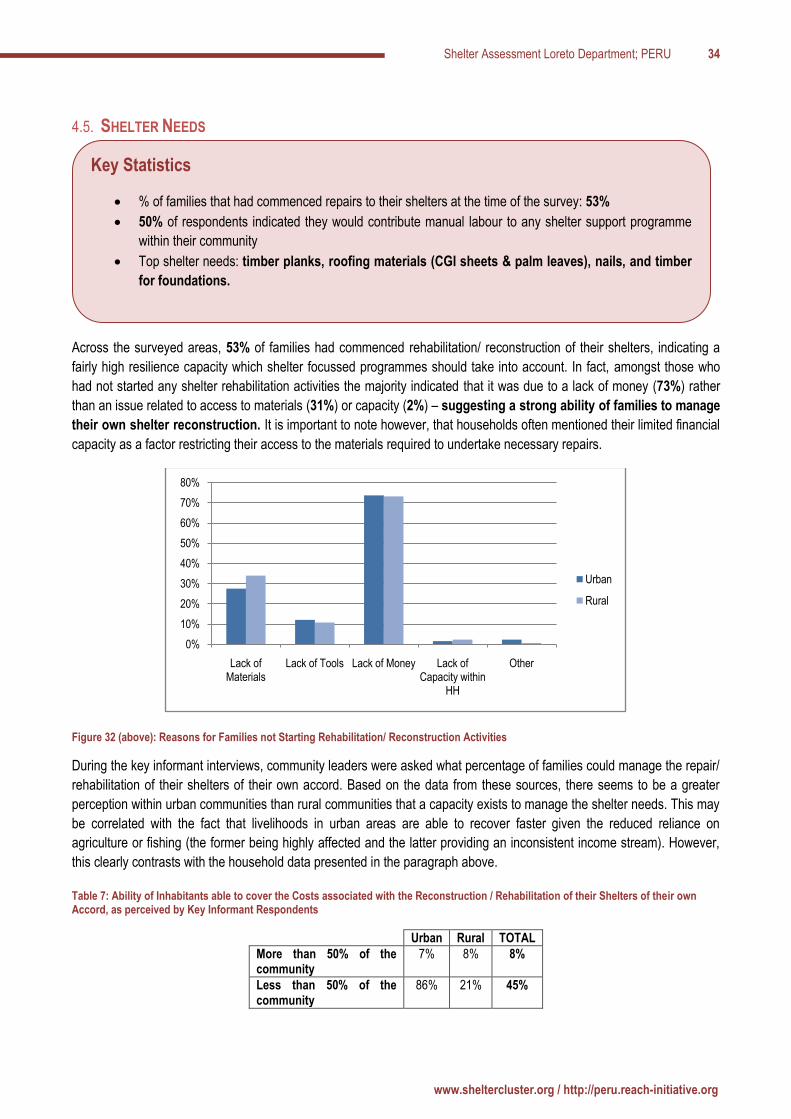
Shelter Assessment Loreto Department; PERU 34
www.sheltercluster.org / http://peru.reach-initiative.org
4.5. SHELTER NEEDS
Across the surveyed areas, 53% of families had commenced rehabilitation/ reconstruction of their shelters, indicating a
fairly high resilience capacity which shelter focussed programmes should take into account. In fact, amongst those who
had not started any shelter rehabilitation activities the majority indicated that it was due to a lack of money (73%) rather
than an issue related to access to materials (31%) or capacity (2%) – suggesting a strong ability of families to manage
their own shelter reconstruction. It is important to note however, that households often mentioned their limited financial
capacity as a factor restricting their access to the materials required to undertake necessary repairs.
Figure 32 (above): Reasons for Families not Starting Rehabilitation/ Reconstruction Activities
During the key informant interviews, community leaders were asked what percentage of families could manage the repair/
rehabilitation of their shelters of their own accord. Based on the data from these sources, there seems to be a greater
perception within urban communities than rural communities that a capacity exists to manage the shelter needs. This may
be correlated with the fact that livelihoods in urban areas are able to recover faster given the reduced reliance on
agriculture or fishing (the former being highly affected and the latter providing an inconsistent income stream). However,
this clearly contrasts with the household data presented in the paragraph above.
Table 7: Ability of Inhabitants able to cover the Costs associated with the Reconstruction / Rehabilitation of their Shelters of their own Accord, as perceived by Key Informant Respondents
Urban Rural TOTAL
More than 50% of the community
7% 8% 8%
Less than 50% of the community
86% 21% 45%
0%
10%
20%
30%
40%
50%
60%
70%
80%
Lack of Materials
Lack of Tools Lack of Money Lack of Capacity within
HH
Other
Urban
Rural
Key Statistics
% of families that had commenced repairs to their shelters at the time of the survey: 53%
50% of respondents indicated they would contribute manual labour to any shelter support programme
within their community
Top shelter needs: timber planks, roofing materials (CGI sheets & palm leaves), nails, and timber
for foundations.

Shelter Assessment Loreto Department; PERU 35
www.sheltercluster.org / http://peru.reach-initiative.org
Nobody 7% 71% 47%
When considering that in urban / semi-urban locations 51% of households had started some repairs to their shelters (see
figure below for details) whereas this figure is 56% in rural areas, the indication is that potentially families in rural areas
are better able to manage their shelter needs. Potentially the data is indicating a difference between urban and rural
households in the prioritization of tasks within the recovery process of individual families – rural households may consider
the repair / rehabilitation of their shelters a higher priority as part of their recovery process, thus being more likely to have
indicated having undertaken some sort of repair to their shelters during the interview. What can be said with more
precision however is that the perception of the key informants is strongly linked to the concern that families face
significant challenges given the degree with which the primary household livelihood activity was affected by the
floods.
In urban locations the top three areas in which repairs were made were in the walls (34%), foundations/ floor (21%), and
WaSH facilities (18%). In rural areas on the other hand the top three areas where changes/ repairs were made were in the
walls (22%), WaSH facilities (21%), and foundations/ floor (20%).
Figure 33 (right): Types of Shelter Works Undertaken After the Flooding
To better gauge the ability of communities to manage their own recovery key informants were asked to indicate the time it
would take those families with the ability to manage their immediate shelter needs, to do so themselves. In 55% of cases
it was mentioned that more than 3 months would be required for families who could complete their own repairs to do so.
40% could do so in a period of 1 to 3 months, and 5% within the next 4 weeks.
When considering the facts that: (a) shelter was of limited importance in terms of the monthly household expenditures, (b)
that 73% of families indicated the lack of money as a factor limiting their ability to undertake shelter repairs / rehabilitation,
and (c) that the majority of households have seen their livelihoods highly affected by the floods; there is evidence that a
shelter material distribution (or voucher) programme represents a highly relevant response to the shelter needs
of families since it would:
a. Reduce the lack of financial resources as a factor limiting the ability of households to manage
their shelter needs; and
b. Reduce the financial burden of the family at a time when income sources are less reliable,
further allowing families to redirect their expenses towards other (higher priority) needs.
0%
5%
10%
15%
20%
25%
30%
35%
40%
Foundation Roof Wall Location WaSH Kitchen
Urban
Rural

Shelter Assessment Loreto Department; PERU 36
www.sheltercluster.org / http://peru.reach-initiative.org
The figure below provides a breakdown of the type of shelter needs which could be targeted by a shelter response
programme.
Figure 34: Breakdown of Shelter Needs subset by Location Type
16%20% 18%
12%
16%14%
14%3% 8%
4%4% 4%
7%
2%4%
15%
13%
14%
12%
16%14%
16%20% 18%
2% 1%1% 1%3% 1%
1% 1% 1%
0%
10%
20%
30%
40%
50%
60%
70%
80%
90%
100%
Urban Rural TOTAL
Wood Planks CGI Sheets Tools Skilled Labour
Techincal Support Timber for Foundations Palm leaves for Roof Nails
Cement Bricks Plywood Other

Shelter Assessment Loreto Department; PERU 37
www.sheltercluster.org / http://peru.reach-initiative.org
4.6. WASH SITUATION IN SHELTERS
Public Services
Access to public services such as electricity and water is crucial in times of emergency. Whilst rural communities rarely
had access to electricity prior to the floods, in urban areas the vast majority of shelters were connected to the electrical
network. Within urban areas in fact, 27% of those affected did not have access to electricity, largely due to damage to the
connection between households and the public networks.
Water
76% of households surveyed have access to a water source either at the home or within 500m of their shelters. However,
of those with home access a water source, in only 21% of cases in urban areas mentioned it was potable – decreasing to
1% in rural areas. The reason for being so low in rural areas is the fact that in rural areas the most common water source
was mentioned as being the river (72%), whereas in urban areas the primary sources are paid services (either piped to
the home or through purchase at a water vendor) – 72%.
Figure 35 (above left): Primary Water Source; RURAL AREAS
Figure 36 (above right): Primary Water Source; URBAN AREAS
Sanitation
Across the population surveyed about half had access to a
latrine at the time of the assessment; this was down by 1%
compared to before the floods in urban areas, and down 10%
in rural areas.
Figure 37 (right): % of Households with Access to Functional Latrine (Post Flooding)
River Water72%
Water Tank4%
Community Handpump
4%
Well4%
Household Source
4% Other12%
River Water14%
Community Handpump
7%
Well7%
Household Source
43%
Purchase Water29%
Key Statistics
% of households in urban areas with access to electricity: 73%
% of households with access to water source: 76%
% of households with access to a functional latrine at time of survey: 50%
Urban59%
Rural41%

Shelter Assessment Loreto Department; PERU 38
www.sheltercluster.org / http://peru.reach-initiative.org

Shelter Assessment Loreto Department; PERU 39
www.sheltercluster.org / http://peru.reach-initiative.org
4.7. NON-SHELTER HOUSEHOLD NEEDS
Over 88% of urban households and 93% of rural households mentioned requiring external support following the floods.
The type of support requested by households provides a greater reflection of the immediate needs, with food, health,
and material support most often mentioned.
Figure 38 (below): % of Respondents Indicating Need for Support per Category
When asked to prioritise their top three needs based on the categories mentioned during the interview the priorities
became food, materials, and tools.8
8 Caveat: Given that the surveyors introduced themselves as undertaking a shelter assessment; it is possible that the prioritization given may be linked to the preconception that by indicating shelter needs families would be later supported by programme activities.
91%
42%
76%
27%
25%
4%
31%
20%
41%
26%
66%
3%
97%
36%
75%
26%
14%
4%
33%
37%
42%
12%
85%
4%
0% 20% 40% 60% 80% 100% 120%
Food
Tools
Materials
New Shelter
Technical Support
Temporary Shelter
Hygiene Kits
Financial Support
Water
WaSH Facilities
Health Support
Livelihood Support
Rural Urban
Key Statistics
% of households requiring external support: 90%
Top three priority needs of households (in order of priority): Food, (Construction) Materials, Health
Services

Shelter Assessment Loreto Department; PERU 40
www.sheltercluster.org / http://peru.reach-initiative.org
PRIORITY 1 PRIORITY 2 PRIORITY 3
Food 63% 12% 4%
Tools 4% 8% 3%
Materials 14% 26% 14%
New Shelter 3% 7% 3%
Technical Support 0% 3% 3%
Hygiene Kits 0% 2% 5%
Financial Support 2% 3% 6%
Water 3% 9% 11%
WaSH Facilities 1% 2% 7%
Health Support 3% 19% 32%
Livelihood Support 0% 0% 1%
Table 8: % of Households Indicating Top 3 Priority Needs by Category
The above data reinforces the argument that response programmes focused on supporting the recovery of
livelihood activities should be prioritised along with shelter response activities. Food is clearly the most important
immediate need at the household level. The single most important contributing factor to this result is the fact that in rural
areas the primary livelihood – agriculture – is primarily practiced as a subsistence activity. Two critical factors aggravate
the situation:
1. The crops damaged by the floods represented the main staple diet for households (i.e. yuka); and
2. The long duration of the flood events has significantly depleted families’ coping mechanisms –
floodwaters in fact began rising in early January and only disappeared in mid June. Moreover, a further 3 months
are needed before the primary crops at this stage in the season (particularly rice) can be harvested.
One area of concern prior to the assessment was associated with the fact that the temperatures in much of the region
would be decreasing with the onset of winter and affected families may have been unable to secure a large part of their
possessions during the flooding – thus leaving them exposed at a time of greater necessity. However, based on the
surveys, a majority of families responded that they had sufficient cooking items, hygiene items, and mosquito nets –
indicating that the problem of loss of possessions is less acute than anticipated.
Urban Rural
Cooking Items 83% 68% Hygiene Items 87% 76% Clothes / HH Items 57% 31% Mosquito Nets 85% 87%
Table 9: % of Households Responding as Adequate Materials / Items per Category
When considered that only 17% of families indicated as having received some form of external assistance the NFI needs
cannot be considered as highly acute. Nonetheless, a large number of respondents indicated that although they did have
items they were able to recover / save during the floods or were donated in the aftermath – many were old and somewhat
damaged. One point to consider is that the incidence of diarrhoea is high which may indicate a lack of awareness or ability
to practice proper hygiene standards (especially with regards to the treatment of drinking water). This in turn could be an
indication of a need for hygiene kits and hygiene promotion campaigns – which tend to be especially relevant at times
when shelters and other community infrastructure are being rehabilitated and is out-of-use.

Shelter Assessment Loreto Department; PERU 41
www.sheltercluster.org / http://peru.reach-initiative.org
4.8. HOUSEHOLD RISK / DISASTER PREPAREDNESS Household Risk
Figure 39 (left): % of HH Answers According to Risk Factors
In an effort to better understand the risk
factors which may exacerbate a family‟s
vulnerability following the floods, a number of
questions were asked regarding access to the
most essential day-to-day needs. Food
security and regular access to potable
drinking water showed the largest disparity
between urban and rural areas. In fact, 83%
of families in urban areas indicated as having
sufficient access to food and 53% to potable
water, whereas these figures reduced to 47%
and 12% respectively in rural areas. When
considering that over 91% of families noted that they would currently require medical assistance there is a strong case
for interventions and monitoring of food security until the post-flooding planted crops can be harvested and
household / community water management and treatment.
It was interesting to note that over 74% of respondents felt that their family was at risk due to the conditions of their
shelters. It is possible that this perception of risk is a key factor in the decision-making process of households to prioritise
the repair / rehabilitation of their shelters, given that over half the households surveyed had started some sort of repair
once the floodwaters subsided. Most importantly however, it demonstrates that families associate their „security‟ with their
housing. Thus, any efforts to facilitate the reconstruction / rehabilitation of shelters and improve the stability of
the structures with a view to mitigate the risk of the shelter to hazards, would likely have a significant impact on
the perception of security at the family level.
From a DRR perspective, over 90% of families acknowledged that their families faced risks – and are vulnerable to –
hazards given the location of their shelters / communities. Although this tends to be the case following any major event,
the key issue to be highlighted is the opening of a window of opportunity to tackle DRR and DM subjects, build
capacity at the community level, and implement risk mitigation measures.
Disaster Preparedness
The key informant questionnaires also included a specific focus on disaster preparedness. The aim wasn‟t to objectively
determine if communities were or were not prepared in the event of future floods, but their perception about their own, and
those of their own community, capacities in facing natural disasters.
81% of key informant respondents felt that their community wasn‟t prepared to for natural disaster, though interestingly
this figure increases to 87% amongst urban communities and decreases to 76% amongst rural communities. This could
be indicative of the fact that rural areas have greater experience managing the impact of floods given their greater
exposure to regular flooding. In combination with the fact that rural communities are likely to receive less support from
external state and non-state actors in times of acute need due to their isolation, the incentive to take heed of lessons
learned is probably higher amongst rural communities than urban ones.
0% 20% 40% 60% 80% 100%
Regular Food Access
Regular Drinking Water Access
Requiring Medical Assistance
Risk due to Condition of Shelter
Risk due to Environmental Factors
Rural
Urban

Shelter Assessment Loreto Department; PERU 42
www.sheltercluster.org / http://peru.reach-initiative.org
When those that answered “no” to the question as to whether they felt that their communities were prepared for future
flooding events were asked to explain why they were of this opinion, 41% pointed to (a) the lack of knowledge and an
implementation capacity of DRR principles that could be relevant to their communities; and (b) the fact that a degree of
uncertainty existed as to what to expect in the future given that these floods exceeded all previous expectations.
Moreover, 31% indicate that the reason for their lack of preparedness is due to the fact that shelters within their
community still require rehabilitation from this year‟s floods and strengthening in order to cope with future events. Further
issues are summarized in the table below.
% of mentions
Table 10: Indicators for Community Perception of Lack of Disaster Preparedness
Lack of knowledge of DRR, uncertainty as to what to expect in the future, and lack of capacity to implement necessary changes
41%
Because shelters still require rehabilitation / strengthening 31%
Lack of suitable land at a higher elevation where they could move to
13%
Poverty & lack of economic resources to support preparedness activities
9%
Lack of food / seed storage for recovery after floods 3%
Across communities, 73% of those surveyed for the key informant interviews acknowledged that there were areas within
their communities where it would not be advised to
construct shelters, highlighting a growing awareness of
risk and their community‟s vulnerability to these. 77% of
communities further acknowledged that there was a need
to improve the construction practices of their homes. In
particular, the key issues raised were the need to raise
the height of shelters (the primary DRR measure at the
household level) and to use more resistant / relevant
materials. This latter being a lesson learned from the
floods given that many floorboards and wall planks were
significantly damaged as a result of their prolonged contact
with water.
Figure 40 (left): Type of Improvement to Shelter Suggested by Communities
Building on lessons learned and best practices at
community level would be an appropriate way forward.
However, lessons learned are not enough if the aim is to
provide a comprehensive toolbox to prepare communities
in front of major natural disaster. Indeed best practices are extremely useful in reducing risks and mitigating effects but
proper preventive action requires broader institutional and operational frameworks. A holistic and multi-sectoral
intervention is then required which focuses on generating information flow and developing capacity at both the grassroots
and higher administrative levels. Information sharing is crucial given that only 33% of communities felt that they had
received adequate communication and information regarding issues of DRR.
DRR programming should focus on better planning and on secure housing, as expressed by the data. Better planning and
more secure housing programs require more resources as well as more institutional expertise and commitment. Its
implementation will have a longer timeframe and would be more difficult and sensitive. Looking at shelter specific
Urban Rural TOTAL
Other 3% 0% 1%
Reinforce foundations
32% 24% 28%
Use more resistent materials
30% 33% 31%
Raise height of shelter
35% 43% 40%
0%
10%
20%
30%
40%
50%
60%
70%
80%
90%
100%

Shelter Assessment Loreto Department; PERU 43
www.sheltercluster.org / http://peru.reach-initiative.org
interventions, this means that how to and where to rehabilitate, relocate and/or build new houses need to be clarified,
planned and enforced under a DRR perspective that takes into account floods and other natural hazards.

Shelter Assessment Loreto Department; PERU 44
www.sheltercluster.org / http://peru.reach-initiative.org
5. CONCLUSIONS & RECOMMENDATIONS
1. Given the strong capacity of communities to deal with their shelter needs, the focus of assistance
programmes should be on livelihood recovery and support to reduce the vulnerability of households on
single source income streams (diversification and/or DRR), alongside a component of shelter materials
distributions to those households with shelters that experienced the greatest damage. Given the fact that the
floods ended some weeks prior to the assessment period, most families had undertaken activities of their own
means or with external support to manage their immediate shelter needs. At this time therefore, a focus on livelihood
recover and vulnerability reduction would have a greater impact, although a strong shelter component should be
mainstreamed for the most vulnerable families. Protecting or diversifying the income sources of households will
ensure an increased ability of households to improve their shelters of their own accord. Nonetheless, given the
significant economic impact of the floods, a shelter materials distribution programme is crucial for those families
whose shelters experienced the greatest damage in order to alleviate the pressure on the meagre incomes at a time
when their food associated costs are highest given the loss of their agriculture crops (Yuka in particular).
2. Reconstruction and rehabilitation programmes or activities should as best as possible incorporate disaster
risk reduction components. Given the strong resilience shown by households across communities to tackle
reconstruction and recovery efforts of their own accord, any programmes directly supporting shelter reconstruction
efforts should ensure that communities are informed on „build back better‟ techniques as well as given information
on how to manage adaptations to both their individual shelters as well as wider community in order to reduce the risk
of damage in future flooding events.
Capacity building and sensitisation activities are essential to improve the living conditions of households across
Loreto. Programmes should focus on improving shelter designs, building techniques, material selection and
treatment, maintenance practices, and other risk reduction activities. These could be conducted by either NGO or
governmental campaigns through the distribution of posters or leaflets, radio programmes, and/or community
meetings/ workshops.
3. Government-led relocation programmes should be supported to ensure relevant targeting of households
living in informal communities in high flood-risk or no-build areas. Given the existence of regional plans to
develop relocation sites in safer areas, the humanitarian community should support and inform the regional
government on key areas and households that should be targeted, based on the informed consent of families. In
particular, despite the possibility to categorise families by vulnerability based on assessment data9, there is a strong
argument in favour of relocating on the basis of community vulnerability rather than on the basis of family
vulnerability alone – thus avoiding that the lots emptied by relocated families are taken over by another family. The
humanitarian community could further participate in the process of: (a) aiding information exchange and monitoring
implementation from a protection perspective; and (b) supporting income generating activities for families
participating in relocation processes.
At present the regional government and the Punchana Municipality are preparing a total of 2.000 10 lots as part of a
wider relocation programme. Despite the advancing stages of preparation of the lots, there seems to be little
progress in the way of identification and prioritisation of communities / families for relocation. The current locations of
the informal settlements in semi-urban locations around Iquitos are in high risk areas in which human settlement
should not have occurred. Such settlements are primarily inhabited by the poorest strata of Iquitos‟ population. As
9 Vulnerability criteria to relocate these families should consider also their capacity to reconstruct by their own a new house (again livelihood and capacity building – see recommendation #6 ) 10 Regional Government 1600, Punchana Municipality 400

Shelter Assessment Loreto Department; PERU 45
www.sheltercluster.org / http://peru.reach-initiative.org
such there is a strong potential for humanitarian actions to implement transitional shelter support programmes for
families whose shelters are currently uninhabitable or at high risk of further damage with storms etc, whilst
supporting the relocation effort from a protection perspective; particularly by ensuring that the process is
accountable and that communities are well informed and able to give their input into the process.
4. District Authorities should be supported to develop their response and assessment capacities in order to
better make use of regional emergency decisions aimed at providing response and recovery support;
especially in tackling shelter topics. Despite efforts of the regional government and COER to provide assistance
to affected provinces and districts, a significant capacity gap appears at the lower administrative levels such as the
technical departments (secretarias técnicas municipales). This affects both the collection of critical data in order to
understand the impact and extent of damage, as well as recovery efforts such as ensuring the rehabilitation of
schools and health centres critical in early recovery efforts. Moreover, it means that in turn the regional government
cannot effectively make use of emergency funds issued at a national level given the lack of substantiating data
linked to their requests. This particularly affects efforts by the Ministry of Housing in their ability to ensure that funds
or resources are equitably channelled to the most affected areas.
Part of the lack of capacity further stems from a lack of understanding / knowledge in terms of a clear and commonly
held understanding of the different categories of damage or affectedness used by INDECI or the COER. Supporting
the development of a common understanding of categorisation of damage, along with a capacity building
programme at the district and provincial levels on the collection and consolidation of data would thus contribute to
better management of emergency funds made available by government departments through the declarations of
states of emergencies in specific departments. In particular Municipalities do not have the capacity / trained
technical personnel to write the “EDAN” report (Evaluación de Daños y Análisis de Necesidades) to be able to ask
for governmental support. INDECI had initiated some training sessions to be able to improve their capacity, however
there is still considerable scope for support by the NGO sector.
5. High risk areas need to be identified and clearly demarcated and communicated to those affected in urban
areas. The Ministry of Agriculture has launched this process by completing a risk map (Mapa de Franja Marginal
del Rio), however it has yet to be published. As such there is a clear need for this data/ information to be shared
both across departments and actors and with communities directly. Moreover, any program that addresses
reconstruction and rehabilitation ought to adhere to risk boundaries in an effort to improve disaster risk reduction
and resilience to future water-related events. As mentioned, mapping capacities exist at a regional and municipal
level which could be used to inform the wider population of areas of high risk or where no construction should be
undertaken. This could contribute to INDECI efforts at developing the disaster preparedness and response capacity
of authorities – as presented in the COER on 06.07.2012.
6. One of the most often mentioned issues mentioned by communities hit by flooding was the protracted length during
which communities were often isolated in their homes. Overall, floodwaters were present in the most highly affected
areas for two months. The impact therefore on livelihoods in both urban and rural locations beyond the obvious
sectors (agriculture for example) was strongly felt across many other sectors since members of the household would
be afraid to leave their homes. Therefore any effective program needs to target livelihood activities with a
strong component on diversification of income generation activities and DRR in rural communities, given
their current high reliance on agriculture and fishing.
Agriculture in rural areas accounts for a marginal proportion of household, but at the same time remains the single
most significant activity given its subsistence nature; families primarily conduct agriculture activities for self
consumption thus reducing their expenditures on food items and allowing them to pay for expenses including water

Shelter Assessment Loreto Department; PERU 46
www.sheltercluster.org / http://peru.reach-initiative.org
purchase or education and health costs. Fishing represents the most significant source of household income,
although a highly irregular one given (a) its secondary position as an activity for rural households; and (b) given the
instability of catches through the year.
7. Water treatment, management of stagnant water, and solid waste management plans are recommended as
complementary programmes for shelter interventions given the high prevalence of illness and disease associated
with poor quality drinking water and vector-borne diseases (especially dengue and malaria), as well as a high
reported caseload of children with stomach parasites.
Some flood affected communities have been reported as having extremely high rates of malaria and dengue.
Ongoing campaigns in the region have distributed mosquito nets and other protective materials; however many
families have lost or had these items damaged during the floods. Moreover, a major problem often mentioned by
community members has been the accumulation of rubbish – particularly in urban sites, and an increase in the
number of stagnant water pools. Many individual households indicated that health issues have increased since the
floods for which they are either experiencing higher costs or indicate a need for support. As such, WaSH related
components should be built into response strategies.
8. Disaster risk reduction and disaster management programmes should be a key component of both long-
term development and response/ early recovery programmes – particularly focussing on improved
information communication. Communities are aware of the risks faced within their locations and strong grassroots
community structures exist that could be used as channels to implement grassroots DRR/DM programmes to further
strengthen community resilience.
Through the key informant questionnaires it was clear that communities have received little support to improve their
resilience mechanisms and manage future flood hazards. At the regional level however, there is a growing
understanding of basic DRR principles that, if implemented, could improve the resilience of communities to a
disaster. Clear information asymmetries exist in which at the grassroots level specific knowledge is not passed
down, despite there being a strong inherent capacity and willingness at the grassroots level to manage community
risks. Moreover, it is clear that greater communication with community level associations or leaders could provide
important information and knowledge of existing capacities – which are not always clear to those at the regional
level.
9. Throughout the emergency phase support by the regional government and NGOs / Agencies was focussed mainly in
the collective centres in which only ca. 5% of the affected people found space. This decision caused unease and
tension amongst community members that remained in their homes during the floods (mainly in urban area) as no
aid was delivered to them despite the fact that their situation was similar. Moreover, the distribution of assistance
was conducted without taking into consideration the real vulnerability conditions of families. In the future, this
situation may entice families to move to collective centres, at least partially, to receive basic support that will help
them to recover from their loss. “Damnificados” (families that lost everything) can also be found inside the
communities and living with other neighbours or relatives on a temporary way.
In fact, given that the legal situation of affected families is not defined and the chosen living area is not exempt from
risks, humanitarian support should be given to population that remain in their communities as their situation may be
worse than the ones displaced temporary to emergency centres. At least a rapid-needs assessment should be
conducted to verify living conditions and basic needs during the emergency or in its immediate aftermath.

Shelter Assessment Loreto Department; PERU 47
www.sheltercluster.org / http://peru.reach-initiative.org
LIST OF ANNEXES TO THIS REPORT
Annex 1: Household Survey
Annex 2: Focus Group Discussions
Annex 3: Mapa de Inundación del Departamento de Loreto
Annex 4: Mapa de Zonas Criticas, Región Loreto
Annex 5: Mapa de Susceptibilidad a Inundaciones y Erosión Fluvial, Ciudad de Iquitos y Alrededores
Annex 6: Selection of Global Shelter Cluster Indicators based on Assessment Data

Shelter Assessment Loreto Department; PERU 48
www.sheltercluster.org / http://peru.reach-initiative.org
REACH - SHELTER CLUSTER ASSESSMENT IN LORETO DEPARTMENT, PERU
A program of In partnership with Funded by