shear banding in the earth's mantle - fenics project · shear banding in the earth’s mantle...
TRANSCRIPT

Shear Banding in the Earth’s Mantle
Laura AlisicBullard Laboratories
University of Cambridge
With John Rudge, Garth Wells,Richard Katz, Sander Rhebergen, Andy Wathen
FEniCS’13, 19 March 2013

Mantle convection
Hot fluid mantle is heated from below, cooled at the topConvection drives cold stiff plates → Coupled system
[ U. Alberta ]

Ridges and subduction zones
Plates created at mid-oceanic ridges, move towards trenches,recycled in subduction zones
Mantle properties determine plate motionlater, subduction through a solid one? Was the deepwater cycle established together with plate tecton-ics, or did one come first, perhaps enabling theother?
Earth formed from a sequence of violent accre-tionary collisions with objects ranging in size fromdust particles to modest planetesimals to the Mars-sized planetary embryo thought to be responsiblefor the origin of the Moon. (See the article by RobinCanup in PHYSICS TODAY, April 2004, page 56.) Iso-topic similarities between meteorites and terrestrialwater—in the abundance ratios of nitrogen-15/nitrogen-14 and deuterium/hydrogen, for in-stance—support the idea that Earth’s water comesprimarily from rocky planetesimals or embryos, although small contributions from comets or theearly solar nebula cannot be discounted. But the ac-cumulation of water through collisions was likelycomplex: The heat from most impacts would haveproduced an early steam atmosphere, and thelargest impacts would have ablated that atmos-phere. Indeed, the giant Moon-forming impact mayhave blown off much of Earth’s primordial water, effectively desiccating the planet.
The extent of the loss of water and othervolatiles to space during giant impacts may have de-pended on whether liquid oceans existed. The ex-pansion of liquid to steam would have greatly in-creased upward accelerations generated by theimpact and thereby enhanced atmospheric loss.Without liquid oceans, much of the protoatmos-phere on the far side of the planet would have beenretained during a giant impact.5 If Earth was desic-cated by the giant impact, it must have regainedwater and other volatiles through the accretion of alate “veneer”—the last few percent of Earth’s massthat was added by the arrival of planetesimals afterthe Moon-forming impact.
The thick steam atmosphere created by count-less impacts contained much of Earth’s early waterbudget. In modern Earth, much of that inventory isstored in the interior. In Earth’s earliest history,though, the heat of impacts was sufficient to melt allor much of the planet, perhaps repeatedly. A fairportion of the steam probably dissolved into themantle when it was nearly entirely molten. Some ofthat dissolved water was outgassed when the man-tle solidified, because water’s solubility in magma issignificantly greater than in NAMs.
Yet some water was undoubtedly trapped inthe crystallizing silicates. The steam atmospheresoon condensed to form the early oceans, which areknown from the most ancient mineral samples (zir-cons from the Jack Hills in Western Australia) tohave existed at least as far back as 4.45 billionyears—within 100 million years of Earth’s forma-tion.6 The resulting apportionment of water be-tween the interior and the surface is uncertain, butit may have been critical to the subsequent develop-ment of the modern deep water cycle.
Reservoirs and fluxesIn the modern deep water cycle, partial melting ofthe mantle extracts water from it. As buoyantmagma rises, the water outgasses into oceans and
other surface reservoirs through volcanoes. Thewater is returned to the mantle by subduction, aspictured in figure 1. The fluxes of outgassing and in-gassing water are governed by plate tectonics andsimultaneously greatly influence the vigor of thetectonic processes through an incompletely under-stood feedback mechanism.7 What’s more, the samecycling occurs for several other volatile compoundson Earth, as outlined in the box on page 42.
That the volume of surface water closelymatches the volume of the ocean basins and that,with comparatively minor fluctuations, it has doneso for at least the last half of Earth history8 are dueto a balance between storage of water in the oceansand in the interior and a balance between out-gassing and ingassing fluxes. But how much wateris in the mantle? And what are the magnitudes of those fluxes between the deep and surface reservoirs?
Geochemical analyses of pristine volcanicglasses demonstrate that water is a universal minorcomponent of the magmas that come from Earth’smantle. The driest volcanic rocks on Earth are thebasalts that erupt along mid-ocean ridges; the man-tle that melts and eventually emerges as basalt con-tains between 50 and 200 ppm water by weight. Ifsuch concentrations prevail throughout Earth’smantle, the interior contains at least 1020 kg ofwater—roughly 10–50% of the water on Earth’s surface.1
However, judging from volcanic rocks fromother localities, such as Hawaii and other oceanic is-lands, some mantle regions are more enriched, con-taining between 300 and 1000 ppm water. The pro-portion of Earth’s mantle represented by suchsources is debatable, but if they are volumetrically
www.physicstoday.org March 2012 Physics Today 41
Continentalcrust
Lithosphere
Mantle
Arc
Ridge
Hot spotSubduction
Figure 1. The modern deep-Earth water cycle is strongly coupledto plate tectonics. The flux of water from Earth’s mantle to its sur-face is governed by partial melting, which occurs mainly beneathmid-ocean ridges but also beneath “hot-spot” oceanic islands suchas Hawaii. Mid-ocean ridges tap the upper mantle, which containsabout 50–200 ppm water by weight, whereas hot-spot volcanoestap deeper, more enriched portions of the mantle. Sediments andbasalts on the ocean floor become hydrated from interactions withthe oceans and return to the deep mantle by subduction—thesinking of old oceanic lithosphere into the interior. Some of thatsubducted water, however, is released from rock when it partiallymelts and returns to the surface via arc volcanoes, such as those ofJapan and the Aleutian Islands. (Adapted from R. M. Hazen, R. J.Hemley, A. J. Mangum, Eos Trans. Am. Geophys. Union 93, 17, 2012.)
[ Hirschmann & Kohlstedt, 2012 ]
Mantle-magma interaction important in subduction zones: meltingin mantle wedge, formation of island arcs
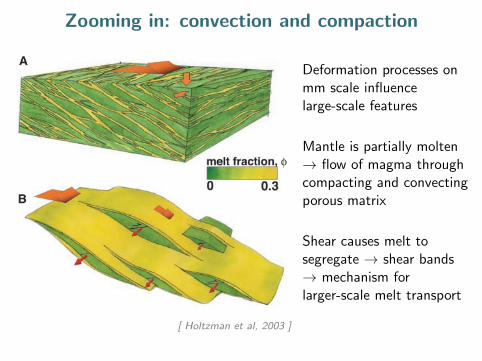
Zooming in: convection and compaction
which should occur at shear stresses higherthan 0.1 MPa (14), olivine CPOs in the man-tle will be affected by the presence of melt.
Second, we argue that the transition inCPOs in going from samples of olivine andMORB (Fig. 2A) to samples with melt seg-regated into networks of bands (Fig. 2B) isdue to changes in the flow pattern rather thana change in the deformation mechanism. Thelatter CPO is similar to type-B CPO definedin (5), which the authors of that paper at-tribute to a change in the behavior of dislo-cations at high water fugacity and high stressconditions. However, neither of these con-ditions applies to our experiments. Severallines of evidence disfavor a change in dis-location dynamics (e.g., a change fromdominant a slip to c slip on b planes) as anexplanation for the CPO observed in ourexperiments, discussed in (15). We proposea kinematic explanation for the a-c switch,on the basis of three points, as follows:
1) The total strain in the sample partitionsbetween the melt-rich bands and melt-depleted lenses. Although the bands compriseonly !20% of the total sample volume, thestrain rate, and thus the strain, is higher in theweaker bands than in the stronger lenses. Inthe bands, shear strain is oriented at !20° tothe sample shear plane and, therefore, in thelenses the shear plane must be back-rotatedrelative to the sample shear plane (Fig. 3C).This back-rotation is observed in the orienta-tion of b axes in the CPO.
2) The observed CPO predominantly re-flects deformation in the melt-depleted lens-es, implying that the deformation in the bandsis not contributing to or strongly modifyingthe CPO (16). Observations that the CPO isbarely modified in the vicinity of a band(SOM Text, section 3) support this point.
3) The deformation that produces the CPO
in the melt-depleted lenses is not simpleshear, but it involves substantial componentsof strain normal to the shear direction. Align-ment of a axes normal to the shear directionsuggests that a slip on the b plane occursnormal to the shear direction (17). Becausemuch of the shear strain is accommodated inthe bands, the components of strain normal tothe shear direction in the lenses have muchgreater expression in the CPO than theywould if the bands were absent. This expres-sion may be enhanced further by the MPO-CPO effect. Thus, the “mechanism” for a-ax-is orientation is the kinematic effect of strainpartitioning, not a change in the dominantslip system.
The influence of melt segregation andstrain partitioning on CPO development willbe even more effective in partially moltenregions of Earth where deformation is morethree-dimensional than in our experiments.The olivine a axes will rotate if the geometryof the overall flow in the region permits orrequires an elongation of the melt-depletedlenses normal to the shear direction. Ananisotropic network of melt-rich layers willaffect the seismic properties of regions largein comparison to a seismic wavelength (") ifthe separation between layers (#S) is muchless than a seismic wavelength (i.e., #S $100-3 m %% " $ 104 m). The configuration(comprising average thickness, spacing, an-gle, and topology) of the network depends onthe physical properties of the solid and fluid,the kinetics of the processes governing theirinteractions and transport, and the geometric(kinematic) boundary conditions of regionalflow. Some of these properties are encom-passed in the first-order compaction lengthscaling argument discussed in (7) (SOMText, section 2). Others remain to be studiedexperimentally and theoretically.
A literal extrapolation of the process dis-cussed here may help to explain the complexseismic anisotropy observed in many partial-ly molten regions of the upper mantle (18).Several potential examples include (i) ver-tical fast-direction measurements beneaththe Reykjanes Ridge south of Iceland (19),(ii) trench parallel fast axes measured in themantle wedge above subduction zones (20),or (iii) tangential patterns of anisotropyaround plume heads, e.g., Iceland (21).Each of these observations has produced arange of hypotheses, a discussion of whichis beyond the scope of this paper (22).However, the processes discussed here sug-gest detailed field-based (23) and seismo-logical predictions and tests, which mayinfluence our interpretations of the dynam-ics of partially molten regions of Earth.
References and Notes1. D. Mainprice, Tectonophysics 279, 161 (1997).2. A. Nicolas, N. I. Christensen, Formation of Anisotropyin Upper Mantle Peridotites—A Review, GeodynamicSeries (American Geophysical Union, Washington,DC, 1987), vol. 16.
3. S. Zhang, S. Karato, Nature 375, 774 (1995).4. M. Bystricky, K. Kunze, L. Burlini, J.-P. Burg, Science290, 1564 (2000).
5. H. Jung, S. Karato, Science 293, 1460 (2001).6. G. Hirth, D. L. Kohlstedt, Earth Planet. Sci. Lett. 144,93 (1996).
7. B. K. Holtzman, N. J. Groebner, M. E. Zimmerman,S. B. Ginsberg, D. L. Kohlstedt, Geochem. Geophys.Geosyst. 4, 8607 (2003).
8. Material and Methods are available as supportingmaterial on Science Online.
9. M. E. Zimmerman, S. Zhang, D. L. Kohlstedt, S. Karato,Geophys. Res. Lett. 26, 1505 (1999).
10. D. McKenzie, J. Petrol. 25, 713 (1984).11. B. L. Adams, S. I. Wright, K. Kunze, Metall. Trans. 24A,819 (1993).
12. W. B. Durham, C. Goetze, J. Geophys. Res.82, 5737 (1977).13. M. S. Paterson, in Physics of Strength and Plasticity, A. S.Argon, Ed. (MIT Press, Cambridge, MA, 1969), pp. 377–392.
14. M. J. Daines, D. L. Kohlstedt, J. Geophys. Res. B102,10257 (1997).
15. The fabric in Fig. 2B would normally be interpreted asslip on the (010)[001] system. Such a change indominant slip system could result from locally highstresses due to the strong chromite grains activatingthe (010)[001] slip system in olivine, which is muchstronger than (010)[100] (12). However, this possi-bility is negated by the fact that the same CPO existsin the olivine and MORB with FeS sample, whichforms bands with a weak melt phase (i.e., FeS) inplace of strong chromite inclusions. Furthermore,TEM images of the dislocation structures revealed noevidence for a preponderance of dislocations with[001] Burgers vectors or with high local stresses (i.e.,increased dislocation density). Because no evidenceexists for a change in the relative strength of the slipsystems, another explanation for the a-c switch mustbe invoked.
16. The absence of variation in the CPO around andwithin a band supports the conclusion that deforma-tion in the bands does not contribute to or stronglymodify the CPO (SOM Text, section 3). At least tworeasons argue against formation of the observed CPOin the melt-rich bands: (i) To maintain a stable ori-entation during simple shear, the melt within thebands must move relative to the solid (7). Thus, thestrain associated with a band at a given location willprobably not be high enough to modify the CPO. (ii)The deformation mechanisms may be different in thetwo regions because of increased melt fraction in themelt-rich bands. Granular flow or grain boundarysliding accommodated by diffusion with rigid rota-
Fig. 3. Representation of ob-served melt distribution and in-ternal strain partitioning in ex-perimentally deformed samples.(A) Synthesis of the configura-tion of melt bands. Bands formanastomising networks withlarger bands at higher angles rel-ative to the shear plane (flat redarrow) connected by smallerbands at lower angles. Smallerarrows indicate that the samplesflatten and widen with shear. Inthree dimensions, the melt-richlayers connect and surroundmelt-depleted lenses. (B) Strainpartitioning between bands(anastomosing layers) andlenses. The flat arrows indicatethe total shear and the compo-nent concentrated in thebands. The narrow arrows indi-cate alignment of olivine a axes normal to the shear direction in the lenses. The black linesmark the orientation of the shear plane in the lenses, “back-rotated” relative to the sampleshear plane due to strain partitioning.
R E P O R T S
www.sciencemag.org SCIENCE VOL 301 29 AUGUST 2003 1229
on
Febr
uary
15,
201
2w
ww
.sci
ence
mag
.org
Dow
nloa
ded
from
[ Holtzman et al, 2003 ]
Deformation processes onmm scale influencelarge-scale features
Mantle is partially molten→ flow of magma throughcompacting and convectingporous matrix
Shear causes melt tosegregate → shear bands→ mechanism forlarger-scale melt transport

Zooming in: convection and compaction
Compare numerical models with shear banding in laboratoryexperiments → material properties?
© 2006 Nature Publishing Group
The dynamics of melt and shear localization inpartially molten aggregatesRichard F. Katz1, Marc Spiegelman1,2 & Benjamin Holtzman1
The volcanoes that lie along the Earth’s tectonic boundaries are fedby melt generated in the mantle. How this melt is extracted andfocused to the volcanoes, however, remains an unresolved ques-tion. Here we present new theoretical results with implications formelt focusing beneath mid-ocean ridges. By modelling laboratoryexperiments1,2, we test a formulation for magma dynamics andprovide an explanation for localized bands of high-porosity andconcentrated shear deformation observed in experiments. Thesebands emerge and persist at 158–258 to the plane of shear. Pasttheoretical work on this system predicted the emergence of meltbands3,4 but at an angle inconsistent with experiments. Our resultssuggest that the observed band angle results from a balance ofporosity-weakening and strain-rate-weakening deformationmechanisms. Lower band angles are predicted for greater strain-rate weakening. From these lower band angles, we estimate theorientation ofmelt bands beneathmid-ocean ridges and show thatthey may enhance magma focusing toward the ridge axis.Recent experiments1,2 demonstrate that partially molten aggre-
gates deformed in simple shear develop localized melt bands of highporosity and enhanced strain (Fig. 1a). These bands emerge at lowangles (,208) to the plane of shear for a range of strain rates andstresses, and persist at low angles even after large shear strains. Thispattern-forming instability presents a rare opportunity to testtheories of magma transport in the Earth’s mantle5–8. Magmadynamics theories use continuum equations for conservation ofmass, momentum and energy to describe a two-phase system oflow-viscosity magma in a deformable, permeable solid matrix andshould be applicable to the experiments. Past theoretical work3
showed that a porosity-weakening viscous material9 undergoingextension is unstable: tension across a weak, high-porosity regionleads to low pressure that, in turn, causes convergence of melt flowinto that region, raising its porosity and further weakening it. Thisinstability has been predicted to occur at scales smaller than thecompaction length3,4,10,11, which is the intrinsic length-scale inmagma dynamics theory5.Past theoretical work predicts that melt bands emerge perpen-
dicular to the direction of the maximum rate of extensional strain.This prediction results from assuming that the matrix viscositydepends only on porosity and weakens with increasing melt frac-tion. For simple shear geometry, Spiegelman4 showed that bandsoriented at 458 to the shear plane will grow fastest, whereas meltbands with angles greater than 908 will decay (Supplementary Fig.S1). Here we demonstrate that a viscosity that includes both porosityand strain-rate-weakening mechanisms can reproduce the emer-gence and persistence of melt bands at about 208 to the directionof maximum shear (a difference of 258 from past predictions), asobserved in experiments.A power-law form for strain-rate weakening is a commonly
LETTERS
Figure 1 | A comparison of experimental and numerical results. a, Anexample cross-section of an experiment (PI-1096) on a partially moltenolivine–basalt–chromite aggregate deformed in simple shear to a strainof 3.4. (Adapted from Fig. 1a of ref. 18; experimental details in ref. 2.)The melt-rich bands are sloping, darker-grey regions at an angle v to theshear plane. Sub-vertical black features are decompression cracks, anexperimental artefact. b, c, The porosity (b) and perturbation vorticity (c)from a numerical simulation with n ! 6 and a ! 227 at a shear strain g of2.79. The domain is five by one compaction lengths, approximately equal tothe estimated size of an experimental charge. The perturbation vorticity,7£ "V2 _gyi#= _g; is the total vorticity minus the constant vorticity _g due tosimple shear (here normalized by _g). Black lines in b and c show the positionof passive tracer particles that were arrayed in vertical lines at g ! 0; whitedotted lines show the expected position of the tracers due only to simpleshear. The linear, low-angle red bands in c are weak regions associated withhigh porosity and enhanced shear, while the linear, sub-vertical blue regionsare regions of reversed shear. d, Histograms comparing band-angledistributions in experiments and the numerical solution from b.
1Lamont-Doherty Earth Observatory of Columbia University, Palisades, New York 10964, USA. 2Department of Applied Physics and Applied Mathematics, Columbia University,New York, New York 10027, USA.
Vol 442|10 August 2006|doi:10.1038/nature05039
676
[ Katz et al, 2006 ]

Inclusion in porous medium under simple shear
Melt mapping in laboratory experiment: olivine + 10% MORB
γ = 1.0 γ = 2.0
[ Chao Qi & David Kohlstedt ]
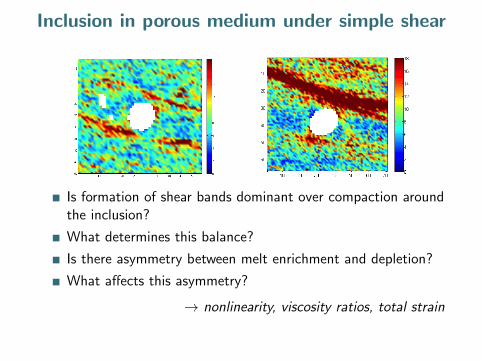
Inclusion in porous medium under simple shear
Is formation of shear bands dominant over compaction aroundthe inclusion?
What determines this balance?
Is there asymmetry between melt enrichment and depletion?
What affects this asymmetry?
→ nonlinearity, viscosity ratios, total strain

Equations: Compaction and advection
Conservation of mass for the solid phase:
∂φ
∂t+ vs · ∇φ = (1− φ)∇ · vs +
Γ
ρs(1)
Conservation of mass for the two-phase mixture:
∇ · v + Γ∆
(1
ρ
)= 0 (2)
Conservation of momentum for the fluid:
∇ · (φσf ) + φρfg − F = 0 (3)
Conservation of momentum for the solid:
∇ · ((1− φ)σs) + (1− φ)ρsg + F = 0 (4)

Equations
Compaction and advection simplified:
∂φ
∂t+ vs · ∇φ− (1− φ)∇ · vs = 0 (5)
∇ ·(−Kφ
µf∇P + vs
)= 0 (6)
∇P = ∇ ·(ηφ(∇vs +∇vs
T ))
+∇ ·(
(ζφ −2
3ηφ)∇ · vs
)(7)
[ after McKenzie, 1984 ]

Porosity-dependent rheology
Permeability
Kφ = φ2 (8)
Bulk viscosity
ζφ =1
φ(9)
Shear viscosity
ηφ = η0 e−α(φ−φ0) (10)
Compaction length
δc =
√K0
µf
(ζ0 +
4
3η0
)(11)

Benchmark 1: Compaction around sphere
Analytical solution
vs =
(−4D
r4+
2FK2(r)
r2
)E · x
+
(−2C
r4+
8D
r6− FK3(r)
r3
)(x ·E · x)x
(12)
C = − a4K ′2(a)
4ξK1(a)− a2K ′2(a), (13)
D =a4
4+
4a3ξK2(a)
4ξK1(a)− a2K ′2(a), (14)
F =8aξ
4ξK1(a)− a2K ′2(a), (15)
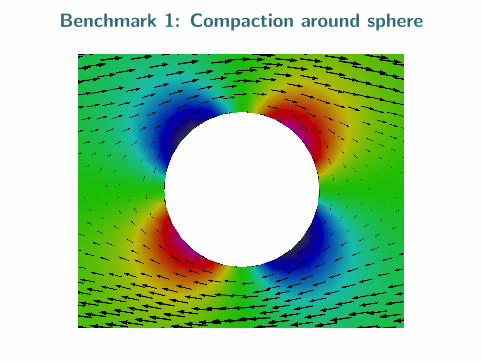
Benchmark 1: Compaction around sphere

Benchmark 2: Plane wave
Initial condition
φi(xi, yi) = 1.0 +A cos (k0xi sin(θ0) + k0yi cos(θ0)) (16)
Analytical growth rate of planar shear bands
sa = −2αξ(1− φ0)φ0
kxkyk2 + 1
(17)
Numerical growth rate
sn =(1− φ0)φ0A
∇ · vs (18)
[ Spiegelman, 2003 ]

Benchmark 2: Plane wave
Porosity and velocity perturbation at γ = 0

Benchmark 2: Plane wave
Porosity and velocity perturbation at γ = 1.5

Benchmark 2: Plane wave
Porosity and velocity perturbation at γ = 3.0

Benchmark 2: Initial angle
Plane wave shear band growth rate benchmark
-0.09
-0.068
-0.045
-0.023
0
0.023
0.045
0.068
0.09
30 60 90 120 150 180
Increase in initial angle of porosity perturbationS
hear
ban
d gr
owth
rate
Initial angle (degrees)
sdot_numsdot_S03sdot_T12
0
0.018
0.035
0.053
0.07
30 60 90 120 150 180
Error with increase in initial angle of porosity perturbation
Rel
ativ
e er
ror i
n sh
ear b
and
grow
th ra
te
Initial angle (degrees)
rel_error_S03rel_error_T12
Summary::* The dependence of growth rate on initial angle is well reproduced* The error varies for different initial angle, and is largest for shallow angles.
Initial shear band angle
Growth rate depends on initial shear band angle
Fit analytical rates well

Benchmark 2: Perturbation amplitude
Plane wave shear band growth rate benchmark
0.071
0.072
0.073
0.073
0.074
-6 -5 -4 -3 -2 -1
Increase in porosity perturbation amplitude
She
ar b
and
grow
th ra
te
log10 amplitude
sdot_numsdot_S03sdot_T12
0
0.005
0.01
0.015
0.02
-6 -5 -4 -3 -2 -1
Error with increase in porosity perturbation amplitudeR
elat
ive
erro
r in
shea
r ban
d gr
owth
rate
log10 amplitude
rel_error_S03rel_error_T12
Summary:* The error increases dramatically if the amplitudes are large (i.e. larger than 1e-2)
Porosity perturbation amplitude
Error increases for increasing perturbation amplitude
Small perturbation assumption breaks down & 10−2

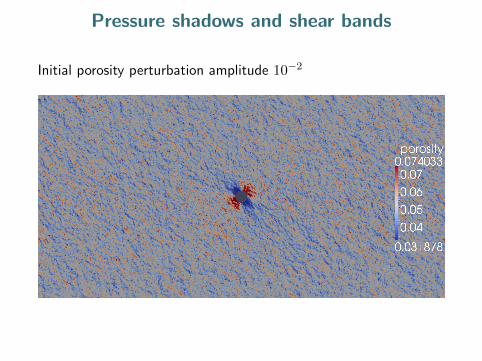
Pressure shadows and shear bands
Initial porosity perturbation amplitude 10−3
Pressure shadows and shear bands
Initial porosity perturbation amplitude 10−2

Pressure shadows and shear bands
What affects relative importance?
Nonlinearity of porosity dependence α
Ratio of bulk to shear viscosity ζ0/η0Amplitude of initial perturbation A