discrete-continuum analysis of shear banding in the direct shear test
TRANSCRIPT

Wang, J., Dove, J. E. & Gutierrez, M. S. (2007). Geotechnique 57, No. 6, 513–526 doi: 10.1680/geot.2007.57.6.513
513
Discrete-continuum analysis of shear banding in the direct shear test
J. WANG*, J. E . DOVE* and M. S. GUTIERREZ*
The direct shear test is a widely used method for deter-mining peak and critical state strength parameters forsoil and for soil-manufactured material interfaces. Theobjective of this research was to examine the direct sheartest by way of a discrete-continuum approach. Specifi-cally, the effects of non-coaxiality between the principalstress and the principal strain increment direction andthe deviation of zero extension direction from horizontalare examined. A new, mesh-free method of evaluatinginternal strains is proposed, and a new flow rule is alsopresented. The results from discrete simulations indicatethat development of shear bands proceeds from the sideboundaries toward the centre with both primary andsecondary bands formed. A distinct shear band along themiddle plane develops around peak state in a densesample. Simulation data using the new flow rule andlaboratory test data using a conventional flow rule are ingood agreement, indicating that the effect of non-coaxi-ality is small at peak state. Deviation of the zero linearextension direction at peak state is less than 38. It isconcluded that boundary measurements made on thedirect shear apparatus are suitable for determiningstrength and volume change behaviour of granular soils.
KEYWORDS: anisotropy; constitutive relations; deformation;failure; numerical modelling and analysis; shear strength
L’essai de cisaillement direct est une methode couram-ment utilisee pour determiner les parametres de resis-tance au pic et a l’etat critique pour le sol et lesinterfaces de materiaux fabriques avec le sol. Cette etudea pour objectif d’examiner les essais de cisaillementdirect selon une approche couplee discrete-continue. Ons’interesse plus particulierement aux effets de non coax-ialite entre la direction de contrainte principale et d’aug-mentation de deformation principale et la deviation dedirection d’extension zero par rapport a l’horizontale.Une nouvelle methode d’evaluation des deformations in-ternes sans maillage et une nouvelle loi d’ecoulement sontegalement presentees. Les resultats des simulations dis-cretes indiquent que le developpement de bandes decisaillement se produit des bords lateraux vers le centre,avec la formation de bandes primaires et secondaires.Pres du pic, une bande de cisaillement distincte apparaıtle long du plan median dans un echantillon dense. Lesdonnees de simulation adoptant la nouvelle loi d’ecoule-ment et celles de l’essai en laboratoire utilisant une loid’ecoulement traditionnelle affichent une bonne concor-dance, indiquant ainsi que l’effet de la non coaxialite aupic est faible. La deviation de la direction d’extensionlineaire zero au pic est moins de 38. On conclut que lesmesures de frontiere realisees sur l’instrument de cisaille-ment direct sont adaptees a la determination du compor-tement de resistance et de changement de volume des solsgranulaires.
INTRODUCTIONThe direct shear apparatus (DSA) is one of the most widelyused devices for obtaining effective stress shear strengthparameters for soil. It has played an important role in thedevelopment of geotechnical engineering and in the funda-mentals of soil mechanics. Its use dates back approximately150 years to when Alexandre Collin conducted direct sheartests for slope stability analyses (Skempton, 1949). Majorcriticisms of the direct shear test include non-uniformity ofstresses and strains applied to the sample (Terzaghi & Peck,1948; Hvorslev, 1960; Saada & Townsend, 1981) and ambi-guity in interpreting shear strength parameters at failure(Morgenstern & Tchalenko, 1967). For these reasons, thedirect shear test fell out of favour in the geotechnicalcommunity for some time.
However, in recent years the direct shear test has seenresurgence in its use, primarily because tests are simple andtypically of lower cost than a triaxial test. Furthermore,standard tests (ASTM D 5321-02) to determine the strengthof geosynthetic interfaces are based on the direct shear test.Potts et al. (1987) used finite element analyses to show thatstresses and strains within the final failure zone are fairlyuniform, and progressive failure effects were found to be
minor, despite the non-uniform stresses and strains withinthe box before failure. It was concluded that peak shearstrength from the DSA is very close to that obtained in idealsimple shear.
Radiography observations by Jewell & Wroth (1987) showthat a uniform band of deforming sand across the samplecentre exists at the peak state, and the direction of zerolinear extension is nearly horizontal. Jewell & Wroth alsodeveloped relationships between plane strain friction angle�ps, direct shear friction angle �ds, critical state plane strainfriction angle �crit and dilation angle ł by introducingDavis’s (1968) equation and Rowe’s (1962) stress–dilatancyrelationship. This Rowe–Davis framework is based on threemajor assumptions, which are generally valid for dense sandat peak stress ratio.
(a) The deforming sand inside the shear band is sufficientlyuniform to be described by a single state of stress andstrain increment.
(b) The incremental strain is plastic, and direction of zerolinear extension is horizontal.
(c) The orientation of principal stress is coaxial with thatof principal strain increment.
An improved version of this framework is given by Lings &Dietz (2004).
Extensive experimental and numerical data exist in theliterature showing the importance of non-coaxiality in pre-diction of strain localisation, stress–dilatancy and energydissipation behaviour of granular soils (e.g. Arthur et al.,1977; Miura et al., 1986; Gutierrez et al., 1993; Gutierrez &
Manuscript received 12 August 2005; revised manuscript accepted9 February 2007.Discussion on this paper closes on 1 February 2008, for furtherdetails see p. ii.* Department of Civil and Environmental Engineering, VirginiaTech, Blacksburg, USA.

Ishihara, 2000). Gutierrez & Ishihara (2000) showed thatplastic potentials, which are scalar functions of stress invar-iants, implicitly assume coaxiality and cannot be used forloading involving principal stress rotation. Energy dissipationcalculated from the principal stress and plastic strain incre-ment invariants is overestimated in the case of non-coaxialflow. Gutierrez & Ishihara (2000) concluded that constitutiverelations cannot be fully formulated in the principal stressspace unless non-coaxiality behaviour is taken into account.
This study presents additional evidence that justifies theuse of the DSA data at peak state and shows why results arecomparable to simple shear within the shear band. Anextended Rowe–Davis framework is introduced that accountsfor the effects of non-coaxiality behaviour and deviation ofzero extension direction from horizontal. The paragraphsbelow describe development of relations for stress, strain,flow rule and plane-strain angle of friction accounting fornon-coaxiality. Microscopic quantities are related to conti-nuum-based quantities through theories of shear-inducedanisotropy and homogenisation of granular material. A seriesof numerical simulations based on discrete element simula-tions of a direct shear box test are described.
THEORETICAL BACKGROUNDStress tensor and shear-induced anisotropy
The average stress tensor (Rothenburg & Selvadurai,1981, Christoffersen et al., 1981) acting on a granularassembly can be computed as
� ij ¼1
V
XNc
k¼1
f ki l k
j (1)
where f ki is the ith component of the contact force acting at
the kth contact point between the two particles; l kj is the jth
component of the branch vector connecting the centroids oftwo particles forming the kth contact point (Fig. 1); and Nc
is the total number of contacts in the volume V. A contact iscreated only when it transmits contact force, f.
Rothenburg (1980) introduced the two-dimensional, sec-ond-order density distribution tensors of fabric (Fij), averagecontact normal force (Nij) and average contact shear force(Sij) to describe the anisotropy of fabric and contact forcesin a granular system. These tensors can be defined either ina discrete way using contact normal and contact forceinformation for all the particles, or in a continuum way byintroducing the density distribution functions E(Ł), f n(Ł) andf s(Ł) for contact normal, contact normal force and contactshear force in the granular system respectively. Bathurst &Rothenburg (1990) proposed the Fourier series expressionsfor E(Ł), fn(Ł) and f s(Ł) by using anisotropy parameters.Specifically, parameters a, an, as and aw are employed todescribe the magnitudes of contact normal, contact normalforce and contact shear force anisotropy respectively, andparameters Ła, Łn and Łs are employed to describe the
principal directions of contact normal, contact normal forceand contact shear force anisotropy respectively.
With E(Ł), fn(Ł), f s(Ł) and contact vector length distribu-tion l j(Ł), equation (1) can be rewritten as
� ij ¼ mv
ð2�
0
fn Łð Þni þ f s Łð Þti
� �l j Łð ÞE Łð ÞdŁ (2)
where mv ¼ Nc/V is the contact density; n ¼ (cos Ł, sin Ł) isthe unit contact normal vector; and t ¼ (�sin Ł, cos Ł) is thevector perpendicular to n. For a granular assembly ofspherical particles with a narrow size distribution, equation(2) can be expressed as
� ij ¼ mv l0
ð2�
0
f n Łð Þni n j þ f s Łð Þti n j
� �E Łð ÞdŁ (3)
where l j(Ł) ¼ l0 n j ¼ l0 sin Ł; and l0 is the average contactvector length over the assemblage. Bathurst & Rothenburg(1990) assumed Ła ¼ Łn ¼ Łs and derived expressions forstress components �11, �22 and �12 as functions of anisotropyparameters. In this paper, their equations are extended to amore general case where Ła 6¼ Łn 6¼ Łs. Substituting theFourier series expressions for E(Ł), f n(Ł) and f s(Ł) intoequation (3) and integrating, one obtains
�11 ¼ p
�1 þ a � an
2cos 2 Ła � Łnð Þ
þ 1
2a cos 2Łað Þ þ an cos 2Łnð Þ þ as cos 2Łsð Þ� �
� a � aw
2sin 2Łað Þ
�(4)
�22 ¼ p
�1 þ a � an
2cos 2 Ła � Łnð Þ
� 1
2a cos 2Łað Þ þ an cos 2Łnð Þ þ as cos 2Łsð Þ� �
þ a � aw
2sin 2Łað Þ
�(5)
�12 ¼ �21
¼ p
�1
2a sin 2Łað Þ þ an sin 2Łnð Þ þ as sin 2Łsð Þ� �
þ a � aw
2cos 2Łað Þ
�(6)
where
p ¼ mv l0 f0
2(7)
Equations (4)–(6) imply that the average stress tensor withina granular system is a function of the anisotropy of contactnormals and contact forces. The shear strength of thegranular assemblage depends on its capacity to develop theanisotropy of fabric, contact normal forces and contact shearforces.
Strain tensor and mesh-free methodThe spatial discretisation approach is the most often used
method to compute strains (e.g. Thomas, 1997; Dedecker etal., 2000; Cambou et al., 2000; Bagi & Bojtar, 2001).Generally, these methods first discretise the granular volumeby constructing a nodal graph and then calculate the displace-
y
O x
f k
lkn
t
f kn
f k
f ks
Fig. 1. kth contact point between two particles
514 WANG, DOVE AND GUTIERREZ

ment gradient by interpolating between adjacent nodes.O’Sullivan et al. (2003) pointed out two major problemscontributing to inaccurate estimates of strain inside localisedzones of granular media: (a) neglecting particle rotation,which is known to play an important role in shear bandformation; and (b) using linear local interpolation functions,which results in erratic inter-element strain values within theshear band. To avoid the above problems, O’Sullivan et al.(2003) developed and applied a higher-order, non-local,mesh-free method employing a cubic spline interpolationfunction that accounts for particle rotation. However, it wasfound by the authors that the higher-order mesh-free interpo-lation functions do not smooth the displacement gradientsatisfactorily within the shear band, and are unable to resolvestrain localisation accurately inside the direct shear box.
Because of the above issues, a modified mesh-free methodthat does not use interpolation functions and calculates thedisplacement gradient directly based on movements of in-dividual particles is proposed herein. A detailed comparisonbetween simulation results evaluated using the current meth-od and the method of O’Sullivan et al. (2003) is given byWang (2006).
For the current problem involving large-strain localisationinside the granular medium, the Green–St Venant straintensor Eij can be expressed as
Eij ¼ 12
ui, j þ u j,i þ uk,iuk, jð Þ (8)
where ui , j is the displacement gradient tensor. It is based onthe deformation measure related to the reference configura-tion. For peak or pre-peak shear deformation involving slightdegree of strain localisation, the second-order term in equa-tion (8) can be neglected with little error, and the small-strain tensor eij is computed by
eij ¼ 12
ui, j þ u j,ið Þ (9)
The mesh-free method used in this study employs a grid-type discretisation over the reference configuration. Thespacing between adjacent grid points used in this study is0.64 mm in the horizontal direction and 0.7 mm in thevertical direction. As a general guide, a grid spacing of themedian particle diameter (D50) is sufficient to capture theshear localisation at a satisfactory resolution.
A diagram of the approach is given in Fig. 2, where a
rectangular grid is superimposed over the volume of parti-cles prior to any deformation and serves as the continuumreference space. Then each grid point in the reference spaceis assigned to an individual particle j that has the property
d j
r j
<di
ri
i ¼ 1, 2, . . ., Np; i 6¼ j� �
(10)
where ri is the radius of particle i; di is the distance betweenthe grid point and the centroid of particle i; and Np is thetotal number of particles within the volume (Fig. 2(a)). Ifthe ratio of the distance between the particle centroid and itsassociated grid point to the particle radius is the least amongall the particles, then the grid point is considered a point onthe rigid or extended body of the particle. In fact, any point(not necessarily the grid point) inside the volume can beassigned to a particular particle using equation (10). Allpoints that are assigned to a given single particle are thenconnected to form a region that belongs to this particle.
Displacement of the grid point is calculated using theprinciple of rigid body motion of the particle,
ugx ¼ up
x þ d cos Ł0 þ øð Þ � cos Ł0ð Þ½ �ug
y ¼ upy þ d sin Ł0 þ øð Þ � sin Ł0ð Þ½ � (11)
where ugx, ug
y and upx, up
y are the x and y components ofdisplacement of grid point and particle centroid respectively;d is the distance between the grid point and the particlecentroid; Ł0 is the initial phase angle of the grid pointposition relative to the particle centroid; and ø is theaccumulated rotation of the particle (Fig. 2(b)). The displa-cement of any point inside the volume can be uniquelydetermined using this method: therefore a unique straintensor is obtained at any stage of the simulation. Thismethod also takes into account the particle rotation: there-fore it is able to capture accurately the actual strains that thegranular media is experiencing.
Stress–dilatancy relationshipRowe (1962) presented the stress–dilatancy relationship
�1
�3 1 þ d�=d�1ð Þ ¼ tan 2 �
4þ ��
2
� �(12)
where d� and d�1 are the volumetric strain increment and
y
O
Initial position
Final position
x
Grid pointω
θ0ug
up θ ω0 �
Grid point
Particle
Centroidrj
dj
0·64 mm
0·7
mm
(a) (b)
Fig. 2. Schematic diagram of the mesh-free method: (a) association of a grid point with a certainparticle; (b) displacement of grid point and its associated particle
DISCRETE-CONTINUUM ANALYSIS OF SHEAR BANDING IN THE DIRECT SHEAR TEST 515

major principal strain increment respectively, and �� is theinterparticle friction angle. The direction of particle move-ment takes the fixed angle of (� � ��)/2 from the majorprincipal stress direction. Niiseki (2001) formulated Rowe’sequation on the plane of maximum strength mobilisationusing optimality theory. He showed that �� depends not onlyon the mineral surface properties of the particles but also ondeformation mechanisms.
Non-coaxial behaviour is observed in granular systemsinvolving significant stress rotations. An extended stress–dilatancy relationship based on Niiseki (2001) is used hereinthat accounts for non-coaxiality effects. The detailed deriva-tion is presented in Appendix 1.
This extended stress–dilatancy equation (flow rule) iswritten as
tan�
4þ �ps
2
� �¼ tan
�
4þ �crit
2
� �tan
�
4þ A
2
� �(13)
It can also be written as
sin�ps ¼sin�crit þ sin A
1 þ sin�crit sin A(14)
or
1 þ sin�ps
1 � sin�ps
¼ 1 þ sin�crit
1 � sin�crit
1 þ sinł cos 2˜
1 � sinł cos 2˜(15)
where ˜ is the angle between the principal stress and theprincipal strain increment direction, and A is the nominaldilation angle. Equations (13)–(15) are the extended Rowe’sstress–dilatancy relationships accounting for non-coaxiality.The nominal dilation angle A takes the place of the actualdilation angle ł. It is usually smaller than the actual dilationangle owing to non-coaxiality effects.
In Appendix 2, the relationship between plane strain anddirect shear angles of friction for the most general case isderived. Two possible shear band orientations at peak stressratio result. The Mohr–Coulomb orientation assumes that theshear band lies in the plane of maximum mobilised strength:
ŁC ¼ 12�ps � �� �
(16)
The Roscoe solution assumes the shear band lies in thedirection of zero linear extension:
ŁR ¼ 12ł� Æð Þ (17)
where ŁC and ŁR denote the angle between the shear band andthe horizontal direction. These angles are shown in Fig. 3.
NUMERICAL ANALYSIS OF DIRECT SHEAR BOXDEM model of direct shear box
Discrete element simulations of a direct shear test wereperformed using PFC2D (Itasca, Inc.). Data from the particlelevel can be used to obtain continuum-level information suchas stress and strain. The discrete element method (DEM)model of a direct shear box shown in Fig. 4 is 88 mm longand 56 mm high. These dimensions were found by Wang(2006) to minimise boundary effects. The top and bottomboundaries are made up of continuous triangular ‘sawtooth’asperities that prevent circulation of particles. Results fromlaboratory direct shear tests using 0.7 mm glass beads byDove (1996) and Dove & Jarrett (2002) were used tocalibrate the DEM model. Glass bead properties measured inthe laboratory, such as particle density, shear modulus andinterparticle friction coefficient, were directly used in thesimulations discussed herein.
Specimens are consolidated to equilibrium under a speci-fied normal stress during the initial confinement stage.Interparticle friction coefficients during the consolidationphase are selected to achieve a desired target initial density.The lower the initial density, the higher the interparticlefriction required and, as a result, the higher the initial built-in shear stress. The lateral and bottom boundaries are fixed.The top boundary rotates and moves in the vertical direc-tion to maintain constant normal stress. Shearing occurs bydisplacing the lower half of the box to the right at aconstant velocity of 1 mm/min. Horizontal stress, horizontaldisplacement and vertical displacement are evaluated at theboundaries.
The Hertz–Mindlin contact model was implemented in allthe simulations. An additional particle rolling resistancemodel (Wang et al., 2004) was also applied at both particle/
τ
O
Pole fordirection
Plane of maximumstress ratio
θC
σ3
�
( , )σ τyy yx
s
t( , )σ τxx xy
σ
Pole for planedirectionσ1
σ1
φds
φps
dε3
Pole fordirection
α
(d , d /2)ε γyy yx
d /2γ
d /2γ
ψ d directionε1
dε
Zero extensiondirection
dε1
d /2γ
θR (d , d /2)ε γxx xy
Fig. 3. Mohr’s circles: (a) stress; (b) incremental strain
28 mm
28 mm
Shear direction
88 mm
Fig. 4. DEM model of a direct shear box
516 WANG, DOVE AND GUTIERREZ

particle contacts and particle/boundary contacts. Physicalconstants used in the simulations include: glass bead density2650 kg/m3; glass bead shear modulus 29 GPa (Dove et al.,2006); particle Poisson’s ratio 0.3; critical normal and shearviscous damping coefficient both 1.0; time step5:0 3 10�5 s; and interparticle and particle/boundary frictioncoefficient during shear 0.5 and 0.9 respectively. The valuesof physical constants other than those directly measuredwere determined through a parametric study with laboratorydata validation conducted to obtain realistic macro- andmicromechanical model behaviour. Wang (2006) providesdetailed information on model validation.
Numerical simulationsA series of numerical simulations were performed in which
particle size distribution (Dmax/Dmin), initial relative density(Dr), interparticle friction coefficient (�p) during consolida-tion and normal stress (�n) were varied to examine theireffects on the shear banding behaviour. The values of eachvariable used in the simulations are listed in Table 1.Particles had randomly generated diameters between Dmax
and Dmin, resulting in a nearly linear particle size distribution.However, the median particle diameter D50 in all casesremained 0.7 mm. Sixteen evenly spaced particle columnsextending from bottom to top of the box were marked beforeshear. Displacements and velocities of these particle columnswere recorded during each test. Fig. 5 shows a typical profileof deformed columns in a dense sample (Simulation D).Shear distortion of the sample is found to concentrate into anarrow zone with an overall slightly concave shape locatedalong the middle plane of the box. The shape is believed tobe related to the non-uniform stress condition inside the shearbox before shearing starts. No shear distortion can be ob-served outside the shear band, where the deviatoric straindistribution is also fairly uniform except near the sideboundaries. These observations for a dense sample agree withfinite element analyses of Potts et al. (1987), who observed ashear zone of nearly constant cross-section in spite of non-uniform stress and strain conditions before failure.
The stress and strain conditions inside the shear bandwere recorded using a 28 mm high sampling window sym-metrical about the middle plane of the box, as shown in Fig.5. The length of the window was initially equal to the lengthof the box but was allowed to decrease during the shearprocess by an amount equal to the shear displacement.Inside the sampling window the average stress was calcu-lated by equation (1). Anisotropies of fabric and contactnormal and shear forces were calculated using their corre-sponding second-order tensors Fij, Nij and Sij (Rothenburg,1980), and approximated by their Fourier series expressions(Bathurst & Rothenburg, 1990). For a granular assemblywith narrow size distribution (Simulations B, E, F, H and J)the average stress was also calculated by equations (4)–(6),using anisotropy parameters. The strain field was thencalculated by equation (8) or equation (9), and the averagestrain tensor inside the sample window was calculated as the
arithmetic average of the individual strain values at all thegrid points lying inside the sampling window. Thereafter thecalculated average stress and strain values were used toverify the theoretical relationships presented above.
Through the stress and strain tensors defined in equations(1), (8) and (9), the particle displacements, rotations andinterparticle contact forces at the discrete level were homo-genised into stress and strain at the continuum level. Sincethe computation of the average stress and strain tensor wasperformed inside the same sampling region, the kinetics andkinematics of individual particles ensure that the two tensorsare work-conjugate and can be used to evaluate the proposedstress–dilatancy equation effectively.
Stress–displacement relationTypical stress–displacement relations from simulations of
a dense sample (Simulation D) and a medium-dense sample(Simulation I) are shown in Fig. 6(a). Besides the conven-tional curve of direct shear stress ratio evaluated at theboundary, two additional curves representing the plane strainstress ratio and direct shear stress ratio inside the windoware also included. It is clear that the peak stress ratio ishigher and occurs at a lower displacement in the densesample than in the medium-dense sample. More apparentpost-peak strain-softening behaviour is also observed in thedense sample. The shear band begins propagating from thelateral boundaries at the onset of non-linear stress–displace-ment behaviour.
The direct shear and plane strain stress ratios calculatedby equation (1) are based on the average stress conditionsinside the sampling window, which extends to the midheight of the upper and lower boxes. Because the samplingwindow incorporates a number of particles that lie outsidethe intense shear zone, the computed average stress ratiosare lower than that evaluated at the boundary. Use of asmaller window, focused on the shear zone, will give resultscloser to the value evaluated at the boundaries. The shapes
Table 1. Values of variables used in the numerical simulations
Variable Numerical simulation
A B C D E F G H I J K
Dmax/Dmin 3.0 1.1 3.0 3.0 1.1 1.1 3.0 1.1 3.0 1.1 3.0�p 0 0 0.3 0 0.3 0 0.5 0 0.5 0.5 0.5�n: kPa 300 300 100 100 100 100 50 50 25 25 15Dr: % 112 118 82 89 80 96 65 87 53 46 46
1 2 3 4 5 6 7 8 9 10 161514131211
Columns
28
14
0
�14
�28
mm
0 11 22 33 44 55 66 77 88
mm
Fig. 5. Deformed columns inside the shear box, Simulation D,5 mm shear displacement (bold solid line, shear box; bolddashed line, window for stress and strain analysis)
DISCRETE-CONTINUUM ANALYSIS OF SHEAR BANDING IN THE DIRECT SHEAR TEST 517

of the direct shear and plane strain stress ratio curves arequite similar to that of the conventional curve. As expected,there is little difference throughout the shear process be-tween the plane strain and direct shear curves measuredinside the sampling window. However, it is not implied thatthe direct shear and plane strain angle of friction are nearlyequal in general. Results presented herein are for a two-dimensional case where there is no intermediate principal
stress. It is anticipated that differences between the directshear and plane strain stress ratios would result in a 3Dsimulation because of the influence of the intermediateprincipal stress. Three-dimensional simulations to confirmthis are needed.
Figure 6(b) illustrates the dependence of computed aver-age stress ratio at peak state on the sampling window size.A linear relationship between the window height and the
Str
ess
ratio
,/τσ
Direct shear-boundary evaluated
Plane strain-window evaluated
Direct shear-window evaluated
0 4 8 12 16 20
0·8
0·6
0·4
0·2
0
Horizontal displacement: mm
(a)
Direct shear-boundary evaluated
Plane strain-window evaluated
Direct shear-window evaluated
0 3 6 9 12 15
0·8
0·6
0·4
0·2
0
Horizontal displacement: mm
0 4 8 12 16 20
0·8
0·6
0·4
0·2
0
Horizontal displacement: mm
(c)
0 3 6 9 12 15
0·8
0·6
0·4
0·2
0
Horizontal displacement: mm
0 4 8 12 16 20
0·8
0·6
0·4
0·2
0
Horizontal displacement: mmSimulation D
(d)
0 3 6 9 12 15
0·8
0·6
0·4
0·2
0
Horizontal displacement: mmSimulation I
S bands form2
S bands form1
S bands form2
S bands form1
Str
ess
ratio
,/τσ
Ver
tical
dis
plac
emen
tof
top
wal
l: m
m(
/ )
/τ
σav
e(
/ )
τσ
boun
dary
1·0
0·9
0·8
0·7
0·6
0·50 0·2 0·4 0·6 0·8 1·0
Window horizontal position
30 mm–40 mm
30 mm–50 mm
Default position
(b)
1·0
0·9
0·8
0·7
0·6
0·50 0·2 0·4 0·6 0·8 1·0
Window horizontal position
45 mm–60 mm
40 mm–60 mm
Default position
Ratio of window height:box height Ratio of window height:box height
Fig. 6. Stress, volume change against displacement for dense and medium-dense well-graded sample: (a) stressratio–displacement relationship evaluated at boundaries and inside sampling window; (b) dependence of computedaverage stress ratio at peak state on sampling window size; (c) volume change–displacement relation evaluated atboundaries; (d) influence of shear band initiation on stress ratio–displacement relationship evaluated fromboundary measurements
518 WANG, DOVE AND GUTIERREZ

average stress ratio exists for both dense and medium-densesamples. When the ratio of window height to the boxheight is unity, the average (direct shear) stress ratio isnearly half of the boundary-evaluated value. As the ratiodecreases, the computed average stress ratio increases untilit reaches about 83% of the boundary-evaluated value.Higher values cannot be obtained unless the window lengthis modified. This is because the original window lengthincludes particles near the boundary that do not resist themost intense shear distortion at peak state. Values close tothe boundary evaluation are obtained when the windowlength is reduced to about 10–20 mm and centred alongthe middle of the box. This finding indicates that the sheardeformation is most intensely resisted by a small numberof particles located near the middle of the box beforefailure occurs. Values evaluated at the boundaries aredominated by the contribution of these particles to thestress ratio. Effects of progressive failure exist as shearlocalisation develops from the boundary towards the middle,and overall failure of the granular assemblage occurs afterthe particles sustaining the highest stress ratio at the middleof the box yield.
Figure 6(c) shows the volume change evaluated by thevertical displacement of the top boundary against sheardisplacement. For the dense sample, continuous dilatancyis observed during shear until the end of the test whendilation rate approaches zero, while for the medium-densesample with lower confining stress, critical state with zerovolume change was reached earlier with less total dilation.The greatest dilatancy rate occurs at the peak state forboth cases. An interesting feature of the volume changecurves is that there is a distinct and sudden change ofslope at post-peak state for both samples (at about 3 mmfor Simulation D and 5 mm for Simulation I). Similarfeatures have been observed for the other simulations. Thisabrupt change of dilatancy rate corresponds to the post-
peak state when critical stress condition is reached for thefirst time. The rate of volume change approaches zeroafter this state, and the energy is exclusively dissipated byinterparticle sliding and rolling. From the microscopicpoint of view the granular medium has completed the firstrearrangement of particles. Interparticle sliding and rollingdo not introduce any additional dilatancy and serve onlyto dissipate the external work. Shear banding, whichbegins early before the peak state, extends more rapidlyafter this state.
Figure 6(d) shows the approximate locations of the onsetof primary and secondary shear bands. This occurs wellbefore the peak stress ratio is reached. As the shear bandslengthen and coalesce, the stress–displacement responsebecomes more non-linear until peak stress ratio is reached.Detailed discussion of shear band formation is presented ina later section.
Strength and dilatancy behaviourThe peak and critical state strength ratios and dilatancy
angles for the 11 numerical simulations evaluated at theboundaries and inside the windows are summarised in Tables2 and 3 respectively. The peak dilatancy angles evaluated atthe boundaries are based on the vertical incremental displa-cement of the top wall, implicitly assuming that the zerolinear extension direction is horizontal at peak, while thepeak dilatancy angle inside the sampling window is strictlybased on equation (42). It can be seen that the peakdilatancy angles inside the window are larger than those atthe boundaries, suggesting that greater dilatancy occurs in-side the shear zone than can be evaluated at the boundarydue to averaging effects. Also included in Table 3 are thenon-coaxiality angle ˜ and the corresponding nominal dila-tion angle A at peak state.
Table 2. Peak and critical state strength ratios and dilation angles from simulation boundary evaluations
Parameter Numerical simulation
A B C D E F G H I J K
Peak �/� 0.618 0.584 0.63 0.713 0.54 0.585 0.638 0.656 0.623 0.508 0.626Peak �ds: degrees 31.7 30.3 32.2 35.5 28.4 30.3 32.5 33.3 31.9 26.9 32.0Critical state �/� 0.46 0.43 0.44 0.42 0.4 0.4 0.43 0.42 0.45 0.4 0.43Critical state �ds: degrees 24.7 23.3 23.7 22.8 21.8 21.8 23.3 22.8 24.2 21.8 23.3Peak ł: degrees 5.7 5 8.8 10.5 4.4 5 9.2 5.4 9.2 3.7 10.5
Table 3. Peak and critical state strength ratios and dilation angles evaluated inside the sampling window
Parameter Numerical simulation
A B C D E F G H I J K
Peak (�/�)ps 0.452 0.402 0.408 0.47 0.387 0.427 0.418 0.456 0.42 0.346 0.407Peak (�/�)ds 0.447 0.4 0.405 0.467 0.381 0.415 0.413 0.455 0.415 0.341 0.403Peak �ps: degrees 24.3 21.9 22.2 25.2 21.2 23.1 22.7 24.5 22.8 19.1 22.1Peak �ds: degrees 24.1 21.8 22.0 25.0 20.9 22.5 22.4 24.5 22.5 18.8 21.9Critical state (�/�)ps 0.315 0.244 0.24 0.24 0.25 0.25 0.25 0.24 0.26 0.256 0.24Critical state (�/�)ds 0.313 0.24 0.24 0.234 0.24 0.24 0.25 0.24 0.26 0.244 0.236Critical state �ps: degrees 17.5 13.7 13.5 13.5 14.0 14.0 14.0 13.5 14.6 14.4 13.5Critical state �ds: degrees 17.4 13.5 13.5 13.2 13.5 13.5 14.0 13.5 14.6 13.7 13.3Peak ł: degrees 5.8 7.5 9.1 13 6.1 7 10 6.3 10 4.2 13Peak ˜: degrees �2.4 �3.58 �5.6 0.9 0.8 1.3 �5.36 �5.6 �4.23 1.8 �2Peak A: degrees 5.8 7.4 8.9 13.0 6.1 7.0 9.8 6.2 9.9 4.2 13.0
DISCRETE-CONTINUUM ANALYSIS OF SHEAR BANDING IN THE DIRECT SHEAR TEST 519

Shear-induced anisotropyBathurst & Rothenburg (1990) show that the shear
strength of a granular assemblage depends on its capacity todevelop the anisotropy of fabric and contact forces. Fig. 7illustrates the evolution of anisotropies of fabric, contactnormal force and contact shear force inside the samplingwindow. It can be seen that contact normal force and shearforce anisotropies grow significantly after shearing begins,and reach their maximum at peak state. After peak state theanisotropies of contact normal force and contact shear forcedecrease rapidly. Besides the magnitude, the orientations ofthe anisotropies also rotate significantly during shear, espe-cially before peak.
Contact shear force does not exist in Simulation D beforeshear owing to zero interparticle friction used in the con-solidation stage to achieve high relative density. For caseswith lower initial relative density interparticle friction isintroduced, resulting in less isotropic stress condition andfinite built-in shear stress at the end of consolidation. Thisresults in a finite value of contact shear force anisotropy
before shear. However, this has little influence on the subse-quent shearing process.
It is interesting to note that the anisotropies shown in Fig.7 do not display full symmetry, as observed by Bathurst &Rothenburg (1990) in their biaxial simulations. This isprobably because, in the direct shear box simulation, theexternal loading condition exerted by the lower box bound-aries is not fully symmetric, which leads to some asymmetryin the distribution of contact normals. The asymmetric fabricleads to the asymmetric distributions of contact normal forceand shear force required to maintain the overall equilibriumof the granular assemblage.
Figure 8 presents two sets of data from a dense sample(Simulation D) and a medium-dense sample (Simulation I),showing the evolution of anisotropy parameters during shear.It can be seen that, for both cases, magnitude of contactnormal anisotropy (a) varies slightly and thus has much lesseffect on the macroscopic shear strength than those ofcontact normal force (an) and shear force (as) anisotropies.The orientations of contact normal (Ła) and contact normal
Density distributions
Contact normal Contact normal force Contact shear force
90° 0·05
0°
270°
180°
(a)
θa 2°�
90° 0·06
0°
270°
180°
θn 0°�
90° 0·008
0°
270°
180°θs NA�
90° 0·05
0°
270°
180°
(b)
θa 40°�
90° 0·06
0°
270°
180°
θn 35°�
90° 0·008
0°
270°
180°
θs 37°�
90° 0·05
0°
270°
180°
(c)
θa 37°�
90° 0·06
0°
270°
180°
θn 39°�
90° 0·008
0°
270°
180°
θs 45°�
Simulation
Fourier series approximation
Fig. 7. Evolution of anisotropies of contact normal, contact normal force and contact shear force inside shear zoneduring shear process (Simulation D): (a) before shear, 0 mm displacement; (b) at peak state, 2.3 mm displacement;(c) at steady state, 10 mm displacement
520 WANG, DOVE AND GUTIERREZ

force (Łn) anisotropy agree well with each other since thecontact distribution is defined only by contacts that transmitforces. Coincidence between the orientation of contact nor-mal force anisotropy and the major principal stress directionhas been observed during all stages of the simulations.However, some deviation is observed between the orienta-tions of contact shear force anisotropy (Łs) and contactnormal anisotropy (Ła). This corresponds to the situationwhere there is a finite value of aw that compensates for toofew contact normals in the major principal stress direction.However, this effect is not great, and the value of aw isnearly zero, as shown in Fig. 8.
Strain localisation inside the shear bandStrain localisation inside the box during shear can be
visualised by individual particle displacements and shearstrain distributions recorded at different shear displacements.The horizontal displacements of four selected particle col-umns and shear strain (e12) contours from Simulation D atinitiation of shear, pre-peak, peak and post-peak state areshown in Fig. 9. The shear strain (e12) value is calculatedbased on equations (9) and (11) using the mesh-free methodproposed above. Locations of columns referenced in Fig. 9are given in Fig. 5.
Figure 9(a) provides supporting evidence that the shearingcondition inside the middle of the direct shear box is idealsimple shear during the initial loading. Owing to the bound-ary constraint, strain localisation begins at the two lateralboundaries. However, for the material located in the middleof the box uniform deformation dominates during initialshearing. A fairly small and uniform strain field can befound inside the entire box except in areas near the lateralboundaries. A linear profile of particle displacement is ob-served on Columns 8 and 9. This is in contrast with thecurved profiles of Columns 2 and 15 due to boundaryconstraint.
As shearing proceeds, the shear zone extends slowlytoward the middle of the box from the boundaries. Concur-rently, non-linear stress–displacement behaviour begins (Fig.6(d)). At the pre-peak state some shear distortion has takenplace, even in the two most middle columns, indicating that
the shear band has extended over the length of the middleplane (Fig. 9(b)). At peak state (Fig. 9(c)) a distinct shearband has formed, which becomes more continuous andexpansive with post-peak strain-softening (Fig. 9(d)). Itshould be noted that the resolution of strain contours used inFigs 9(a) and 9(b) is four times greater than that used inFigs 9(c) and 9(d) in order to visualise the shear bandclearly at pre-peak stages. As a result, some features ofstrain localisation, in addition to the major shear band, aremasked in Figs 9(c) and 9(d).
It is interesting to find that the overall shape of the shearband is slightly curved, and deviates from the horizontal. Asdescribed earlier, this is due to the non-uniform stresscondition at the beginning of shearing. But a uniform shearstrain distribution both inside and outside the shear band isquite evident, indicating that progressive failure is of minorimportance in a dense sample. Besides the major shear band,a secondary inclined shear zone forms near the left sideboundary. This minor shear zone develops from the earlystage of shearing and is caused by the boundary constraint,as discussed in the following section.
Comparison of shear band patterns with existing laboratoryobservations
With the information of strain localisation obtained fromDEM modelling, it is of interest to compare the shear bandpatterns observed from the simulations with experimentalfindings in the literature. Representative work includes theshear band patterns observed in laboratory DSA tests onsand by Scarpelli & Wood (1982), and microstructure ob-servations made in DSA tests on kaolin by Morgenstern &Tchalenko (1967). The same terminology of structure andsubstructure of shear bands, denoted as Sk and Skb respec-tively, will be used to describe the shear band. The subscriptk refers to the order of appearance of the shear bands.
In general, the shear band patterns observed in the simula-tions agree well with those from Scarpelli & Wood (1982).For example, in a dense sample (Simulation D), a shearband S1 sloping at an angle of about 258 from the horizontalwas first observed to occur at both ends of the box inopposite directions owing to boundary constraint (Fig. 9(b)).
Ani
sotr
opy
para
met
er
0·7
0·5
0·3
0·1
0
an
asa aw
0·7
0·5
0·3
0·1
0
an
as
a
aw
0 3 6 9 12 15 0 3 6 9 12 15
60
40
20
0
Prin
cipa
l dire
ctio
n of
anis
otro
py: d
egre
es
0 3 6 9 12 15 0 3 6 9 12 15Horizontal displacement: mm
(a)
θa
θn
θs
60
40
20
0
θa
θn
θs
Horizontal displacement: mm(b)
Fig. 8. Evolution of magnitudes and orientations of anisotropies during shear: (a) Simulation D; (b) Simulation I
DISCRETE-CONTINUUM ANALYSIS OF SHEAR BANDING IN THE DIRECT SHEAR TEST 521

Subsequently, a major shear band S2, starting from both endsand making an angle of about 158 from the horizontal, wasobserved to extend towards the middle of the box. Thismajor shear band forms mainly as a result of the kinematicrequirement of boundary movement to be aligned with zeroextension direction. Primary shear band features are markedin Fig. 9(b) and are in good agreement with Scarpelli &Wood (1982). Other features of minor shear bands were not
found in Simulation D owing to its high initial relativedensity.
For a sample with lower initial relative density, morecomplicated structures of shear bands were observed. Fig. 10shows the shear strain contours and sketches of shear bandstructures from two medium-dense samples (Simulations Jand K) at peak and post-peak state. In contrast with densesamples, the shear bands in medium-dense samples are more
1 0· 1 5·
28
14
0
�14
�280 0·1 0·2 0·3
0·2 mm displacement
Column 2
Column 8
Column 9
Column 15
21
0
�21
� �0·1 to 0·05 �0·05 to 0·05 0·05 to 0·1
0·6 21·1 41·6 62·1 82·6
(a)
28
14
0
�14
�28
0 0·5 0·2
1·8 mm displacement
Column 2
Column 8
Column 9
Column 15
21
0
�21� �0·1 to 0·05 �0·05 to 0·05 0·05 to 0·1
0·6 21·1 41·6 62·1 82·6(b)
28
14
0
�14
�280 0·5 1·5 2·5
2·3 mm displacement
Column 2
Column 8
Column 9
Column 15
21
0
�21
�0·1 to 0·1 0·1 to 0·3 0·3 to 0·5
0·6 21·1 41·6 62·1 82·6(c)
28
14
0
�14
�280
5 mm displacement
Column 2
Column 8
Column 9
Column 15
21
0
�21
�0·1 to 0·1 0·1 to 0·3 0·3 to 0·5
0·6 21·1 41·6 62·1 82·6
(d)
mmParticle horizontal displacement: mm
1·0 2·0 3·0 4·0 5·0 6·0
0·5 to 0·7
1·0 2·0
0·5 to 0·7
S1
S2
S2
S1
Fig. 9. Evolution of strain localisation during shear (Simulation D)
522 WANG, DOVE AND GUTIERREZ

dispersed. This is attributed mainly to the less uniform stressand strain conditions inside the sample with lower relativedensity. In a medium-dense sample the shear band S1 causedby boundary constraint occurs first in a similar manner tothat of a dense sample, but the major shear band S2
becomes more dispersed and is often composed of two
parallel shear bands on the opposite side of the middle planewith a series of subordinate shear bands developed betweenthem, as shown in Figs 10(b) and 10(d). This type ofstructure is referred to as a kink-band by Morgenstern &Tchalenko (1967), which is the dominant mode of deforma-tion in the production of the major structures. In addition tothe S1 and S2 bands, an S3 band can also occur in amedium-dense sample as a result of local void ratio change,which makes the sand more perceptible to the boundaryconstraint.
Verification of extended Rowe–Davis frameworkA comparison between peak and critical state data con-
tained in Tables 2 and 3 is presented in Fig. 11. Two setsof data are shown. The first set was evaluated insidethe sampling window and accounts for the effect of non-coaxiality. The second set includes data evaluated at theboundaries, neglecting the effect of non-coaxiality. In addi-tion, results from three series of laboratory direct shear tests(Table 4) using Ottawa 20/30 sand, C-33 concrete sand and0.7 mm glass beads (Dove & Jarrett, 2002) are given forcomparison. It is possible to evaluate the nominal dilatancyangle A only for the dataset collected inside the samplingwindow. All the other datasets, including the laboratory data,use the conventional dilatancy angle ł.
The extended flow rule is compared in Fig. 11 with thedatasets based on the original flow rule and the dataset fromthe sampling window. Referring to Fig. 11, it can be seenthat both the simulation and laboratory test data agree wellwith the extended flow rule. This indicates that the effect ofnon-coaxiality is minor for granular material at peak state,and stress and displacement evaluated at the boundaries in
S3 S2bS2 S1
S2S3
S2bS2S1
S1
S3 S2bS2
S2 S2S3
S3 S1
S1b
mm
21
0
�210·6 21·1 41·6
(a)62·1 82·6
21
0
�210·6 21·1 41·6
(b)62·1 82·6
21
0
�210·6 21·1 41·6
(c)62·1 82·6
21
0
�210·6 21·1 41·6
mm(d)
62·1 82·6
�0·1 to 0·1 0·1 to 0·3 0·3 to 0·5 0·5 to 0·7
Fig. 10. Shear band formation inside medium-dense sample:(a) Simulation J, at peak (2.4 mm displacement); (b) SimulationJ, post-peak (5 mm displacement); (c) Simulation K, at peak(2 mm displacement); (d) Simulation K, post-peak (5 mmdisplacement)
tan
π 4�
φps 2
tan π4
φcrit
2� tan π4 2
A� tan π
4φcrit
2� tan π4 2
ψ�and
Simulation: boundary-evaluated
Simulation: window-calculated
Ottawa 20/30 sand
0·7 mm glass bead
Concrete sand Flow rule
4·0
3·0
2·0
1·01·0 2·0 3·0 4·0
Fig. 11. Peak and steady state data from numerical simulationsand laboratory tests
Table 4. Laboratory direct shear test data on Ottawa 20/30 sand, C-33 concrete sand and 0.7 mm glass beads (Dove & Jarrett, 2002)
Parameter Test data
Ottawa 20/30 sand C-33 concrete sand 0.7 mm glass bead
�n: kPa 95.4 100.1 287 50 50 99 99 100 300 500Peak �ds: degrees 40.0 40.4 38.3 59.5 58.6 56.3 49.3 35.6 32.2 30.1Critical state �ds; degrees 27.9 32.2 27.9 45.0 46.4 40.4 33.0 21.8 23.3 21.3Peak ł: degrees 14 12.5 14 22.5 21.3 25.5 20.6 10 – –
DISCRETE-CONTINUUM ANALYSIS OF SHEAR BANDING IN THE DIRECT SHEAR TEST 523
DSA are valid for the analysis of constitutive behaviour atpeak state.
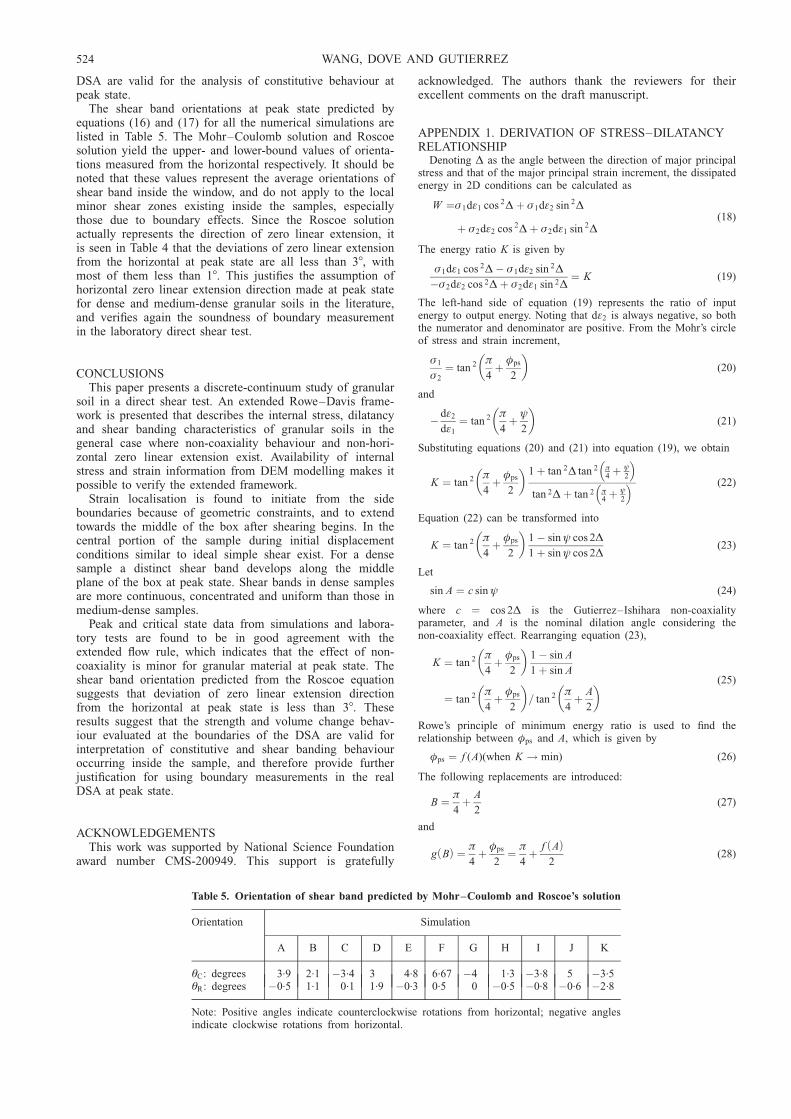
The shear band orientations at peak state predicted byequations (16) and (17) for all the numerical simulations arelisted in Table 5. The Mohr–Coulomb solution and Roscoesolution yield the upper- and lower-bound values of orienta-tions measured from the horizontal respectively. It should benoted that these values represent the average orientations ofshear band inside the window, and do not apply to the localminor shear zones existing inside the samples, especiallythose due to boundary effects. Since the Roscoe solutionactually represents the direction of zero linear extension, itis seen in Table 4 that the deviations of zero linear extensionfrom the horizontal at peak state are all less than 38, withmost of them less than 18. This justifies the assumption ofhorizontal zero linear extension direction made at peak statefor dense and medium-dense granular soils in the literature,and verifies again the soundness of boundary measurementin the laboratory direct shear test.
CONCLUSIONSThis paper presents a discrete-continuum study of granular
soil in a direct shear test. An extended Rowe–Davis frame-work is presented that describes the internal stress, dilatancyand shear banding characteristics of granular soils in thegeneral case where non-coaxiality behaviour and non-hori-zontal zero linear extension exist. Availability of internalstress and strain information from DEM modelling makes itpossible to verify the extended framework.
Strain localisation is found to initiate from the sideboundaries because of geometric constraints, and to extendtowards the middle of the box after shearing begins. In thecentral portion of the sample during initial displacementconditions similar to ideal simple shear exist. For a densesample a distinct shear band develops along the middleplane of the box at peak state. Shear bands in dense samplesare more continuous, concentrated and uniform than those inmedium-dense samples.
Peak and critical state data from simulations and labora-tory tests are found to be in good agreement with theextended flow rule, which indicates that the effect of non-coaxiality is minor for granular material at peak state. Theshear band orientation predicted from the Roscoe equationsuggests that deviation of zero linear extension directionfrom the horizontal at peak state is less than 38. Theseresults suggest that the strength and volume change behav-iour evaluated at the boundaries of the DSA are valid forinterpretation of constitutive and shear banding behaviouroccurring inside the sample, and therefore provide furtherjustification for using boundary measurements in the realDSA at peak state.
ACKNOWLEDGEMENTSThis work was supported by National Science Foundation
award number CMS-200949. This support is gratefully
acknowledged. The authors thank the reviewers for theirexcellent comments on the draft manuscript.
APPENDIX 1. DERIVATION OF STRESS–DILATANCYRELATIONSHIP
Denoting ˜ as the angle between the direction of major principalstress and that of the major principal strain increment, the dissipatedenergy in 2D conditions can be calculated as
W ¼�1d�1 cos 2˜þ �1d�2 sin 2˜
þ �2d�2 cos 2˜þ �2d�1 sin 2˜(18)
The energy ratio K is given by
�1d�1 cos 2˜� �1d�2 sin 2˜
��2d�2 cos 2˜þ �2d�1 sin 2˜¼ K (19)
The left-hand side of equation (19) represents the ratio of inputenergy to output energy. Noting that d�2 is always negative, so boththe numerator and denominator are positive. From the Mohr’s circleof stress and strain increment,
�1
�2
¼ tan 2 �
4þ �ps
2
� �(20)
and
� d�2
d�1
¼ tan 2 �
4þ ł
2
� �(21)
Substituting equations (20) and (21) into equation (19), we obtain
K ¼ tan 2 �
4þ �ps
2
� �1 þ tan 2˜ tan 2 �
4þ ł
2
tan 2˜þ tan 2 �4þ ł
2
(22)
Equation (22) can be transformed into
K ¼ tan 2 �
4þ �ps
2
� �1 � sinł cos 2˜
1 þ sinł cos 2˜(23)
Let
sin A ¼ c sinł (24)
where c ¼ cos 2˜ is the Gutierrez–Ishihara non-coaxialityparameter, and A is the nominal dilation angle considering thenon-coaxiality effect. Rearranging equation (23),
K ¼ tan 2 �
4þ �ps
2
� �1 � sin A
1 þ sin A
¼ tan 2 �
4þ �ps
2
� �= tan 2 �
4þ A
2
� � (25)
Rowe’s principle of minimum energy ratio is used to find therelationship between �ps and A, which is given by
�ps ¼ f (A)(when K ! min) (26)
The following replacements are introduced:
B ¼ �
4þ A
2(27)
and
g Bð Þ ¼ �
4þ �ps
2¼ �
4þ f Að Þ
2(28)
Table 5. Orientation of shear band predicted by Mohr–Coulomb and Roscoe’s solution
Orientation Simulation
A B C D E F G H I J K
ŁC: degrees 3.9 2.1 �3.4 3 4.8 6.67 �4 1.3 �3.8 5 �3.5ŁR: degrees �0.5 1.1 0.1 1.9 �0.3 0.5 0 �0.5 �0.8 �0.6 �2.8
Note: Positive angles indicate counterclockwise rotations from horizontal; negative anglesindicate clockwise rotations from horizontal.
524 WANG, DOVE AND GUTIERREZ

The following equation results from equations (27) and (28):
ffiffiffiffiK
p¼ F B, g Bð Þ
� �¼ tan g Bð Þ
tan B(29)
For F to take a minimum value, the following condition is required:
dF
dB¼ 1
tan 2 Bsec 2 g Bð Þ dg
dBtan B � tan g Bð Þ sec 2 B
� ¼ 0 (30)
Rearranging equation (30), the following differential equation isobtained:
dg Bð Þsin 2g Bð Þ ¼
dB
sin 2B(31)
The solution to the equation above is expressed as
º tan B ¼ tan g Bð Þ (32)
where º is an integration constant. Substituting equations (27) and(28) into equation (32) yields
º tan�
4þ A
2
� �¼ tan
�
4þ �ps
2
� �(33)
In the critical state of deformation (� ¼ �crit) and d� ¼ 0, (ł ¼ 0).From equation (24) it is determined that A ¼ 0. Thus the integrationconstant º is
º ¼ tan�
4þ �crit
2
� �(34)
Therefore the extended Rowe’s stress–dilatancy equation (flow rule)takes the form
tan�
4þ �ps
2
� �¼ tan
�
4þ �crit
2
� �tan
�
4þ A
2
� �(35)
Equation (35) can also be written as
sin�ps ¼sin�crit þ sin A
1 þ sin�crit sin A(36)
or
1 þ sin�ps
1 � sin�ps
¼ 1 þ sin�crit
1 � sin�crit
1 þ sinł cos 2˜
1 � sinł cos 2˜(37)
Equations (35)–(37) are the extended Rowe’s stress–dilatancyrelationships taking into account non-coaxiality behaviour. Incontrast to the conventional Rowe’s equation, the nominal dilationangle A takes the place of the actual dilation angle ł and is usuallysmaller than ł owing to the non-coaxiality effects.
APPENDIX 2. PLANE STRAIN AND DIRECT SHEARANGLES OF FRICTION
Assuming coaxiality and horizontal zero linear extension direc-tion, the relationship between plane strain and direct shear angles offriction is (Davis, 1968)
tan�ds ¼sin�ps cosł
1 � sin�ps sinł(38)
Where non-coaxiality exists and the zero linear extension directiondeviates from the horizontal, the following relation is found from thegeometry of Mohr’s stress circle (Fig. 3(a)):
sin�ps ¼t
s¼ tan�ds
cos � þ sin � tan�ds
(39)
where s and t are stress invariants defined as
s ¼ 12�1 þ �2ð Þ, t ¼ 1
2�1 � �2ð Þ (40)
and � is the geometrical angle shown in Fig. 3(a) with
sin � ¼ � xx � � yy
2t(41)
Note that � is equal to dilation angle ł with the assumptions ofcoaxiality and horizontal zero linear extension direction. In that case,equation (39) is identical to equation (38).
The following relationships exist from Mohr’s circle of strainincrement (Fig. 3(b)):
sinł ¼ � d�=2
dª=2(42)
and
sinÆ ¼ d�=2 � d� yy
dª=2(43)
where d� and dª are invariants of volumetric and shear strainincrement, and Æ is another geometrical angle, shown in Fig. 3(b).By defining
sin ¼ � d� yy
dª=2(44)
the following relation is obtained:
sinÆ ¼ sin � sinł (45)
For small values of and ł, equation (45) can be approximated as
Æ � � ł (46)
Noting that with the non-coaxial angle ˜ and geometries of Mohr’scircles, it can be shown that
˜ ¼ Æ� �
2or � ¼ Æ� 2˜ � � ł� 2˜ (47)
Substituting equation (47) into equation (39) yields
sin�ps ¼tan�ds
cos Æ� 2˜ð Þ þ sin Æ� 2˜ð Þ tan�ds
(48)
and
sin�ps �tan�ds
cos � ł� 2˜ð Þ þ sin � ł� 2˜ð Þ tan�ds
: (49)
Equations (48) and (49) describe the relationship between planestrain and direct shear angles of friction in the most general casewhere the principal stress direction does not coincide with theprincipal strain increment direction and the zero linear extensiondirection deviates from horizontal.
NOTATIONA nominal dilation angle considering non-coaxiality
effectsa second-order coefficient of contact normal anisotropy
an second-order coefficient of average contact normalforce anisotropy
as, aw second-order coefficient of average contact shearforce anisotropy
c cos 2˜, Gutierrez–Ishihara non-coaxiality parameterDmax, Dmin maximum and minimum particle diameter
Dr relative densityD50 median particle diameter
d distance between grid point and centroid of particled� volumetric strain increment
d�1, d�2 major and minor principal strain incrementsEij Green–St Venant strain tensor
E(Ł) density distribution function of contact normaleij Green–St Venant strain tensor neglecting the second-
order termFij second-order density distribution tensor of fabricf contact force vector
fn, fs contact normal force and shear forcef n(Ł) density distribution function of average contact
normal forcef s(Ł) density distribution function of average contact shear
forcef 0 average contact normal forceK energy ratiol branch vector
l(Ł) distribution of contact vector lengthl0 assembly average contact vector length
mv Nc/V, contact densityNc total number of contactsNij second-order density distribution tensor of average
contact normal forceNp total number of particles within the volumen unit contact normal vector
DISCRETE-CONTINUUM ANALYSIS OF SHEAR BANDING IN THE DIRECT SHEAR TEST 525

r radius of particleSij second-order density distribution tensor of average
contact shear forces mean stress, (�1 + �2)/2t unit contact tangent vectort deviator stress, (�1 � �2)/2
ui , j displacement gradient tensorug
x , ugy x and y components of displacement of grid point
upx , up
y x and y components of displacement of particlecentroid
V assembly area (or volume)Æ geometrical angle, sinÆ ¼ (d�/2 � d� yy)/(dª/2)� geometrical angle, sin � ¼ (�xx � �yy)/2tª shear strain˜ angle between principal stress and principal strain
increment direction geometrical angle, sin ¼ �d� yy/(dª/2)Ła second-order principal direction of contact normal
anisotropyŁC Mohr–Coulomb angle of shear band from horizontal
directionŁn second-order principal direction of average contact
normal force anisotropyŁR Roscoe angle of shear band from horizontal directionŁs second-order principal direction of average contact
shear force anisotropyŁ0 initial phase angle of position of grid point relative to
particle centroid�p interparticle friction coefficient�ij stress tensor�n normal stress
�1, �2, �3 major, intermediate and minor principal stress�crit critical state plane strain friction angle�ds direct shear friction angle�ps plane strain friction angle�� interparticle friction angleł dilation angleø accumulated particle rotation
REFERENCESArthur, J. R. F., Dunstan, T., Al-Ani, G. A. J. L. & Assadi, A.
(1977). Plastic deformation and failure in granular media.Geotechnique 27, No. 1, 53–74.
ASTM D5321–02. Standard test method for determining the coeffi-cient of soil and geosynthetic or geosynthetic and geosyntheticfriction by the direct shear method. West Conshohocken, PA:ASTM International.
Bagi, K. & Bojtar, I. (2001). Different microstructural strain tensorsfor granular materials. Proc. 4th Int. Conf. on Analysis ofDiscontinuous Deformation, Glasgow, 261–271.
Bathurst, R. J. & Rothenburg, L. (1990). Observation on stress–force–fabric relationships in idealized granular materials. Mech.Mater. 9, No. 1, 65–80.
Cambou, B., Chaze, M. & Dedecker, F. (2000). Change of scale ingranular materials. Eur. J. Mech. A (Solids) 19, No. 6, 999–1014.
Christoffersen, J., Mehrabadi, M. M. & Nemat-Nasser, S. (1981).A micro-mechanical description of granular material behavior.J. Appl. Mech. 48, No. 2, 339–344.
Davis, E. H. (1968). Theories of plasticity and failure of soilmasses. In Soil mechanics, selected topics (ed. I. K. Lee).London: Butterworth, 341–380.
Dedecker, F., Chaze, M., Dubujet, P. & Cambou, B. (2000). Specificfeatures of strain in granular materials. Mech. Cohesive-Frictional Mater. 5, No. 3, 173–193.
Dove, J. E. (1996) Particle-geomembrane interface behavior as
influenced by surface topography. PhD dissertation, GeorgiaInstitute of Technology, USA.
Dove, J. E. & Jarrett, J. B. (2002). Behavior of dilative sandinterface in a geotribology framework. J. Geotech. Geoenviron.Engng 128, No. 1, 25–37.
Dove, J. E., Bents, D. D., Wang, J. & Gao, B. (2006). Particle-scalesurface interactions of non-dilative interface systems. Geotextilesand Geomembranes 24, No. 3, 156–168.
Gutierrez, M. & Ishihara, K. (2000). Non-coaxiality and energydissipation in granular materials. Soils Found. 40, No. 2, 49–59.
Gutierrez, M., Ishihara, K. & Towhata, I. (1993). Flow theory forsand during rotation of principal stress direction. Soils Found.31, No. 4, 121–132.
Hvorslev, M. J. (1960). Physical components of the shear strengthof saturated clays. Proceedings of the research conference onshear strength of cohesive soils, Boulder, pp. 437–501.
Jewell, R. A. & Wroth, C. P. (1987). Direct shear tests onreinforced sand. Geotechnique 37, No. 1, 53–68.
Lings, M. L. & Dietz, M. S. (2004). An improved direct shearapparatus for sand. Geotechnique 54, No. 4, 245–256.
Miura, K., Miura, S. & Toki, S. (1986). Deformation behavior ofanisotropic sand under principal axes rotation. Soils Found. 26,No. 1, 36–52.
Morgenstern, N. R. & Tchalenko, J. S. (1967). Microscopic struc-ture in kaolin subjected to direct shear. Geotechnique 17, No. 4,309–328.
Niiseki, S. (2001). Formulation of Rowe’s stress–dilatancy equationbased on plane of maximum mobilization. In Powders andgrains (ed. Y. Kishino), pp. 213–216. Lisse: Swets & Zeitlinger.
O’Sullivan, C., Bray, J. D. & Li, S. (2003). A new approach forcalculating strain for particulate media. Int. J. Num. Analy.Meth. Geomech. 27, No. 10, 859–877.
Potts, D. M., Dounias, G. T. & Vaughan, P. R. (1987). Finiteelement analysis of the direct shear box test. Geotechnique 37,No. 1, 11–23.
Rothenburg, L. (1980). Micromechanics of idealized granular sys-tem. PhD dissertation, Carleton University, Ottawa, Ontario,Canada.
Rothenburg, L. & Selvadurai, A. P. S. (1981). A micromechanicaldefinition of the Cauchy stress tensor for particulate media.Proceedings of the international symposium on the mechanicalbehavior of structured media, Ottawa, Part B, pp. 469–486.
Rowe, P. W. (1962). The stress dilatancy relation for static equili-brium of an assembly of particles in contact. Proc. R. Soc.London Ser. A 269, 500–527.
Saada, A. S. & Townsend, F. C. (1981). State of the art: laboratorystrength testing of soils. In Laboratory shear strength of soil,STP 740, pp. 7–77. Philadelphia, PA: ASTM.
Scarpelli, G. & Wood, D. M. (1982). Experimental observations ofshear band patterns in direct shear tests. Proceedings of theIUTAM conference on deformation and failure of granularmaterials, Delft, pp. 472–484.
Skempton, A. W. (1949). Alexandre Collin: a note on hispioneer work in soil mechanics. Geotechnique 1, No. 4, 216–221.
Terzaghi, K. & Peck, R. B. (1948). Soil mechanics in engineeringpractice. New York: Wiley.
Thomas, P. A. (1997). Discontinuous deformation analysis of parti-culate media. PhD thesis, Department of Civil Engineering,University of California, Berkeley.
Wang, J. (2006). Micromechanics of granular media: a fundamentalstudy of interphase systems. PhD dissertation, Virginia Tech,Blacksburg, VA.
Wang, J., Gutierrez, M. S. & Dove, J. E. (2004). Effects of particlerolling resistance on interface shear behavior. Proc. 17th Conf.on Engineering Mechanics, Newark, pp. 56–63.
526 WANG, DOVE AND GUTIERREZ