shared autonomous cars will transform city …
TRANSCRIPT
www.ptvgroup.com
SHARED AUTONOMOUS CARS WILL TRANSFORM CITY
TRANSPORT AND TRAFFIC OPERATIONS:

2
CURRENT CPB PARTNERS

SHARED AUTONOMOUS VEHICLES?
commute
50 Min

real city

real* trips

real* routes

TaxiBotride-sharing
AutoVotcar-sharing
Public TransportHigh-Capacity
SHARED AUTONOMOUS VEHICLES?

all day vs. peak hours
24hrs.peak hrs.
maximum delay
from base case trips
5 minutes
WHAT WE WANTED TO TEST

number of vehicles required to provide the same trips as before:
24hrs.peakhrs.
WHAT WE WANTED TO TEST
+
24hrs.
TaxiBotsRide -sharing
Public transport(high capacity )
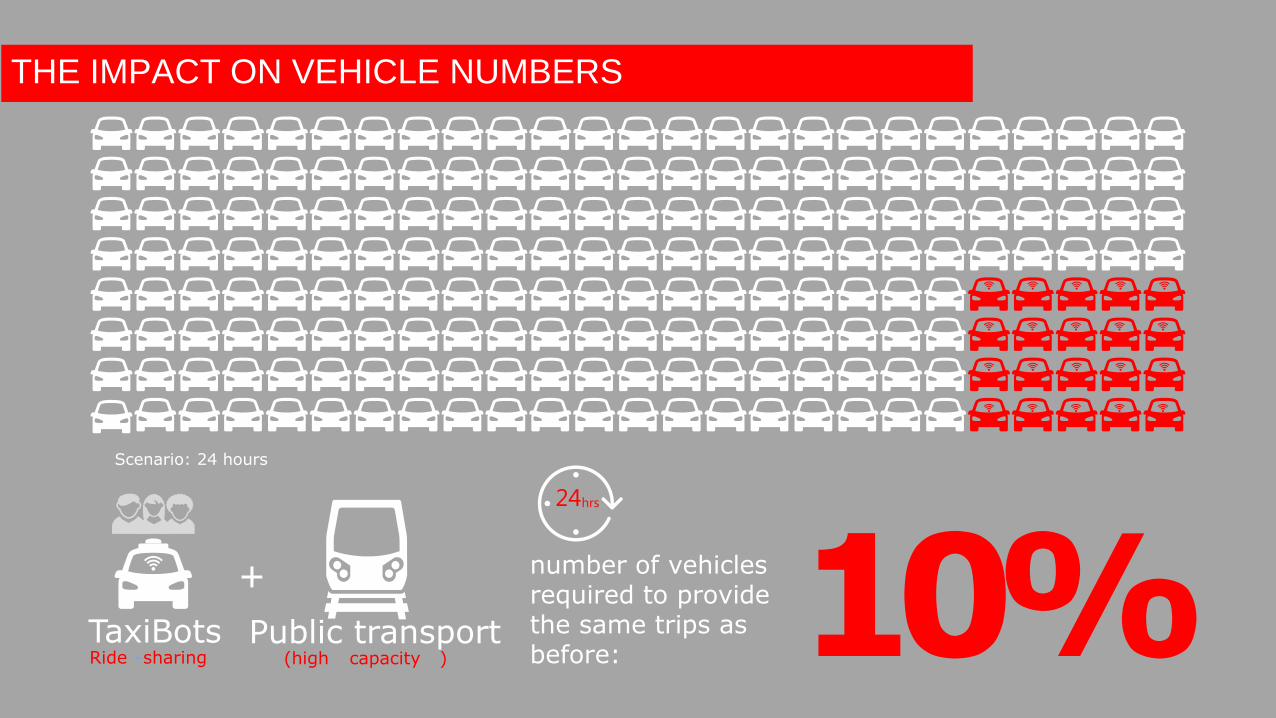
number of vehicles required to provide the same trips as before: 10%
Scenario: 24 hours
+
24hrs.
THE IMPACT ON VEHICLE NUMBERS
TaxiBotsRide -sharing
Public transport(high capacity )

number of vehicles required to provide the same trips as before: 35%+
peakhrs.
THE IMPACT ON VEHICLE NUMBERS
TaxiBotsRide -sharing
Public transport(high capacity )


- 8 0 %
Off Street Parking

In our modelled city a shared self-driving fleet would potentially remove the need for all on-street parking
freeing an area equivalent to 210 football fields
210x
WHAT IT MEANS FOR LAND USE

+ 2 0 %
Kerb to Kerb space


+30% to +90%kilometres travelled
NOT ALL IS GOOD NEWS

a
b
car
*
*b
a
car TaxiBot repositioning
a
b
car AutoVot repositioning
6%- 25 % 44% -103%more kilometres travelled due to bus replacement, pick-
ups,drop-offsandre-positioningmore kilometres travelleddue to replacement, re-
positioning
TaxiBots and AutoVots will
travel more than today’s cars
+ +
IMPACT ON KM TRAVELED

On Demand
8-16 Person Capacity
30 min advance Booking
< 300 m to “pop-up” stop
10 min tolerance for boarding time
CAN WE DO BETTER ?– SHARED ON DEMAND BUS

5 %Scenario: 24 hours
+number of vehicles required to provide the same trips as before:
24hrs.
+
TaxiBusRide -sharing
TaxiBotsRide -sharing
Public transport(high capacity )

+ 230% 8-16 person bus capacity vs 80 person bus capacity
BETTER USE OF CAPACITY
+ 24hrs.+
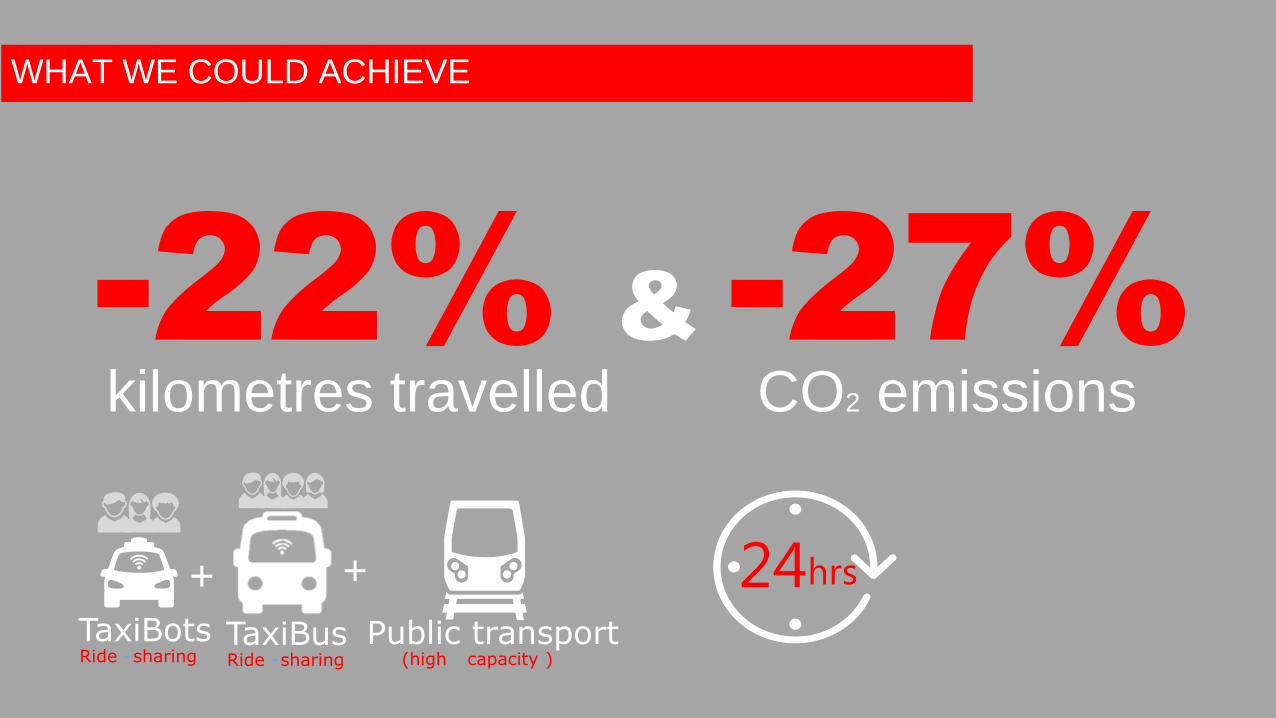
TaxiBusRide -sharing
-22% & -27% kilometres travelled CO2 emissions
WHAT WE COULD ACHIEVE
TaxiBotsRide -sharing
Public transport(high capacity )

Tomorow’s city

2 €
8-10 min
ACCESSIBILITY
1,50 €
5-8 min
1 €
3-5 min

LAND USE AND PUBLIC REALM INFRASTRUCTURE

PUBLIC REALM INFRASTRUCTURE

VEHICLES AN EXTENSION OF THE CITY?

THE ROAD OF TOMMOROW?

SAFETY
Collisions
0 non automated
%SAE
Autonomus driving
levels
1 assisted
2 partial automation
3 conditional automation
4 high automation
15 50 100
100
40
90
10 5 full automated
1-5 mixed & learning curve

OPERATIONAL ISSUES

MODE INTERCHANGE
+ +
+ ++ + +
+ +OR
+

FUTURE MODE SPLIT

URBAN LOGISTICS

HOW DO WE DELIVER THE CARGO

OPERATIONAL SOLUTIONS
P345LJ
8:15-8:30

PP+
New St.
ETA 10:20
$ 6 per hCapacity 80%
+ 5 min $ 2 per h
inc bike rental
New St.
ETA 10:20
$ 6 per hCapacity 95%
SPACE
143
Allocated
ETA –
1min
New St.
ETA 10:19
.
37
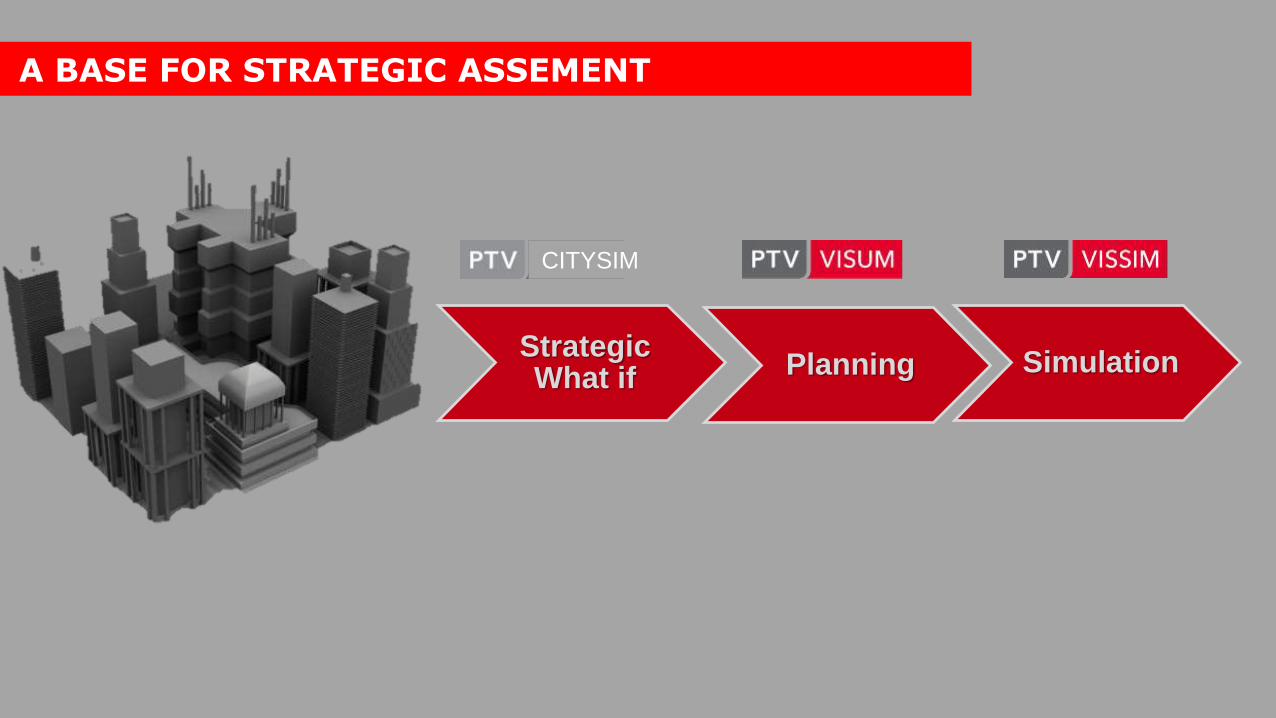
A BASE FOR STRATEGIC ASSEMENT
CITYSIM
Strategic What if Planning Simulation

EXAMPLE 1: CAV AT SIMPLE URBAN INTERSECTION

EXAMPLE: C2X OPTIMUM SIGNALS

www.vision-traffic.ptvgroup.com