shale gas treatment challenges and requirements gas treatment challenges and requirements . ... uop...
TRANSCRIPT

© 2013 UOP LLC. All rights reserved.
Hanbing Ding
13th U.S.-China Oil & Gas Industry Forum September 25, 2013 Xi’an, China
Shale Gas Treatment Challenges and Requirements

Honeywell’s Businesses $37.6 billion in revenues in 2012, 50% outside of U.S. Nearly 122,000 employees operating in 100 countries 19,000 engineers and scientists A Fortune 100 company with Morristown, NJ global corporate headquarters
Aerospace Automation &
Control Solutions
Performance Materials &
Technologies Transportation
Systems
UOP 6084A-2 2

UOP Offers to the Oil and Gas Industry Upstream Midstream Downstream
Exploring for, drilling for and producing crude oil
and natural gas
Processing, storage and transportation
Refining and converting oil / gas into end products such as
fuels and chemicals
UOP technology, materials and services
enable natural gas resource development
UOP processing technology,
equipment, materials and services
3
Shale Resource Processing Challenges
4

Gas Value Chain Challenges • Supply diversification
– LNG, biogas, shale gas, tight gas, SNG, CBM, and conventional gas vary in quality and composition
– Unconventional gas quality in China will most certainly vary between and within fields
• Demand diversification – Pipeline network delivers to customers with varying needs – Stranded gas brings additional challenges
• Agile and flexible solutions required
5

Lessons from U.S. Shale Gas Variability
Well C1 C2 C3 CO2 N2
1 80.3 8.1 2.3 1.4 7.9 2 81.2 11.8 5.2 0.3 1.5 3 91.8 4.4 0.4 2.3 1.1 4 93.7 2.6 0.0 2.7 1.0
Well C1 C2 C3 CO2 N2
1 79.4 16.1 4.0 0.1 0.4 2 82.1 14.0 3.5 0.1 0.3 3 83.8 12.0 3.0 0.9 0.3 4 95.5 3.0 1.0 0.3 0.2
Barnett Shale Gas Composition Marcellus Shale Gas Composition
Well C1 C2 C3 CO2
1 87.7 1.7 2.5 8.1 2 88.0 0.8 0.8 10.4 3 91.0 1.0 0.6 7.4 4 92.8 1.0 0.6 5.6
Well C1 C2 C3 CO2 N2
1 27.5 3.5 1.0 3.0 65.0 2 57.3 4.9 1.9 0.0 35.9 3 77.5 4.0 0.9 3.3 14.3 4 85.6 4.3 0.4 9.0 0.7
New Albany Shale Gas Composition Antrim Shale Gas Composition
“Microbial production and modification of gases in sedimentary basins: A geochemical case study from a Devonian shale gas play”, AAPG Bulletin, Vol 87, No. 8 (August 2003)
“Oil and gas geochemistry and petroleum systems of the Fort Worth basin”, AAPG Bulletin, Vol. 91, No. 4 (April 2007)
“Compositional variety complicates processing plans for US shale gas”, Oil & Gas Journal, March 9, 2009
“Identification of microbial and thermogenic gas components from Upper Devonian black shale cores, Illinois and Michigan basins”, AAPG Bulletin, Vol 92, No. 3 (March 2003)
6 Variations in C2, C3, CO2, Nitrogen, and Other Components
in Shale Gas Impact Interchangeability with Other Gas Supplies 6

-20%
0%
20%
40%
60%
80%
100%
120%
140%
160%
180%
$80 WTI $70 WTI $60 WTI
US High Rates of Return in Liquids-Rich Plays Driving Activity
DRY WET
Liquid rich field plays are forecasted to generate over 75% of incremental gas in USA (+4 TCF) over next 6 years
Rat
e of
Ret
urn
GPM 4-9 4-9 4-7 8-13 4-9 3-9 4-9 3-9 1-2 1-2 1-2 <1 <1
All Wet US Gas Plays Drive >20% Return at Current Prices
DRY
HH Dry Gas Price = $3.00/MMBTU NGL Price = 40% WTI
7

Gas Plant Development: Decision Criteria
Contaminants
By-Products Products Opp. Efficiency Consumption Disposal
Acid Gases: CO2, H2S, Mercaptan, COS Other: Mercury, Arsenic, Nitrogen, Water
Availability Flexibility
Energy Chemicals Labor
Air Water Subsurface
Methane Ethane Propane Butanes C5
+ condensate Oil
Sales gas / LNG NGL’s Spec products C5
+ condensate
Upstream Factors
Downstream Factors
Plant Configuration & Design Decisions: Gas Processing Functional Blocks
Compression Acid Gas Removal
Sour Gas Removal
Hydrocarbon Management Dehydration
Other Contaminant
Removal Utilities & Disposal
HC Distribution
Production Profile
Pressure, Flow
Ambient Conditions
Offshore/ Onshore
Environmental Constraints
Fiscal Regime
Midstream Factors
UOP 6084B-8 8 Many Factors Impact Selection of Gas Processing Technologies 8

Integrated Solutions Offer Operating & Investment Flexibility
Decision Tree Logic Summary
1) Select the proper technology within each separate gas processing block
2) Account for interactions across the different processing blocks
3) Adjust sequence of processing blocks for overall system optimization
9

No One Size Fits All Solution for Acid Gas Removal
Acid Gas Removal Technologies
Partial Pressure Acid Gas in Product, psia
Parti
al Pr
essu
re A
cid G
as in
Fee
d, p
sia
Amine Process
Membrane Systems
Physical Solvent Process
Molecular Sieves
10

Maximize value of gas projects with speed of implementation Monetize methane and natural gas liquids
Imperatives
1
2
11

QUICKLY Monetize the Widest Possible Range of Natural Gas Compositions at The Lowest Installed Cost
Rapid NGL Recovery is Paramount
Procurement Begins at Order Date
Flexibility in Feed Composition
Reduced Engineering
Subvendor Delivery Optimization
Reduced Field Construction
In-Parallel Field Skid Construction
Skid Mounted Mobility
12
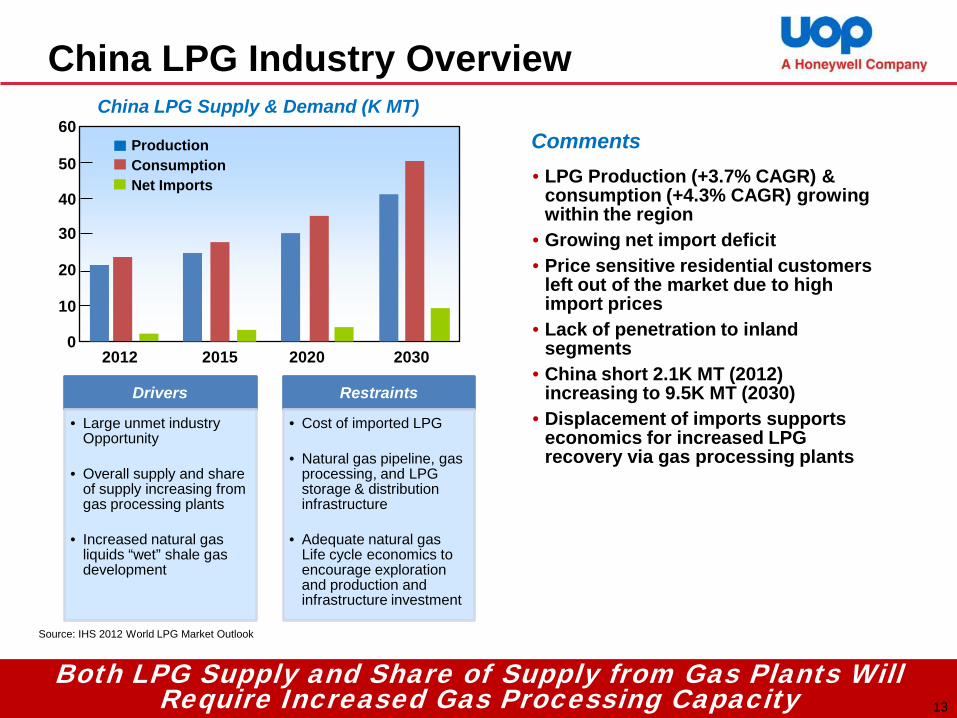
Both LPG Supply and Share of Supply from Gas Plants Will Require Increased Gas Processing Capacity
China LPG Industry Overview
Drivers
• Large unmet industry Opportunity
• Overall supply and share of supply increasing from gas processing plants
• Increased natural gas liquids “wet” shale gas development
Restraints
• Cost of imported LPG
• Natural gas pipeline, gas processing, and LPG storage & distribution infrastructure
• Adequate natural gas Life cycle economics to encourage exploration and production and infrastructure investment
Source: IHS 2012 World LPG Market Outlook
• LPG Production (+3.7% CAGR) & consumption (+4.3% CAGR) growing within the region
• Growing net import deficit • Price sensitive residential customers
left out of the market due to high import prices
• Lack of penetration to inland segments
• China short 2.1K MT (2012) increasing to 9.5K MT (2030)
• Displacement of imports supports economics for increased LPG recovery via gas processing plants
Comments China LPG Supply & Demand (K MT)
2012 2015 2020 2030
60
50
40
30
20
10
0
Production Consumption Net Imports
13

• Typical example of revenue associated with NGL recovery • 200 MMSCFD of 3 GPM gas (~1,100 BTU/SCF) • Monthly revenue: 5.8 MM$
Methane
Ethane
Propane
n-Butane
i-Butane
Natural Gasoline
Shale Gas
200 million cubic feet per day
(MMcf/d)
Barrel Comp
67%
15%
4%
5%
9%
Example Price
Basis1
Fuel Value
Fuel Value
$950 MT
$950 MT
$700 MT
$950 MT
Value over fuel $M/month
$0.0
$0.0
$1.2
$1.5
$2.5
$4.3
1. Average fuel gas value $9/mmbtu
Amount Generated Monthly
$9.5MM
UOP Modular Plants – Delivered Faster, Adding Value, No Schedule impact
Rapid NGL Recovery Improves Return on Investment
@ 3
GP
M N
GL’
s
14

Rapid Gas Value Possible
Modular Design
Modular Pre-Engineered Plants
Speed to Gas Your Plant Installed in 19 Weeks
15

Factory Built and Ready for Installation
UOP Cryogenic Plant Skids
16

Plant Case Study:
Marcellus Basin
Scenario: A natural gas processing company was concerned that it was unable to service existing customers and capture future opportunities in the Marcellus, a rapidly expanding geographical area. The company did not have enough processing capacity, and the lead time for a custom facility was too long. UOP solution: With a modular, pre-engineered design, a Honeywell UOP Russell cryogenic plant could be delivered in half the time of a custom plant. Results: As a result, the natural gas processing company completed the project on time and within budget. This allowed for the rapid capture of future business opportunities by expanding to multiple trains for processing and fractionation. The customer improved their returns by an estimated $2-5 million for every additional day that each train of their plant was up and running
17

Nat Gas Conditioning
Dehydration • Mol Sieve Adsorption • Glycol (TEG, DEG) Absorption
Acid Gas Treatment • Amine Units (100-1000 gpm1) • Membrane Units (1+ BCFD) Sulfur Recovery • Modular Claus (10-100+ LTPD) • Sulfur Scavengers Hg Removal Units
Rich Gas Conditioner
Fractionation Deethanizer / Depropanizer / Debutanizer
1gpm = gallons of amine per minute
SEG
MEN
T NGL Recovery NGL Upgrading
GAS
NG
L C
ON
TEN
T (G
PM2 )
Mechanical Refrigeration
Cryogenic Turboexpander
UOP Equipment Lines O
FFER
ING
DeEnthanizer DePropanizer DeButanizer Butane Splitter
Natural Gasoline
I-Butanes
N-Butanes
Mix-Butanes
Propane Purity Ethane
Y-GR
ADE
OR R
AW M
IX
2GPM = gallons of NGL per thousand scf of natural gas
9
6
4
3
2
UOP 6084C-18 Complete Modular Equipment Solution 18

Methane and NGL Monetization Options
Methane
Deet
hani
zer
Depr
opan
izer
Debu
tani
zer
Ethane
Propane
Butane
Natural Gasoline
Shale Gas
Dem
etha
nize
r
2
Gas Field
Upgrade to Higher Value Products 19

Upgrade Methane to Transportation Fuel
Component Mol% (typical)
Methane (C1) 85-95%
Ethane (C2) 5-10%
Propane (C3) 2-5%
Butane+ (C4+) 2-3%
Carbon Dioxide (CO2) 1-4%
Trace Components H2S, Hg, R-SH, COS
Pipeline Feed (gas inlet) Typical Gas Specification
Component Mol % (max)
Methane (C1) >95%
Ethane (C2) <6-8%
Propane (C3) <3%
Butane 1ppmv
Carbon Dioxide (CO2) 50ppm
Pentane & Heavier <0.1mol%
Heating Value
•1050 btu/scf (Europe & US) •1140 btu/scf
(Asia, max)
LNG Product Specifications
LNG Feedstock Gas Pretreatment
& Liquefaction
Small Scale LNG as Virtual Pipeline and as Substitute for Diesel…After Pretreatment
20

Upgrade Methane to Olefins
• Methanol-to-Olefins (MTO) is now a reality in China • >20 MTO projects in various stages of D&C • UOP’s work in MTO dates back to 1980’s • UOP has 4 UOP licensed plants in China • First UOP Advanced MTO Process Unit to s/u in 2013
MTO Ethylene & Propylene ($1300/MT)
Natural Gas – $3-6/MMBtu ($140-240/MT)
Synthesis Gas
Production
Methanol Synthesis
Coal ($25-100/MT)
Picture of UOP Advanced MTO Process at Wilson Clean Energy 21

0
20
40
60
80
100
120
140
2001 2006 2011 2016 2021
Supply from Refinery FCCsSupply from Steam CrackersDemand (Polymer/Chemical Gr.)
“Propylene Gap” is growing – Propylene demand growing at ~4%
CAGR – Crackers shifting to lighter
feedstocks, with less propylene – “On-Purpose Propylene” to fill the
gap; MTO and PDH
“Propylene Gap”
Data Source: IHS Chemical
Propylene Supply / Demand (MMTPA)
Global Propylene Gap PDH - Propane Dehydro
Monetize Propane to Propylene
C3
Hydrogen
C3=
“Single Feed – Single Product” enables simple project execution Excellent forward or back integration 14 operating PDH plants world-wide
(9 utilize UOP’s Oleflex Process) New unit activity focused in China
and North America UOP has 16 PDH awards since 2011
UOP OleflexTM Process
$500/MT – $800/MT
$1300/MT
Oleflex™ - A Key Technology for Filling Propylene Gap 22

Alternate Products ETBE HPIB MMA Isoprene
Fresh Methanol
Net Gas
MTBE
C4 LPG
C5+
DIB Column
ButamerTM Unit
DeC3 Column
C3-
EthermaxTM Unit
CSP ORU
Oleflex Unit
nC4 → iC4
iC4 → iC4=
Monetize Butanes to Fuels & Petrochemicals
6 Commissioned MTBE Complexes with UOP Oleflex Process 7 New C4 Oleflex Awards since 2011
4 mixed C3/C4 Oleflex Units – “Best of Both Worlds”
$800- 900/MT
$375/MT
$1150/MT
23

Hanbing Ding,Sr. Sales Leader O: +86 10 8432 3928 M: +86 186 1833 6085 F: +86 10 6437 6616 E: [email protected] Victor Wen, Sr. Sales Manager O: +86 10 8432 3982 M: +86 139 1172 6957 F: +86 10 6437 6616 E: [email protected]
UOP Contacts in China
Thank You!
24